

Abstract
A mathematical relationship is derived for relating the enantiomeric ratios (er values) of two individual stereocenters within a single chiral molecule to the diastereomeric ratio (dr). Whereas the er (or enantiomeric excess, ee) of chiral molecules is readily determined by chiral chromatography and dr values can be determined by chromatography or NMR, modern methods for the optical determination of er values at individual functional groups do not normally determine the er and dr of the entire molecule. We find there is only a special circumstance when knowledge of the er of two individual stereocenters can be used to predict the er of the enantiomers in each diastereomeric set, along with the dr of the stereoisomers. Under circumstances where this relationship fails, one will require a dr assay in addition to two individual er assays to fully characterize the stereochemical parameters of a reaction. Thus, with these circumstances in mind, we give mathematical relationships for determining complete stereoisomer speciation having the knowledge of individual stereocenter er values and a dr value.
Graphical Abstract
In most cases, when n stereocenters exist in a molecule, there are 2n possible stereoisomers. Of course, meso structures can exist or there can be geometrical restrictions that make certain stereoisomers inaccessible, and in both cases, the number of possible stereoisomers will be reduced from 2n. The classic example taught in introductory organic chemistry class is the case of two stereocenters, resulting in two sets of diastereomers consisting of two enantiomers in each set, as shown below for an arbitrary amino alcohol with two stereocenters.1 For a transformation that forges two stereocenters, where there are four possible stereoisomers, the diastereomeric ratio (dr) can be readily determined by integration of resolved resonances in NMR spectra or via standard chromatographic techniques,2,3 and the enantiomeric ratio (er) (or enantiomeric excess, ee) within each set of diastereomers can be determined via chiral chromatography, with chiral HPLC being the method of choice when small numbers of samples are to be tested.3
When large numbers of samples (i.e., 100s to 1000s) are to be analyzed, high-throughput parallel optical techniques are a viable alternative to serial chromatography. A number of circular dichroism (CD), fluorescence, and colorimetric assays have been developed for determining ee values of chiral compounds with a single stereocenter.4 These methods target individual specific functional groups within the chiral molecule, and when more than one stereocenter exists the methods do not determine the er of the entire molecule within each diastereomeric set—only the er of their specific functional group within all four isomers. For example, for the stereoisomers shown in Scheme 1, an assay that distinguishes the alcohol stereocenter as being R or S (and the er at that single center) would not distinguish between the threo and erythro stereoisomers and likewise for an assay that targets the amine stereocenter. In other words, the current optical methods do not distinguish the substrates that are epimeric at the position vicinal to the targeted stereocenter, i.e., R,S and R,R nor S,R and S,S, and nor do they determine a dr value. Thus, one cannot determine the complete speciation of all four stereoisomers.
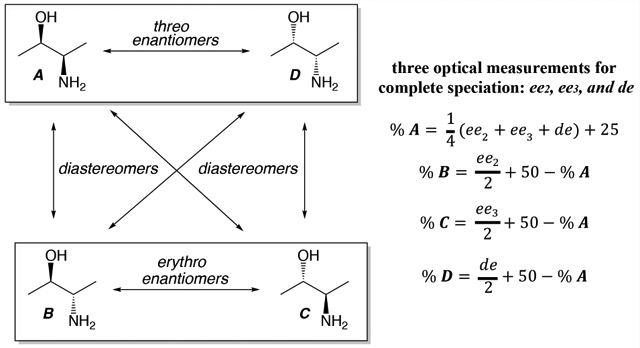
Scheme 1. Example of Four Sets of Stereoisomers Created When Two Stereocenters Are Presenta.

aSpecifically, two enantiomeric sets (B and C, A and D) of diastereomers. Diastereomers A and D are referred to herein as threo, while B and C are erythro.
However, it seemed intuitive to us that there would be a mathematical relationship between the er (or ee) values at the two individual stereocenters, the er values of the entire molecule for each diastereomeric set, and the dr value. Thus, we set out to solve for such a relationship, which is of fundamental importance in the field of stereochemistry but does not appear to have yet been reported. This is likely because prior to the advent of methods that report individual stereocenter er values within multi-stereoisomer containing molecules one did not need to relate these values to dr and associated er values within each diastereomeric set.
In an attempt to derive this relationship, we found that only under a special circumstance does knowledge of the er values at individual stereocenters supply enough information to determine the er values within each diastereomeric set, as well as the dr value. This relationship is when the product of the concentrations of the enantiomers of the erythro diastereomeric set equals the product of the concentrations of the enantiomers of the threo diastereomeric set (i.e., [B][C] = [A][D]). We show this with a derivation below and via scatter plots of how inaccurate the values would be when relying solely on individual stereocenter er values. For all other concentrations of A, B, C, and D, the dr values cannot be determined. Thus, one needs a separate assay for dr to be able to solve for the distribution (speciation) of all four stereoisomers created when two stereocenters exist. To complete our analysis, we therefore also give the equations that allow for this speciation when a dr value has been determined. It is important to note that this analysis is relevant to both reactions that set two stereocenters as well as reactions that set a stereocenter in a molecule with a stereocenter that was set prior to the transformation. In the latter case, however, if the handedness at the unchanged stereocenter is known, the handedness at the newly set stereocenter would be determined by knowing the dr.
DERIVATION OF THE SPECIAL CIRCUMSTANCE
We start by defining the enantiomeric ratio as R relative to S (eq 1) for the alcohol (er2) and amine (er3) stereocenters in the manner that current optical methods would measure them (eqs 2 and 3, respectively) and the dr as threo over erythro (eq 4). These are not traditional er definitions, where the er is normally defined for the entire molecule within both the threo and erythro diasteromeric sets, i.e., separate er’s for RR/SS and RS/SR. Instead, these er’s are definitions of separate single stereocenters within all four stereoisomers.
These definitions of er values have a ramification on experimental assay design. If the stereocenters are widely separated from one another, such as with the molecule below, then the signals for the assays at the separate centers are likely not perturbed by the remote stereocenter.
For example, R-alcohols would likely give the same signal irrespective of whether the amine is R or S, and the same for the amine assays. If the second stereocenter does affect the optical signals of the assays of the stereocenter under investigation, the ability to accurately determine values for each individual stereocenter would be compromised. Thus, speciation of a four-component stereoisomeric mixture will be further complicated, albeit this does not affect the mathematical analysis given here.

We proceed to establish dr as a function of er2 and er3, giving us a possible method of directly calculating dr. Here A, B, C, and D represent the concentrations of all four structures (Scheme 1), i.e., the total speciation we are seeking:
| (1) |
| (2) |
| (3) |
| (4) |
Let us also observe that
| (5) |
In order to establish a relationship between dr, er2, and er3, we use an algebraic manipulation involving a fractional expression, i.e., ((er2 × er3) + 1)/(er2 + er3) and evaluate it by substituting the definitions from eqs 2 and 3 and multiplying the terms out to obtain
| (6a) |
| (6b) |
| (6c) |
Expression 6a was developed by trial and error until a fraction was found that allowed a correlation of the er values with dr. We multiply the final expression shown above by (shown in eq 5) using the property of the multiplicative identity to keep the value the same. We then expand the first two expressions in both the numerator and the denominator to find like terms:
| (7) |
Now, we find a common sum and define the variable Z = (A2C + AC2 + C2D + CD2 + A2B + AB2 + B2D + BD2), which corresponds with the first eight terms in both the numerator and the denominator of the of eq 7. Hence, we can substitute in Z and rewrite the above as
| (8) |
We now see that the portion of expression in eq 8 put into brackets on the right corresponds exactly with our definition of dr as shown in eq 4. Thus, we can also pull out the like terms in the latter halves of the numerator and denominator (2BC and 2AD, respectively) and simplify the expression as follows:
| (9a) |
| (9b) |
It is evident that the only terms that differ in this fraction are BC and AD. Let us assume that BC = AD = X and substitute this value into the equation, as we did when evaluating eq 6c to get eq 8. Then
| (10a) |
| (10b) |
So, with our above assumption, we have explicitly shown that eq 6a equals dr:
Therefore, we have shown that only if BC = AD (for which there are an infinite number of solutions) can we directly calculate dr from a function of er2 and er3 (eq 6a). The more detailed derivation is provided in the Supporting Information.
SIGNIFICANCE OF THE SPECIAL CIRCUMSTANCE
We have shown that there is a special circumstance under which the knowledge of er values of individual stereocenters can be used to determine a dr value. As stated above, if [B][C] = [A][D], the dr can be calculated from two individual er values using eq 6a; however, the relationship between the two er values and dr value deviates from the true value when the product of the enantiomeric pair of each diastereomer is not equal.
This observation led us to investigate the significance of the derived special circumstance on two fronts. For one, we were interested in whether common synthetic scenarios led to this special circumstance. Furthermore, we were interested in how inaccurate the calculated dr values would be if the special circumstance was not satisfied. If the values were not particularly inaccurate, then the separate stereocenter er assays could find wider utility. With regard to the first front, a literature search of asymmetric transformations that create vicinal stereocenters revealed, as may be anticipated, that it is uncommon that this special circumstance is satisfied.5–7
In order to investigate the deviation of the calculated dr values from the true dr values, 5000 randomly generated percent compositions of the four stereoisomers (Scheme 1) were created. These percent compositions were used to calculate er2, er3, and the true dr value. The generated er values were then used to calculate a dr value using eq 6. Three-dimensional scatter plots of the two er values and the difference between the true dr value and the calculated dr value (drcalc, z-axis) were generated for visualization purposes (Figure 1). As can be seen from these plots, in a few rare cases, very large errors in dr will be generated (over 2000% error, Figure 1A), whereas most of the errors cluster below 100% (albeit, still a large error, Figure 1B). Finally, roughly 18% of the randomly generated samples had errors of 10% or below, which is really not so bad. From these 875 data points, it can be generalized that the drcalc value will be most accurate from two er values when one or either of the er values is close to zero; i.e., the drcalc value is closest to dractual, i.e., when the reaction under consideration is very poorly stereoselective. In general, such reactions are not sought after, and thus the special circumstance will not find wide utility when er2 and er3 are determined by optical assays.
Figure 1.

(A) Three-dimensional scatterplot of the generated er2 and er3 values (x- and y-axis, respectively) and the deviation of the calculated dr with the actual dr value using eq 6a. (B) Three-dimensional scatterplot of the generated er2 and er3 values (x- and y-axis, respectively) and the deviation of the calculated dr with the actual dr value using eq 6b blown up to show the percent difference of derived dr values to actual dr values that are less than 100%. (C) Three-dimensional scatterplot of the generated er2 and er3 values (x- and y-axis, respectively) and the deviation of the calculated dr with the actual dr value using eq 6c blown up to show the percent difference of derived dr values to actual dr values that are less than 10%. The purple data points represent percent compositions that do not satisfy the special circumstance, whereas the cyan data points represent percent compositions that satisfy the special circumstance. Note that the cyan points lie in the x,y plane, meaning the calculated dr matches the real dr (zero percent error).
COMPLETE SPECIATION
We now turn to an analysis of how to accomplish a complete speciation of all four stereoisomers if the enantiomeric excess at the two separate stereocenters and the diastereomeric excess (de) is known. In this analysis, we switch to ee and de values rather that er and dr values because the mathematic expressions, in this case, are simpler. Of course, once er and dr are known, they are readily converted to ee and de (or vice versa).
We begin by defining the total composition of a mixture of four stereoisomers with eq 11. Next, we define the ee as the enrichment of R relative to S (eqs 12c and 13c) and the de as erythro relative to threo (eq 14c), where the values can range from −100 to 100% (i.e., negative numbers can result). Thus, we have four equations to solve for the four unknowns.
| (11) |
| (12a) |
| (12b) |
| (12c) |
| (13a) |
| (13b) |
| (13c) |
| (14a) |
| (14b) |
| (14c) |
With the four equations in hand, substitutions can be made, and we express the components B, C, and D in terms of A (eqs 15–17).
| (15) |
| (16) |
| (17) |
Using the mass balance in terms of percent composition (eq 11) and substituting eqs 15–17 for B, C, and D, respectively, we arrive at eq 18. By combining like terms and expressing A in terms of ee2, ee3, and de, we can now determine the concentration of A; further, eqs 15–17 can be used to determine the complete speciation.
| (18) |
Thus, we have shown that a four component stereoisomeric mixture can be fully characterized from readily measurable experimental parameters (ee2, ee3, and de values). A full more detailed derivation is provided in the Supporting Information.
CONCLUSION
Modern optical methods for measuring ee values target individual stereocenters, and thus, when more than one stereocenter exists in a molecule these values do not report the diastereomeric ratios or enantiomeric excesses within the diastereomers. Thus, we set out to derive mathematical expressions for relating the enantiomeric ratios (er values) of individual stereocenters within a single chiral molecule to the diastereomeric ratio (dr). We found that only when the product of the concentrations of the erythro enantiomers and the product of the concentrations of the threo enantiomers are the same, then knowledge of the er of the individual stereocenters can be used to predict the er of each diastereomeric set, along with the dr of the stereoisomers. Under circumstances where this relationship fails, a dr assay in addition to the individual er assays will be needed to fully characterize the stereochemical parameters of a reaction. Thus, with these circumstances in mind, we derived mathematical relationships for determining complete stereoisomer speciation having the knowledge of individual stereocenter er values and a dr value.
Supplementary Material
ACKNOWLEDGMENTS
We gratefully acknowledge financial support for this work from the National Institutes of Health (R01-GM077437) as well as the Welch Regents Chair to E.V.A. (F-0045). Further, we thank Dr. Bart Kahr (NYU) for helpful discussions and critiques.
Footnotes
Supporting Information
The Supporting Information is available free of charge on the ACS Publications website at DOI: 10.1021/acs.joc.9b00447.
Complete derivations for the mathematical relationships relating er values at individual stereocenters to a global dr value and total speciation of a scalemic mixture of stereoisomers; three-dimensional scatter plots are included for the mathematical relationship relating er values at individual stereocenters and the error in the calculated dr value for visualization purposes (PDF)
The authors declare no competing financial interest.
REFERENCES
- (1).Brown HW; Iverson BL; Anslyn EV; Foote CS Organic Chemistry, 8th ed.; Cengage Learning, 2018. [Google Scholar]
- (2).Allinger NL, Eliel EL, Eds. Topics in Stereochemistry; Interscience, 1967; Vol. 1, 254 pp. [Google Scholar]
- (3).Welch CJ Microscale chiral HPLC in support of pharmaceutical process research. Chirality 2009, 21 (1), 114–118. [DOI] [PubMed] [Google Scholar]
- (4).Herrera BT; Pilicer SL; Anslyn EV; Joyce LA; Wolf C Optical Analysis of Reaction Yield and Enantiomeric Excess: A New Paradigm Ready for Prime Time. J. Am. Chem. Soc 2018, 140 (33), 10385–10401. [DOI] [PubMed] [Google Scholar]
- (5).Li K; Shao X; Tseng L; Malcolmson SJ 2-Azadienes as Reagents for Preparing Chiral Amines: Synthesis of 1,2-Amino Tertiary Alcohols by Cu-Catalyzed Enantioselective Reductive Couplings with Ketones. J. Am. Chem. Soc 2018, 140 (2), 598–601. [DOI] [PMC free article] [PubMed] [Google Scholar]
- (6).Tian X; Cassani C; Liu Y; Moran A; Urakawa A; Galzerano P; Arceo E; Melchiorre P Diastereodivergent Asymmetric Sulfa-Michael Additions of α-Branched Enones using a Single Chiral Organic Catalyst. J. Am. Chem. Soc 2011, 133 (44), 17934–17941. [DOI] [PubMed] [Google Scholar]
- (7).Piasecki SK; Taylor CA; Detelich JF; Liu J; Zheng J; Komsoukaniants A; Siegel DR; Keatinge-Clay AT Employing Modular Polyketide Synthase Ketoreductases as Biocatalysts in the Preparative Chemoenzymatic Syntheses of Diketide Chiral Building Blocks. Chem. Biol 2011, 18 (10), 1331–1340. [DOI] [PubMed] [Google Scholar]
Associated Data
This section collects any data citations, data availability statements, or supplementary materials included in this article.