

Abstract

Ethanol and oxygen containing gases are mixed in a T-junction at elevated pressure and then passed into a fused silica microcapillary, located in a heating block. Inside the microcapillary a Taylor flow of alternating liquid and vapor segments is formed. The thermodynamic equilibrium composition of the liquid and vapor segment depends on pressure and temperature. Their compositions are measured inside the microcapillary using in situ Raman spectroscopy. The main results obtained therefrom are temperature–composition (Tx) diagrams at conditions relevant for combustion engines [p = (3 to 8) MPa; T = (303 to 473) K]. Isothermal vapor–liquid equilibria (VLE) data are derived and given in pressure–composition (px) diagrams. The investigation of different gas mixtures containing oxygen and nitrogen allows furthermore the illustration of VLE data at constant pressure and temperature in ternary diagrams. The obtained results are compared to scarce literature data. An equation of state (Peng–Robinson EOS) is furthermore adjusted to the measured results.
1. Introduction
Mixtures of ethanol and atmospheric gases are nowadays still the object of research for a variety of reasons. Because of the ongoing efforts in the field of combustion engine technology, regarding the use of renewable fuels and further process optimization, the knowledge of the phase behavior between fuel and oxidizer is crucial. Phase diagrams that relate temperature and pressure to the equilibrium composition (Tx- and px-diagrams) can hereby play a vital role for the understanding of the mixing and compression steps inside the combustion chamber. In diesel-style engines for instance, the exact mixing path between the injected fuel and the oxidizer is currently discussed by numerous research groups.1−5 However, this discussion is based on the precise knowledge of vapor–liquid equilibria (VLE) at compression pressure and temperature.
The presented VLE investigation might be furthermore relevant for oxy-fuel processes, through which fuels are combusted with pure oxygen in the presence of recirculated flue gas.6,7
Another aspect of research interest lies in the utilization of alcohols as a reagent to produce basic and fine chemicals via oxidation. Since to date, environmentally unfriendly oxidants are still used for that,8 processes such as the catalytic aerobic oxidation of alcohols using atmospheric oxygen have attracted attention in recent years.9−11 Precise solubility data at high pressure can provide necessary information to optimize these processes on the way to further implementation.
The acquisition of these Tx and px data, however, can be a challenging task.12 One main reason for that is the invasiveness of most applied analytical methods to measure phase compositions, since any intervention can affect the thermodynamic equilibrium. This would change the result of the experiment at the set point.13,14 The investigation of mixtures such as ethanol and oxygen is furthermore dangerous due to the risk of ignition. Many researchers therefore carry out experiments only with the use of nitrogen, which shows lower solubility in ethanol than oxygen and might decrease the utilization of the data on real processes.15,16
In the experiments presented in this manuscript, in situ Raman spectroscopy is applied to avoid the problem of thermodynamic affection. In combination with the use of microcapillaries the experimental time and the sample volume are significantly lower compared to investigations in high pressure cells.17 Most importantly, the danger that an ignition would cause is minimized down to an acceptable effect with the setup described in following section. The VLE of ethanol and oxygen, as well as of ethanol and two oxygen/nitrogen mixtures, were studied. This was done, to provide ternary VLE data for the full nitrogen/oxygen composition range, following the results of Klima et al.18 for the system ethanol/nitrogen.
2. Materials and Methods
2.1. Materials
The chemicals that are used in this work are listed in Table 1. The fused silica microcapillary (Molex-Polymicro Technologies) has the internal and external diameters of (300 and 800) μm. The capillaries are connected to the steel pipe system outside the heating zone via polymer sleeves and ferrules.
Table 1. Chemicals and Gases Used in This Work.
| chemical | CASRN | supplier | purity |
|---|---|---|---|
| ethanol for spectroscopy | 64-17-5 | Merck KGaA | >99.9%w |
| gas mix 1 (20% O2, 80% N2)a | 7782-44-7/7727-37-9 | Nippon Gas | >99.999%v |
| gas mix 2 (80% O2, 20% N2)a | 7782-44-7/7727-37-9 | Nippon Gas | >99.999%v |
| oxygen | 7782-44-7 | Nippon Gas | >99.999%v |
Volume fractions at 288.15 K and 0.1013 MPa are considered equal to mole fractions.
2.2. Setup
The continuous setup used in the experiments was previously described in detail by Klima et al.18 and is shown in Figure 1. Gas is fed continuously from a vessel via a Bronkhorst mass flow controller into a steel capillary connected to a T-junction. There it is mixed with ethanol, which is fed with a syringe pump (Teledyne ISCO 260D, ± 0.02 MPa) into another steel capillary prior to the mixing section. The pressurized mixture is then passed into the fused silica microcapillary, located in a 300 mm long steel heating block (Tmax = 700 K ± 0.3 K), equipped with five drilled holes on the top and on the bottom for optical access. The temperature along the block is measured by six type-K thermocouples. After passing through the capillary, the mixture flows into a steel pipe that guides it into another, but with a reverse running, syringe pump (Teledyne ISCO 260D).
Figure 1.

Setup overview for the phase-selective measurement of VLE under elevated pressure and temperature.
Using this mode, a constant and pulsation-free flow at high pressure can be achieved. Typical set values for the global mole fraction and frequencies during the two-phase investigations (see VLE experiments), can be found in Table 2. By the independent feeding of gas and ethanol, the global composition can be precisely computed using the volumetric flows of the syringe pump and the mass flow controller. For the case that the global composition lies inside the two-phase regime, depending on system pressure and temperature, a Taylor flow of alternating liquid and vapor segments is formed. The short length of these segments, as well as the high specific phase boundary area between them, provides fast thermodynamic equilibration, and VLE data can be obtained, as shown in the right chart of Figure 2.
Table 2. Global Mole Fraction of Ethanol (xEth, global) and Frequencies (F) of the Taylor Flow during the VLE Experiments (Calibration Measurements Differ from the Given Values).
| xEth, global | F/Hz |
|---|---|
| 0.75 to 0.90 | 3 to 7 |
Figure 2.

(Left) Background subtracted and baseline corrected liquid and vapor phase spectra of the system ethanol and gas mix 2 at T = 373 K and p = 6.5 MPa (all vibrations relevant for analysis are labeled); (right) example Tx diagram (UCMT: upper critical mixture temperature).
The Raman system was kept unchanged from previous work,18 using the same excitation source (Cobolt Samba, 532 nm excitation, and 200 mW in the focal spot), as well as the same probe to detect Stokes-scattered Raman signals. Furthermore, the identical devices for the phase-selective measurement of the liquid and vapor segments were used. This technique is based on a photodetector that sits under the steel block in which the microcapillary is located, utilizing the difference in index of refraction between the liquid and vapor phase. Thereby excitation light is differently refracted inside the microcapillary, and as a consequence light of different intensity is passing through the capillary and the bottom bored hole of the block onto the photodetector. The photodetector is connected to an oscilloscope to visualize the laser flickering, caused by the phases’ diversity in index of refraction. This flickering is directly correlated to the frequency of occurrence of the liquid and vapor segments passing the measuring spot and is used to trigger the photoelectric guard of the fiber switch that is installed between the detection side of the Raman probe and the spectrometer. The photoelectric guard guides the red-shifted Raman signal light of the investigated phase from the Raman probe through one of the two output channels that is connected to the spectrometer. Meanwhile all the other signal light of the corresponding phase is passed into the second of the two output channels, which is dead-ended. For the case of investigating the liquid phase composition of a F = 5 Hz Taylor-Flow for example, the spectrometer accumulates Raman signal within the chosen integration time of 4 s of 20 liquid segments, while all the Raman signal of the 20 vapor phase segments is filtered by the photoelectric guard. For a set of five different pressures [p = (3, 5, 6, 6.5 and 8) MPa] 32 single spectra were taken for both vapor and liquid phases at a range from T = 303 K in steps of ΔT = 10 K up to the mixture’s upper boiling point or upper critical temperature. According to these VLE experiments, calibration measurements were executed beyond these temperatures inside the vapor phase regime and in the single-phase regime above the mixture’s upper critical temperature. Therefore a defined flow of gas and ethanol is set, to correlate set molar ratios to measured signal ratios. A detailed description of the calibration approach regarding conditions and validity is given in section 3.1.
2.3. Data Evaluation
The left chart of Figure 2 shows the Raman spectra of the liquid and the vapor phase coexisting in thermodynamic equilibrium at T = 373 K and p = 6.5 MPa when at the T-junction pure ethanol is mixed with the gas mix 2 (compare Table 1). The right chart of Figure 2 shows an example of a Tx diagram that can be obtained from the spectral data given in the left chart. Because of the solubility of oxygen and nitrogen in the ethanol-rich liquid phase and due to the vapor pressure of ethanol, features of each component can be found in the Raman spectra of both phases. As expected, the N2- and O2-stretch vibrations show higher intensities in the vapor phase spectrum, compared to the equivalent peaks in the liquid phase. To compute the necessary signal ratios and to link them to the molar ratios by calibration, the raw spectral data have to be processed in several steps. Besides a background subtraction and a baseline correction, spectral regions where signals of different substances overlap have to be treated specially to isolate the relevant peaks. In the subsections that follow we describe the measures taken to efficiently isolate the Raman signals of oxygen, nitrogen, and ethanol from the Raman spectra of the mixtures and how we determined the intensity of the respective Raman signals.17
2.3.1. Processing of Liquid Phase Spectra
While the signal ratio of nitrogen and ethanol could be determined straightforward by the nonoverlapping N2- and CH-stretch vibrations, the O2-stretch vibration appears in a spectral range [v̅ = (1330 to 1570) cm–1] together with the CH-bending vibration of ethanol. To isolate the O2-stretch vibration of the liquid phase spectra, a direct approach is chosen that is visualized in Figure 3 from top to bottom.
Figure 3.

Evaluation method for the liquid phase spectra; shown for the system ethanol and gas mix 2 at T = 373 K and p = 6.5 MPa.
Hereby a pure liquid ethanol spectrum (dashed black line), taken at the same pressure and temperature as the carried out VLE experiment, is fitted by a least-squares minimization (as all other fits in the following) to the CH-bending vibration of the liquid phase spectrum (solid blue line) in the range of v̅ = (1330 to 1480) cm–1. The subtraction of the pure liquid ethanol spectrum from the liquid phase mixture spectrum in the overlapped spectral region [v̅ = (1330 to 1570) cm–1] yields the isolated oxygen stretch vibration (dash-dotted blue line), no longer interfered by the ethanol. After removal of the ethanol contributions by subtraction, the remaining oxygen and nitrogen peaks are both fitted with pseudo-Voigt-Profiles (SO2-stretch, dashed line; SN2-stretch, dash-double-dotted black line). The final liquid phase spectrum then consists of two pseudo-Voigt-profiles for Raman shifts v̅ < 2350 cm–1 and of the untreated spectrum SCH-stretch (only background subtracted and baseline corrected) for Raman shifts v̅ > 2350 cm–1.
2.3.2. Processing of Vapor Phase Spectra
For the isolation of the O2-stretch vibration from the vapor phase spectrum we were not able to subtract a fitted pure ethanol spectrum, because pure ethanol at the here analyzed pressure and temperature conditions does not exist as vapor. Therefore an indirect approach was chosen, shown in the top graphic of Figure 4. The sum of two pseudo-Voigt-profiles is fitted to the overlapped spectral range of v̅ = (1330 to 1570) cm–1 (SCH-bending, dash-dotted black line; SO2-stretch, dashed black line). The pseudo-Voigt-profile that approximates the O2-stretch vibration is used together with a separate pseudo-Voigt-profile fitted to the N2-stretch vibration (SN2-stretch, dash double dotted black line), to describe the vapor phase spectrum for Raman shifts v̅ < 2350 cm–1, in analogy to the liquid phase approach. The vapor phase spectrum for Raman shifts v̅ > 2350 cm–1 is corrected by a method shown in the bottom graphic of Figure 4, which was introduced recently by Klima et al.,18 exploiting the phase-dependency of the OH-stretch vibration (compare left graphic of Figure 2). Thereby the spectral influence on the CH-stretch vibration by the formation of a liquid film on the inner surface of the microcapillary is eliminated. Besides the vapor bubbles, the liquid film does partially contribute to the Raman signal from the focal spot. Not considering this film contribution would lead to an overprediction of the ethanol amount in the vapor phase. For this purpose, the corresponding liquid phase spectrum (dashed blue line) at the same pressure and temperature is fitted to the vapor phase spectrum (solid red line) in the range of v̅ = (3114 to 3526) cm–1, the region where the OH-stretch vibration of liquid ethanol appears. This fitted liquid phase spectrum is then subtracted from the acquired spectrum for Raman shifts v̅ > 2350 cm–1 to yield the final vapor phase spectrum (SCH-stretch, dotted red line). The effect of the liquid film on the N2- and O2-stretch vibrations is hereby neglected, since the film signal contribution to those peaks was found to be less than 0.05% of the vapor phase N2/O2 vibration signals.
Figure 4.

(Top) Evaluation method for vapor phase spectra; shown for the system ethanol/gas mix 2 at T = 373 K and p = 6.5 MPa (calibration spectra recorded in single-phase vapor phase or above the mixtures critical temperature are processed equally); (bottom) correction of liquid film contribution to vapor phase spectrum for the system ethanol/gas mix 2 at T = 373 K and p = 6.5 MPa.
2.3.3. Extraction of Raman Signal Intensities from Processed Raman Spectra
The signals I (respectively signal areas) of ethanol, nitrogen, and oxygen are computed using eqs 1 to 3, in which SO2-stretch represents the pseudo-Voigt-profile peak fitted to the oxygen stretch vibration, SN2-stretch represents the pseudo-Voigt-profile peak fitted to the nitrogen stretch vibration and SCH-stretch represents the CH-stretch vibration Raman spectrum.
| 1 |
| 2 |
| 3 |
3. Results and Discussion
The results chapter is divided into five sections. First the calibration is described. In the second section the final results are illustrated and compared to an equation of state. In section three, VLE data are tested for consistency and compared to literature data. In the fourth section the thermodynamic equilibration and reproducibility of the VLE experiments are proven. In the fifth and final section explanations for the pseudobinary results are given.
3.1. Calibration
Figure 5 shows for various pressures and temperatures the ratio of mole fractions Ri–j (eq 4) as a function of the respective Raman signal ratio ri–j (eq 5), in order to determine the proportionality factors ki–j by the linear eq 6.19 All calibration results are available in the Supporting Information (Table S1).
| 4 |
| 5 |
| 6 |
Figure 5.
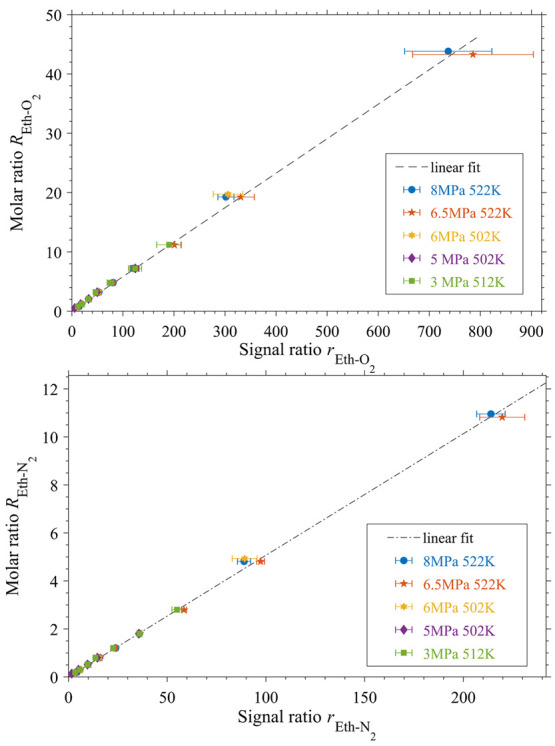
Calibration results for ethanol/oxygen and ethanol/nitrogen at different pressures and temperatures; linear fits of data given; (errorbars: standard deviation of 32 single spectra).
These calibration measurements were performed for mixtures of ethanol and gas mix 1 at conditions at which the mixture forms one single phase. In detail the calibrations were made inside the vapor phase regime [for pressures of p = (3, 5, and 6) MPa] and in the single-phase regime above the upper mixture critical temperature (UMCT) [for pressures of p = (6.5 and 8) MPa]. The molar ratios REth-O2 and REth-N2 are determined using the molar composition of gas mix 1 (equal the known volume fractions of the gas bottle; compare Table 1) and the precise flow rates of the mass flow controller and the syringe pump. Thanks to this, the molar streams of ethanol and gas mix 1 that flow into the system are known, as well as their related mole fractions inside the system.
In the top graphic of Figure 6 the signal ratios rO2-N2 of the calibration series are plotted versus the set mole fraction, when gas mix 1 is diluted by the addition of pure ethanol. Regarding the known constant molar ratio of oxygen and nitrogen (RO2-N2 = 0.25) and the therefore ideally constant signal ratio rO2-N2, only slight deviations of rO2-N2 can be seen. As the fraction of nitrogen and oxygen decreases with increasing ethanol fraction in the mixture, also the Raman signals of nitrogen and oxygen decrease and thus the error bars indicating the standard deviation of 32 single measurements increase. In the bottom graphic of Figure 6, calibration spectra (solid red lines) and their fitted spectra (sum of two pseudo-Voigt-profiles; dashed black lines) are given, indicating the agreement of fit and spectral data. With respect to these two figures, the described evaluation method applied for the vapor phase and calibration spectra (compare Figure 4), can be considered accurate for the full composition range.
Figure 6.

(Top) Calibration results for signal ratio of oxygen to nitrogen vs set mole fraction of ethanol at different pressures and temperatures (errorbars: standard-deviation of 32 single spectra); (bottom) deconvolution of range v̅ = (1330 to 1570) cm–1 for calibration spectra of different mole fractions at T = 522 K and p = 8 MPa.
The proportionality factors kEth-O2 and kEth-N2 are given in Table 3 and are obtained by a linear fit with a forced interception of 0. The calibration factor kO2-N2 could be computed by division of the other two factors. However, the given kO2-N2 is determined by a straight line that connects the intercept of 0 with the mean of the intensity ratios rO2-N2 at the molar ratio of RO2-N2 = 0.25.
Table 3. Proportionality Factors (ki–j) Found by Linear Fits; Coefficients of Determination (C2) Given.
| i | j | ki-j | Ci-j2 |
|---|---|---|---|
| ethanol | oxygen | 0.0581640 | 0.9961 |
| ethanol | nitrogen | 0.0506667 | 0.9981 |
| oxygen | nitrogen | 0.8473717 | not applicablea |
Straight line between two points and thus no C2 defined
The proportionality factors are used for all VLE experiments to determine the composition of both liquid and vapor phase, no matter at which pressure or temperature their spectra were recorded. This approach of considering the O2-, N2-18 and CH-stretch20,21 vibrations (respectively their signal ratios) as phase independent and negligibly temperature dependent, has been used similarly before in literature and is furthermore justified by the calibration results composed of measurements made at various pressures and temperatures.
3.2. VLE Results and Peng–Robinson EOS
With the described calibration the final equilibrium compositions of the liquid and vapor phase measurements can be determined using eqs 7 to 9. Regarding the binary systems of ethanol/nitrogen as well as ethanol/oxygen, the signal ratios comparing a component of a system with a component that is not present in the system approach infinity. The ternary systems consisting of ethanol and either gas mix 1 or 2 can be furthermore considered pseudobinary for comparison with the real binary systems consisting of ethanol and either nitrogen or oxygen. Therefore the pseudobinary mole fraction xgas is defined by eq 10. An explanation for the pseudobinary approach is given in subsection 3.5.
| 7 |
| 8 |
| 9 |
| 10 |
The main results are the isobaric temperature–composition (Tx) diagrams shown in Figure 7. Ternary diagrams (thus isobaric and isothermal) are shown in Figure 8 (for varying temperatures at constant pressure) and Figure 9 (for varying pressures at constant temperature). Isothermal pressure–composition (px) diagrams are shown for five chosen temperatures in Figure 10. Tx-diagrams of the pseudobinary systems (ethanol/gas mix 1 and ethanol/gas mix 2) are given in the Supporting Information (Figures S3 and S4). The set temperatures of the data of Klima et al.18 (binary system ethanol/nitrogen) deviate partly from the here investigated temperatures. For the ternary diagrams and px data, mole fractions acquired at temperatures deviating from the given set points by maximally ΔT = ± 0.5 K were therefore considered isothermal. All acquired data are given in the Supporting Information.
Figure 7.

(Left) Tx diagrams at different pressures of ethanol/oxygen and comparison with equation of state; (right) zoom of liquid phase compositions (bubble lines); (errorbars) standard-deviation of 32 single spectra; (---) Peng–Robinson EOS.
Figure 8.

(Left) Ternary diagram of ethanol, oxygen, and nitrogen (including the binary data of Klima et al.18) at p = 6.5 MPa and various temperatures; (right) zoom of liquid phase compositions (bubble lines); (---) Peng–Robinson EOS bubble line; (- ·-) Peng–Robinson EOS dew line.
Figure 9.

(Left) ternary diagram of ethanol, oxygen, and nitrogen (including the binary data of Klima et al.18) at T = 423 K and various pressures; (right) zoom of liquid phase compositions (bubble lines); (---) Peng–Robinson EOS bubble line; (-·-) Peng–Robinson EOS dew line.
Figure 10.

px diagrams of ethanol/oxygen at different temperatures; (---) Peng–Robinson EOS; (errorbars) standard-deviation of 32 single spectra.
The VLE data was compared to the cubic Peng–Robinson EOS22 (dashed and dashed-dotted lines in diagrams), given in eq 11, using an isothermal isofugacity approach.23,24R is therein the ideal gas constant, v is the molar volume, a as well as b are substance dependent parameters. The pure component parameters are calculated with eqs 12 to 14, where ω is the acentric factor, Tcrit is the critical temperature, and pcrit is the critical pressure.
| 11 |
| 12 |
| 13 |
| 14 |
The mixture parameters are calculated by the quadratic van der Waals one-fluid mixing rule, given in eqs 15 to 17, where Ki-j is the binary interaction parameter.
| 15 |
| 16 |
| 17 |
In Table 4 the critical parameters of components used in the experiments are given. A flowchart that describes the EOS-modeling is shown in Figure S2.
Table 4. Critical Temperatures, Critical Pressures, and Acentric Factors (ω) Used in the Peng–Robinson EOS25.
| component | Tcrit/K | pcrit/MPa | ω |
|---|---|---|---|
| ethanol | 514.56 | 6.226 | 0.6430 |
| oxygen | 154.65 | 5.043 | 0.0213 |
| nitrogen | 126.21 | 3.398 | 0.0400a |
ωN2 from Windmann, Köster et al.26
The obtained isothermal px results of Klima et al.18 (ethanol/nitrogen) and of this work obtained for the binary system ethanol/oxygen were used to fit Ki-j, dependent on temperature. This approach avoids inaccuracies when wide temperature ranges are considered. The temperature-dependent Ki-j are shown in Figure S1 (Supporting Information). Straight lines (eq 18), with the coefficients given in Table 5, were used to fit these data.
| 18 |
Table 5. Coefficients of Determination (C2), Slopes (m), and Intercepts (y0) for the Determination of Binary Interaction Parameters of the Peng–Robinson EOS; Fitted for T = (303 to 463) K in the Investigated Pressure Range of p = (3 to 8)MPa (Compare Figure S1).
| i | j | Ci-j2 | y0,i-j | mi-j |
|---|---|---|---|---|
| ethanol | oxygen | 0.9841 | –0.4830 | 1.789 × 10⁻³ |
| ethanol | nitrogen | 0.9587 | –0.6562 | 1.976 × 10⁻³ |
| oxygen | nitrogen | 0 | 0 |
With rising temperatures, increasing binary interaction parameters are obtained, starting from values close to Ki-j = 0 at the lower investigated temperatures. Binary interaction of oxygen and nitrogen was not considered (KO2-N2 = 0).
As it can be expected, the presented VLE data indicate clear trends, such as a stronger temperature dependence of the dew lines in the investigated pressure range (compared to the respective bubble lines), increasing liquid phase fractions of oxygen/nitrogen with rising pressure, as well as a higher solubility of oxygen compared to nitrogen. As it can be seen in Figure 7 for temperatures of T < 350 K, the measured vapor phase compositions of the different isobars are hardly distinguishable and some values approach the vicinity of pure oxygen. This is due to the higher spectral signal-to-noise ratio of the vapor phase measurements. However, complete ethanol-free vapor phase mixtures have not been detected and the trend of the dew lines as a whole can be still regarded as accurate. The Peng–Robinson EOS agrees in wide ranges with the Tx, px, and ternary results. Deviations can be seen for the vapor phase compositions at higher temperatures. The EOS predicts furthermore an unsteady trend of the oxygen solubility in the regarded temperature range (compare right chart of Figure 8). As a result of the temperature-dependent consideration of Ki-j, the EOS follows the shape of the bubble lines in the Tx- diagrams (Figure 7, S3 and S4).
3.3. Literature Data and Consistency Test
Schnabel et al.,16 as well as Malviya et al.27 published solubility data of the binary system ethanol/oxygen obtained by molecular simulation. For comparison with these literature data Henry coefficients can be derived by an approach used by Merker et al.,28 given in eq 19. Therein the vapor phase fugacity of oxygen (fO2v) is defined by eq 20, wherein xO2 and φO2v are the vapor phase molar fraction and vapor phase fugacity coefficient of oxygen, respectively. fO2 is calculated by the Peng–Robinson EOS (compare section 3.2 and Table 5) for a given temperature and a liquid phase composition that is approaching pure ethanol (xEthL → 1). Therefore, the Peng–Robinson EOS predicted pressure approaches the saturation pressure of ethanol (p → pEth).
| 19 |
| 20 |
The approach is visualized in Figure 11 for five different temperatures. The final Henry coefficients obtained for the smallest pressure deviation (p – pEth*) are given in Table S2 and are compared to the literature data in Figure 12. The Henry coefficients are in good agreement with the data obtained by molecular simulation. Deviations can be found at lower temperatures.
Figure 11.

Derivation of Henry coefficients by the Peng–Robinson EOS at different temperatures; compare eq 19.
Figure 12.

Comparison of derived Henry coefficients with molecular simulation literature data of Schnabel et al.16 (adjusted and predictive mode) and Malviya et al.27
The VLE data can be furthermore tested for thermodynamic consistency, using a Gibbs–Duhem-based approach that has been described in detail by Valderrama et al.29,30 Hereby an isothermal data set is compared to the thermodynamic model of choice, by numerical, trapezoidal integrations of the respective experimental (AP) and model-areas (Aφ), given in eqs 21 and 22. Therein Zv is the vapor-phase compressibility factor.
| 21 |
| 22 |
According to this method, thermodynamic consistency can be considered if deviations of Ap and Aφ are in the range of −20 to +20%. The percentage pressure and mole fraction errors (given in Table S3) should be furthermore within a certain range. The here presented VLE data of ethanol/oxygen however are not within the ±20% consistency interval. This is mainly due to the deviations of the vapor phase results for small ethanol mole fractions as discussed in section 3.2. For low temperatures and thus small mole fractions of ethanol in the vapor phase, the percentage-error strongly increases. Many other equations of state could not describe the given VLE data significantly better to fully confirm Valderrama’s consistency test.
3.4. Proof of Equilibration and Reproducibility
The accuracy of the data evaluation has been indicated in the calibration chapter in Figure 6. In this section, proof of thermodynamic equilibration and experimental reproducibility is shown. Measurements were performed for the binary system ethanol/oxygen for p = (3 and 6.5) MPa and four different temperatures. Figure 13 shows vapor and liquid phase mole fractions, measured at three different access holes along the heating block (measuring spots “MS”, as indicated in Figure 1). This was done to prove that the investigated systems were in thermodynamic equilibrium, in the moment when the vapor and liquid segments reached the fifth measure spot (MS:5), where all Raman spectra relevant for the results sections were acquired. The compositions of MS:5 represent the final VLE results, as shown in Figure 7. As a result of Figure 13, thermodynamic equilibration can be considered for all temperatures and pressures, even though deviations can be seen for vapor phase compositions, arising from the higher spectral signal-to-noise ratio.
Figure 13.

Proof of equilibration for ethanol/oxygen; (errorbars) standard-deviation of 32 single spectra; MS:5 represent final Tx results.
Figure 14 shows liquid and vapor phase mole fractions, taken for three independently performed experimental runs at the fifth measure spot. These measurements were performed to prove the general reproducibility of the VLE experiments. The compositions of run three represent the final VLE results shown in Figure 7, respectively, as MS:5 in the “proof of equilibration” experiments. As it can be seen in Figure 14, reproducibility of the VLE experiments is proven, indicating however higher deviations in the vapor phase compositions as well.
Figure 14.

Proof of reproducibility for ethanol/oxygen at relevant measuring spot 5 (errorbars) standard-deviation of 32 single spectra; run 3 represent final Tx-results.
3.5. Pseudobinary Tx and px Diagrams
Figure 15 shows for the ternary system of ethanol/gas mix 1 (RO2-N2 = 0.25) the possible global compositions (solid orange line) inside the vapor–liquid regime, given by the Peng–Robinson predicted dew curve (solid red line) and bubble curve (solid blue line). The global composition line is intersected by an infinite number of tie lines, as indicated for three liquid and vapor molar compositions (green dash dotted lines intersecting the orange line represented by black discs), which means that an infinite number of liquid and vapor molar compositions could be obtained depending on the precise global composition of the ternary system. As shown in the previous sections, systems consisting of ethanol and either gas mix 1 or gas mix 2 can be considered pseudobinary, assuming the pseudopure component “gas” that consists of oxygen and nitrogen. This approach however neglects the described dependency on the global composition.
Figure 15.

VLE ternary diagram of ethanol, oxygen, and nitrogen at T = 443 K and p = 5 MPa; global composition line of ethanol and gas mix 1 intersected by three example tie lines.
To compare the pseudobinary results with the Peng–Robinson EOS, the pseudocritical temperatures and pressures, as well as pseudoacentric factors, are given in Table 6. These data were obtained by the calculation of the weighted molar average of the pure component values (Kay’s Rule).31,32 The same rule was applied for the temperature-dependent binary interaction parameters. The pseudobinary Tx diagrams are given in Figures S3 and S4.
Table 6. Critical Temperatures, Pressures, and Acentric Factors for the Peng–Robinson EOS (Values Obtained by Weighted Molar Average of Pure Components; Compare Table 4).
| component | Tcrit/K | pcrit/MPa | ω |
|---|---|---|---|
| gas mix 1 | 131.90 | 3.727 | 0.0363 |
| gas mix 2 | 148.96 | 4.714 | 0.0250 |
4. Conclusion
It was shown that the described setup can be used to obtain isobaric and isothermal VLE data at high temperature and pressure conditions, also of explosive mixtures. Agreement of the acquired data with the Peng–Robinson EOS, as well with literature data was found. The accuracy of the data evaluation, as well as the thermodynamic equilibration and experimental reproducibility was pointed out.
Even though literature data of the saturated liquid line exist in form of Henry coefficients, vapor phase data for the investigated systems at the considered conditions are not existent. The chosen approach of precise isobaric determination of bubble and dew curve was executed, since most experimental investigations focus on the acquisition of VLE data at many different pressures, but only for few set temperatures. Even though not performed in this study, the fused silica microcapillary lasts pressures of up to p = 25 MPa and temperatures of T = 680 K. Phase equilibria could thus be investigated by in situ Raman spectroscopy even at harsher conditions with lower risk, higher speed, and a lower amount of material, compared to VLE experiments in high pressure cells.
Acknowledgments
The project leading to this result has received funding from the European Union’s Horizon 2020 Research and Innovation Program under Grant Agreement No. 637654 (Inhomogeneities).
Glossary
List of Symbols
- A
integrated area for consistency test (Ap, Aφ)
- a
phase-dependent PR-EOS mixture parameter
- ai-i/ai-j
phase-independent PR-EOS pure/mixture parameter
- b
phase-dependent PR-EOS mixture parameter
- bi-i
phase-independent PR-EOS pure parameter
- Ci-j2
coefficient of determination for linear fits
- F
frequency
- f
fugacity
- H
Henry’s law coefficient
- I
integrated Raman signal
- Ki-j
PR-EOS binary interaction parameter
- ki-j
linear calibration factor
- mi-j
slope of linear Ki-j fit
- nc
number of components
- p
Pressure
- Ri-j
ratio of mole fractions
- R
ideal gas constant
- ri-j
ratio of Raman signals
- S
Raman peak-intensity
- T
temperature
- v
molar volume
- x
mole fraction
- y0,i-j
intercept of linear Ki-j fit
- Z
compressibility factor
- αi
phase-independent PR-EOS pure parameter
- v̅
Raman shift
- φ
fugacity coefficient
- ω
PR-EOS acentric-factor
Superscript
- v
vapor phase
- L
liquid phase
- ∗
pure/saturated
Subscript:
- w
based on weight
- v
based on volume
- crit
critical
- Eth
ethanol
- gas
pseudopure component gas
Supporting Information Available
Supporting Information (pdf): The Supporting Information is available free of charge at https://pubs.acs.org/doi/10.1021/acs.jced.0c00184.
Calibration results, fitting of binary interaction parameters, modeling of VLE data with Peng–Robinson EOS, pseudobinary Tx results, Henry’s law coefficients, average percentage errors, VLE data, list of symbols, references (PDF)
The authors declare no competing financial interest.
Supplementary Material
References
- Falgout Z.; Rahm M.; Wang Z.; Linne M. Evidence for supercritical mixing layers in the ECN Spray A. Proc. Combust. Inst. 2015, 35, 1579–1586. 10.1016/j.proci.2014.06.109. [DOI] [Google Scholar]
- Wensing M.; Vogel T.; Götz G. Transition of diesel spray to a supercritical state under engine conditions. Int. J. Engine Res. 2016, 17, 108–119. 10.1177/1468087415604281. [DOI] [Google Scholar]
- Segal C.; Polikhov S. A. Subcritical to supercritical mixing. Phys. Fluids 2008, 20, 52101. 10.1063/1.2912055. [DOI] [Google Scholar]
- Crua C.; Manin J.; Pickett L. M. On the transcritical mixing of fuels at diesel engine conditions. Fuel 2017, 208, 535–548. 10.1016/j.fuel.2017.06.091. [DOI] [Google Scholar]
- Singla G.; Scouflaire P.; Rolon C.; Candel S. Transcritical oxygen/transcritical or supercritical methane combustion. Proc. Combust. Inst. 2005, 30, 2921–2928. 10.1016/j.proci.2004.08.063. [DOI] [Google Scholar]
- Nauclér J. D.; Christensen M.; Nilsson E. J. K.; Konnov A. A. Oxy-fuel Combustion of Ethanol in Premixed Flames. Energy Fuels 2012, 26, 4269–4276. 10.1021/ef3008085. [DOI] [Google Scholar]
- Nauclér J. D.Combustion of selected alternative liquid fuels at oxy-fuel conditions: experiments and modelling. Ph.D. Thesis, Lund University, 2016.
- Hoelderich W. F. Environmentally benign manufacturing of fine and intermediate chemicals. Catal. Today 2000, 62, 115–130. 10.1016/S0920-5861(00)00413-2. [DOI] [Google Scholar]
- Jorgensen B.; Egholmchristiansen S.; Dahlthomsen M.; Christensen C. Aerobic oxidation of aqueous ethanol using heterogeneous gold catalysts: Efficient routes to acetic acid and ethyl acetate. J. Catal. 2007, 251, 332–337. 10.1016/j.jcat.2007.08.004. [DOI] [Google Scholar]
- Dong W.; Reichenberger S.; Chu S.; Weide P.; Ruland H.; Barcikowski S.; Wagener P.; Muhler M. The effect of the Au loading on the liquid-phase aerobic oxidation of ethanol over Au/TiO2 catalysts prepared by pulsed laser ablation. J. Catal. 2015, 330, 497–506. 10.1016/j.jcat.2015.07.033. [DOI] [Google Scholar]
- Meng S.-S.; Lin L.-R.; Luo X.; Lv H.-J.; Zhao J.-L.; Chan A. S. C. Aerobic oxidation of alcohols with air catalyzed by decacarbonyldimanganese. Green Chem. 2019, 21, 6187–6193. 10.1039/C9GC02446H. [DOI] [Google Scholar]
- Palmer D. A.Handbook of Applied Thermodynamics; CRC Press, 2019. [Google Scholar]
- Peper S.; Dohrn R. Sampling from fluid mixtures under high pressure: Review, case study and evaluation. J. Supercrit. Fluids 2012, 66, 2–15. 10.1016/j.supflu.2011.09.021. [DOI] [Google Scholar]
- Schwedt G.Analytische Chemie: Grundlagen, Methoden und Praxis ; 158 Tabellen; Thieme: Stuttgart, NY, 2001. [Google Scholar]
- Fischer K.; Wilken M. Experimental determination of oxygen and nitrogen solubility in organic solvents up to 10 MPa at temperatures between 298 and 398 K. J. Chem. Thermodyn. 2001, 33, 1285–1308. 10.1006/jcht.2001.0837. [DOI] [Google Scholar]
- Schnabel T.; Vrabec J.; Hasse H. Henry’s law constants of methane, nitrogen, oxygen and carbon dioxide in ethanol from 273 to 498 K: Prediction from molecular simulation. Fluid Phase Equilib. 2005, 233, 134–143. 10.1016/j.fluid.2005.04.016. [DOI] [Google Scholar]
- Stehle S.; Lay E. N.; Triolo A.; Ventosa N.; Braeuer A. S. A fast and remote screening method for sub-micro-structuration in pressurized mixtures containing water and carbon dioxide. J. Supercrit. Fluids 2019, 152, 104555. 10.1016/j.supflu.2019.104555. [DOI] [Google Scholar]
- Klima T. C.; Braeuer A. S. Vapor-liquid-equilibria of fuel-nitrogen systems at engine-like conditions measured with Raman spectroscopy in micro capillaries. Fuel 2019, 238, 312–319. 10.1016/j.fuel.2018.10.108. [DOI] [Google Scholar]
- Thien J.; Reinpold L.; Brands T.; Koß H.-J.; Bardow A. Automated Physical Property Measurements from Calibration to Data Analysis: Microfluidic Platform for Liquid–Liquid Equilibrium Using Raman Microspectroscopy. J. Chem. Eng. Data 2020, 65, 319–327. 10.1021/acs.jced.9b00636. [DOI] [Google Scholar]
- Luther S. K.; Schuster J. J.; Leipertz A.; Braeuer A. Non-invasive quantification of phase equilibria of ternary mixtures composed of carbon dioxide, organic solvent and water. J. Supercrit. Fluids 2013, 84, 146–154. 10.1016/j.supflu.2013.09.012. [DOI] [Google Scholar]
- Adami R.; Schuster J.; Liparoti S.; Reverchon E.; Leipertz A.; Braeuer A. A Raman spectroscopic method for the determination of high pressure vapour liquid equilibria. Fluid Phase Equilib. 2013, 360, 265–273. 10.1016/j.fluid.2013.09.046. [DOI] [Google Scholar]
- Peng D.-Y.; Robinson D. B. A New Two-Constant Equation of State. Ind. Eng. Chem. Fundam. 1976, 15, 59–64. 10.1021/i160057a011. [DOI] [Google Scholar]
- Gmehling J., Kleiber M., Kolbe B., Rarey J., Eds. Chemical Thermodynamics for Process Simulation, 2nd, completely revised and enlarged ed.; Wiley-VCH: Weinheim, 2019. [Google Scholar]
- Yeo Y. K.Chemical Engineering Computation with MATLAB; Taylor & Francis, CRC Press: Boca Raton, 2017. [Google Scholar]
- NIST Standard Reference Database 103a. ThermoData Engine, ver. 10.2; NIST.
- Windmann T.; Köster A.; Vrabec J. Vapor–Liquid Equilibrium Measurements of the Binary Mixtures Nitrogen + Acetone and Oxygen + Acetone. J. Chem. Eng. Data 2012, 57, 1672–1677. 10.1021/je201058j. [DOI] [Google Scholar]
- Malviya A.; Vrabec J. Henry’s Law Constant of Nitrogen, Oxygen, and Argon in Ternary Aqueous Alcoholic Solvent Mixtures. J. Chem. Eng. Data 2020, 65, 1189. 10.1021/acs.jced.9b00571. [DOI] [Google Scholar]
- Merker T.; Franke N.; Gläser R.; Schleid T.; Hasse H. Gas Solubility in Binary Liquid Mixtures: Carbon Dioxide in Cyclohexane + Cyclohexanone. J. Chem. Eng. Data 2011, 56, 2477–2481. 10.1021/je101342q. [DOI] [Google Scholar]
- Valderrama J. O.; Alvarez V. H. A versatile thermodynamic consistency test for incomplete phase equilibrium data of high-pressure gas–liquid mixtures. Fluid Phase Equilib. 2004, 226, 149–159. 10.1016/j.fluid.2004.07.002. [DOI] [Google Scholar]
- Valderrama J. O.; Faúndez C. A. Thermodynamic consistency test of high pressure gas–liquid equilibrium data including both phases. Thermochim. Acta 2010, 499, 85–90. 10.1016/j.tca.2009.11.006. [DOI] [Google Scholar]
- Walas S. M.Phase Equilibria in Chemical Engineering; Butterworth: Boston, 1985. [Google Scholar]
- Barner H. E.; Quinlan C. W. Interaction Parameters for Kay’s Pseudocritical Temperature. Ind. Eng. Chem. Process Des. Dev. 1969, 8, 407–412. 10.1021/i260031a018. [DOI] [Google Scholar]
Associated Data
This section collects any data citations, data availability statements, or supplementary materials included in this article.
Data Citations
- NIST Standard Reference Database 103a. ThermoData Engine, ver. 10.2; NIST.