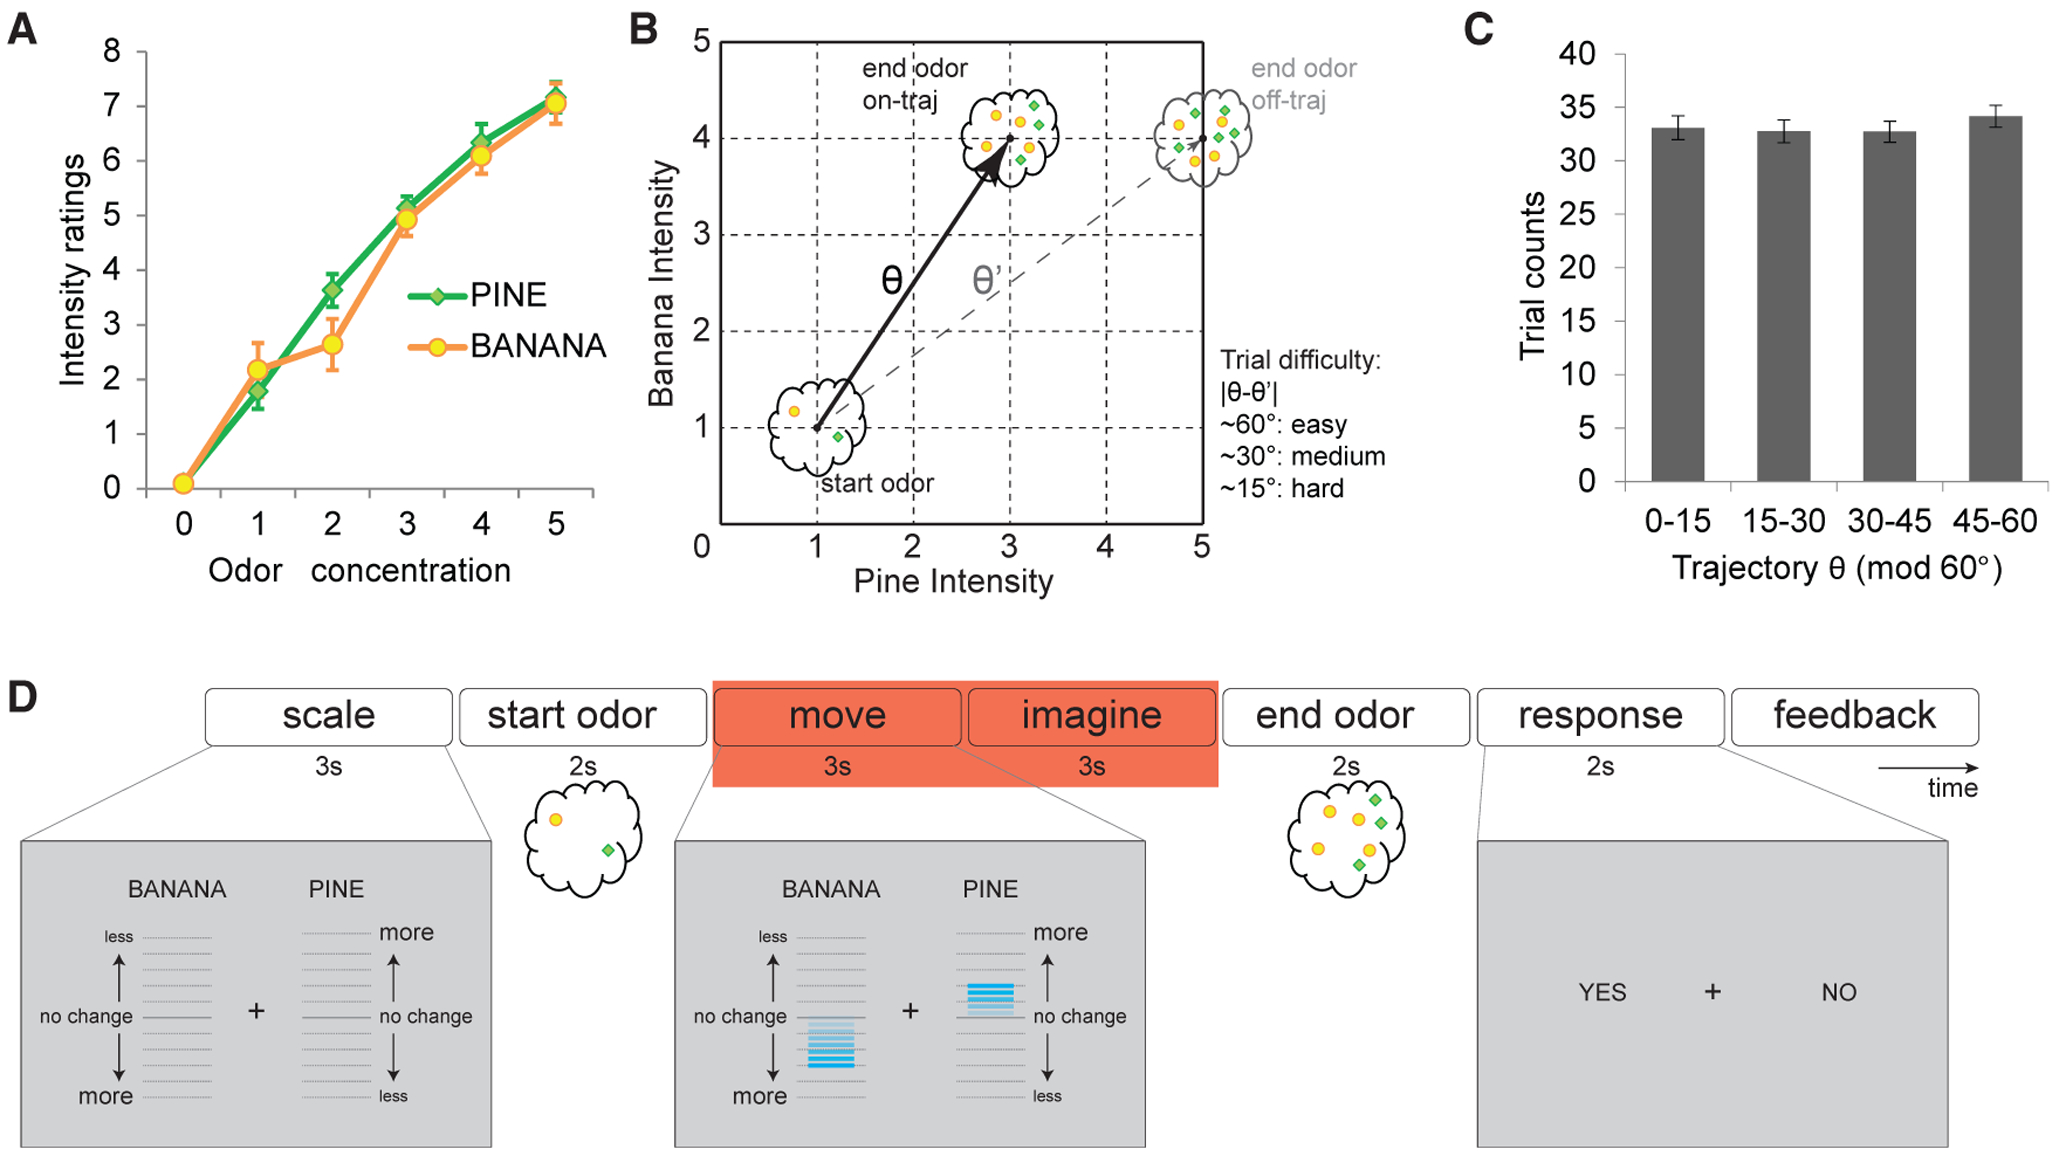
Figure 1. Experimental Design and Navigation Performance.

(A) Intensity ratings (mean ± SEM) of pure pine and pure banana odors at different concentrations. As odor concentrations increased stepwise, subjects’ perceived intensity increased stepwise as well (chi-square = 204.93; p < 0.001; Friedman test), but ratings did not differ between the two odors at each intensity step (chi-square = 1.03; p = 0.31; Friedman test).
(B) Conceptual layout of the odor map, in which each coordinate on the odor map corresponds to a unique mixture of the two odors. Trajectory angles were defined by start and end odor positions, and the end odor might appear on (“on-traj”) or off (“off-traj”) the predicted trajectory. There were three difficulty levels according to the difference between on-trajectory θ and off-trajectory θ’. Easy trials: 60° ± 5°; medium trials: 30° ± 5°; hard trials: |θ-θ’| 15° ± 5°.
(C) Trajectory θ was sampled evenly across the 60° cycle, with no difference in sampling frequency across directions (chi-square = 2.22; p = 0.53; Friedman test). Data are mean ± SEM. See also Figure S1.
(D) Timeline of an example trial of the odor prediction task. Red box indicates the time period used for the grid-cell analyses; relative movements of the banana and pine scale bars (compare left and center screenshots in gray) informed subjects how much to expect the intensities of the two odor components to change, who then indicated whether the end odor matched their prediction (right screenshot).
See also Figure S2.
