

Abstract
Dietary assessment traditionally relies on self-reported data which are often inaccurate and may result in erroneous diet-disease risk associations. We illustrate how urinary metabolic phenotyping can be used as alternative approach for obtaining information on dietary patterns. We used two multi-pass 24-hr dietary recalls, obtained on two occasions on average three weeks apart, paired with two 24-hr urine collections from 1,848 U.S. individuals; 67 nutrients influenced the urinary metabotype measured with 1H-NMR spectroscopy characterized by 46 structurally identified metabolites. We investigated the stability of each metabolite over time and showed that the urinary metabolic profile is more stable within individuals than reported dietary patterns. The 46 metabolites accurately predicted healthy and unhealthy dietary patterns in a free-living U.S. cohort and replicated in an independent U.K. cohort. We mapped these metabolites into a host-microbial metabolic network to identify key pathways and functions. These data can be used in future studies to evaluate how this set of diet-derived, stable, measurable bioanalytical markers are associated with disease risk. This knowledge may give new insights into biological pathways that characterize the shift from a healthy to unhealthy metabolic phenotype and hence give entry points for prevention and intervention strategies.
Diet is a key contributor to human health and disease, though it is notoriously difficult to measure accurately in population studies1–4, and new approaches are needed to understand the metabolic consequences of dietary intakes, eating patterns5–7 and their relation to disease risk. Omics technologies have facilitated understanding of individual and population health at the systems level8; specifically, metabolic phenotypes, readily measured from urine and blood, carry rich information on physiological phenotype, environmental exposures and disease risks9–11. We previously introduced the metabotype concept to describe metabolic consequences of genetic variation in animals12, but metabotypes (metabolic phenotypes) are also sensitive to lifestyle influences in humans including dietary composition9,13–18. Urine samples have higher concentrations of food-derived compounds and wider dynamic range compared to blood, which is under tight homeostatic regulation19, and controlled trials have shown that urinary metabolic profile provides an objective measure of dietary input17.
Our aim here was to obtain an objectively measured biochemical signature of the “dietary nutriome”20. We define the functional nutriome as “chemically-defined diet-derived molecular species contributing to the human metabolic phenotype”; it may be the means by which diet affects disease risk as it influences the expressed phenotype of the individual. We make use of INTERMAP cohort21,22 data on 1,848 U.S. individuals providing high quality information on dietary intakes from four multi-pass interviewer administered 24-hr dietary recalls (giving data on 80 nutrients), paired with urinary excretion data from two timed 24-hr urine collections. The urinary metabolome was measured by proton Nuclear Magnetic Resonance (1H-NMR) spectroscopy which gives a broad agnostic chemical profile for each urine sample. We present our approach to identify metabolic features associated with nutrient intakes and show the stability over time of metabolites and dietary markers. We then use the identified metabolites to predict healthy and unhealthy dietary patterns in two independent populations, and show how metabolite-nutrient associations may in future be used to link such metabotypes to health outcomes (Figure 1).
Figure 1. Schematic of the bidirectional metabolic modelling approach.

The metabotype, influenced by both the host genome and the microbiome, can be used as an objective measure to investigate the inter-relationship between diet and health against a background of age, sex and genetic susceptibility. Key: I, direct associations between self-reported dietary records and health outcomes; II, nutrient analysis based on objectively measured biomarkers (urinary metabotype) rather than relying only on subjective information such as food frequency questionaires; III, metabolic signatures of health outcomes; IV, proposed bidirectional metabolic modelling approach using the urinary excretory metabolome (containing host and microbial genome information) as a vehicle to relate nutrient intakes from multiple multi-pass 24-hr dietary recalls to health outcomes.
RESULTS
Clustering of dietary nutrients and urinary metabolites
We found 46 urinary metabolites that covaried with at least one of 80 dietary nutrients; for 67 of these nutrients we found associations with one or more metabolites for both first and second urine samples (Figure 2). The majority of signals were structurally identified using a comprehensive analytical identification strategy23, although for a few metabolites it was not possible to assign a definitive structure. Supplementary Table 1 shows for each nutrient all the associated metabolites with the sign of the association. Supplementary Table 2 gives a list of identified metabolites (linked to nutrients) with their chemical shift sets (Extended Data Figure 1) and an indication of strength of association between each metabolite-nutrient pair. Supplementary Figures 1–3 show correlation heatmaps between nutrients and the full 600 MHz 1H-NMR spectra for the two urine collections.
Figure 2. Biclustered heatmap of partial correlations between nutrient intakes and urinary metabolites.

Nutrient intakes (y-axis) from 24-hr dietary recall data were correlated with urine samples from the same 24-hr period. Correlations for a given identified metabolite (x-axis) are shown only if they were significant in both the first and second urine samples in the U.S. INTERMAP cohort (n=1,848), adjusted for age, gender and population sample. The least significant correlation across the two samples is given, and P-values were adjusted for multiple testing using the False Discovery Rate (FDR) controlled at 1%. All nutrients with any association with a 1H-NMR spectral variable (at FDR<0.01) are included here (see Supplementary Figure 1). (See also Supplementary Table 1 which lists all nutrients associated with each identified metabolite and Supplementary Table 2 which lists all identified metabolites associated with each nutrient; additionally, these data can be interactively visualized using the NutriomeXplorer software). The nutrients are clustered based on the similarity of their metabolic signatures and urinary metabolites are clustered based on their auto-correlations. The optimal number of clusters for each was assessed using the maximal modularity of the clustering that is higher than the modularity of 1,000 randomly rewired networks. Horizontal and vertical black lines in the heatmap indicate the clusters from the hierarchical clustering with the clusters labelled in colour. Key: M1–9 – metabolite clusters 1–9; N1–9 – nutrient clusters 1–9. Abbreviations: ACC – adjusted coefficient of commonality; 1H-NMR – proton Nuclear Magnetic Resonance spectroscopy; MFA – monounsaturated fatty acid; LC – long-chain; PFA – polyunsaturated fatty acid; SFA – saturated fatty acid; TFA – trans-fatty acid; Vit – vitamin. Chemical elements are abbreviated by their element symbol and amino acids by their 3-letter abbreviations.
The adjusted coefficient of commonality (ACC) distance was used as input for hierarchical clustering of the urinary metabolic signatures associated with nutrients (Supplementary Figure 4); based on the optimal modularity this resulted in 20 nutrient clusters (Supplementary Figure 5), nine of which were comprised of multiple nutrients. Supplementary Figure 6 shows the correspondence between partial correlations and the ACC.
From these analyses, dietary and urinary potassium showed the highest concordance with each other based on similarity of metabolic signatures, followed by magnesium, although dietary potassium and magnesium were more similar to each other than urinary and dietary potassium (Supplementary Figure 5) reflecting patterns observed in the correlation analysis (Supplementary Figure 4). Also, there was a modest similarity between dietary and urinary calcium, but no association between dietary and urinary sodium. Moreover, dietary sodium had little to no similarities with other nutrients unlike urinary sodium, reflecting the inaccurate estimation of sodium intake from dietary data24. Potassium and magnesium, both dietary and urinary, had metabolic signatures that were similar to those for fiber reflecting common dietary origins (e.g. vegetable intake).
For cholesterol, the partial correlations and ACC gave rise to different clustering patterns. In the ACC analyses, cholesterol clustered with palmitoleic (monounsaturated fatty acid (MFA) 16:1), oleic (MFA 18:1), palmitic (saturated FA (SFA) 16:0) and stearic (SFA 18:0) acid based on similarity of metabolic signatures (Supplementary Figure 5), reflective of higher excretions of metabolites related to meat intake (e.g. O-acetylcarnitine, carnitine) and lower excretions of metabolites related to vegetable intake (e.g. hippurate, S-methyl-cysteine-sulfoxide); whereas in the correlation analysis (Supplementary Figure 4) cholesterol clustered with arachidonic acid (polyunsaturated FA (PFA) 20:4), amino acids, vitamins and minerals.
We found a strong relationship (r=0.15, q=9.93×10⁻⁹) between urinary formate and urinary sodium (biomarker of salt intake), both of which are independently associated with adiposity25,26 as well as blood pressure9,27, indicating common pathways. Other nutrient-metabolite relationships include previously reported links between dietary intake of alcohol with urinary ethylglucuronide (r=0.61, q=6.11×10−183) and ethanol (r=0.52, q=6.73×10−127) (Figure 2), both known alcohol biomarkers28,29. Alcohol intake was associated with acetate (r=0.16, q=2.52×10⁻¹⁰), consistent with the primary oxidative metabolism of ethanol to acetaldehyde (via aldehyde dehydrogenase), which in turn is produced from ethanol via alcohol dehydrogenase in the liver. The association of PFAs with urinary trimethylamine-N-oxide (r=0.20, q=5.83×10⁻¹⁵) and dimethylamine (r=0.16, q=2.46×10⁻⁹) reflects dietary intake of fish30,31. We found strong direct correlations of dietary fructose, glucose and vitamin C with urinary biomarkers of citrus fruit consumption32–34 prolinebetaine (r=0.26 to r=0.50, q=2.08×10⁻²⁶ to q=9.47×10−115) and 4-hydroxyprolinebetaine (r=0.23 to r=0.42, q=1.59×10⁻²⁰ to q=8.61×10−76) as well as with 2-hydroxy-2-(4-methylcyclohex-3-en-1-yl)propoxyglucuronide (r=0.18 to r=0.26, q=2.87×10⁻¹³ to q=1.46×10⁻²⁸) (Figure 2). Citrus fruits naturally contain citric acid which explains the positive association between vitamin C and urinary citrate (r=0.41, q=3.00×10−75). The strong direct association between calcium and citrate (r=0.25, P=4.25×10⁻²⁸, qinferred=6.20×10⁻²⁶), after integration of the citrate and citrate-borate complex peaks, again indicates a functional link. There are also strong associations of dietary MFAs, SFAs and heme-bound iron with O-acetylcarnitine (r=0.19, q=2.43×10⁻¹³), carnitine (r=0.18, q=1.26×10⁻¹²) and N6,N6,N6-trimethyllysine (r=0.14, q=7.66×10⁻⁸), and PFAs with creatine (r=0.13, q=1.71×10⁻⁶), 1-methylhistidine (r=0.17, q=2.94×10⁻¹⁰), histidine (r=0.18, q=6.46×10⁻¹¹) and N6,N6,N6-trimethyllysine (r=0.14, q=6.39×10⁻⁸). These reflect consumption of various types of meats, with the former group of metabolites associated with consumption of red meats and the latter with lean meats13,17.
Three-week stability of nutrient and metabolic clusters
We investigated stability (reproducibility) of individual nutrients and metabolites across average of the first and second, and the third and fourth, 24-hr dietary recalls and the two 24-hr urine collections, respectively. Specifically, we calculated partial intraclass correlation (pICC), adjusted for age, sex and population sample, for each of the 67 nutrients (Figure 3A) and associated 46 urinary metabolites (Figure 3B); for the 67 nutrients, 25% (17/67) of pICCs were in the top quartile whereas for the metabolites 26/46 (56.5%) fell in the top quartile of pICCs (across the two sets of two 24-hr recalls and the two urine collections) (Figure 3C,D). This suggests that reproducibility of some nutrients obtained from dietary records may be lower than some of their associated metabolites (Supplementary Note 1). Supplementary Table 3 shows the pICCs for each nutrient (including 13 without any associated metabolites) and each metabolite.
Figure 3. (Partial) intra-class correlations (ICCs) across all data.
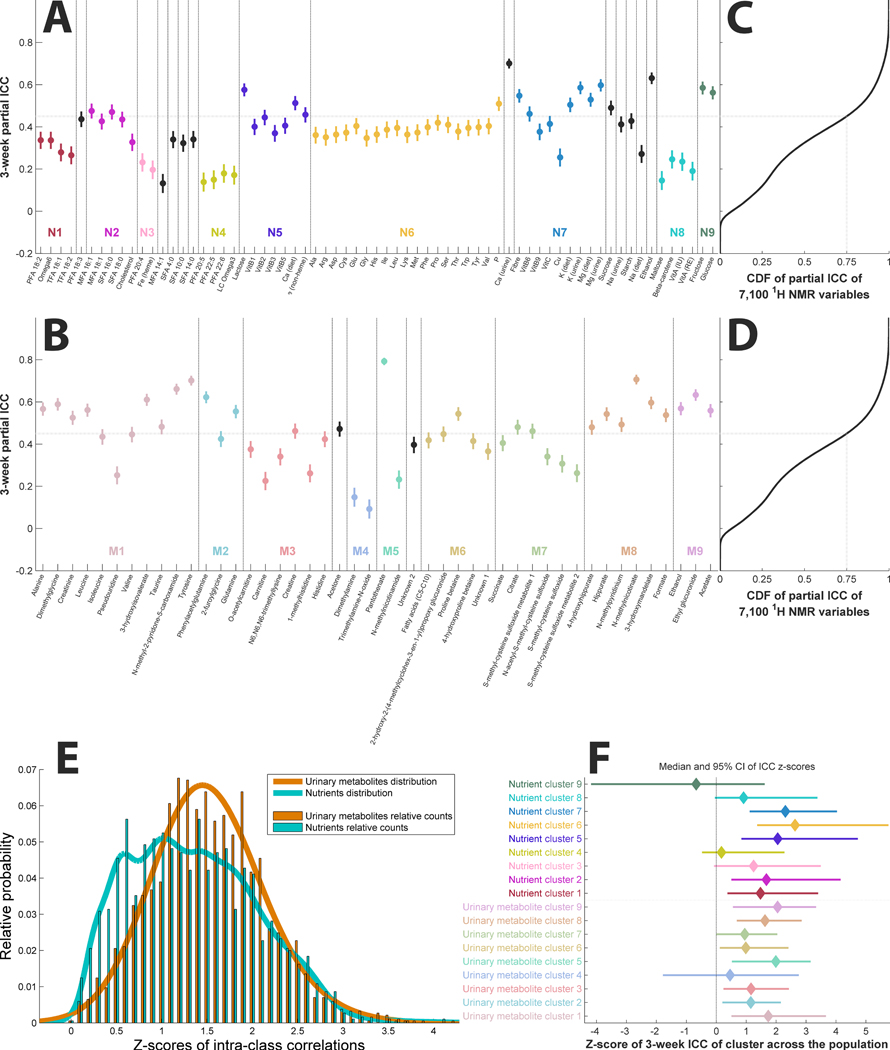
(A) Partial ICCs (and 95% confidence intervals, CI95) for the nutrients ordered based on the clustering from Figure 2. The horizontal line indicates the 75th percentile of partial ICCs of the 7,100 variables from the 1H-NMR data. (B) Partial ICCs (and CI95) for the urinary metabolites ordered based on the clustering from Figure 2. (C, D) Cumulative distribution function (CDF) of partial ICCs of the 7,100 variables from the 1H-NMR data for comparison, with the grey dotted line indicating the 75th percentile. (E) Distribution of ICCs (z-scores by means of the Fisher transformation) of the nutrient and urinary data of each participant (n=1,848). ICCs of urinary data are significantly higher than ICCs from nutrients (t=7.78, P=1.23×10⁻¹⁴). (F) Population-wide ICCs of clusters from Figure 2 represented as z-scores showing the median ICC z-score and CI95 of each cluster. Variables in clusters with confidence intervals that include 0 are not considered reproducible across the two measurements, 3 weeks apart, in the population (n=1,848). Key: M1–9 –metabolite clusters 1–9; N1–9 – nutrient clusters 1–9.
We further investigated reproducibility of the nutrients and metabolites over the 3-week period using paired analysis of ICCs across all 46 metabolites and 67 nutrients (Figure 3E). We found that overall the within-person ICC (transformed to Fisher Z-scores) of the metabolites was higher than for the nutrients (P=1.23×10⁻¹⁴). Additionally, we found that within-person ICC was significantly higher than between-person (P=8.94×10−303) indicating that individuals, irrespective of day-to-day dietary variation, are more similar to themselves than to others.
We then assessed for each individual the reproducibility of variables within each cluster over 3 weeks (Figure 3F). When a 95% confidence interval (CI95) for a cluster includes zero it indicates a lack of stability over time. For example, the CI95 for cluster M4 (containing trimethylamine-N-oxide and dimethylamine), and cluster N4 (containing PFAs) both include zero. Nonetheless, the metabolites and nutrients from these clusters correlate within each data set (first and second 24-hr urine samples) (Figure 2), reflecting the fact that both clusters are associated with fish intake markers. Also, nutrients in cluster N9 (dietary glucose and fructose, likely from consumption of fruit/fruit juice based on correlations in Figure 2) were not stable across the 3-week period, whereas for the urinary cluster containing biomarkers of citrus fruit/juice consumption (cluster M5) the ICC was more precisely estimated and hence results were more reproducible.
Metabolic reaction networks enable deeper biological understanding of nutriome influences on metabolism
Urinary metabolites, including those associated with nutrients, indicate a variety of different interconnected metabolic processes that are consequences of host genetic variation, the microbiome and other environmental exposures. We made use of metabolic reaction networks to delineate correlations between metabolites in terms of their proximity (number of intermediate reactions) in the metabolic network35. Prior to metabolic network modelling we considered the bi-clustered heatmap (Figure 2) from which certain key features emerge, including correlated metabolites that are not in close biological proximity in the human metabolic reaction network (Supplementary Note 2).
Classical biochemical pathways are essentially a shorthand notation to describe a series of sequential and parallel chemical reactions that may occur in cells. However, it is not axiomatic that all these reactions are necessarily coupled in space or time in real living systems. The MetaboNetworks software35 provides a bioinformatic reconstruction of pathway relationships observed in a real system, but constrained by the formalism of classical (e.g. KEGG) representations. We used MetaboNetworks to build a metabolic reaction network (see Extended Data Figure 2 for the full connected network and Supplementary Table 4 for abbreviations) for these data. We visualize three pathways in more detail by detailing the enzymes (and coding genes) involved in different reactions. This information is based on known, published biochemical reaction data from public databases. We show side-by-side various statistical relationships between metabolites in each pathway. For example, the nicotinate (niacin/vitamin B3) pathway (Figure 4A) contains correlated metabolites NMNA and N-methylpyridinium (Figure 4B) and the downstream metabolites N-methylnicotinamide and N-methyl-2-pyridone-5-carboxamide (2PY) which are also correlated, although both pairs of metabolites did not correlate with each other (Supplementary Note 2). Whereas N-methylnicotinamide correlated only with urinary magnesium (r=0.12, q=7.89×10⁻⁶), 2PY correlated with urinary (r=0.15, q=2.96×10⁻⁹) and dietary magnesium (r=0.08, q=1.62×10⁻³) and also with a range of B-vitamins (r=0.11 to r=0.16, q=3.17×10⁻⁵ to q=3.28×10⁻¹⁰) and dietary amino acids (r=0.09 to r=0.14, q=4.44×10⁻⁴ to q=7.15×10⁻⁸).
Figure 4. Subgraphs from three metabolic pathways alongside partial correlations between metabolites.
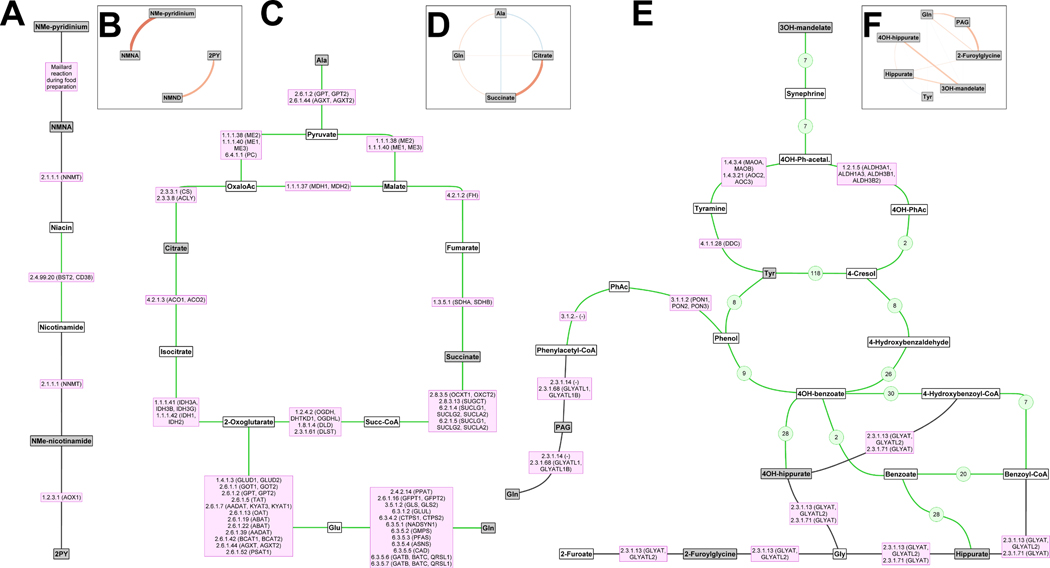
The subgraphs were extracted from the multicompartmental metabolic reaction network (Extended Data Figure 2). Grey nodes indicate metabolites associated with one or more of the nutrients and white nodes are intermediate metabolites. (A, B) Vitamin B3 metabolism. (C, D) Metabolic energy from amino acids alanine and glutamine to the tricarboxylic acid (TCA) cycle. (E, F) Gut microbial metabolites and 2-furoylglycine. (A, C, E) Lines indicate reactions; those mediated by Homo sapiens enzymes are indicated by the enzyme codes and gene names in purple boxes, while gut microbial reactions are shown with green lines (reactions that are only microbial are shown with green numbers indicating the number of microbial species with the gene/enzyme to mediate the reaction). (B, D, F) Circular graphs where the lines indicate correlations between urinary metabolites and the colour (red: positive, blue: inverse) and thickness of the line indicate the magnitude of the correlation. Abbreviations: 2PY – N-methyl-2-pyridone-5-carboxamide, Ac – acetate, Gln – glutamine, Glu – glutamate, NMe – N-methyl, NMNA – N-methylnicotinate, NMND – N-methylnicotinamide, OH – hydroxy, Succ – succinyl, PAG – phenylacetylglutamine, Ph – phenyl, Tyr – tyrosine.
Aside from 2PY, several compounds are correlated with dietary amino acids, including the urinary amino acids histidine (r=0.20, q=2.33×10⁻¹⁵), leucine (r=0.13, q=8.33×10⁻⁷), tyrosine (r=0.10, q=5.01×10⁻⁵) and valine (r=0.15, q=3.35×10⁻⁹), and derivatives 1-methylhistidine (r=0.17, q=4.55×10⁻¹²) and 3-hydroxyisovalerate (r=0.12, q=2.92×10⁻⁶). However, this was not the case for urinary amino acids alanine, glutamine and isoleucine which did not correlate with dietary intake. For the first two of these amino acids this may reflect the fact that they are involved in multiple reactions, feeding into the tricarboxylic acid (TCA) cycle via transamination reactions to pyruvate and glutamate, respectively (see Figure 4C). TCA cycle intermediates citrate and succinate correlate positively (Figure 4D). The host-gut microbial co-metabolites hippurate, 4-hydroxyhippurate and 3-hydroxymandelate are all closely connected to tyrosine/phenylalanine metabolism (Figure 4E) and are strongly intercorrelated, whereas PAG, also in the same pathway, did not correlate with the other three (Figure 4F).
Urinary metabolites as indicators of healthy and unhealthy dietary patterns
We classified people as having healthy or unhealthy diets for five different dietary scores calculated using the same underlying nutrient data as our models: Nutrient-Rich Foods 9.3 (NRF)36, DASH-nutrient37 and three OMNIHEART (carbohydrate, MFA, protein)38 dietary scores. Each of the scores place different weights on various dietary components and hence are indicative of different dietary patterns. We used a multivariate regression model with Monte Carlo Cross-Validation39 to predict the top and bottom quartiles of each score using metabolites as predictors to illustrate the potential for use of urinary metabolites as objective markers of different dietary patterns.
The predictive model for NRF had 74–76% accuracy for the left-out samples in the U.S. data and area-under-the-receiver-operator-curve (AUROC) of 0.83–0.84 (Table 1). The other dietary scores were predicted with 71–72% (DASH), 71–72% (OMNIHEART-carbohydrate), 73–74% (OMNIHEART-MFA) and 73% (OMNIHEART-protein) accuracy, with AUROCs ranging from 0.79–0.82. We then used each U.S. model to predict people with healthy or unhealthy diets in an independent U.K. sample. For this we achieved accuracies of 73–74% (NRF), 62–68% (DASH), 66–70% (OMNIHEART-carbohydrate), 65–68% (OMNIHEART-MFA) and 65–68% (OMNIHEART-protein), with AUROCs of 0.66–0.84 (Table 1).
Table 1. Model statistics for classification of healthy and unhealthy dietary patterns in the U.K. population using the U.S. data.
The top and bottom quartiles of the Nutrient-Rich Foods 9.3 (NRF) index, DASH-nutrient, OMNIHEART-protein, OMNIHEART-carbohydrate and OMNIHEART-MFA scores for the U.S. population were used to define healthy and unhealthy dietary patterns in this population. The same cut-offs for the U.S. population were applied to the U.K. population. The 46 metabolites identified here were used to classify the dietary patterns in the U.S. data, from both urine collections combined, using a Monte-Carlo Cross-Validated (MCCV) Projections to Latent Structures model. Across the 1,000 MCCV models the U.S. data were used to classify diet patterns for each individual when they were not part of the training data set (based on an 80:20 split) to obtain unbiased estimates. The full U.S. model was used to classify the U.K. population. The cut-offs for top and bottom fifths of the U.S. population were used to split the U.K. data prior to data analysis.
| Training model | Test set | Validation set | |||
|---|---|---|---|---|---|
| Data | U.S. model combined | U.S. 1st urine | U.S. 2nd urine | U.K. 1st urine | U.K. 2nd urine |
| Nutrient Rich Food index | |||||
| Top quarter (n) a | 924 | 462 | 462 | 81 | 81 |
| Bottom quarter (n) a | 924 | 462 | 462 | 110 | 110 |
| R2Y b | 0.43 | ||||
| Q2Y b | 0.37 | 0.39 | |||
| AUROC b | 0.83 | 0.84 | 0.84 | 0.83 | |
| TPR b | 0.75 | 0.77 | 0.79 | 0.81 | |
| TNR b | 0.74 | 0.75 | 0.68 | 0.69 | |
| Accuracy b | 74.4% | 75.9% | 72.8% | 74.3% | |
| DASH-nutrient score | |||||
| Top quarter (n) a | 942 | 471 | 471 | 179 | 179 |
| Bottom quarter (n) a | 1448 | 724 | 724 | 100 | 100 |
| R2Y b | 0.29 | ||||
| Q2Y b | 0.26 | 0.25 | |||
| AUROC b | 0.81 | 0.80 | 0.66 | 0.70 | |
| TPR b | 0.77 | 0.73 | 0.64 | 0.68 | |
| TNR b | 0.69 | 0.70 | 0.59 | 0.67 | |
| Accuracy b | 72.1% | 71.4% | 62.0% | 67.7% | |
| OMNIHEART-carbohydrate score | |||||
| Top quarter (n) a | 1026 | 513 | 513 | 164 | 164 |
| Bottom quarter (n) a | 938 | 469 | 469 | 75 | 75 |
| R2Y b | 0.33 | ||||
| Q2Y b | 0.29 | 0.29 | |||
| AUROC b | 0.79 | 0.81 | 0.72 | 0.75 | |
| TPR b | 0.73 | 0.74 | 0.66 | 0.69 | |
| TNR b | 0.69 | 0.70 | 0.64 | 0.73 | |
| Accuracy b | 71.3% | 72.4% | 65.7% | 70.3% | |
| OMNIHEART-MFA score | |||||
| Top quarter (n) a | 942 | 471 | 471 | 177 | 177 |
| Bottom quarter (n) a | 1308 | 654 | 654 | 99 | 99 |
| R2Y b | 0.32 | ||||
| Q2Y b | 0.28 | 0.29 | |||
| AUROC b | 0.82 | 0.82 | 0.69 | 0.74 | |
| TPR b | 0.76 | 0.76 | 0.65 | 0.67 | |
| TNR b | 0.70 | 0.72 | 0.64 | 0.70 | |
| Accuracy b | 72.9% | 74.1% | 64.5% | 68.1% | |
| OMNIHEART-protein score | |||||
| Top quarter (n) a | 1078 | 539 | 539 | 190 | 190 |
| Bottom quarter (n) a | 1112 | 556 | 556 | 73 | 73 |
| R2Y b | 0.32 | ||||
| Q2Y b | 0.27 | 0.28 | |||
| AUROC b | 0.81 | 0.81 | 0.71 | 0.74 | |
| TPR b | 0.75 | 0.74 | 0.66 | 0.67 | |
| TNR b | 0.71 | 0.73 | 0.64 | 0.71 | |
| Accuracy b | 73.2% | 73.2% | 65.4% | 68.1% | |
The cut-offs for the bottom and top quartiles for the U.S. population were: 28.35 and 46.76 (for NRF), 1.0 and 3.0 (DASH-nutrient), 0.5 and 3.0 (OMNIHEART-carbohydrate), 1.0 and 3.0 (OMNIHEART-MFA), 0.5 and 2.5 (OMNIHEART-protein), respectively.
R2Y: goodness of fit (training data); Q2Y: goodness of prediction (test set data); AUROC: area-under-receiver-operator-curve; TPR: true positive rate, defined as the number of participants correctly predicted as having a healthy dietary pattern based on their urinary metabolites divided by the total number of participants with a dietary score in the top quarter; TNR: true negative rate, defined as the number of participants correctly predicted as having an unhealthy dietary pattern based on their urinary metabolites divided by the total number of participants with a dietary score in the bottom quarter; accuracy is calculated as number of participants correctly predicted as having healthy or unhealthy dietary patterns divided by the total number of participants.
We then tested whether models based on first urine collections, using metabolites as predictors, could predict the metabotype in the second urine collections among U.S. participants. We found that the AUROC and classification accuracies for these models were similar to, or higher than, models where the U.S. dietary data were combined across the five dietary scores (AUROC: 0.81–0.89, accuracy: 72–81%) (Supplementary Table 5).
DISCUSSION
In this study of 1,848 people with high quality, repeated measurements of both diet and urine we measured a diverse set of urinary metabolites (the functional nutriome) with implications for understanding pathways leading from dietary intakes to disease. While poor diet is a major contributor to chronic disease40 it is extremely challenging to obtain accurate data on dietary patterns and intake. Traditional methods rely on self-reports which are prone to misreporting and bias, potentially resulting in erroneous associations between diet and disease risk1,3,4. Although there are a few biological markers of dietary intake, such as use of urinary potassium as proxy for fruit and vegetable intake41,42 and as an indicator of diet quality43, current dietary analysis is focussed on a limited set of nutrients which do not directly map to metabolic processes. In contrast, our urinary spectroscopic characterization objectively captures the end-products of metabolism and overcomes the problem of reporting bias in dietary records; it is readily scalable as it takes just five minutes to obtain an 1H-NMR spectrum containing hundreds of metabolites measured simultaneously.
We propose that the metabolome can be used as proxy measurement to understand functional relationships between nutrients and health outcomes (Figure 1, Supplementary Discussion). For example, sodium and calcium are well-known to relate to blood pressure27,44 and previous studies have reported associations of formate with blood pressure9 and citrate and formate with renal function26,45. Here we observed associations between urinary sodium and calcium with citrate and formate. Likewise, prolinebetaine has been reported to have an inverse relationship with blood pressure and obesity26,33 and used as biomarker for assessment of dietary citrus fruit intake18. Here we confirmed the structural elucication of 2-hydroxy-2-(4-methylcyclohex-3-en-1-yl)propoxyglucuronide, another marker of citrus fruit intake that has previously only been tentatively identified34, from NMR and mass spectrometric data. Host-gut microbial co-metabolites hippurate, 4-hydroxyhippurate, 3-hydroxymandelate and PAG were previously reported in relation to blood pressure9 and obesity26 and they were associated here with different nutrients. We found that PAG did not cluster with the others which might relate to metabolic processes in different parts of the gut (proximal versus distal colon, Supplementary Discussion).
We have previously demonstrated the potential for assessing diet using urinary metabotyping in a dietary intervention study17. We show here in observational data that 46 metabolites can differentiate between people with healthy and unhealthy dietary patterns measured by five different dietary scoring systems that focus on nutrients, and nutrient-rich foods (rather than food (group)-based scores). Our findings suggest that the urinary metabolic profile has utility as an objective measure to classify people according to their adherence with healthy dietary patterns in free-living populations.
The two most stable metabolites over the 3-week period in our data were urinary pantothenic acid and NMNA. The former is present in many foods mostly as a coenzyme-A adduct or as component of phosphopantetheine. NMNA concentrations in blood have previously been found to be highly stable in individuals over a year-long period46. Other metabolites, notably dimethylamine and trimethylamine-N-oxide (as well as the associated PFAs) were not stable over the 3-week period. This may be explained by the fact that consumption of fish tends to vary quite markedly in individuals as it is not a staple of most people’s diets47.
Strengths and limitations.
The design of the INTERMAP study in U.S. and U.K. is cross-sectional, but with a short-term (3-week) follow-up for replication. We included 24-hr recall data for the day of, and the day before, the 24-hr urine collection and therefore may have underestimated excretion of nutrient-related metabolites occurring over a longer timescale. While 24-hr urine samples have the advantage over other methods (e.g. spot or overnight samples) in that they capture metabolic process information over an entire day, their collection is less practicable. Nonetheless, there are promising data to suggest that less burdersome methods may also be reflective of daily nutrient intakes17,48,49, including kinetic studies on timed excretions of specific metabolites33,50. 1H-NMR spectroscopy, while less sensitive than mass spectrometry, is exceptionally reproducible for measuring complex mixtures of metabolites in biofluids51–53 and detects abundant metabolites with high dynamic ranges that relate to a variety of metabolic pathways54. While we reproduced our findings (including adjustment for BMI and physical activity, see Supplementary Discussion and Supplementary Figure 7) and assessed metabolite stability, these data cannot be used to define a dietary score based on urine measurements alone due to the cross-sectional design. Any such endeavour should be validated in a controlled clinical trial (see Supplementary Discussion).
We recommend that our approach based on urinary spectroscopic data should be used alongside conventional dietary measurements to add functional information and reflect both short- and long-term dietary exposures. A standalone data visualization software program (NutriomeXplorer) allows deep exploration of the associations between nutrients and metabolites and is supplied as a readily accessible resource for further direct interrogation of our data beyond the associations reported here (Supplementary Figures 8–15). This work may lead to testing new biomarkers or biomarker profiles for intake of nutrients and to define functional nutritional phenotypes. We are currently at an early stage of this process and what is now needed is long-term follow-up studies to identify patterns of metabolites (metabotypes) that relate to chronic disease. In turn that knowledge may translate into new understanding of the biological pathways that characterize the transition from a healthy to unhealthy metabolic phenotype and hence give entry points for prevention and early intervention.
METHODS
INTERMAP study.
The international study of macro- and micronutrients and blood pressure (INTERMAP) was established to investigate dietary and other factors associated with blood pressure21. As well as eight blood pressure measurements, data obtained include four multi-pass 24-hr dietary recalls22, measurements of height and weight, questionnaire information on medical history, medication use and lifestyle, and two timed 24-hr urine collections for each of 4,680 men and women aged 40–59 from 17 field centers in four countries (Japan, People’s Republic of China, United Kingdom and United States of America).
Here we analyse data from the eight population samples from the U.S.A., comprising 2,195 participants. A total of 2,164 U.S. participants had complete dietary data as well as 1H-NMR data from the two 24-hr urine samples (Extended Data Figure 3). The first and third dietary recalls relate to the 24-hr period preceeding the two urine collections, while the second and fourth dietary recalls relate to the same 24-hr windows as the urine collections, obtained on average three weeks apart. We used the dietary recall data averaged over the first and second and the third and fourth 24-hr recalls to capture urinary excretions occurring within 24–48 hours of intake.
NMR spectroscopy.
High resolution 600 MHz 1H-NMR spectroscopy of urine samples from the 2,164 U.S. participants with complete data were obtained using a previously published protocol55. Free Induction Decays were Fourier transformed, referenced to an internal standard (Trimethylsilyl propionate, TSP), baseline corrected, and phase corrected using in-house software implemented in Matlab (R2014a, The Mathworks, Natick, MA, USA). Spectral regions containing water and urea (δ 4.5 to δ 6.4), TSP (δ −0.2 to δ 0.2), δ 0.2 to δ 0.5, δ −4.5 to δ −0.2 and δ 9.5 to δ 15.5 were removed; the remaining variables were binned using bin widths of 0.001 ppm resulting in 7,100 spectral variables and normalized using probabilistic quotient normalization56 to account for differences in dilution.
Metabolic outliers were excluded from the data set based on the Hotelling’s T2 statistic on the scores of Principal Component Analysis. The metabolic outliers (n = 132) were defined as participants whose scores, for either urine collection, mapped outside the Hotelling’s T2 ellipse with 95% confidence intervals (CI95)9. This left data on 2,032 U.S. individuals (Extended Data Figure 3). Extended Data Figure 1 shows a representative 1H-NMR spectrum of human urine with specific identified peaks labelled.
Subset Optimization by Reference Matching57 (STORM) and in-house databases were used to identify unknown signals. Confirmation of unknown signals was performed using a combination of a standard 1D 1H-NMR pulse sequence with water peak pre-saturation (noesypresat), 2D J-Resolved (JRES), 2D 1H-13C Hetero-nuclear Single Quantum Coherence (HSQC), 1H-1H Total Correlation Spectroscopy (TOCSY) and mass spectrometry experiments23. All NMR experiments were acquired using an AVANCE III Bruker spectrometer, operating at 600.29 MHz for 1H and equipped with a 5 mm, TCI, Z-gradient CryoProbe.
Inclusion criteria.
In order to assess the dietary data quality and identify under- and over-reporters, two commonly used methods58 were combined. The first method was to calculate the ratio between the expected protein intake based on urinary urea excretion and the protein intake calculated from dietary records, and the second was to calculate the ratio between the expected energy intake (based on gender, weight and physical activity) and the energy intake calculated from dietary records. For the first method (urea), the fraction of nitrogen in urea was calculated using the monoisotopic mass of each atom and multiplied by the excretion of urea (g/day) which yields the excretion of urea-nitrogen. Next, the total non-urea nitrogen was calculated59 by multiplying the weight (in kg) by 0.031. The sum of the urea-nitrogen and non-urea-nitrogen was divided by 0.1786, the estimated fraction of nitrogen in crude protein60. For the second method (energy), the expected energy intake was calculated using the Goldberg equation61, which utilizes Schofield’s equation62 to calculate the basal metabolic rate for men and women separately. A value of 1.3 was used for the physical activity level, which corresponds to the majority of the participants having seated work61. The ratios between the reported and estimated protein intake and the reported and estimated energy intakes were mapped as a multivariate distribution and the participants (n=184) that mapped outside the CI95 were excluded from data analysis (Extended Data Figure 3). This left a total of 1,848 U.S. individuals for the data analysis (Supplementary Table 6).
Nutrients.
For each of the 1,848 U.S. included participants, intake data for 76 nutrients as well as measurements of four urinary cations (sodium, potassium, calcium and magnesium – as proxy for dietary intakes) were reported relative to energy intake (g or mg or μg per 1000kcal), as a percentage of total energy intake (%) or in mmol/24-hr excretion, as appropriate. The nutrients were ordered in the data analysis based on sources of energy (mono-unsaturated fatty acids (MFAs), poly-unsaturated fatty acids (PFAs), saturated fatty acids (SFAs), trans-fatty acids (TFAs), alcohol, fibre, sugars and starch), dietary amino acids, and other compounds essential for metabolism (cholesterol, vitamins and related compounds, minerals and urinary measurements of four cations). The average (± s.d.) and median dietary intakes and urinary excretions of these variables for the U.S. INTERMAP population (n = 1,848) are tabulated in Supplementary Table 7.
We assessed the overall nutrient quality of the diet using five different dietary scoring systems. First, we used the Nutrient-Rich Foods 9.3 (NRF) index score36 to define groups of participants with different dietary patterns. The NRF 9.3 index score is highly correlated with the Healthy Eating Index, a measure of diet quality score established by the US Dietary Guidelines63. To calculate NRF 9.3 for total diet, we summed the percentage of daily values for nine nutrients to encourage (protein, dietary fibre, vitamins A, C and E, calcium, iron, potassium, and magnesium) and subtracted the sum of the percentage of maximum recommended values for three nutrients to limit (saturated fat, added sugar, and sodium) per 100 kcal. A high NRF 9.3 index indicates a high-nutrient quality per 100 kcal of the dietary pattern. Second, we calculated a commonly used DASH score based on nutrients37. Last, we used three different scores from the Optimal Macro-Nutrient Intake Trial for Heart Health (OMNIHEART) that place greater importance on carbohydrates, MFAs or protein in the score relative to DASH38.
Statistical analyses.
Partial correlation between the intake of each of 80 nutrients and each of the 7,100 1H-NMR variables was performed, adjusted for age, gender and population sample, for two 24-hr recalls (second and fourth) and each urine sample separately. Q-values were calculated using the Storey-Tibshirani False Discovery Rate64 (ST-FDR). To avoid false positive findings, we assessed a spectral variable to be significant if 1) the q-value was below 1%, 2) both adjacent spectral variables were also significant based on the q-value and 3) the sign of the partial correlation of the two adjacent variables was the same as for the sentinel variable26. For the purpose of reproducibility, we only report here associations that were found in both urine samples. Specifically, we noted all spectral variables that corresponded to the same metabolite and for each variable selected the least significant correlation across the two urine samples (to avoid reporting possible inflated values of a single variable). Then for each nutrient-metabolite association we chose the variable with the most significant correlation (often the top of a peak, which has the highest signal-to-noise, and a peak with the least overlap with peaks from other metabolites). This spectral variable was used for analyses going forward and to visualize the results as in Figure 2. The strength of association of a spectral variable is visualized using the Skyline projection (), which is similar to a Manhattan plot, but with incorporation of the sign of the association. Here, βi is the regression coefficient of the ith variable and qi is its corresponding q-value.
Additional models include further adjustments for BMI and physical activity (defined as the number of hours of moderate-hard physical activity per day), in addition to age, sex and population sample; the variable significance was determined in the same manner as for the initial analyses.
As noted above, most associations of urinary metabolites with nutrients have the highest correlations at the peak apex – which is expected due to the highest signal-to-noise at the apex. However, whereas the association of urinary calcium and, to a lesser extent, urinary sodium with citrate was direct at the peak apex (r=0.32, q=5.42×10−41), it was inverse (r=−0.33, q=1.11×10−44) on either side of the average position of the citrate peaks. The position of citrate peaks (see Extended Data Figure 1) varies depending on pH of the sample, but chemical shift variation (lower pH: higher frequency shift; higher pH: lower frequency shift) of citrate is not associated with calcium excretion (P=0.16). Boric acid was added to urine collection jars as bacteriostatic agent during sample collection, and borate forms complexes with diols such as citrate. The citrate-borate complex has chemical shifts similar to citrate52, therefore curve fitting was applied to the citrate and citrate-borate peaks to get a measure of the total urinary citrate. The citrate-borate complex, like citrate itself, is an effective chelating agent for calcium and other divalent cations. We obtained the P-value for the partial correlation between total urinary citrate and urinary calcium (and urinary sodium), ranked this alongside the P-value/q-value pairs from the initial analyses on the 7,100 1H-NMR variables, and inferred a q-value from linear interpolation across the closest P-value and its two neighbours among the the 7,100 1H-NMR variables.
To assess the reproducibility of nutrients and metabolites over time both intra-class correlations (ICCs) and partial ICCs (adjusted for age, sex and population sample) were calculated. ICCs were calculated as , where p is the number of repeated measurements (in this study p=2: two dietary recalls and two urine collections), VM the variance of mean across repeated measurements multiplied by p–1, and MV the mean of the variance across repeated measurements multiplied by p–1. The P-value is calculated using the F-value for the ICC (calculated as the ratio between VM and MV) with degrees of freedom and . The partial ICC (pICC) was calculated using the above equation where the data ( , n samples and p=2 columns) were adjusted for covariates age, sex and population sample before calculating VM and MV. First, and the covariate matrix ( ) were first mean-centered ( and ) followed by adjusting the data in column of using ( is mapped back to the original mean in case the means of the original data were different).
We used a Monte-Carlo Cross-Validated (MCCV) Projections to Latent Structures (PLS) model39 to predict healthy and unhealthy dietary patterns in participants using the urinary metabolites as predictors. Specifically, we built two sets of models for each of the five dietary scores. First, we grouped the first and second urine collections for the U.S. data and calculated 1,000 models. In each model the data (both urine samples) of 20% of participants was put aside (test set) and a (training) model build on the remaining 80% of the data. The different test sets were then predicted using the different training models to obtain measure of how well the model can predict unknown (left out) data. These models were then also applied to the INTERMAP U.K. population data as external validation set. Second, we built a model on the first urine collection only and predicted the second urine collection of the U.S. participants to determine how well individual urinary metabolite profiles (46 metabolites) of the first urine collections could predict the second time-point for each individual. The metabolite data used as input for the MCCV-PLS model was auto-scaled (the data for each metabolite was centered around the mean and then divided by the standard deviation) and for each model the optimal number of components was optimized using double-cross validation.
Metabolic reaction network.
The MetaboNetworks software35 provides a bioinformatic reconstruction of the pathway relationship observed in a real system, but constrained by the formalism of classical (e.g. Kyoto Encyclopedia of Genes and Genomes65 (KEGG)) representation. We used MetaboNetworks to build a custom metabolic reaction network database that includes reactions occurring in the human supra-organism with inclusion of those from different microbial species that are present in the gastrointestinal tract. For the INTERMAP study no microbiome data are available, therefore we included 3,204 bacterial species from the phyla actinobacteria, bacteroidetes, cyanobacteria, firmicutes, fusobacteria, proteobacteria, tenericutes and verrucobacteria, 105 fungal species from the phyla ascomycetes and basidomycetes, and 35 archaeal species from the phyla euryarchaeota and thaumarchaeota. These phyla make up 99% of the colonies commonly found in the human gut from bacteria66,67, fungi68 and archaea68,69. The constructed database considers that two metabolites are associated with each other if a biochemical reaction entry in KEGG indicates that they are a main reactant pair and the reaction is either mediated by an enzyme linked to Homo sapiens genes, an enzyme linked to a microbial gene (from a total of 3,344 species) or it is part of a spontaneous process. The network consists of boxes (with text or without) that are the metabolites (nodes) and each line (edge) connecting two nodes signifies a biochemical reaction where one metabolite is the substrate and the other the product (or vice versa). The network is superimposed onto a coloured map where the background shading indicates different pathways, based on closest affinity classification26. Metabolites found associated with one or more nutrients are visualized as a grey node. Compounds that connect these metabolites via the shortest paths in the database are represented either as white boxes with abbreviations/names (>2 associated reactions) or a white square (intermediate metabolite, 2 reactions). Supplementary Table 4 lists the abbreviations and full/common names for all named metabolites in the network.
From the global metabolic reaction network, we extracted subgraphs that represent specific parts of metabolism. These subgraphs are further annotated to either display the Homo sapiens genes and enzymes associated with reactions or to indicate the reactions that occur due to the microbiota and list how many species in the database have the enzymes to mediate each reaction.
Assessment of similarity.
Originating in plant science, the Jaccard index, originally termed “coefficient de communauté”70, can be used to investigate the similarity between two sets, say A and B. It is defined as the intersection of A and B divided by the union of A and B ( ). Therefore, the Jaccard index always lies between 0 (completely dissimilar) and 1 (identical). The Jaccard distance is defined as 1 – J and can be used as input for e.g. Hierarchical Cluster Analysis (HCA). The Jaccard index is not useful for our purposes, because in human biology there is not merely a presence or absence of metabolites in a biological system, but some may be significantly associated with an outcome with a direction of association (direct, inverse). Therefore, we propose a new metric which penalizes converse features, the Adjusted Coefficient of Commonality (ACC), to assess the similarity between metabolic profiles of nutrients ( ). In essence the ACC simply is the similarity minus the dissimilarity of “charged binary sets” (see Supplementary Materials). We propose to use this version as we are not only looking at statistical significance, but also at the sign of the association. Metabolites can be associated with nutrients in three ways: −1 (inverse and significant), 0 (not significant) or +1 (positive and significant). The ACC distance ( ) was used as clustering distance for HCA to identify clusters of nutrients based on their metabolic profile. The mathematical proof of the validity of the ACC distance, and a visual description (Supplementary Figure 16), are given in the Supplementary Materials.
The CI95 of the ACC was estimated by resampling the data. First, one charged set is sampled with replacement 1,000 times while the second charged set is kept constant. This same procedure is applied vice versa by keeping constant the first charged set and resampling the second. The resampling was performed using bootstrapping where the probability of associations (−1, 0 ,1) was weighted to reflect the observed proportion of these associations in the data.
Assessment of optimal number of clusters.
We have used the modularity71,72 to determine the optimal number of clusters based on the HCA dendrogram using average linkage. The modularity is a trade-off between the number of links within a cluster and the number of links from this cluster to other clusters. The optimal modularity is the one that maximizes the difference between the two terms73. The modularity is defined as , where Mn is the modularity for n clusters, n is the number of clusters, ak is the number of links in cluster k, g is a vertex, ng is the number of vertices in the network, Ck is cluster k and Dg is the degree of vertex g. This definition of the modularity depends on a threshold for whether there is a link between two vertices or not. When Dg is replaced with the sum of all links of vertex g, and ak is replaced by the sum of all links in cluster k, we do not need a threshold as the weight of a link determines the overall strength. The (weighted) modularity was compared against 1,000 random networks of the same degree distribution74 using a resampling scheme of the data distribution, and the optimal modularity was defined as the maximum value for the modularity that was also higher than all random alternatives, as random networks have non-zero values for the modularity71.
NutriomeXplorer.
The NutriomeXplorer can be obtained from different public repositories (Figshare: https://doi.org/10.35092/yhjc.12181938; Box: https://imperialcollegelondon.box.com/s/f1in5lsnoh1hej5b8bvqr14tt7uoaq2v) for Windows (35.4MB executable), Mac (37.0MB app) and Linux (42.7MB executable). It was tested on Windows 7, Windows 10 and MacOS Mojave (10.14.5) desktop systems. The basic layout of the NutriomeXplorer is an alternative visualization of the heatmap representation in Figure 2, where all associations are shown as a bipartite graph (Supplementary Figure 17). The NutriomeXplorer features a toolbar with buttons for each metabolic and nutrient cluster that were identified from Figure 2, two dropdown menus with each individual urinary metabolite and nutrient, and a reset button to return to the bipartite graph. Selecting a cluster or individual variable (urinary metabolite or nutrient) brings up a hierarchical tripartite graph for that variable (some examples are given in Supplementary Figures 8–15). The question mark button brings up a help screen that explains the hierarchical tripartite graph and its interpretation.
Supplementary Material
ACKNOWLEDGEMENTS
We thank the staff at local, national, and international centers for collecting the INTERMAP data and samples. A partial listing of colleagues can be found in 21.
Funding. J.M.P. is supported by a Rutherford Fund Fellowship at Health Data Research (HDR) UK (MR/S004033/1). I.G.-P. is supported by a National Institute for Health Research (NIHR) fellowship (NIHR-CDF-2017–10-032). G.F. is an NIHR Senior Investigator. E.H. is supported by a Premier’s Science Fellowship (Western Australia). INTERMAP is supported by the U.S. National Heart, Lung and Blood Institute (grants R01-HL050490, R01-HL084228 and R01-HL135486), and received funding from the Chicago Health Research Foundation, and national agencies in Japan (grant [A] 090357003) and the United Kingdom (project grant from the West Midlands National Health Service Research and Development, and grant R2019EPH from the Chest, Heart and Stroke Association, Northern Ireland). Infrastructure support was provided by the NIHR Imperial Biomedical Research Centre (BRC). P.E. and E.H. acknowledge support from the UK Dementia Research Institute at Imperial College London which receives funding from UK DRI Ltd. funded by the Medical Research Council, Alzheimer’s Society and Alzheimer’s Research UK.
Footnotes
COMPETING INTERESTS STATEMENT
The authors declare no conflict of interest. Funders had no role in study design.
DATA AND MATERIALS AVAILABILITY
The data reported in this manuscript are tabulated in the main paper and in the supplementary materials. The NutriomeXplorer software contains all nutrient-metabolite associations and can be obtained from two separate public repositories (Figshare: https://doi.org/10.35092/yhjc.12181938, Box: https://imperialcollegelondon.box.com/s/f1in5lsnoh1hej5b8bvqr14tt7uoaq2v). The data that support the findings of this study are available from the corresponding author upon request. Applications for access to the INTERMAP data can be made to the access committee (lead by L.V.H.).
CODE AVAILABILITY
The codes for executing the PLS, covariate-adjusted (O)PLS and simple orthogonal PLS/PLS-DA can be obtained from https://bitbucket.org/jmp111/capls/src/. The code for executing both the STOCSY and STORM algorithms can be obtained from https://bitbucket.org/jmp111/storm/src. The codes for calculating the ACC, ICC and partial ICC can be obtained from https://bitbucket.org/jmp111/nutriome/src (repository also contains a MATLAB version of the NutriomeXplorer). These can be executed in a MATLAB environment.
REFERENCES
- 1.Rosell MS, Hellenius ML, de Faire UH & Johansson GK Associations between diet and the metabolic syndrome vary with the validity of dietary intake data. Am J Clin Nutr 78, 84–90 (2003). [DOI] [PubMed] [Google Scholar]
- 2.Poslusna K, Ruprich J, de Vries JH, Jakubikova M & van’t Veer P. Misreporting of energy and micronutrient intake estimated by food records and 24 hour recalls, control and adjustment methods in practice. The British journal of nutrition 101 Suppl 2, S73–85, doi: 10.1017/S0007114509990602 (2009). [DOI] [PubMed] [Google Scholar]
- 3.Freisling H et al. Dietary reporting errors on 24 h recalls and dietary questionnaires are associated with BMI across six European countries as evaluated with recovery biomarkers for protein and potassium intake. The British journal of nutrition 107, 910–920, doi: 10.1017/S0007114511003564 (2012). [DOI] [PubMed] [Google Scholar]
- 4.Ioannidis JPA The Challenge of Reforming Nutritional Epidemiologic Research. JAMA : the journal of the American Medical Association 320, 969–970, doi: 10.1001/jama.2018.11025 (2018). [DOI] [PubMed] [Google Scholar]
- 5.Brennan L & Hu FB Metabolomics-Based Dietary Biomarkers in Nutritional Epidemiology-Current Status and Future Opportunities. Molecular nutrition & food research 63, e1701064, doi: 10.1002/mnfr.201701064 (2019). [DOI] [PubMed] [Google Scholar]
- 6.Guasch-Ferre M, Bhupathiraju SN & Hu FB Use of Metabolomics in Improving Assessment of Dietary Intake. Clin Chem 64, 82–98, doi: 10.1373/clinchem.2017.272344 (2018). [DOI] [PMC free article] [PubMed] [Google Scholar]
- 7.Ulaszewska MM et al. Nutrimetabolomics: An Integrative Action for Metabolomic Analyses in Human Nutritional Studies. Molecular nutrition & food research 63, e1800384, doi: 10.1002/mnfr.201800384 (2019). [DOI] [PubMed] [Google Scholar]
- 8.Price ND et al. A wellness study of 108 individuals using personal, dense, dynamic data clouds. Nat Biotechnol 35, 747–756, doi: 10.1038/nbt.3870 (2017). [DOI] [PMC free article] [PubMed] [Google Scholar]
- 9.Holmes E et al. Human metabolic phenotype diversity and its association with diet and blood pressure. Nature 453, 396–400, doi: 10.1038/Nature06882 (2008). [DOI] [PMC free article] [PubMed] [Google Scholar]
- 10.Zeevi D et al. Personalized Nutrition by Prediction of Glycemic Responses. Cell 163, 1079–1094, doi: 10.1016/j.cell.2015.11.001 (2015). [DOI] [PubMed] [Google Scholar]
- 11.Nicholson JK & Wilson ID High-Resolution Proton Magnetic-Resonance Spectroscopy of Biological-Fluids. Prog Nucl Mag Res Sp 21, 449–501, doi: 10.1016/0079-6565(89)80008-1 (1989). [DOI] [Google Scholar]
- 12.Gavaghan CL, Holmes E, Lenz E, Wilson ID & Nicholson JK An NMR-based metabonomic approach to investigate the biochemical consequences of genetic strain differences: application to the C57BL10J and Alpk:ApfCD mouse. Febs Lett 484, 169–174 (2000). [DOI] [PubMed] [Google Scholar]
- 13.Stella C et al. Susceptibility of human metabolic phenotypes to dietary modulation. J Proteome Res 5, 2780–2788, doi: 10.1021/Pr060265y (2006). [DOI] [PubMed] [Google Scholar]
- 14.Nicholson G et al. Human metabolic profiles are stably controlled by genetic and environmental variation. Mol Syst Biol 7, doi: 10.1038/Msb.2011.57 (2011). [DOI] [PMC free article] [PubMed] [Google Scholar]
- 15.Heinzmann SS et al. Stability and Robustness of Human Metabolic Phenotypes in Response to Sequential Food Challenges. J Proteome Res 11, 643–655, doi: 10.1021/Pr2005764 (2012). [DOI] [PubMed] [Google Scholar]
- 16.Claesson MJ et al. Gut microbiota composition correlates with diet and health in the elderly. Nature 488, 178-+, doi:Doi 10.1038/Nature11319 (2012). [DOI] [PubMed] [Google Scholar]
- 17.Garcia-Perez I et al. Objective assessment of dietary patterns by use of metabolic phenotyping: a randomised, controlled, crossover trial. The lancet. Diabetes & endocrinology 5, 184–195, doi: 10.1016/S2213-8587(16)30419-3 (2017). [DOI] [PMC free article] [PubMed] [Google Scholar]
- 18.Gibbons H et al. Demonstration of the utility of biomarkers for dietary intake assessment; proline betaine as an example. Molecular nutrition & food research 61, doi: 10.1002/mnfr.201700037 (2017). [DOI] [PubMed] [Google Scholar]
- 19.Scalbert A et al. The food metabolome: a window over dietary exposure. Am J Clin Nutr 99, 1286–1308, doi: 10.3945/ajcn.113.076133 (2014). [DOI] [PubMed] [Google Scholar]
- 20.Fenech M. Nutrition and genome health. Forum Nutr 60, 49–65, doi: 10.1159/000107067 (2007). [DOI] [PubMed] [Google Scholar]
- 21.Stamler J et al. INTERMAP: background, aims, design, methods, and descriptive statistics (nondietary). J Hum Hypertens 17, 591–608, doi: 10.1038/sj.jhh.1001603 (2003). [DOI] [PMC free article] [PubMed] [Google Scholar]
- 22.Dennis B et al. INTERMAP: the dietary data - process and quality control. J Hum Hypertens 17, 609–622, doi:DOI 10.1038/sj.jhh.1001604 (2003). [DOI] [PMC free article] [PubMed] [Google Scholar]
- 23.Posma JM et al. Integrated Analytical and Statistical Two-Dimensional Spectroscopy Strategy for Metabolite Identification: Application to Dietary Biomarkers. Analytical chemistry 89, 3300–3309, doi: 10.1021/acs.analchem.6b03324 (2017). [DOI] [PMC free article] [PubMed] [Google Scholar]
- 24.McLean RM Measuring population sodium intake: a review of methods. Nutrients 6, 4651–4662, doi: 10.3390/nu6114651 (2014). [DOI] [PMC free article] [PubMed] [Google Scholar]
- 25.Yi SS & Kansagra SM Associations of sodium intake with obesity, body mass index, waist circumference, and weight. American journal of preventive medicine 46, e53–55, doi: 10.1016/j.amepre.2014.02.005 (2014). [DOI] [PubMed] [Google Scholar]
- 26.Elliott P et al. Urinary metabolic signatures of human adiposity. Sci Transl Med 7, 285ra262, doi: 10.1126/scitranslmed.aaa5680 (2015). [DOI] [PMC free article] [PubMed] [Google Scholar]
- 27.Aburto NJ et al. Effect of lower sodium intake on health: systematic review and meta-analyses. BMJ 346, f1326, doi: 10.1136/bmj.f1326 (2013). [DOI] [PMC free article] [PubMed] [Google Scholar]
- 28.Teague C et al. Ethyl glucoside in human urine following dietary exposure: detection by H-1 NMR spectroscopy as a result of metabonomic screening of humans. Analyst 129, 259–264, doi: 10.1039/B314316n (2004). [DOI] [PMC free article] [PubMed] [Google Scholar]
- 29.Dahl H, Stephanson N, Beck O & Helander A. Comparison of urinary excretion characteristics of ethanol and ethyl glucuronide. Journal of analytical toxicology 26, 201–204 (2002). [DOI] [PubMed] [Google Scholar]
- 30.Svensson BG, Akesson B, Nilsson A & Paulsson K. Urinary-Excretion of Methylamines in Men with Varying Intake of Fish from the Baltic Sea. J Toxicol Env Health 41, 411–420 (1994). [DOI] [PubMed] [Google Scholar]
- 31.Zhang AQ, Mitchell SC & Smith RL Dietary precursors of trimethylamine in man: a pilot study. Food Chem Toxicol 37, 515–520 (1999). [DOI] [PubMed] [Google Scholar]
- 32.de Zwart FJ et al. Glycine betaine and glycine betaine analogues in common foods. Food Chem 83, 197–204, doi: 10.1016/S0308-8146(03)00063-3 (2003). [DOI] [Google Scholar]
- 33.Heinzmann SS et al. Metabolic profiling strategy for discovery of nutritional biomarkers: proline betaine as a marker of citrus consumption. Am J Clin Nutr 92, 436–443, doi: 10.3945/ajcn.2010.29672 (2010). [DOI] [PMC free article] [PubMed] [Google Scholar]
- 34.Pujos-Guillot E et al. Mass Spectrometry-based Metabolomics for the Discovery of Biomarkers of Fruit and Vegetable Intake: Citrus Fruit as a Case Study. J Proteome Res 12, 1645–1659, doi: 10.1021/pr300997c (2013). [DOI] [PubMed] [Google Scholar]
- 35.Posma JM, Robinette SL, Holmes E & Nicholson JK MetaboNetworks, an interactive Matlab-based toolbox for creating, customizing and exploring sub-networks from KEGG. Bioinformatics 30, 893–895, doi: 10.1093/bioinformatics/btt612 (2014). [DOI] [PMC free article] [PubMed] [Google Scholar]
- 36.Drewnowski A. Defining nutrient density: development and validation of the nutrient rich foods index. Journal of the American College of Nutrition 28, 421S–426S (2009). [DOI] [PubMed] [Google Scholar]
- 37.Mellen PB, Gao SK, Vitolins MZ & Goff DC Deteriorating dietary habits among adults with hypertension. Arch Intern Med 168, 308–314, doi:DOI 10.1001/archinternmed.2007.119 (2008). [DOI] [PubMed] [Google Scholar]
- 38.Molitor J et al. Blood pressure differences associated with Optimal Macronutrient Intake Trial for Heart Health (OMNIHEART)-like diet compared with a typical American Diet. Hypertension 64, 1198–1204, doi: 10.1161/HYPERTENSIONAHA.114.03799 (2014). [DOI] [PMC free article] [PubMed] [Google Scholar]
- 39.Posma JM et al. Optimized Phenotypic Biomarker Discovery and Confounder Elimination via Covariate-Adjusted Projection to Latent Structures from Metabolic Spectroscopy Data. J Proteome Res 17, 1586–1595, doi: 10.1021/acs.jproteome.7b00879 (2018). [DOI] [PMC free article] [PubMed] [Google Scholar]
- 40.World Health Organization & Food and Agriculture Organization. Diet, nutrition and the prevention of chronic diseases. World Health Organization technical report series 916, i-viii, 1–149, backcover (2003). [PubMed] [Google Scholar]
- 41.Appel LJ et al. A clinical trial of the effects of dietary patterns on blood pressure. DASH Collaborative Research Group. The New England journal of medicine 336, 1117–1124, doi: 10.1056/NEJM199704173361601 (1997). [DOI] [PubMed] [Google Scholar]
- 42.Tasevska N, Runswick SA & Bingham SA Urinary potassium is as reliable as urinary nitrogen for use as a recovery biomarker in dietary studies of free living individuals. Journal of Nutrition 136, 1334–1340 (2006). [DOI] [PubMed] [Google Scholar]
- 43.Mente A, Irvine EJ, Honey RJD & Logan AG Urinary Potassium Is a Clinically Useful Test to Detect a Poor Quality Diet. Journal of Nutrition 139, 743–749, doi: 10.3945/jn.108.098319 (2009). [DOI] [PubMed] [Google Scholar]
- 44.Kesteloot H et al. Relation of urinary calcium and magnesium excretion to blood pressure: The International Study Of Macro- And Micro-nutrients And Blood Pressure and The International Cooperative Study On Salt, Other Factors, And Blood Pressure. American journal of epidemiology 174, 44–51, doi: 10.1093/aje/kwr049 (2011). [DOI] [PMC free article] [PubMed] [Google Scholar]
- 45.Garcia-Perez I et al. Urinary Metabolic Phenotyping the slc26a6 (Chloride-Oxalate Exchanger) Null Mouse Model. J Proteome Res 11, 4425–4435, doi: 10.1021/pr2012544 (2012). [DOI] [PMC free article] [PubMed] [Google Scholar]
- 46.Midttun O, Ulvik A, Nygard O & Ueland PM Performance of plasma trigonelline as a marker of coffee consumption in an epidemiologic setting. Am J Clin Nutr 107, 941–947, doi: 10.1093/ajcn/nqy059 (2018). [DOI] [PubMed] [Google Scholar]
- 47.Whitton C et al. National Diet and Nutrition Survey: UK food consumption and nutrient intakes from the first year of the rolling programme and comparisons with previous surveys. The British journal of nutrition 106, 1899–1914, doi: 10.1017/S0007114511002340 (2011). [DOI] [PMC free article] [PubMed] [Google Scholar]
- 48.Iwahori T et al. Six random specimens of daytime casual urine on different days are sufficient to estimate daily sodium/potassium ratio in comparison to 7-day 24-h urine collections. Hypertension research : official journal of the Japanese Society of Hypertension 37, 765–771, doi: 10.1038/hr.2014.76 (2014). [DOI] [PubMed] [Google Scholar]
- 49.Wilson T et al. Spot and Cumulative Urine Samples Are Suitable Replacements for 24-Hour Urine Collections for Objective Measures of Dietary Exposure in Adults Using Metabolite Biomarkers. The Journal of nutrition 149, 1692–1700, doi: 10.1093/jn/nxz138 (2019). [DOI] [PubMed] [Google Scholar]
- 50.Garcia-Perez I et al. An Analytical Pipeline for Quantitative Characterization of Dietary Intake: Application To Assess Grape Intake. J Agric Food Chem 64, 2423–2431, doi: 10.1021/acs.jafc.5b05878 (2016). [DOI] [PubMed] [Google Scholar]
- 51.Dumas ME et al. Assessment of analytical reproducibility of H-1 NMR spectroscopy based metabonomics for large-scale epidemiological research: the INTERMAP study. Analytical chemistry 78, 2199–2208, doi: 10.1021/Ac0517085 (2006). [DOI] [PMC free article] [PubMed] [Google Scholar]
- 52.Smith LM et al. Large-Scale Human Metabolic Phenotyping and Molecular Epidemiological Studies-via H-1 NMR Spectroscopy of Urine: Investigation of Borate Preservation. Analytical chemistry 81, 4847–4856, doi: 10.1021/ac9004875 (2009). [DOI] [PMC free article] [PubMed] [Google Scholar]
- 53.Keun HC et al. Analytical reproducibility in H-1 NMR-based metabonomic urinalysis. Chem Res Toxicol 15, 1380–1386, doi:Doi 10.1021/Tx0255774 (2002). [DOI] [PubMed] [Google Scholar]
- 54.Nicholson JK et al. Metabolic phenotyping in clinical and surgical environments. Nature 491, 384–392, doi: 10.1038/nature11708 (2012). [DOI] [PubMed] [Google Scholar]
- 55.Holmes E et al. Detection of urinary drug metabolite (Xenometabolome) signatures in molecular epidemiology studies via statistical total correlation (NMR) spectroscopy. Analytical chemistry 79, 2629–2640, doi: 10.1021/Ac062305n (2007). [DOI] [PMC free article] [PubMed] [Google Scholar]
- 56.Dieterle F, Ross A, Schlotterbeck G & Senn H. Probabilistic quotient normalization as robust method to account for dilution of complex biological mixtures. Application in H-1 NMR metabonomics. Analytical chemistry 78, 4281–4290, doi: 10.1021/Ac051632c (2006). [DOI] [PubMed] [Google Scholar]
- 57.Posma JM et al. Subset Optimization by Reference Matching (STORM): An Optimized Statistical Approach for Recovery of Metabolic Biomarker Structural Information from (1)H NMR Spectra of Biofluids. Analytical chemistry 84, 10694–10701, doi: 10.1021/ac302360v (2012). [DOI] [PubMed] [Google Scholar]
- 58.Macdiarmid J & Blundell J. Assessing dietary intake: Who, what and why of under-reporting. Nutrition research reviews 11, 231–253, doi:Doi 10.1079/Nrr19980017 (1998). [DOI] [PubMed] [Google Scholar]
- 59.Maroni BJ, Steinman TI & Mitch WE A Method for Estimating Nitrogen Intake of Patients with Chronic Renal-Failure. Kidney international 27, 58–65, doi:Doi 10.1038/Ki.1985.10 (1985). [DOI] [PubMed] [Google Scholar]
- 60.Mariotti F, Tome D & Mirand PP Converting nitrogen into Protein - Beyond 6.25 and Jones’ factors. Critical reviews in food science and nutrition 48, 177–184, doi:Doi 10.1080/10408390701279749 (2008). [DOI] [PubMed] [Google Scholar]
- 61.Black AE Critical evaluation of energy intake using the Goldberg cut-off for energy intake : basal metabolic rate. A practical guide to its calculation, use and limitations. Int J Obesity 24, 1119–1130, doi:DOI 10.1038/sj.ijo.0801376 (2000). [DOI] [PubMed] [Google Scholar]
- 62.Schofield WN Predicting basal metabolic rate, new standards and review of previous work. Human nutrition. Clinical nutrition 39 Suppl 1, 5–41 (1985). [PubMed] [Google Scholar]
- 63.Fulgoni VL 3rd, Keast DR & Drewnowski A. Development and validation of the nutrient-rich foods index: a tool to measure nutritional quality of foods. The Journal of nutrition 139, 1549–1554, doi: 10.3945/jn.108.101360 (2009). [DOI] [PubMed] [Google Scholar]
- 64.Storey JD & Tibshirani R. Statistical significance for genomewide studies. P Natl Acad Sci USA 100, 9440–9445, doi: 10.1073/pnas.1530509100 (2003). [DOI] [PMC free article] [PubMed] [Google Scholar]
- 65.Kanehisa M & Goto S. KEGG: Kyoto Encyclopedia of Genes and Genomes. Nucleic acids research 28, 27–30, doi: 10.1093/nar/28.1.27 (2000). [DOI] [PMC free article] [PubMed] [Google Scholar]
- 66.Eckburg PB et al. Diversity of the human intestinal microbial flora. Science 308, 1635–1638, doi: 10.1126/science.1110591 (2005). [DOI] [PMC free article] [PubMed] [Google Scholar]
- 67.The Human Microbiome Project Consortium. Structure, function and diversity of the healthy human microbiome. Nature 486, 207, doi: 10.1038/nature11234 (2012). [DOI] [PMC free article] [PubMed] [Google Scholar]
- 68.Hoffmann C et al. Archaea and fungi of the human gut microbiome: correlations with diet and bacterial residents. Plos One 8, e66019, doi: 10.1371/journal.pone.0066019 (2013). [DOI] [PMC free article] [PubMed] [Google Scholar]
- 69.Gaci N, Borrel G, Tottey W, O’Toole PW & Brugere JF Archaea and the human gut: new beginning of an old story. World journal of gastroenterology : WJG 20, 16062–16078, doi: 10.3748/wjg.v20.i43.16062 (2014). [DOI] [PMC free article] [PubMed] [Google Scholar]
- 70.Jaccard P. Distribution de la flore alpine dans le bassin des Dranses et dans quelques régions voisines. Bulletin de la Société Vaudoise des Sciences Naturelles 37, 241–272, doi: 10.5169/seals-266440 (1901). [DOI] [Google Scholar]
- 71.Newman MEJ & Girvan M. Finding and evaluating community structure in networks. Physical Review E 69, 026113, doi: 10.1103/PhysRevE.69.026113 (2004). [DOI] [PubMed] [Google Scholar]
- 72.Guimera R & Nunes Amaral LA Functional cartography of complex metabolic networks. Nature 433, 895–900, doi: 10.1038/nature03288 (2005). [DOI] [PMC free article] [PubMed] [Google Scholar]
- 73.Wang Z & Zhang JZ In search of the biological significance of modular structures in protein networks. Plos Comput Biol 3, 1011–1021, doi: 10.1371/journal.pcbi.0030107 (2007). [DOI] [PMC free article] [PubMed] [Google Scholar]
- 74.Maslov S & Sneppen K. Specificity and stability in topology of protein networks. Science 296, 910–913, doi: 10.1126/science.1065103 (2002). [DOI] [PubMed] [Google Scholar]
Associated Data
This section collects any data citations, data availability statements, or supplementary materials included in this article.