
Figure 2.
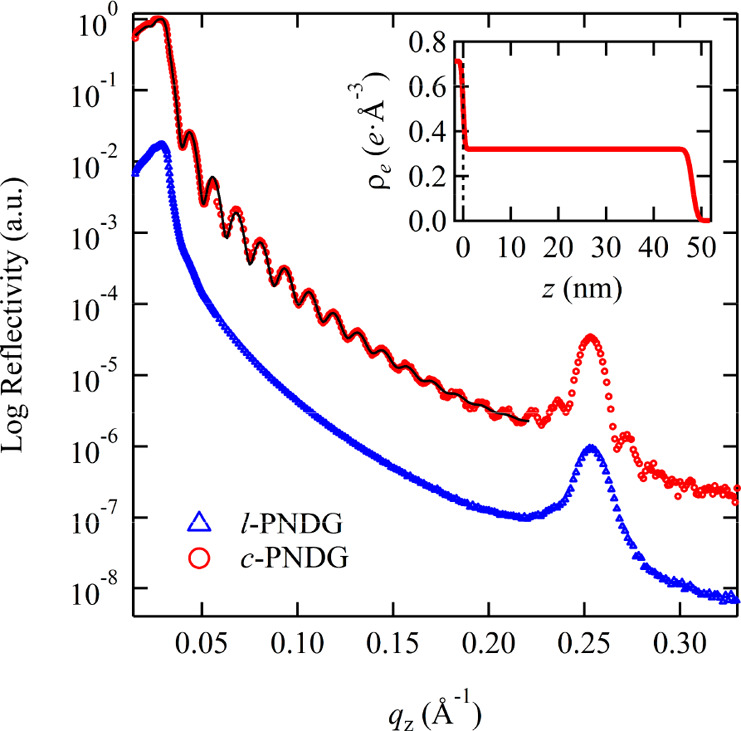
XRR curves of the 48 nm thick c-PNDG (red circles) and l-PNDG (blue triangles) films prepared on Si substrates after thermally annealed at 200 °C for 15 h. The solid black line corresponds to the best-fits of the electron density (ρe) profile against the distance (z) from the Si surface shown in the inset.