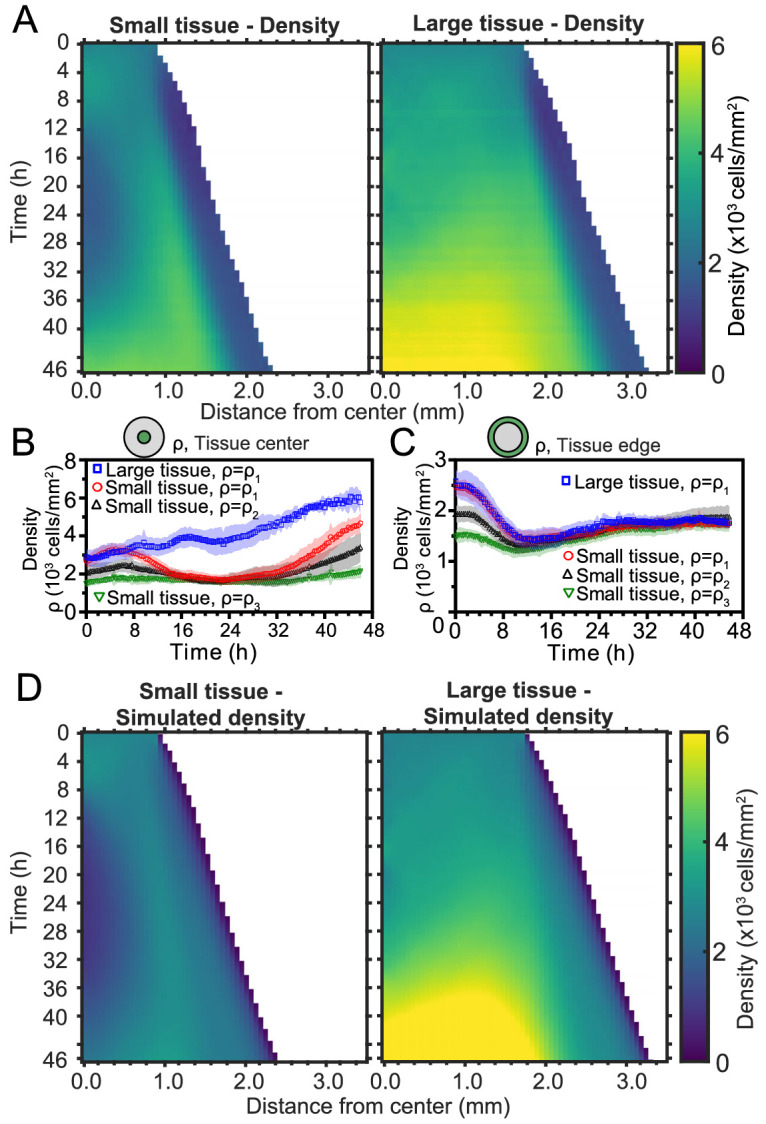
Figure 4. Spatiotemporal dynamics of cell density during epithelial expansion.
(A) Averaged kymographs of cell density for small (left, n = 11) and large (right, n = 9) tissues. Small tissues develop a central low-density region that persist more than 20 hr. (B) Cell density, ρ, at the center of large tissues increases gradually, while cell density at the center of small tissues has non-monotonic evolution. (C) For different initial tissue sizes and densities, the evolution of the cell density, ρ, at the boundary zone converges to similar values at about 12 hr, which coincides with the end of the overshoot of edge radial velocity in Figure 1D. Center and boundary zones are defined as in Figure 2B. (D) Simulated evolution of cell densities obtained from the numerical solution of the continuity equation using the average radial velocity measurements (Figure 2B) and a uniform and constant cell proliferation rate corresponding to a 16 h cell doubling time. In (B,C) the initial cell density ranges and number of replicates , , and are the same as in Figure 1D.


