

Abstract
A large fraction of human cancers contain genetic alterations within the Mitogen Activated Protein Kinase (MAPK) signaling network that promote unpredictable phenotypes. Previous studies have shown that the temporal patterns of MAPK activity (i.e. signaling dynamics) differentially regulate cell behavior. However, the role of signaling dynamics in mediating the effects of cancer driving mutations has not been systematically explored. Here, we show that oncogene expression leads to either pulsatile or sustained ERK activity that correlate with opposing cellular behaviors (i.e. proliferation vs. cell cycle arrest, respectively). Moreover, sustained–but not pulsatile–ERK activity triggers ERK activity waves in unperturbed neighboring cells that depend on the membrane metalloprotease ADAM17 and EGFR activity. Interestingly, the ADAM17-EGFR signaling axis coordinates neighboring cell migration toward oncogenic cells and is required for oncogenic cell extrusion. Overall, our data suggests that the temporal patterns of MAPK activity differentially regulate cell autonomous and non-cell autonomous effects of oncogene expression.
Research organism: Human
eLife digest
In animals, the MAPK pathway is a network of genes that helps a cell to detect and then respond to an external signal by switching on or off a specific genetic program. In particular, cells use this pathway to communicate with each other. In an individual cell, the MAPK pathway shows fluctuations in activity over time.
Mutations in the genes belonging to the MAPK pathway are often one of the first events that lead to the emergence of cancers. However, different mutations in the genes of the pathway can have diverse effects on a cell’s behavior: some mutations cause the cell to divide while others make it migrate. Recent research has suggested that these effects may be caused by changes in the pattern of MAPK signaling activity over time.
Here, Aikin et al. used fluorescent markers to document how different MAPK mutations influence the behavior of a human breast cell and its healthy neighbors. The experiments showed that cells with different MAPK mutations behaved in one of two ways: the signaling quickly pulsed between high and low levels of activity, or it remained at a sustained high level. In turn, these two signaling patterns altered cell behavior in different ways. Pulsed signaling led to more cell division, while sustained signaling stopped division and increased migration.
Aikin et al. then examined the effect of the MAPK mutations on neighboring healthy cells. Sustained signaling from the cancerous cell caused a wave of signaling activity in the surrounding cells. This led the healthy cells to divide and migrate toward the cancerous cell, pushing it out of the tissue layer. It is not clear if these changes protect against or promote cancer progression in living tissue. However, these results explain why specific cancer mutations cause different behaviors in cells.
Introduction
The Receptor-Tyrosine Kinase (RTK)/RAS/ERK signaling axis (Figure 1A) is mutated in most human cancers (Sanchez-Vega et al., 2018). In normal conditions, the ERK pathway promotes proliferation, differentiation, survival and cell migration (Johnson and Lapadat, 2002). During oncogenesis, mutations or amplification of ERK pathway components can also promote oncogene-induced senescence (Hahn and Weinberg, 2002) (OIS) or oncogenic cell extrusion from epithelial monolayers in the so-called Epithelial Defense Against Cancer response (EDAC) (Hogan et al., 2009; Kajita et al., 2010). The mechanisms underlying dose-dependent effects of ERK signaling have been intensely studied using bulk cell population assays. However, the advent of single-cell analysis has shown that single cells often behave qualitatively different than bulk populations. In fact, in vivo and in vitro studies have now shown that pulsatile or sustained ERK activity have different effects on cell behavior (Albeck et al., 2013; Aoki et al., 2013; de la Cova et al., 2017; Johnson and Toettcher, 2019; Santos et al., 2007; Bugaj et al., 2018; Aoki et al., 2017). Whether different oncogenic perturbations also have different functional outcomes depending on downstream signaling dynamics remains unknown. To address this question, an isogenic single-cell approach with temporal control of oncogene expression is needed.
Figure 1. Oncogenic ERK signaling dynamics promote qualitatively different cell behaviors.
(A) Schematic representation of the RTK/RAS/ERK signaling pathway. (B) MCF10A cells were transduced with lentiviral vectors expressing ERK KTR-mCerulean3 and ERK-mRuby2. The doxycycline inducible system (rTtA and TRE3G) was used to drive the expression of oncogenes during live imaging. Representative images of cytoplasmic and nuclear ERK-mRuby2 (top) and inactive or active ERK as reported by ERK KTR-mCerulean3 (bottom). Scale bar = 50 µm. (C) Cells described in B with indicated inducible oncogenes were imaged every 5 min for 6 hr upon doxycycline induction (2 µg/ml) at t = 0. Single cells were analyzed as described in methods. Population averages represent more than 1000 cells per condition. Shaded regions indicate the 25th-75th percentiles. (D) Quantification of data obtained in C. Single-cell counts of ERK activity peaks after induction (6–12 hr), ERK kinase localization fold change (final N/C ratio over basal N/C ratio per cell), and cell migration (final over basal distance traveled per cell) were extracted as described in methods. For proliferation analysis the fraction of S phase cells was measured using Edu incorporation and the change over the no dox control was calculated and normalized to the mean of parental cells (dashed line) (see Materials and methods). Data represents 36 independent observations.

Figure 1—figure supplement 1. A screen for oncogenic effects on ERK dynamics and cell behavior.

Figure 1—figure supplement 2. Relative expression of inducible genes.

Figure 1—figure supplement 3. Oncogene-induced cell behaviors are distinct from epithelial-to-mesenchymal transition (EMT).

Figure 1—video 1. Different ERK dynamics following oncogene induction.
Recent in vivo studies revealed that oncogene expression can trigger tissue level responses involving normal neighboring cells (Brown et al., 2017; Ellis et al., 2019; Clavería et al., 2013; Sancho et al., 2013). In specific cases, mosaic oncogene expression leads to either basal extrusion or apical extrusion (Hogan et al., 2009; Kajita et al., 2010); however, the signaling mechanism responsible for recognition between normal and diseased cells is poorly understood (Kajita and Fujita, 2015; Clavería and Torres, 2016; Maruyama and Fujita, 2017). Coincidentally, propagating ERK signaling waves requiring the sheddase ADAM17 have been observed in mouse epidermis and intestinal organoids, but the physiological role of these signaling events remains unclear (Hiratsuka et al., 2015; Muta et al., 2018). Observation of interactions between oncogenic and neighboring epithelium with live-cell biosensors could provide insights into the collective signaling preceding oncogenic extrusion. In fact, a recent study using live imaging of calcium biosensors during EDAC of HRASG12V cells showed a calcium signaling wave which propagated through neighboring epithelium to coordinate actin rearrangements and polarized movements during apical extrusion (Takeuchi et al., 2020). The mechanistic basis underlying EDAC calcium waves remains unknown.
Here, we combine live cell imaging of MAPK activity biosensors with inducible expression of oncogenes to study the effects of oncogene expression on signaling dynamics and how altered MAPK dynamics impact both cell autonomous and non-cell autonomous behaviors in epithelial tissues. Our data shows that pulsatile or sustained ERK signaling resulting from oncogenic perturbations triggers different dynamics-dependent cell behaviors including oncogene-induced paracrine signaling via the ADAM17-AREG-EGFR signaling axis. The resulting signaling gradients are required to coordinate neighboring cell migration and active oncogenic cell extrusion (EDAC). Our study highlights the role of MAPK signaling dynamics in coordinating individual and collective cell behaviors.
Results
To study the effects of oncogene expression on the temporal patterns of MAPK signaling we generated a reporter cell line derived from the chromosomally-normal human breast epithelial line, MCF10A, expressing the ERK Kinase Translocation Reporter (Regot et al., 2014) (ERK KTR) and a fluorescently tagged ERK kinase (ERK-mRuby2). This combination of biosensors allowed independent measurement of ERK activity and ERK localization in live single cells at high temporal resolution. Then, we introduced 12 different doxycycline-inducible oncogenic perturbations via lentiviral infection and measured ERK signaling dynamics during overexpression (Figure 1B). Our results revealed two qualitatively different responses to oncogene induction: (i) increased frequency of ERK activity pulses with no change in ERK kinase localization (i.e. EGFR, B-RafWT), and (ii) sustained ERK activity with subsequent nuclear translocation of ERK kinase (i.e. B-RafV600E, MEK2DD) (Figure 1, and Figure 1—Video 1). We refer to these distinct dynamics as pulsatile or sustained ERK, respectively. Of note, MEK1/2WT expression is capable of exporting ERK into the cytoplasm without changing kinase activity (Adachi et al., 2000; Figure 1—figure supplement 1) and ERK nuclear accumulation occurs only when activity is sustained, suggesting that ERK activity and ERK localization are not always correlated. Interestingly, expression of B-RafWT or B-RafV600E elicit qualitatively different downstream dynamics even though they differ in a single amino acid and show similar expression levels by immunoblotting (Figure 1—figure supplement 2). Given that the B-RafV600E is insensitive to negative feedback regulation by ERK (Yao et al., 2015), this result suggests that ERK inhibition to B-RafWT is mechanistically involved in the characteristic pulsatile dynamics.
Next, we assessed how ERK dynamics affect cell behaviors by measuring cell migration and proliferation. While pulsatile ERK dynamics (i.e. EGFR or B-RafWT) consistently correlated with increased cell cycle progression, sustained ERK activity (i.e. B-RafV600E or MEK2DD) caused cell cycle arrest and increased migration (Figure 1D). Importantly, observed differences in cell behavior correlated with dynamics independently of the point in the cascade that perturbations were introduced (EGFR, Raf or MEK), suggesting that ERK is responsible for differences in cell behaviors rather than alternate downstream pathways. Moreover, expression of B-RafWT or B-RafV600E, which activate the cascade at the same point, caused different ERK activity dynamics (i.e. pulsatile or sustained respectively) and triggered opposing cellular behaviors (Figure 1D). Taken together, these data suggest that ERK activity dynamics can either promote or inhibit proliferation cell autonomously.
The sudden increase in migration and the loss of cell-cell contacts observed in cases where ERK activity is sustained (B-RafV600E and MEK2DD, Figure 1—Video 1) are reminiscent of phenotypes described for cells undergoing Epithelial-to-Mesenchymal Transition, or EMT (Hao et al., 2019). We sought out to address the role of EMT in oncogene-dependent cell behaviors by immunofluorescent staining of an epithelial marker E-Cadherin (E-Cad) and the mesenchymal marker N-Cadherin (N-Cad). While cell migration was clearly increased at 24 hr post-oncogene expression, cells retain E-Cad expression with no clear increase in N-Cad, as was observed in TGFβ-induced EMT (Figure 1—figure supplement 3). These results indicate that at the time points studied here, altered cell behaviors are either distinct from or precede those resulting from EMT.
To examine the non-cell autonomous effects of oncogene expression in epithelial monolayers, we cocultured ‘inducible’ cells (expressing doxycycline-inducible oncogenes, a constitutively expressed H2B-mClover, and the ERK biosensors) with ‘neighboring’ reporter cells (expressing ERK biosensors without inducible oncogenes) and monitored signaling dynamics upon induction (Figure 2A). Interestingly, expression of B-RafV600E, but not B-RafWT, resulted in waves of ERK activation of neighboring cells (Figure 2B–C and Figure 2—Video 1). This comparison suggests that oncogenic perturbations that elicit sustained ERK activity propagate ERK activity pulses to neighboring cells. In agreement, other oncogenes that triggered sustained, but not pulsatile, ERK activity also promoted ERK activity waves in the neighboring cells (Figure 2—figure supplement 1). By using KTRs for p38 and JNK, we observed that neighboring epithelia did not activate other the MAPK pathways (Figure 2—figure supplement 1). Notably, spontaneous cell death events were also followed by similar ERK signaling waves (Figure 2—Video 2), indicating that oncogene expression and cell death may be similarly perceived by neighboring cells.
Figure 2. Oncogene induction results in dynamics-dependent paracrine ERK signaling.
( A) Schematic representation of coculture assay. H2B-iRFP (magenta) and ERK KTR are expressed in all cells for segmentation and quantification. H2B-mClover (green) was used to label inducible cells. (B) BRAFWT or BRAFV600E inducible cells were cocultured at 10% with ERK KTR cells and treated with doxycycline (2 µg/ml). Representative images are shown. Scale bar = 100 µm. (C) BRAFWT or BRAFV600E cocultures, as in B, were treated with vehicle (+Media) or with doxycycline (+Dox, 2 µg/ml). Single cells were quantified as described in methods. ERK activity traces in inducible (top, green) and neighboring cells (bottom, black) are shown. Population averages and 25th-75th percentiles (shaded) are shown for n > 450 cells per coculture condition.

Figure 2—figure supplement 1. ERK dynamics-dependency of paracrine ERK activation.

Figure 2—video 1. Oncogene-induced ERK signaling waves.
Figure 2—video 2. Spontaneous cell-death induces ERK signaling waves.
We then addressed the mechanistic basis of oncogene-dependent paracrine signaling. Previous studies demonstrated that ERK waves in epithelial monolayers depend on the membrane-tethered sheddase ADAM17, which releases membrane-bound growth factors that activate EGFR signaling in adjacent cells (Aoki et al., 2013; Aoki et al., 2017; Hiratsuka et al., 2015). Thus, we hypothesized that oncogenic cell ADAM17 may be decoding ERK signaling dynamics to trigger growth factor release. To test this hypothesis, we generated an ADAM17 knockout (ADAM17KO) cell line (Figure 3A) and used it as either ‘inducible’ or ‘neighboring’ cells in our coculture assay. Live imaging of WT and ADAM17KO cocultures indicated that ADAM17 is necessary in inducible, but not neighboring cells, to trigger ERK waves in the monolayer (Figure 3B–C and Figure 2—Video 1). Therefore, ADAM17 decodes ERK activity dynamics in inducible cells to transmit ERK signaling to neighboring cells. Previous work has shown that ADAM17 is weakly phosphorylated compared to other ERK substrates (Díaz-Rodríguez et al., 2002), thus the phosphorylation-dephosphorylation kinetics of ADAM17 and the temporal patterns of ERK activity may explain dynamics-specific ADAM17 activation.
Figure 3. ERK activity waves require ADAM17 release of AREG and neighboring cell EGFRs.

(A) Immunoblot against ADAM17 and HSC70 in WT and ADAM17KO cells generated by CRISPR-Cas9 editing (see Materials and methods for details). (B) Representative images of ADAM17KO BRAFV600E inducible cells cocultured and treated as in Figure 2B. (C) ADAM17KO cells (gray boxed traces) were used as inducible cells (right) or neighboring cells (left) in cocultures. Data for n > 1100 cells is presented as in Figure 2C. (D) ADAM17 substrates profiled by TMT mass spectrometry. Supernatants from ADAM17KO or WT cells expressing (+Dox) or not expressing (-Dox) BRAFV600E were collected and analyzed by Tandem-Mass-Tag (TMT) mass spectrometry as described in methods. Scatter plots show the natural log of fold change values of all statistically significant (p<0.05) proteins in both WT vs. ADAM17KO and +Dox vs. -Dox comparisons. Grey boxes indicate >1.5 fold change. (E) BRAFV600E co-cultured monolayers were plated as in Figure 2C and pretreated with indicated inhibitors (MEKi, 5 µM PD0325901; EGFRi, 5 µM Gefitinib) for one hour before induction with doxycycline (2 µg/ml). Representative single cell traces and population averages for n > 1000 cells are shown as in 2C. (F) MEK2DD co-cultured monolayers were plated as in Figure 2C and pretreated with indicated inhibitors (MEKi, 5 µM PD0325901; AREG FB Ab, 50 µg/ml function-blocking antibody) for one hour before induction with doxycycline (2 µg/ml). Representative single cell traces and population averages for n > 1000 cells are shown as in Figure 2C. (G) Schematic representation of ADAM17-AREG-EGFR paracrine signaling.
ADAM17-released growth factors include HB-EGF, TGF-α, Epiregulin, and Amphiregulin (Zunke and Rose-John, 2017; Rios-Doria et al., 2015). In order to identify the factors mediating oncogene-induced paracrine signaling we used Tandem-Mass-Tag Mass Spectrometry of supernatant proteins following induction of sustained ERK activity in WT and ADAM17KO cells. A variety of known and unknown ADAM17 substrates were present in the induced cell supernatants, including immune surveillance (HLA-A/B/C), Delta-Notch (JAG1), and Wnt (SFRP) signaling proteins (Figure 3D and Supplementary file 1). Of note, the EGFR ligand Amphiregulin (AREG) was the most upregulated, ADAM17-dependent protein in the supernatant, suggesting that AREG released from inducible cells could act as an oncogene-dependent paracrine signaling molecule. Accordingly, cocultures pre-incubated with AREG function-blocking antibodies or EGFR inhibitors prevented neighboring cell ERK activation without affecting ERK signaling in inducible cells (Figure 3E–F). These results indicate that oncogene-dependent ERK waves are mediated by ADAM17 (in inducible cells), AREG release, and EGFR signaling (Figure 3G).
Given that cells surrounding B-RafV600E expressing cells showed pulsatile ERK activity (Figure 2C), we hypothesized that oncogene expression may promote cell proliferation in a non-cell autonomous manner. Accordingly, sustained ERK signaling in inducible cells increased proliferation of neighboring cells up to 10-fold (Figure 4A–C). Together, these data indicate that, depending on ERK dynamics, oncogenic cells can have either cell autonomous or non-cell autonomous contributions to tissue growth.
Figure 4. Paracrine ERK signaling leads to non-cell autonomous proliferation.
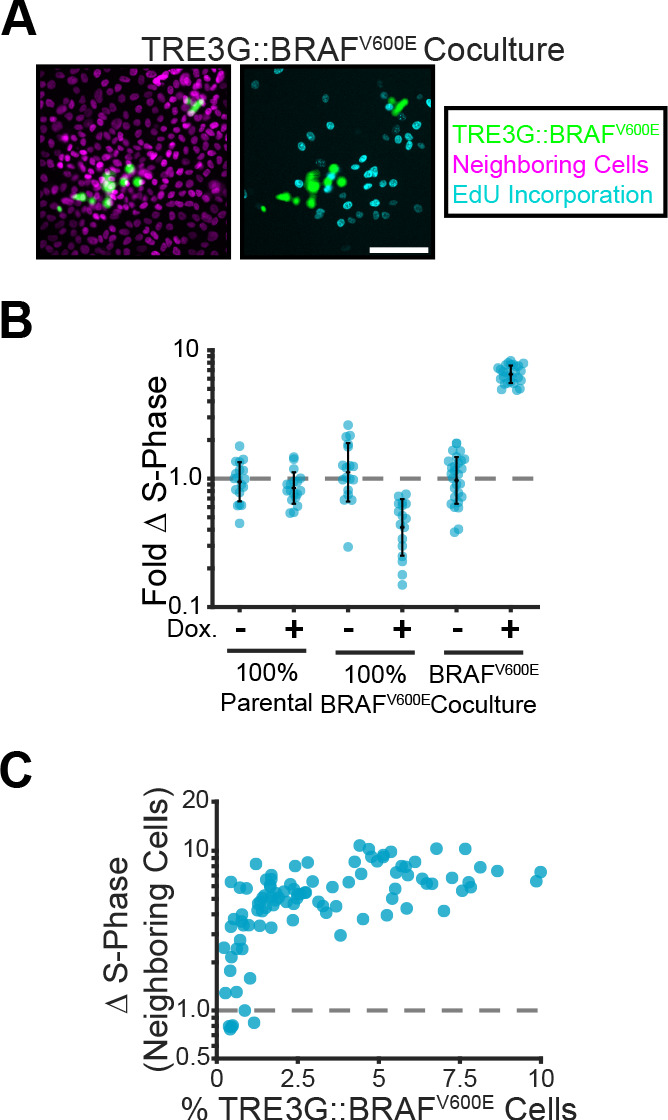
(A) Representative images of BRAFV600E cocultures treated with doxycycline and EdU as described in methods. Inducible cell nuclei (H2B-mClover, green), all nuclei (H2B-iRFP, magenta) and EdU staining (cyan) are shown. Scale bar = 100 µm. (B) Indicated monolayers were cultured and incubated with or without doxycycline for 24 hr. The change in S-phase cell fractions was determined by EdU incorporation as described in methods and normalized to parental mean (dashed line). Bar represents mean and standard deviation for n ≥ 16 observations. (C) Inducible BRAFV600E cocultures were plated at different proportions and labelled with EdU as in A. The fold-change in S-phase cell fractions is plotted against the percent of BRAFV600E-expressing cells for each position. 98 total observations shown.
In addition to proliferation, ERK waves have been shown to orient collective cell migration during wound healing (Aoki et al., 2017). In cocultures, sustained ERK activity in B-RafV600E-inducible cells correlated with neighboring cell migration towards inducible cells in an ADAM17 and EGFR-dependent manner (Figure 5A). We hypothesized that coordinated migration of neighboring cells could physically contribute to oncogenic cell extrusion (Hogan et al., 2009; Leung and Brugge, 2012; Slattum et al., 2014). To address this hypothesis, we used confocal Z stacks to quantify extrusion of oncogene-expressing cells from monolayers (Figure 5B and Figure 5—Video 1). Interestingly, while pulsatile ERK activity (i.e. EGFR and B-Raf) was not sufficient to extrude cells, sustained ERK activity (i.e. B-RafV600E and MEK2DD) led to efficient epithelial cell extrusion apically (Figure 5C). KRASG12V induction did not result in apical extrusion to the extent observed for HRASG12V (Hogan et al., 2009, Figure 5—figure supplement 1). However, since sustained ERK activation in KRASG12V occurs later than B-RafV600E (Figure 1—figure supplement 1) further apical extrusion may also occur at a later time. Taken together, our data suggests that apical extrusion occurs when oncogenic perturbations trigger sustained ERK activity.
Figure 5. Paracrine ERK activation coordinates extrusion of aberrantly signaling cells through directed migration of the neighboring epithelium.
(A) Inducible BRAFV600E cells (WT or ADAM17KO) were plated in 1% cocultures and treated with doxycycline (2 µg/ml) in the presence or absence of EGFR inhibitor gefitinib (5 µM) as indicated. Radial histograms represent migration angle distributions of neighboring cells before (grey) and 2–6 hr after (cyan) induction (see Materials and methods). Data represents angles from n > 1000 cells from 10 independent observations per condition. Data was assessed using subsampling and a two-sample KS test with ‘ns’ not significant, ***p<0.001 (see Materials and methods). (B) 10% BRAFV600E cocultured monolayers were seeded as described in methods. After 24 hr with doxycycline (2 µg/ml), monolayers were imaged by spinning disk confocal. Representative orthogonal Z projections and probability densities for nuclear height of inducible (green) and neighboring (grey) cells are shown (see methods). Extrusion (ΔZ) is calculated as the height difference between gaussian-fitted maxima of the green and black distributions. (C) 10% cocultures of indicated parental or inducible cells were treated with 24 hr doxycycline (2 μg/ml), imaged, and analyzed as in B. Data represents difference in nuclear height (ΔZ) for n = 18 observations normalized to the mean height of parental cells (dashed line), with mean and +/- standard deviation (black bars). Significance was calculated by two-sample t-test with ‘ns’ indicating no significance, ***p<0.001. (D) Representative basal and apical images (+6 µm) of WT or ADAM17KO, BRAFV600E inducible cells (green) in WT monolayers (red) after 24 hr of doxycycline treatment. (E) 10% BRAFV600E cocultures were pretreated with inhibitors (MEKi, 5 μM PD0325901, MPi, 5 μM Batimastat, EGFRi, 5 μM Gefitinib) and 24 hr doxycycline (2 μg/ml) or media, imaged and analyzed as in B. Data represents difference in nuclear height (ΔZ) for n ≥ 16 independent observations presented as in C. (F) Inducible MEK2DD cells were plated in 1% cocultures and treated with doxycycline (2 µg/ml) in the presence of MEK inhibitor (MEKi, 5 µM PD0325901) or amphiregulin function-blocking antibody (AREG FB Ab, 50 ng/ml) as indicated. Radial histograms are presented as in A for angles of n > 100 cells from two to three independent observations per condition. Data was assessed using subsampling and a two-sample KS test with ‘ns’ not significant, ***p<0.001 (see methods). (G) 10% MEK2DD cocultures were pretreated with MEK inhibitor (MEKi, 5 µM PD0325901) or Amphiregulin function-blocking antibody (AREG FB Ab, 50 ng/ml) and 24 hr doxycycline (2 µg/ml) or media, as indicated, then imaged and analyzed as in B-C. Data represents difference in nuclear height (ΔZ) for n ≥ 11 independent observations normalized to the mean height of media-treated MEK2DD cells (dashed line), with mean and +/- standard deviation (black bars). Significance was calculated by two-sample t-test with ‘ns’ indicating no significance, **p<0.01, and ***p<0.001.

Figure 5—figure supplement 1. KRASG12V expressing cells do not extrude at 24 hr.

Figure 5—figure supplement 2. Actin dynamics and sphingosine kinase requirements during oncogenic cell extrusion.

Figure 5—video 1. Extrusion of BRAFV600E-Expressing Cells.
Figure 5—video 2. Live actin dynamics during extrusion.
In mammalian epithelia, apical extrusion eliminates apoptotic cells or crowded cells to maintain homeostasis (Rosenblatt et al., 2001; Eisenhoffer et al., 2012). Similar, but mechanistically different, apical extrusion has been observed for some oncogenic cells during EDAC (Kajita and Fujita, 2015). We wanted to know whether the extrusion of inducible cells with sustained ERK activity resembled EDAC. To differentiate between pseudostratified or de-laminated (Grieve and Rabouille, 2014) epithelium and extrusion we analyzed confocal images of E-cad membrane staining in induced cocultures. Cells with sustained ERK activity were fully extruded, sitting above WT cells in the plane of the monolayer (Figure 5—figure supplement 2). These images also demonstrate maintenance of E-Cad at the junctions between WT cells below extruded cells. Quantification of fully-extruded cells at several timepoints showed the majority of oncogenic cells being extruded from 4 to 8 hr after induction, but continuing until 24 hr, when 91% of inducible cells are fully extruded.
Both the oncogenic and apoptotic extrusion models involve cytoskeletal rearrangements at the site of extrusion (Rosenblatt et al., 2001; Kajita and Fujita, 2015). To observe live actin dynamics in cocultures, we made cell lines stably expressing Utrophin-261-EGFP (Belin et al., 2014). Using this tool, we observed transient accumulation of actin at the basal interface of B-RafV600E expressing and neighboring cells that first closed off the basal attachments of inducible cells before they were pushed apically out of the monolayer (Figure 5—figure supplement 2 and Figure 5—Video 2). These polarized, actin-containing basal protrusions were dependent on EGFR activity as they could be inhibited by EGFR inhibitor. Apoptotic extrusion relies on Sphingosine-1-phosphate (S1P) signaling through intrinsic S1P production and juxtracrine activation of the GPCR S1PR2 (Gu et al., 2011), yet inhibition of S1P production had only moderate effects on apical extrusion of MEK2DD cells (Figure 5—figure supplement 2). Together, our results suggest that the apical extrusion of oncogenic cells observed in our experiments are similar to the EDAC mechanism previously described for HRASG12V, V-Src, and other cells (Hogan et al., 2009; Kajita et al., 2010; Kajita and Fujita, 2015).
The requirement for paracrine signals in collective migration led to the question of whether paracrine signals were also required for extrusion. To test the role of ADAM17-mediated AREG-EGFR paracrine signals in promoting extrusion, we performed extrusion assays using ADAM17KO cells or in the presence of EGFR inhibitor or AREG function-blocking antibodies. Extrusion of inducible cells was abolished in these conditions (Figure 5D–G), suggesting that ERK signaling waves are required for extrusion. Of note, since ADAM17KO and EGFR inhibition affect ERK activation of neighboring cells without altering ERK dynamics in inducible cells, we hypothesized that that activation of inducible cells alone is not sufficient for extrusion, but that neighboring cell ERK activation may be required. To address this question, ERK-independent ADAM17 activation is needed.
Previous studies have shown that the stress MAPK p38 phosphorylates and activates ADAM17 (Xu and Derynck, 2010). Thus, we used our doxycycline-inducible system to drive the expression of MKK3DD, a constitutively-active MAP2K specific for p38 (Figure 6—figure supplement 1), to activate ADAM17 independently of ERK. As expected, we found that p38 activation leads to ERK signaling waves (Figure 6A–B), proliferation (Xu and Derynck, 2010; Figure 6—figure supplement 2), directed migration (Figure 6C) and extrusion in an ADAM17 and EGFR dependent manner (Figure 6D and Figure 6—Video 1). However, B-RafV600E oncogenic signaling, extrusion and proliferation were unaffected by p38 inhibition (Figure 6—figure supplement 3), suggesting that sustained ERK or p38 activity are each capable of activating ADAM17 paracrine signaling. Using this ERK-independent MKK3DD extrusion system, we found that MEK inhibition decreased directed migration and prevented extrusion, confirming that extrusion requires ERK activity in the neighboring cells (Figure 6C–D). Thus, ERK activity is required for extrusion in both oncogenic and neighboring cells with qualitatively different temporal dynamics. Notably, inhibition of S1P signaling in MKK3DD cocultures also reduced extrusion efficiency despite having unaffected signaling (Figure 6—figure supplement 4). This result suggests that cell-autonomous ERK or p38 activation in extruded cells may underlie the fundamental differences reported between extrusion of oncogenic and stressed cells.
Figure 6. ERK activity in neighboring cells is required for coordinating extrusion.
(A) Representative images showing WT or ADAM17KO cells with inducible MKK3DD (green), cocultured at 10% with neighboring ERK-KTR cells (grey). Cocultures were treated with doxycycline (2 µg/m) in the presence of media, p38 inhibitor (5 µM BIRB-796), EGFR inhibitor (5 µM Gefitinib), or MEK inhibitor (5 µM PD 0325901). Scale bar = 100 µm. (B) ERK activity traces of neighboring cells in coculture with MKK3DD-inducible cells (WT or ADAM17KO) plated at 10%, pretreated with inhibitors (p38i, 5 µM BIRB 796; EGFRi, 5 µM Gefitinib; MEKi, 5 µM PD 0325901) and doxycycline (2 µg/ml) or media, and imaged as in Figure 2C. 15 representative neighboring cell ERK activity traces are shown for each condition. (C) Inducible MKK3DD cells (WT or ADAM17KO) were plated in 1% cocultures and treated with doxycycline (2 µg/ml) in the presence or absence of inhibitors. Radial histograms of migration angles before (grey) and 6–9 hr after (cyan) induction presented as in Figure 5A. Data represents angles from n > 900 cells from ≥6 observations per condition assessed using subsampling and a two-sample KS test with ‘ns’ not significant, *p<0.05, ***p<0.001 (see Materials and methods). (D) 10% MKK3DD cocultures were pretreated with inhibitors (p38i, 5 µM BIRB 796; EGFRi, 5 µM Gefitinib; MEKi, 5 µM PD 0325901) and 24 hr doxycycline (2 µg/ml) or media, imaged and analyzed as in Figure 5B–D. Data represents difference in nuclear height (ΔZ) for n ≥ 16 observations normalized to the mean height of parental cells (dashed line), with mean and +/- standard deviation (black bars). Significance was calculated by two-sample t-test with ‘ns’ indicating no significance, ***p<0.001.

Figure 6—figure supplement 1. MAPK specificity of MEK2DD and MKK3DD.

Figure 6—figure supplement 2. Mosaic p38 activation leads to ADAM17-EGFR -ependent proliferation of neighboring cells.

Figure 6—figure supplement 3. Oncogene-induced paracrine ERK activity and resulting cell behaviors are p38-independent.

Figure 6—figure supplement 4. Partial involvement of S1P signaling in extrusion of p38-active cells.

Figure 6—video 1. p38-induced ERK signaling waves.
Finally, we asked whether the spatiotemporal properties of paracrine ERK signaling waves are important to coordinate extrusion. We first tested the efficiency of extrusion with altered proportions of B-RafV600E cells in the coculture, as higher proportions will have de-centralized and overlapping signaling events. The proportion of inducible cells was inversely correlated with extrusion efficiency (Figure 7A). Moreover, exogenous addition of AREG, which triggers widespread ERK activation preventing any spatially defined waves, eliminated directed migration of neighboring cells and extrusion (Figure 7B–C). The observation that in cocultures, polarized actin enrichment in neighboring cell basal protrusions is absent with EGFR inhibition, also indicates that growth factor signaling provides directional information during extrusion (Figure 5—figure supplement 2). Together this data suggests that locally generated paracrine signaling coordinates directed migration of neighboring epithelia to promote extrusion of oncogenic cells (Figure 8).
Figure 7. Localized paracrine signals coordinate directed migration and extrusion.

(A) Inverse relationship between fraction of oncogenic cells in coculture and extrusion efficiency. Inducible BRAFV600E cells were cocultured at indicated proportions, treated 24 hr with doxycycline (2 µg/ml), imaged, and analyzed as in Figure 5B. Data represents difference in nuclear height (ΔZ) for n ≥ 15 observations presented as in 5C. (B) Inducible MKK3DD cells were plated in 1% cocultures and treated with doxycycline (2 µg/ml) in the presence or absence of Amphiregulin (20 ng/ml). Radial histograms of migration angles before (grey) and after (cyan) induction presented as in Figure 6C. Data represents angles of n > 900 cells from ≥6 observations assessed using subsampling and a two-sample KS test with ‘ns’ not significant, ***p<0.001 (see Materials and methods). (C) 10% MKK3DD cocultures were pretreated with Amphiregulin (20 ng/ml, green) and 24 hr doxycycline (2 µg/ml) or media, imaged and analyzed as in Figure 5B–D, and compared to selected conditions reproduced from Figure 6D (grey). Data represents difference in nuclear height (ΔZ) for n ≥ 16 observations normalized to the mean height of parental cells (dashed line), with mean and +/- standard deviation (black bars). Significance was calculated by two-sample t-test with ‘ns’ indicating no significance, ***p<0.001.
Figure 8. Graphical summary.

(A) Model summarizing cell autonomous and non-cell autonomous effects resulting from pulsatile and sustained ERK signaling dynamics.
Discussion
A wide variety of ERK pathway alterations occur across human tumors, often resulting in different cancer phenotypes (Sanchez-Vega et al., 2018; Bailey et al., 2018; Hoadley et al., 2018). To better understand the signaling effects of oncogenic mutations, we used live cell imaging of signaling biosensors upon induction of oncogenes and found that different ERK pathway oncogenes trigger two distinct temporal patterns: pulsatile or sustained ERK activity. While our approach is admittedly different than acquisition of point mutations in vivo, ERK dynamics resulting from oncogene overexpression robustly correlated with the same cellular phenotypes: (i) pulsatile ERK activity correlates with increased proliferation and, (ii) sustained ERK activity leads to cell cycle arrest similar to OIS (Hahn and Weinberg, 2002; Courtois-Cox et al., 2006; Kuilman et al., 2008). Moreover, we showed that sustained ERK activity in oncogenic cells triggers ERK signaling waves through unperturbed neighboring cells. These signaling waves depend on the ADAM17-EGFR paracrine signaling axis and lead to different non cell-autonomous behaviors such as (i) proliferation, (ii) directed migration of neighboring cells toward oncogenic cells, and (iii) oncogenic cell extrusion (Figure 8).
Our data indicates that cancer mutations can have non-cell autonomous contributions to tissue growth (Figure 4). Interestingly, studies in mouse epidermis have shown that mosaic oncogene expression promotes proliferation of wild type surrounding cells, which is required to expel mutant outgrowths from the tissue (Brown et al., 2017). While the role of ADAM17 in this phenomenon and during early tumorigenesis in vivo is yet unknown, it is tempting to speculate that polypous outgrowths may occur in the presence of non-proliferative oncogenic cells that release growth factors via ADAM17. The mechanisms that mediate tissue expelling in vivo remain unknown.
Previous work in described the process of oncogenic cell extrusion as part of the so called Epithelial Defense Against Cancer (i.e. EDAC) (Hogan et al., 2009). However, the signals involved in recognition of oncogenic cells, and why only specific oncogenes trigger oncogenic cell extrusion was unclear (Kajita and Fujita, 2015; Clavería and Torres, 2016; Maruyama and Fujita, 2017). Our data suggests that perturbations that elicit sustained ERK activity (eg. B-RafV600E, MEK2DD), activate ADAM17, which in turn releases EGFR ligands (Figure 3). This paracrine signal is critical for oncogenic extrusion (Figure 5). However, we acknowledge that different cellular states such as apoptosis or overcrowding lead to extrusion by different mechanisms. Of note, our data showed that ERK activation drives extrusion to a higher extent than p38 activation (Figure 6), which may result from a difference in overall cell autonomous migration in these two cases (Figure 6—figure supplement 1). Moreover, sphingosine kinase inhibition caused greater defects in extrusion of p38-active cells than ERK-active cells (Figure 5—figure supplement 2 and Figure 6—figure supplement 4). This finding agrees with work showing that EDAC of transformed HRASG12V cells is less dependent on sphingosine-1-phosphate production than extrusion of crowded or apoptotic cells (Yamamoto et al., 2016), where stress signaling may be involved.
We and others have identified AREG as one of the key EGFR ligands in mammary epithelial cells (Sternlicht et al., 2005; Figure 3); however, different ligands may be required in other tissues. These ligands, released by ADAM17, coordinate the migration of neighboring cells by mechanisms that remain unclear. Cultured monolayers are fundamentally different than in vivo tissues; however, the chemo-attractive properties of growth factors for directed migration have been modeled and studied in cell culture (Devreotes et al., 2017; Tranquillo et al., 1988). We propose that local signaling gradients are created by oncogenic cells to coordinate directed migration of neighbors. To support this idea, we show that addition of exogenous AREG or increased fractions of oncogenic cells both prevent directed migration of neighboring cells (Figure 7), and that during extrusion, polarized actin-containing basal protrusions require growth factor signaling (Figure 5—figure supplement 2). Localized ERK signaling gradients have also been observed during morphogenesis of Drosophila, avian, and mammalian embryos (Yang et al., 2002; Ogura et al., 2018; Corson et al., 2003), and in preserving homeostasis of mammalian epidermis and intestinal organoids (Hiratsuka et al., 2015; Muta et al., 2018; Liang et al., 2017). Thus, in addition to roles in oncogenesis, the ADAM17-EGFR paracrine signaling axis may direct collective behaviors during development.
Overall, our results highlight the importance of quantitative live-cell approaches to understand the effects of genetic perturbations and cell-cell communication in tissues. We propose a critical role for ERK signaling dynamics and the ADAM17-EGFR signaling axis in coordinating cell behaviors at the tissue level.
Materials and methods
Cell lines & reagents
MCF10A human mammary epithelial cells (ATCC) were grown at 37° and 5% CO2 in DMEM/F12 (Gibco) with 5% horse serum (HS) (Sigma), 10 µg/ml Insulin (Sigma), 20 ng/ml EGF (Peprotech), 1x Penicillin-Streptomycin (P/S) (Gibco), 0.5 mg/ml Hydrocortisone (Sigma), 100 ng/ml Cholera Toxin (Sigma). Cells were passaged every 3 days with 0.25% Trypsin-EDTA (Gibco), are mycoplasma free, and were verified by STR-profiling (ATCC).
Cell lines were generated with lentivirus produced in HEK293-FTs (Thermo) with third-generation packaging plasmids and Lipofectamine 2000 (Thermo). Viral supernatants were collected 48 hr after transfection and incubated in MCF10As with polybrene (10 µg/ml, EMD Millipore). To create dual-sensor cells, MCF10As were infected with a lentiviral H2B-iRFP vector (Addgene) and sorted. We used gateway cloning (Campeau et al., 2009) to introduce ERK-KTR-mCer3 and ERK1-mRuby2 into PGK pLenti DEST vectors (Addgene), infected and selected the H2B-iRFP MCF10As (Blasticidin 3 µg/ml and Hygromycin 10 µg/ml Corning). We isolated moderately expressing clones using cloning cylinders (EMD Milipore). For inducible cells, a gateway-ready reverse TET trans-activator (rtTA) plasmid was created by adding the rtTA with a 2A peptide to the Puromycin resistance gene in a CMV Puro DEST plasmid (Addgene) by gibson cloning (Gibson et al., 2009). Human coding sequences were acquired from either Addgene or the Thermo Ultimate ORF Collection, sequence verified, and introduced in the rtTA CMV Puro DEST plasmid by gateway cloning (Campeau et al., 2009). These plasmids were used for lentivirus, and infected cells were selected with Puromycin (1 µg/ml, Sigma). Utrophin-261-EGFP cell lines were made by cloning the coding region from pEGFP-C1 Utr261-EGFP (Addgene) into a pENTR backbone by Gibson cloning, and then introduced into the pLenti PGK Puro DEST plasmid by gateway cloning. These plasmids were used to generate lentivirus, and infected cells were selected with Puromycin.
For inhibitor experiments, small molecules or antibodies and doxycycline were dissolved to a 10X working concentration in imaging media before addition. Final DMSO concentration did not exceed 0.15%. Inhibitors used include the MEK inhibitor PD-0325901, the MMP/ADAM inhibitor Batimastat, the EGFR inhibitor Gefitinib, the p38 inhibitor BIRB-796, the Sphingosine Kinase inhibitor SKII, and the S1PR2, inhibitor JTE-013 all from Selleck Chemicals. The p38 inhibitor SB-203580 was obtained from Sigma. Amphiregulin was ordered from Peprotech. Amphiregulin function-blocking antibody is from R and D systems.
The ADAM17KO cell lines were created using the CRISPR V2 Neo system (a gift from Dr. Andrew Holland) and gRNA oligos targeting R241 of exon 6. Dual sensor cells were infected with lentivirus carrying this plasmid, selected with Neomycin (500 µg/ml, Sigma) and clonally expanded before western blot validation (Figure 2B).
Live imaging
Cells were plated at 3*105 cells/well in fibronectin-treated (EMD Millipore) 96-well glass-bottom plates (Thermo Scientific) 48 hr before imaging. The following day, monolayers were serum-starved with 0.5% HS, phenol-red-free DMEM/F12 containing P/S with 1 mM Na Pyruvate and 10 mM HEPES. For signaling experiments in Figure 1 and Figure 1—figure supplement 1, media was switched to 0% HS several hours before imaging to limit basal signaling. Monolayers were imaged using a Metamorph-controlled Nikon Eclipse Ti-E epifluorescence microscope with a 20x air objective and a Hamamatsu sCMOS camera. The multi LED light source SpectraX (Lumencor) and the multiband dichroic mirrors DAPI/FITC/Cy3/Cy5 and CFP/YPF/mCherry (Chroma) where used for illumination and imaging without any spectral overlap. For extrusion and live-actin experiments, a Metamorph-controlled Nikon Eclipse Ti-E spinning-disc confocal (Yokogawa W1) with a 20x or 40X objective, Prime 95-B sCMOS camera (Photometrics) and a Multiline laser launch (Cairn Research) was used to capture H2B-iRFP and H2B-mClover or Utrophin-261-EGFP images every 1 µm of a 25–30 µm range through monolayers. Temperature (37°C), humidity and CO2 (5%) were maintained throughout all imaging using OKO Labs control units. Sample sizes were selected by attempting to capture at least 100 cells from each population, with several hundred cells preferred. Key conditions from imaging experiments were performed at least twice, with one replicate presented in figures.
Image analysis and quantification
Primary time-lapse images were subjected to flat-fielding and registration (custom software Aikin et al., 2020) before object segmentation and measurements in Cell Profiler. Nuclear positions were used to track individual cells through time-series (custom software Aikin et al., 2020) and intensity ratios were calculated as previously described (Regot et al., 2014). Minimal cleaning of traces excluded cells where tracks switched between two objects, where the KTR ratios were affected by segmentation errors, or where traces represent less than two thirds of the entire time-course. In conditions where cells move rapidly, such as B-RafV600E and MEK2DD, and traces are shorter due tracking errors, track-length restraints were relaxed to include more cells for analysis. Single-cell traces were chosen by random plotting of distinct cells and selection of those that were tracked throughout the whole experiment. Peak counting was performed with software based on findPeaks (O'Haver, 2014; Mathworks.com) and modified to detect peaks based on the rate of change between gaussian-fitted minima and maxima from single-cell traces.
For directed migration, positions were selected where distinct groups of inducible cells were present in the center of the field of view. Migration was quantified by positional changes over 20 min intervals for specified time windows, from all WT neighboring cells within a 200 µM X 200 µM area centered on the group of inducible cells. The migration angles of neighboring cells are plotted as radial histograms where 0° indicates migration directly towards, and 180° directly away from the center of isolated inducible cell groups. Migration datasets contain many sampled angles from large populations of cells. To overcome issues with high power, we applied subsampling techniques using 1000 iterations of 1000 randomly-selected migration angles each, and presented the median Two-Sample Kolmogorov-Smirnov (KS) Test P-values from these iterations (‘ns’, not significant, *p<0.05, **p<0.01, ***p<0.001).
For extrusion experiments, histograms of mClover and mRuby pixel intensities across each z-stack were fit to gaussian curves using Matlab. The difference in gaussian fitted maxima of inducible cells and neighboring cells for each observation are plotted. Extrusion experiment sample size represents all non-overlapping positions from 2 to 3 independent wells excluding outliers resulting from imaging artifacts. Two-sample T-test significance values compare indicated conditions (‘ns’, not significant, *p<0.05, **p<0.01, ***p<0.001).
For live-actin imaging experiments, ERK-KTR, H2B-iRFP were infected with the TRE3G::BRAFV600E. These cells were plated in 1% coculture with neighboring ERK-KTR, H2B-iRFP cells containing the Utrophin-261-EGFP construct. Oncogenic cells were identified by lack of green fluorescence and confirmed by images of the KTR, showing activation after induction with doxycycline (2 µg/ml). Actin enrichment was quantified by manually tracing the border of adjacent Utrophin-261-EGFP cells at the leading edge in contact with oncogenic cells on Fiji. All cells from a single extrusion event are plotted along with their mean.
Immunoblotting
For assessment of protein expression in Figure 1—figure supplement 2 , parental, TRE3G::BRAFWT and TRE3G::BRAFV600E cells were plated in 6-well plastic culture plates, and starved with 0.5% HS, DMEM/F12 containing P/S with 1 mM Na Pyruvate and 10 mM HEPES overnight before treatment with media or doxycycline (2 µg/ml) for 24 hr. Samples were lysed with RIPA buffer (CST) containing HALT protease and phosphatase inhibitors (Thermo), and reduced in Laemelli SDS buffer (BioRad) with BME (Sigma). Samples underwent electrophoresis on 4–15% gradient polyacrylamide gels (BioRad) and were immunoblotted with Rabbit anti-BRAF (CST) and mouse anti-HSC70 (Santa Cruz Biotechnology), and IRDye donkey anti-rabbit 800 and goat anti-mouse 680 secondary antibodies (LiCor) before imaging. For validation of ADAM17 CRISPR-KOs in Figure 3 , suspected clones were grown, lysed, and run on a gel as described above, before immunoblotting with Rabbit anti-ADAM17 (CST) and mouse anti-HSC70 (Santa Cruz Biotechnology) primary and IRDye donkey anti-rabbit 800 and goat anti-mouse 680 secondary antibodies (LiCor). All images were acquired on an Odyssey Infrared Scanner (LiCor).
Proteomics
For mass spectrometry, cells were grown to 90% confluency in T175 flasks and serum starved 24 hr (see live imaging) before switching to 15 mL growth factor/serum-free DMEM/F12 +/- Dox for 4 hr. The supernatant was collected and concentrated using 3 kDa cut-off centrifugal filters (Millipore-Sigma). Triplicate samples were quantified by the Pierce Assay (Thermo Scientific), reduced, alkylated, and trypsin digested before labeling with Tandem Mass Tag labels. Peptide fractions were analyzed by LC/MSMS using an Easy-LC 1200 HPLC system interfaced with an Orbitrap Fusion Lumos Tribrid Mass Spectrometer (Thermo Fisher Scientific). Isotopically resolved masses in precursor and fragmentation spectra were processed in Proteome Discoverer software (v2.3, Thermo Scientific). Data were searched using Mascot (2.6.2, Matrix Science) against the 2017_Refseq 83 Human database and filtered at a 1% FDR confidence threshold.
Cell proliferation assay
Monolayers were plated and starved as described above and treated with doxycycline (Dox, 2 µg/ml) in the presence of indicated inhibitors for 24 hr. During the final 4 hr, EdU (10 µM, Thermo Fischer Scientific) was added into cultures to label S phase cells then fixed with methanol and washed before Alexa-Fluor Azide 488 click labelling (Thermo Fischer Scientific) and DAPI staining (Thermo Scientific). Monolayers were imaged by epifluorescence. Because methanol fixation eliminates fluorescence from fluorescent proteins, cocultures were imaged just before fixation and registered with DAPI and EdU images to determine positions of inducible and neighboring cells. Sample size for population EdU experiments represents all non-overlapping positions from 2 to 3 independent wells, excluding outliers resulting from imaging artifacts. Key conditions were replicated at least twice.
Immunofluorescence
Monolayers were plated and starved as described above, and treated with media or doxycycline (Dox, 2 µg/ml) in the presence of any indicated inhibitors for 24 hr or timepoints as marked. To induce EMT, parental cells were maintained in full serum supplemented with TGFβ (5 ng/ml or 50 ng/ml, R and D Systems) through splittings over 8 days to induce EMT (Hao et al., 2019), then cells were plated and starved as described with consistent TGFβ. Cells were fixed 15 min with 4% PFA in PBS, washed with PBS before incubating 1.5 hr in blocking buffer (PBS + 0.3% Triton X-100 + 5% BSA), followed by PBS washing and incubation overnight in blocking buffer with added primary antibodies (Rabbit anti-E-Cadherin, or Rabbit anti-N-Cadherin, both CST). The following day, cells were washed in PBS before incubating 2 hr in blocking buffer with secondary antibody (Donkey anti-Rabbit IgG Alexa Fluor 405, Abcam). Cells were then washed with PBS and stored at 4°C until imaging via spinning disk confocal as described above. All incubations occurred at room temp in the dark, except the overnight primary, which was incubated at 4°C.
Acknowledgements
We thank all members of the Regot lab, and members of the Holland lab (A Holland, B Lambrus, and C Gleitch) and Wantanabe lab (T Ogunmowo) for helpful discussions and technical advice, and the Mass Spectrometry and Proteomics Core at JHSOM for assistance processing samples. We acknowledge our funding sources: NIH T32 pre-doctoral training grants to TA, AP, MP, and HC (GM007445). NSF Graduate Research Fellowships to TA, MP and HC (DGE-1746891). An NSF CAREER award (MCB-1844994), NIGMS R35 (1R35GM133499), American Cancer Society Research Scholar Grant (133537-RSG-19-005-01-CCG), and Jerome L Greene Foundation Discovery Award to SR.
Appendix 1
Appendix 1—key resources table.
| Reagent type (species) or resource |
Designation | Source or reference |
Identifiers | Additional information |
|---|---|---|---|---|
| Cell line (Human) | MCF10A | ATCC | ||
| Cell line (Human) | HEK293FT | Thermo-Fisher | ||
| Recombinant DNA reagent | pLenti H2B-iRFP | PMID:24949979 | H2B-iRFP; 'Nuclear marker' |
pSR1881 |
| Recombinant DNA reagent |
pLenti PGK-ERK1-mRuby2 | This paper | ERK Localization Sensor | pSR1214, Regot Lab |
| Recombinant DNA reagent | pLenti PGK-ERK-KTR-mCerulean3 | Addgene #90229 PMID:24949979 | ERK-KTR; ERK Kinase Translocation Reporter | pTA30, Regot Lab |
| Recombinant DNA reagent | pLenti H2B-mClover | This paper | H2B-Clover | pTA54, Regot Lab |
| Recombinant DNA reagent | pLenti PGK::rtTA, TRE3G::FGFR1WT |
This paper | TRE3G::FGFR1WT | pTA46, Regot Lab |
| Recombinant DNA reagent | pLenti PGK::rtTA, TRE3G::FGFR2WT |
This paper | TRE3G::FGFR2WT | pHC127, Regot Lab |
| Recombinant DNA reagent | pLenti PGK::rtTA, TRE3G::EGFR1WT |
This paper | TRE3G::EGFR1WT | pHC132, Regot Lab |
| Recombinant DNA reagent | pLenti PGK::rtTA, TRE3G::HER2WT |
This paper | TRE3G::HER2WT | pHC123, Regot Lab |
| Recombinant DNA reagent | pLenti PGK::rtTA, TRE3G::KRASWT |
This paper | TRE3G::KRASWT | pHC131, Regot Lab |
| Recombinant DNA reagent | pLenti PGK::rtTA, TRE3G::KRASG12V |
This paper | TRE3G::KRASG12V | pHC136, Regot Lab |
| Recombinant DNA reagent | pLenti PGK::rtTA, TRE3G::BRAFWT |
This paper | TRE3G::BRAFWT | pHC142, Regot Lab |
| Recombinant DNA reagent | pLenti PGK::rtTA, TRE3G::BRAFV600E |
This paper | TRE3G::BRAFV600E | pHC125, Regot Lab |
| Recombinant DNA reagent | pLenti PGK::rtTA, TRE3G::MEK1WT |
This paper | TRE3G::MEK1WT | pHC134, Regot Lab |
| Recombinant DNA reagent | pLenti PGK::rtTA, TRE3G:: MEK1DD |
This paper | TRE3G:: MEK1DD | pAP53, Regot Lab |
| Recombinant DNA reagent | pLenti PGK::rtTA, TRE3G:: MEK2WT |
This paper | TRE3G:: MEK2WT | pHC126, Regot Lab |
| Recombinant DNA reagent | pLenti PGK::rtTA, TRE3G:: MEK2DD |
This paper | TRE3G:: MEK2DD | pHC141, Regot Lab |
| Recombinant DNA reagent | pLenti PGK::rtTA, TRE3G:: MKK3DD |
This paper | TRE3G:: MKK3DD | pAP55, Regot Lab |
| Recombinant DNA reagent | CMV Puro DEST | Addgene #17452 PMID:19657394 | ||
| Recombinant DNA reagent | PGK Puro DEST | Addgene #19068 PMID:19657394 |
||
| Recombinant DNA reagent | pEGFP-C1 Utr261-EGFP | Addgene #58471 PMID:26317264 |
||
| Recombinant DNA reagent | pLenti PGK-Utr261-EGFP puro | This paper | pTA152, Regot Lab | |
| Recombinant DNA reagent | pLenti PGK-P38-KTR-mClover | This paper | pAP50, Regot Lab | |
| Recombinant DNA reagent | pLenti PGK-JNK-KTR-mRuby2 | Addgene #59154 PMID:24949979 |
pSR1846 | |
| recombinant DNA reagent | lentiCRISPR_V2_Neo | Gift from Dr. Andrew Holland | lentiCRISPR_V2_Puro on addgene as #52961 | |
| sequence-based reagent | ADAM17KO guide | This paper, from IDT | 5’-CTACAGATACATGGGCAGAG-3’ (targets R241 of exon 6) | |
| Recombinant DNA reagent | pLenti CRISPR ADAM17KO Neo | This paper | ADAM17KO | pTA70, Regot Lab |
| Chemical compound, drug | PD-0325901 | Selleck Chemicals #S1036 | MEKi; MEK inhibitor | 5µM |
| Chemical compound, drug | Batimastat | Selleck Chemicals #S7155 |
MPi; MMP/ADAM inhibitor | 5µM |
| Chemical compound, drug | Gefitinib | Selleck Chemicals #S1025 | EGFRi; EGFR inhibitor | 5µM |
| Chemical compound, drug | BIRB-796 | Selleck Chemicals # S1574 |
P38i; p38 inhibitor; BIRB |
5µM |
| Chemical compound, drug | SB-203580 | Sigma # S8307 | P38i; p38 inhibitor; SB |
25µM |
| Chemical compound, drug | SKII | Selleck Chemicals #S7176 | SKi; Sphingosine Kinase inhibitor | 10µM |
| Chemical compound, drug | JTE-013 | Selleck Chemicals # S128 | S1PR2i; S1PR2 inhibitor | 10µM |
| Peptide, recombinant protein | Doxycycline | Sigma #D9891 | Dox | 2μg/ml |
| Peptide, recombinant protein | Amphiregulin | Peprotech #100-55B | AREG | 20ng/ml |
| Peptide, recombinant protein | TGFβ | R&D Systems #7754-BH |
TGFβ | 5ng/ml or 50ng/ml |
| Peptide, recombinant protein | EGF | Peprotech #AF-100-15 |
EGF | MCF10A culture |
| Peptide, recombinant protein | Insulin | Sigma #I0516 | MCF10A culture | |
| Peptide, recombinant protein | Penicillin/ Streptomycin |
Sigma #P0781 | MCF10A culture | |
| Peptide, recombinant protein | Cholera Toxin | Sigma # C-8052 | MCF10A culture | |
| Peptide, recombinant protein | Hydrocortisone | Sigma #H-0888 | MCF10A culture | |
| Other | Horse Serum | Gibco #16050-122 | MCF10A culture | |
| Other | DMEM/F12 | Gibco #11030-032 | MCF10A culture | |
| Other | 0.25% Trypsin-EDTA | Gibco #25300-054 | MCF10A culture | |
| Other | Puromycin | Sigma #P8833 | 1 μg/ml | |
| Other | Blasticidin | Corning #30-100-RB | 3μg/ml | |
| Other | Hygromycin | Gibco #10687010 | 10 μg/ml | |
| Other | Neomycin | Sigma #N6386 | 500μg/ml | |
| Other | Lipofectamine 2000 | Thermo Fisher #11668-027 | For lentiviral production | |
| Other | Polybrene | EMD/Millipore #TR-1000-G |
10 μg/ml, for lentiviral infection | |
| Other | Human Plasma Fibronectin | EMD/Millipore #FC010 | ||
| Chemical compound, drug | EdU | Thermo Fisher # A10044 | EdU | 10μM |
| Chemical compound, drug | Alexa-Fluor Azide 488 click labelling | Thermo Fisher # A10266 | ||
| Chemical compound, drug | DAPI | Thermo Fisher # D3571 | ||
| Antibody | Anti-Amphiregulin Antibody (mouse monoclonal) | R & D Systems #MAB262 | AREG FB-Ab | 50ng/ml |
| Antibody | Anti-ADAM17 Antibody (rabbit polyclonal) | CST #3976S | α-ADAM17 | 1:1,000 |
| Antibody | Anti-BRAF Antibody (rabbit monoclonal) | CST #14814S | α-BRAF | 1:1,000 |
| Antibody | Anti-E-Cadherin Antibody (rabbit monoclonal) | CST #3195S | α-ECad | 1:500 |
| Antibody | Anti-N-Cadherin Antibody (rabbit monoclonal) |
CST #13116S | α-NCad | 1:200 |
| Antibody | Anti-HSC70 Antibody (mouse monoclonal) | Santa Cruz Biotechnology | α-HSC70 | 1:1,000 |
| Antibody | IRDye anti-rabbit 800 (donkey polyclonal) | Licor #925-32212 | 1:10,000 | |
| Antibody | IRDye anti-mouse 680 (goat polyclonal) | Licor #925-68070 | 1:10,000 | |
| Antibody | anti-Rabbit IgG Alexa Fluor 405 (donkey polyclonal) | Abcam #175649 | 1:400 | |
| Software, algorithm | CellProfiler | https://cellprofiler.org/ | ||
| Software, algorithm | findPeaks matlab script | T. C. O’Haver, 2014; Mathworks.com | modified to detect rate of change between gaussian-fitted minima and maxima from single cell traces | |
| Software, algorithm | Proteome Discoverer | Thermo Fisher, v2.3 | ||
| Software, algorithm | Mascot | Matrix Science, v2.6.2 | ||
| Software, algorithm | preprocessImagesCaller.py | Aikin T., Peterson A., Pokrass M., Clark H., Regot S., PreprocessImagesCaller. GitHub. https://github.com/tjaikin/Regot-Lab/blob/Aikin_2020/preprocessImagesCaller.py. dc08aeb. |
||
| Software, algorithm | preprocessImages.py | Aikin T., Peterson A., Pokrass M., Clark H., Regot S., PreprocessImages. GitHub. https://github.com/tjaikin/Regot-Lab/blob/Aikin_2020/preprocessImages.py. dc08aeb. |
||
| Software, algorithm | flatfielding.py | Aikin T., Peterson A., Pokrass M., Clark H., Regot S., Flatfielding. GitHub. https://github.com/tjaikin/Regot-Lab/blob/Aikin_2020/flatfielding.py.dc08aeb. |
||
| Software, algorithm | registerAndCrop.py | Aikin T., Peterson A., Pokrass M., Clark H., Regot S., registerAndCrop. GitHub. https://github.com/tjaikin/Regot-Lab/blob/Aikin_2020/registerAndCrop.py.dc08aeb. |
||
| Software, algorithm | trackOrganizeCpDataCaller.py | Aikin T., Peterson A., Pokrass M., Clark H., Regot S., trackOrganizeCpDataCaller. GitHub. https://github.com/tjaikin/Regot-Lab/blob/Aikin_2020/trackOrganizeCpDataCaller.py.dc08aeb. |
||
| Software, algorithm | trackOrganizeCpData.py | Aikin T., Peterson A., Pokrass M., Clark H., Regot S., PreprocessImages. GitHub. https://github.com/tjaikin/Regot-Lab/blob/Aikin_2020/trackOrganizeCpData.py.dc08aeb. |
Funding Statement
The funders had no role in study design, data collection and interpretation, or the decision to submit the work for publication.
Contributor Information
Sergi Regot, Email: sregot@jhmi.edu.
Jody Rosenblatt, King's College London, United Kingdom.
Jonathan A Cooper, Fred Hutchinson Cancer Research Center, United States.
Funding Information
This paper was supported by the following grants:
National Institute of General Medical Sciences 1R35GM133499 to Sergi Regot.
National Science Foundation MCB-1844994 to Sergi Regot.
American Cancer Society 133537-RSG-19-005-01-CCG to Sergi Regot.
National Institute of General Medical Sciences T32-GM007445 to Timothy J Aikin, Amy F Peterson, Michael J Pokrass, Helen R Clark.
National Science Foundation DGE-1746891 to Timothy J Aikin, Michael J Pokrass, Helen R Clark.
The Jerome L Greene Foundation Jerome L Greene Foundation Discovery Award to Sergi Regot.
Additional information
Competing interests
No competing interests declared.
Author contributions
Conceptualization, Data curation, Formal analysis, Investigation, Methodology, Writing - original draft.
Resources, Methodology, Writing - review and editing.
Resources, Writing - review and editing.
Resources, Writing - review and editing.
Conceptualization, Formal analysis, Supervision, Funding acquisition, Project administration, Writing - review and editing.
Additional files
Supernatants from ADAM17KO or WT cells expressing (+Dox) or not expressing (-Dox) BRAFV600E were collected and analyzed by Tandem-Mass-Tag (TMT) mass spectrometry as described in methods. Table shows fold change and p-values for the 24 identified factors presented in Figure 3D in red.
Data availability
All data generated or analysed during this study are included in the manuscript and supporting files.
References
- Adachi M, Fukuda M, Nishida E. Nuclear export of MAP kinase (ERK) involves a MAP kinase kinase (MEK)-dependent active transport mechanism. The Journal of Cell Biology. 2000;148:849–856. doi: 10.1083/jcb.148.5.849. [DOI] [PMC free article] [PubMed] [Google Scholar]
- Aikin T, Peterson A, Pokrass M, Clark H, Regot S. Image Analysis Repository. 1GitHub. 2020 https://github.com/tjaikin/Regot-Lab/tree/Aikin_2020
- Albeck JG, Mills GB, Brugge JS. Frequency-modulated pulses of ERK activity transmit quantitative proliferation signals. Molecular Cell. 2013;49:249–261. doi: 10.1016/j.molcel.2012.11.002. [DOI] [PMC free article] [PubMed] [Google Scholar]
- Aoki K, Kumagai Y, Sakurai A, Komatsu N, Fujita Y, Shionyu C, Matsuda M. Stochastic ERK activation induced by noise and cell-to-cell propagation regulates cell density-dependent proliferation. Molecular Cell. 2013;52:529–540. doi: 10.1016/j.molcel.2013.09.015. [DOI] [PubMed] [Google Scholar]
- Aoki K, Kondo Y, Naoki H, Hiratsuka T, Itoh RE, Matsuda M. Propagating wave of ERK activation orients collective cell migration. Developmental Cell. 2017;43:305–317. doi: 10.1016/j.devcel.2017.10.016. [DOI] [PubMed] [Google Scholar]
- Bailey MH, Tokheim C, Porta-Pardo E, Sengupta S, Bertrand D, Weerasinghe A, Colaprico A, Wendl MC, Kim J, Reardon B, Ng PK-S, Jeong KJ, Cao S, Wang Z, Gao J, Gao Q, Wang F, Liu EM, Mularoni L, Rubio-Perez C, Nagarajan N, Cortés-Ciriano I, Zhou DC, Liang W-W, Hess JM, Yellapantula VD, Tamborero D, Gonzalez-Perez A, Suphavilai C, Ko JY, Khurana E, Park PJ, Van Allen EM, Liang H, Lawrence MS, Godzik A, Lopez-Bigas N, Stuart J, Wheeler D, Getz G, Chen K, Lazar AJ, Mills GB, Karchin R, Ding L, Caesar-Johnson SJ, Demchok JA, Felau I, Kasapi M, Ferguson ML, Hutter CM, Sofia HJ, Tarnuzzer R, Wang Z, Yang L, Zenklusen JC, Zhang J, Chudamani S, Liu J, Lolla L, Naresh R, Pihl T, Sun Q, Wan Y, Wu Y, Cho J, DeFreitas T, Frazer S, Gehlenborg N, Getz G, Heiman DI, Kim J, Lawrence MS, Lin P, Meier S, Noble MS, Saksena G, Voet D, Zhang H, Bernard B, Chambwe N, Dhankani V, Knijnenburg T, Kramer R, Leinonen K, Liu Y, Miller M, Reynolds S, Shmulevich I, Thorsson V, Zhang W, Akbani R, Broom BM, Hegde AM, Ju Z, Kanchi RS, Korkut A, Li J, Liang H, Ling S, Liu W, Lu Y, Mills GB, Ng K-S, Rao A, Ryan M, Wang J, Weinstein JN, Zhang J, Abeshouse A, Armenia J, Chakravarty D, Chatila WK, de Bruijn I, Gao J, Gross BE, Heins ZJ, Kundra R, La K, Ladanyi M, Luna A, Nissan MG, Ochoa A, Phillips SM, Reznik E, Sanchez-Vega F, Sander C, Schultz N, Sheridan R, Sumer SO, Sun Y, Taylor BS, Wang J, Zhang H, Anur P, Peto M, Spellman P, Benz C, Stuart JM, Wong CK, Yau C, Hayes DN, Parker JS, Wilkerson MD, Ally A, Balasundaram M, Bowlby R, Brooks D, Carlsen R, Chuah E, Dhalla N, Holt R, Jones SJM, Kasaian K, Lee D, Ma Y, Marra MA, Mayo M, Moore RA, Mungall AJ, Mungall K, Robertson AG, Sadeghi S, Schein JE, Sipahimalani P, Tam A, Thiessen N, Tse K, Wong T, Berger AC, Beroukhim R, Cherniack AD, Cibulskis C, Gabriel SB, Gao GF, Ha G, Meyerson M, Schumacher SE, Shih J, Kucherlapati MH, Kucherlapati RS, Baylin S, Cope L, Danilova L, Bootwalla MS, Lai PH, Maglinte DT, Van Den Berg DJ, Weisenberger DJ, Auman JT, Balu S, Bodenheimer T, Fan C, Hoadley KA, Hoyle AP, Jefferys SR, Jones CD, Meng S, Mieczkowski PA, Mose LE, Perou AH, Perou CM, Roach J, Shi Y, Simons JV, Skelly T, Soloway MG, Tan D, Veluvolu U, Fan H, Hinoue T, Laird PW, Shen H, Zhou W, Bellair M, Chang K, Covington K, Creighton CJ, Dinh H, Doddapaneni H, Donehower LA, Drummond J, Gibbs RA, Glenn R, Hale W, Han Y, Hu J, Korchina V, Lee S, Lewis L, Li W, Liu X, Morgan M, Morton D, Muzny D, Santibanez J, Sheth M, Shinbrot E, Wang L, Wang M, Wheeler DA, Xi L, Zhao F, Hess J, Appelbaum EL, Bailey M, Cordes MG, Ding L, Fronick CC, Fulton LA, Fulton RS, Kandoth C, Mardis ER, McLellan MD, Miller CA, Schmidt HK, Wilson RK, Crain D, Curley E, Gardner J, Lau K, Mallery D, Morris S, Paulauskis J, Penny R, Shelton C, Shelton T, Sherman M, Thompson E, Yena P, Bowen J, Gastier-Foster JM, Gerken M, Leraas KM, Lichtenberg TM, Ramirez NC, Wise L, Zmuda E, Corcoran N, Costello T, Hovens C, Carvalho AL, de Carvalho AC, Fregnani JH, Longatto-Filho A, Reis RM, Scapulatempo-Neto C, Silveira HCS, Vidal DO, Burnette A, Eschbacher J, Hermes B, Noss A, Singh R, Anderson ML, Castro PD, Ittmann M, Huntsman D, Kohl B, Le X, Thorp R, Andry C, Duffy ER, Lyadov V, Paklina O, Setdikova G, Shabunin A, Tavobilov M, McPherson C, Warnick R, Berkowitz R, Cramer D, Feltmate C, Horowitz N, Kibel A, Muto M, Raut CP, Malykh A, Barnholtz-Sloan JS, Barrett W, Devine K, Fulop J, Ostrom QT, Shimmel K, Wolinsky Y, Sloan AE, De Rose A, Giuliante F, Goodman M, Karlan BY, Hagedorn CH, Eckman J, Harr J, Myers J, Tucker K, Zach LA, Deyarmin B, Hu H, Kvecher L, Larson C, Mural RJ, Somiari S, Vicha A, Zelinka T, Bennett J, Iacocca M, Rabeno B, Swanson P, Latour M, Lacombe L, Têtu B, Bergeron A, McGraw M, Staugaitis SM, Chabot J, Hibshoosh H, Sepulveda A, Su T, Wang T, Potapova O, Voronina O, Desjardins L, Mariani O, Roman-Roman S, Sastre X, Stern M-H, Cheng F, Signoretti S, Berchuck A, Bigner D, Lipp E, Marks J, McCall S, McLendon R, Secord A, Sharp A, Behera M, Brat DJ, Chen A, Delman K, Force S, Khuri F, Magliocca K, Maithel S, Olson JJ, Owonikoko T, Pickens A, Ramalingam S, Shin DM, Sica G, Van Meir EG, Zhang H, Eijckenboom W, Gillis A, Korpershoek E, Looijenga L, Oosterhuis W, Stoop H, van Kessel KE, Zwarthoff EC, Calatozzolo C, Cuppini L, Cuzzubbo S, DiMeco F, Finocchiaro G, Mattei L, Perin A, Pollo B, Chen C, Houck J, Lohavanichbutr P, Hartmann A, Stoehr C, Stoehr R, Taubert H, Wach S, Wullich B, Kycler W, Murawa D, Wiznerowicz M, Chung K, Edenfield WJ, Martin J, Baudin E, Bubley G, Bueno R, De Rienzo A, Richards WG, Kalkanis S, Mikkelsen T, Noushmehr H, Scarpace L, Girard N, Aymerich M, Campo E, Giné E, Guillermo AL, Van Bang N, Hanh PT, Phu BD, Tang Y, Colman H, Evason K, Dottino PR, Martignetti JA, Gabra H, Juhl H, Akeredolu T, Stepa S, Hoon D, Ahn K, Kang KJ, Beuschlein F, Breggia A, Birrer M, Bell D, Borad M, Bryce AH, Castle E, Chandan V, Cheville J, Copland JA, Farnell M, Flotte T, Giama N, Ho T, Kendrick M, Kocher J-P, Kopp K, Moser C, Nagorney D, O’Brien D, O’Neill BP, Patel T, Petersen G, Que F, Rivera M, Roberts L, Smallridge R, Smyrk T, Stanton M, Thompson RH, Torbenson M, Yang JD, Zhang L, Brimo F, Ajani JA, Gonzalez AMA, Behrens C, Bondaruk J, Broaddus R, Czerniak B, Esmaeli B, Fujimoto J, Gershenwald J, Guo C, Lazar AJ, Logothetis C, Meric-Bernstam F, Moran C, Ramondetta L, Rice D, Sood A, Tamboli P, Thompson T, Troncoso P, Tsao A, Wistuba I, Carter C, Haydu L, Hersey P, Jakrot V, Kakavand H, Kefford R, Lee K, Long G, Mann G, Quinn M, Saw R, Scolyer R, Shannon K, Spillane A, Stretch J, Synott M, Thompson J, Wilmott J, Al-Ahmadie H, Chan TA, Ghossein R, Gopalan A, Levine DA, Reuter V, Singer S, Singh B, Tien NV, Broudy T, Mirsaidi C, Nair P, Drwiega P, Miller J, Smith J, Zaren H, Park J-W, Hung NP, Kebebew E, Linehan WM, Metwalli AR, Pacak K, Pinto PA, Schiffman M, Schmidt LS, Vocke CD, Wentzensen N, Worrell R, Yang H, Moncrieff M, Goparaju C, Melamed J, Pass H, Botnariuc N, Caraman I, Cernat M, Chemencedji I, Clipca A, Doruc S, Gorincioi G, Mura S, Pirtac M, Stancul I, Tcaciuc D, Albert M, Alexopoulou I, Arnaout A, Bartlett J, Engel J, Gilbert S, Parfitt J, Sekhon H, Thomas G, Rassl DM, Rintoul RC, Bifulco C, Tamakawa R, Urba W, Hayward N, Timmers H, Antenucci A, Facciolo F, Grazi G, Marino M, Merola R, de Krijger R, Gimenez-Roqueplo A-P, Piché A, Chevalier S, McKercher G, Birsoy K, Barnett G, Brewer C, Farver C, Naska T, Pennell NA, Raymond D, Schilero C, Smolenski K, Williams F, Morrison C, Borgia JA, Liptay MJ, Pool M, Seder CW, Junker K, Omberg L, Dinkin M, Manikhas G, Alvaro D, Bragazzi MC, Cardinale V, Carpino G, Gaudio E, Chesla D, Cottingham S, Dubina M, Moiseenko F, Dhanasekaran R, Becker K-F, Janssen K-P, Slotta-Huspenina J, Abdel-Rahman MH, Aziz D, Bell S, Cebulla CM, Davis A, Duell R, Elder JB, Hilty J, Kumar B, Lang J, Lehman NL, Mandt R, Nguyen P, Pilarski R, Rai K, Schoenfield L, Senecal K, Wakely P, Hansen P, Lechan R, Powers J, Tischler A, Grizzle WE, Sexton KC, Kastl A, Henderson J, Porten S, Waldmann J, Fassnacht M, Asa SL, Schadendorf D, Couce M, Graefen M, Huland H, Sauter G, Schlomm T, Simon R, Tennstedt P, Olabode O, Nelson M, Bathe O, Carroll PR, Chan JM, Disaia P, Glenn P, Kelley RK, Landen CN, Phillips J, Prados M, Simko J, Smith-McCune K, VandenBerg S, Roggin K, Fehrenbach A, Kendler A, Sifri S, Steele R, Jimeno A, Carey F, Forgie I, Mannelli M, Carney M, Hernandez B, Campos B, Herold-Mende C, Jungk C, Unterberg A, von Deimling A, Bossler A, Galbraith J, Jacobus L, Knudson M, Knutson T, Ma D, Milhem M, Sigmund R, Godwin AK, Madan R, Rosenthal HG, Adebamowo C, Adebamowo SN, Boussioutas A, Beer D, Giordano T, Mes-Masson A-M, Saad F, Bocklage T, Landrum L, Mannel R, Moore K, Moxley K, Postier R, Walker J, Zuna R, Feldman M, Valdivieso F, Dhir R, Luketich J, Pinero EMM, Quintero-Aguilo M, Carlotti CG, Dos Santos JS, Kemp R, Sankarankuty A, Tirapelli D, Catto J, Agnew K, Swisher E, Creaney J, Robinson B, Shelley CS, Godwin EM, Kendall S, Shipman C, Bradford C, Carey T, Haddad A, Moyer J, Peterson L, Prince M, Rozek L, Wolf G, Bowman R, Fong KM, Yang I, Korst R, Rathmell WK, Fantacone-Campbell JL, Hooke JA, Kovatich AJ, Shriver CD, DiPersio J, Drake B, Govindan R, Heath S, Ley T, Van Tine B, Westervelt P, Rubin MA, Lee JI, Aredes ND, Mariamidze A. Comprehensive characterization of Cancer driver genes and mutations. Cell. 2018;173:371–385. doi: 10.1016/j.cell.2018.02.060. [DOI] [PMC free article] [PubMed] [Google Scholar]
- Belin BJ, Goins LM, Mullins RD. Comparative analysis of tools for live cell imaging of actin network architecture. BioArchitecture. 2014;4:189–202. doi: 10.1080/19490992.2014.1047714. [DOI] [PMC free article] [PubMed] [Google Scholar]
- Brown S, Pineda CM, Xin T, Boucher J, Suozzi KC, Park S, Matte-Martone C, Gonzalez DG, Rytlewski J, Beronja S, Greco V. Correction of aberrant growth preserves tissue homeostasis. Nature. 2017;548:334–337. doi: 10.1038/nature23304. [DOI] [PMC free article] [PubMed] [Google Scholar]
- Bugaj LJ, Sabnis AJ, Mitchell A, Garbarino JE, Toettcher JE, Bivona TG, Lim WA. Cancer mutations and targeted drugs can disrupt dynamic signal encoding by the Ras-Erk pathway. Science. 2018;361:eaao3048. doi: 10.1126/science.aao3048. [DOI] [PMC free article] [PubMed] [Google Scholar]
- Campeau E, Ruhl VE, Rodier F, Smith CL, Rahmberg BL, Fuss JO, Campisi J, Yaswen P, Cooper PK, Kaufman PD. A versatile viral system for expression and depletion of proteins in mammalian cells. PLOS ONE. 2009;4:e6529. doi: 10.1371/journal.pone.0006529. [DOI] [PMC free article] [PubMed] [Google Scholar]
- Clavería C, Giovinazzo G, Sierra R, Torres M. Myc-driven endogenous cell competition in the early mammalian embryo. Nature. 2013;500:39–44. doi: 10.1038/nature12389. [DOI] [PubMed] [Google Scholar]
- Clavería C, Torres M. Cell competition: mechanisms and physiological roles. Annual Review of Cell and Developmental Biology. 2016;32:411–439. doi: 10.1146/annurev-cellbio-111315-125142. [DOI] [PubMed] [Google Scholar]
- Corson LB, Yamanaka Y, Lai KM, Rossant J. Spatial and temporal patterns of ERK signaling during mouse embryogenesis. Development. 2003;130:4527–4537. doi: 10.1242/dev.00669. [DOI] [PubMed] [Google Scholar]
- Courtois-Cox S, Genther Williams SM, Reczek EE, Johnson BW, McGillicuddy LT, Johannessen CM, Hollstein PE, MacCollin M, Cichowski K. A negative feedback signaling network underlies oncogene-induced senescence. Cancer Cell. 2006;10:459–472. doi: 10.1016/j.ccr.2006.10.003. [DOI] [PMC free article] [PubMed] [Google Scholar]
- de la Cova C, Townley R, Regot S, Greenwald I. A Real-Time biosensor for ERK activity reveals signaling dynamics during C. elegans Cell Fate Specification. Developmental Cell. 2017;42:542–553. doi: 10.1016/j.devcel.2017.07.014. [DOI] [PMC free article] [PubMed] [Google Scholar]
- Devreotes PN, Bhattacharya S, Edwards M, Iglesias PA, Lampert T, Miao Y. Excitable signal transduction networks in directed cell migration. Annual Review of Cell and Developmental Biology. 2017;33:103–125. doi: 10.1146/annurev-cellbio-100616-060739. [DOI] [PMC free article] [PubMed] [Google Scholar]
- Díaz-Rodríguez E, Montero JC, Esparís-Ogando A, Yuste L, Pandiella A. Extracellular signal-regulated kinase phosphorylates tumor necrosis factor alpha-converting enzyme at Threonine 735: a potential role in regulated shedding. Molecular Biology of the Cell. 2002;13:2031–2044. doi: 10.1091/mbc.01-11-0561. [DOI] [PMC free article] [PubMed] [Google Scholar]
- Eisenhoffer GT, Loftus PD, Yoshigi M, Otsuna H, Chien CB, Morcos PA, Rosenblatt J. Crowding induces live cell extrusion to maintain homeostatic cell numbers in epithelia. Nature. 2012;484:546–549. doi: 10.1038/nature10999. [DOI] [PMC free article] [PubMed] [Google Scholar]
- Ellis SJ, Gomez NC, Levorse J, Mertz AF, Ge Y, Fuchs E. Distinct modes of cell competition shape mammalian tissue morphogenesis. Nature. 2019;569:497–502. doi: 10.1038/s41586-019-1199-y. [DOI] [PMC free article] [PubMed] [Google Scholar]
- Gibson DG, Young L, Chuang RY, Venter JC, Hutchison CA, Smith HO. Enzymatic assembly of DNA molecules up to several hundred kilobases. Nature Methods. 2009;6:343–345. doi: 10.1038/nmeth.1318. [DOI] [PubMed] [Google Scholar]
- Grieve AG, Rabouille C. Extracellular cleavage of E-cadherin promotes epithelial cell extrusion. Journal of Cell Science. 2014;127:3331–3346. doi: 10.1242/jcs.147926. [DOI] [PubMed] [Google Scholar]
- Gu Y, Forostyan T, Sabbadini R, Rosenblatt J. Epithelial cell extrusion requires the sphingosine-1-phosphate receptor 2 pathway. The Journal of Cell Biology. 2011;193:667–676. doi: 10.1083/jcb.201010075. [DOI] [PMC free article] [PubMed] [Google Scholar]
- Hahn WC, Weinberg RA. Modelling the molecular circuitry of Cancer. Nature Reviews Cancer. 2002;2:331–341. doi: 10.1038/nrc795. [DOI] [PubMed] [Google Scholar]
- Hao Y, Baker D, ten Dijke P. TGF-β-Mediated Epithelial-Mesenchymal transition and Cancer metastasis. International Journal of Molecular Sciences. 2019;20:2767. doi: 10.3390/ijms20112767. [DOI] [PMC free article] [PubMed] [Google Scholar]
- Hiratsuka T, Fujita Y, Naoki H, Aoki K, Kamioka Y, Matsuda M. Intercellular propagation of extracellular signal-regulated kinase activation revealed by in vivo imaging of mouse skin. eLife. 2015;4:e05178. doi: 10.7554/eLife.05178. [DOI] [PMC free article] [PubMed] [Google Scholar]
- Hoadley KA, Yau C, Hinoue T, Wolf DM, Lazar AJ, Drill E, Shen R, Taylor AM, Cherniack AD, Thorsson V, Akbani R, Bowlby R, Wong CK, Wiznerowicz M, Sanchez-Vega F, Robertson AG, Schneider BG, Lawrence MS, Noushmehr H, Malta TM, Stuart JM, Benz CC, Laird PW, Caesar-Johnson SJ, Demchok JA, Felau I, Kasapi M, Ferguson ML, Hutter CM, Sofia HJ, Tarnuzzer R, Wang Z, Yang L, Zenklusen JC, Zhang J, Chudamani S, Liu J, Lolla L, Naresh R, Pihl T, Sun Q, Wan Y, Wu Y, Cho J, DeFreitas T, Frazer S, Gehlenborg N, Getz G, Heiman DI, Kim J, Lawrence MS, Lin P, Meier S, Noble MS, Saksena G, Voet D, Zhang H, Bernard B, Chambwe N, Dhankani V, Knijnenburg T, Kramer R, Leinonen K, Liu Y, Miller M, Reynolds S, Shmulevich I, Thorsson V, Zhang W, Akbani R, Broom BM, Hegde AM, Ju Z, Kanchi RS, Korkut A, Li J, Liang H, Ling S, Liu W, Lu Y, Mills GB, Ng K-S, Rao A, Ryan M, Wang J, Weinstein JN, Zhang J, Abeshouse A, Armenia J, Chakravarty D, Chatila WK, de Bruijn I, Gao J, Gross BE, Heins ZJ, Kundra R, La K, Ladanyi M, Luna A, Nissan MG, Ochoa A, Phillips SM, Reznik E, Sanchez-Vega F, Sander C, Schultz N, Sheridan R, Sumer SO, Sun Y, Taylor BS, Wang J, Zhang H, Anur P, Peto M, Spellman P, Benz C, Stuart JM, Wong CK, Yau C, Hayes DN, Parker JS, Wilkerson MD, Ally A, Balasundaram M, Bowlby R, Brooks D, Carlsen R, Chuah E, Dhalla N, Holt R, Jones SJM, Kasaian K, Lee D, Ma Y, Marra MA, Mayo M, Moore RA, Mungall AJ, Mungall K, Robertson AG, Sadeghi S, Schein JE, Sipahimalani P, Tam A, Thiessen N, Tse K, Wong T, Berger AC, Beroukhim R, Cherniack AD, Cibulskis C, Gabriel SB, Gao GF, Ha G, Meyerson M, Schumacher SE, Shih J, Kucherlapati MH, Kucherlapati RS, Baylin S, Cope L, Danilova L, Bootwalla MS, Lai PH, Maglinte DT, Van Den Berg DJ, Weisenberger DJ, Auman JT, Balu S, Bodenheimer T, Fan C, Hoadley KA, Hoyle AP, Jefferys SR, Jones CD, Meng S, Mieczkowski PA, Mose LE, Perou AH, Perou CM, Roach J, Shi Y, Simons JV, Skelly T, Soloway MG, Tan D, Veluvolu U, Fan H, Hinoue T, Laird PW, Shen H, Zhou W, Bellair M, Chang K, Covington K, Creighton CJ, Dinh H, Doddapaneni H, Donehower LA, Drummond J, Gibbs RA, Glenn R, Hale W, Han Y, Hu J, Korchina V, Lee S, Lewis L, Li W, Liu X, Morgan M, Morton D, Muzny D, Santibanez J, Sheth M, Shinbrot E, Wang L, Wang M, Wheeler DA, Xi L, Zhao F, Hess J, Appelbaum EL, Bailey M, Cordes MG, Ding L, Fronick CC, Fulton LA, Fulton RS, Kandoth C, Mardis ER, McLellan MD, Miller CA, Schmidt HK, Wilson RK, Crain D, Curley E, Gardner J, Lau K, Mallery D, Morris S, Paulauskis J, Penny R, Shelton C, Shelton T, Sherman M, Thompson E, Yena P, Bowen J, Gastier-Foster JM, Gerken M, Leraas KM, Lichtenberg TM, Ramirez NC, Wise L, Zmuda E, Corcoran N, Costello T, Hovens C, Carvalho AL, de Carvalho AC, Fregnani JH, Longatto-Filho A, Reis RM, Scapulatempo-Neto C, Silveira HCS, Vidal DO, Burnette A, Eschbacher J, Hermes B, Noss A, Singh R, Anderson ML, Castro PD, Ittmann M, Huntsman D, Kohl B, Le X, Thorp R, Andry C, Duffy ER, Lyadov V, Paklina O, Setdikova G, Shabunin A, Tavobilov M, McPherson C, Warnick R, Berkowitz R, Cramer D, Feltmate C, Horowitz N, Kibel A, Muto M, Raut CP, Malykh A, Barnholtz-Sloan JS, Barrett W, Devine K, Fulop J, Ostrom QT, Shimmel K, Wolinsky Y, Sloan AE, De Rose A, Giuliante F, Goodman M, Karlan BY, Hagedorn CH, Eckman J, Harr J, Myers J, Tucker K, Zach LA, Deyarmin B, Hu H, Kvecher L, Larson C, Mural RJ, Somiari S, Vicha A, Zelinka T, Bennett J, Iacocca M, Rabeno B, Swanson P, Latour M, Lacombe L, Têtu B, Bergeron A, McGraw M, Staugaitis SM, Chabot J, Hibshoosh H, Sepulveda A, Su T, Wang T, Potapova O, Voronina O, Desjardins L, Mariani O, Roman-Roman S, Sastre X, Stern M-H, Cheng F, Signoretti S, Berchuck A, Bigner D, Lipp E, Marks J, McCall S, McLendon R, Secord A, Sharp A, Behera M, Brat DJ, Chen A, Delman K, Force S, Khuri F, Magliocca K, Maithel S, Olson JJ, Owonikoko T, Pickens A, Ramalingam S, Shin DM, Sica G, Van Meir EG, Zhang H, Eijckenboom W, Gillis A, Korpershoek E, Looijenga L, Oosterhuis W, Stoop H, van Kessel KE, Zwarthoff EC, Calatozzolo C, Cuppini L, Cuzzubbo S, DiMeco F, Finocchiaro G, Mattei L, Perin A, Pollo B, Chen C, Houck J, Lohavanichbutr P, Hartmann A, Stoehr C, Stoehr R, Taubert H, Wach S, Wullich B, Kycler W, Murawa D, Wiznerowicz M, Chung K, Edenfield WJ, Martin J, Baudin E, Bubley G, Bueno R, De Rienzo A, Richards WG, Kalkanis S, Mikkelsen T, Noushmehr H, Scarpace L, Girard N, Aymerich M, Campo E, Giné E, Guillermo AL, Van Bang N, Hanh PT, Phu BD, Tang Y, Colman H, Evason K, Dottino PR, Martignetti JA, Gabra H, Juhl H, Akeredolu T, Stepa S, Hoon D, Ahn K, Kang KJ, Beuschlein F, Breggia A, Birrer M, Bell D, Borad M, Bryce AH, Castle E, Chandan V, Cheville J, Copland JA, Farnell M, Flotte T, Giama N, Ho T, Kendrick M, Kocher J-P, Kopp K, Moser C, Nagorney D, O’Brien D, O’Neill BP, Patel T, Petersen G, Que F, Rivera M, Roberts L, Smallridge R, Smyrk T, Stanton M, Thompson RH, Torbenson M, Yang JD, Zhang L, Brimo F, Ajani JA, Gonzalez AMA, Behrens C, Bondaruk O, Broaddus R, Czerniak B, Esmaeli B, Fujimoto J, Gershenwald J, Guo C, Lazar AJ, Logothetis C, Meric-Bernstam F, Moran C, Ramondetta L, Rice D, Sood A, Tamboli P, Thompson T, Troncoso P, Tsao A, Wistuba I, Carter C, Haydu L, Hersey P, Jakrot V, Kakavand H, Kefford R, Lee K, Long G, Mann G, Quinn M, Saw R, Scolyer R, Shannon K, Spillane A, Stretch J, Synott M, Thompson J, Wilmott J, Al-Ahmadie H, Chan TA, Ghossein R, Gopalan A, Levine DA, Reuter V, Singer S, Singh B, Tien NV, Broudy T, Mirsaidi C, Nair P, Drwiega P, Miller J, Smith J, Zaren H, Park J-W, Hung NP, Kebebew E, Linehan WM, Metwalli AR, Pacak K, Pinto PA, Schiffman M, Schmidt LS, Vocke CD, Wentzensen N, Worrell R, Yang H, Moncrieff M, Goparaju C, Melamed J, Pass H, Botnariuc N, Caraman I, Cernat M, Chemencedji I, Clipca A, Doruc S, Gorincioi G, Mura S, Pirtac M, Stancul I, Tcaciuc D, Albert M, Alexopoulou I, Arnaout A, Bartlett J, Engel J, Gilbert S, Parfitt J, Sekhon H, Thomas G, Rassl DM, Rintoul RC, Bifulco C, Tamakawa R, Urba W, Hayward N, Timmers H, Antenucci A, Facciolo F, Grazi G, Marino M, Merola R, de Krijger R, Gimenez-Roqueplo A-P, Piché A, Chevalier S, McKercher G, Birsoy K, Barnett G, Brewer C, Farver C, Naska T, Pennell NA, Raymond D, Schilero C, Smolenski K, Williams F, Morrison C, Borgia JA, Liptay MJ, Pool M, Seder CW, Junker K, Omberg L, Dinkin M, Manikhas G, Alvaro D, Bragazzi MC, Cardinale V, Carpino G, Gaudio E, Chesla D, Cottingham S, Dubina M, Moiseenko F, Dhanasekaran R, Becker K-F, Janssen K-P, Slotta-Huspenina J, Abdel-Rahman MH, Aziz D, Bell S, Cebulla CM, Davis A, Duell R, Elder JB, Hilty J, Kumar B, Lang J, Lehman NL, Mandt R, Nguyen P, Pilarski R, Rai K, Schoenfield L, Senecal K, Wakely P, Hansen P, Lechan R, Powers J, Tischler A, Grizzle WE, Sexton KC, Kastl A, Henderson J, Porten S, Waldmann J, Fassnacht M, Asa SL, Schadendorf D, Couce M, Graefen M, Huland H, Sauter G, Schlomm T, Simon R, Tennstedt P, Olabode O, Nelson M, Bathe O, Carroll PR, Chan JM, Disaia P, Glenn P, Kelley RK, Landen CN, Phillips J, Prados M, Simko J, Smith-McCune K, VandenBerg S, Roggin K, Fehrenbach A, Kendler A, Sifri S, Steele R, Jimeno A, Carey F, Forgie I, Mannelli M, Carney M, Hernandez B, Campos B, Herold-Mende C, Jungk C, Unterberg A, von Deimling A, Bossler A, Galbraith J, Jacobus L, Knudson M, Knutson T, Ma D, Milhem M, Sigmund R, Godwin AK, Madan R, Rosenthal HG, Adebamowo C, Adebamowo SN, Boussioutas A, Beer D, Giordano T, Mes-Masson A-M, Saad F, Bocklage T, Landrum L, Mannel R, Moore K, Moxley K, Postier R, Walker J, Zuna R, Feldman M, Valdivieso F, Dhir R, Luketich J, Pinero EMM, Quintero-Aguilo M, Carlotti CG, Dos Santos JS, Kemp R, Sankarankuty A, Tirapelli D, Catto J, Agnew K, Swisher E, Creaney J, Robinson B, Shelley CS, Godwin EM, Kendall S, Shipman C, Bradford C, Carey T, Haddad A, Moyer J, Peterson L, Prince M, Rozek L, Wolf G, Bowman R, Fong KM, Yang I, Korst R, Rathmell WK, Fantacone-Campbell JL, Hooke JA, Kovatich AJ, Shriver CD, DiPersio J, Drake B, Govindan R, Heath S, Ley T, Van Tine B, Westervelt P, Rubin MA, Lee JI, Aredes ND, Mariamidze A. Cell-of-Origin patterns dominate the molecular classification of 10,000 tumors from 33 types of Cancer. Cell. 2018;173:291–304. doi: 10.1016/j.cell.2018.03.022. [DOI] [PMC free article] [PubMed] [Google Scholar]
- Hogan C, Dupré-Crochet S, Norman M, Kajita M, Zimmermann C, Pelling AE, Piddini E, Baena-López LA, Vincent JP, Itoh Y, Hosoya H, Pichaud F, Fujita Y. Characterization of the interface between normal and transformed epithelial cells. Nature Cell Biology. 2009;11:460–467. doi: 10.1038/ncb1853. [DOI] [PubMed] [Google Scholar]
- Johnson GL, Lapadat R. Mitogen-activated protein kinase pathways mediated by ERK, JNK, and p38 protein kinases. Science. 2002;298:1911–1912. doi: 10.1126/science.1072682. [DOI] [PubMed] [Google Scholar]
- Johnson HE, Toettcher JE. Signaling dynamics control cell fate in the early Drosophila embryo. Developmental Cell. 2019;48:361–370. doi: 10.1016/j.devcel.2019.01.009. [DOI] [PMC free article] [PubMed] [Google Scholar]
- Kajita M, Hogan C, Harris AR, Dupre-Crochet S, Itasaki N, Kawakami K, Charras G, Tada M, Fujita Y. Interaction with surrounding normal epithelial cells influences signalling pathways and behaviour of Src-transformed cells. Journal of Cell Science. 2010;123:171–180. doi: 10.1242/jcs.057976. [DOI] [PMC free article] [PubMed] [Google Scholar]
- Kajita M, Fujita Y. EDAC: epithelial defence against cancer-cell competition between normal and transformed epithelial cells in mammals. Journal of Biochemistry. 2015;158:15–23. doi: 10.1093/jb/mvv050. [DOI] [PubMed] [Google Scholar]
- Kuilman T, Michaloglou C, Vredeveld LC, Douma S, van Doorn R, Desmet CJ, Aarden LA, Mooi WJ, Peeper DS. Oncogene-induced senescence relayed by an interleukin-dependent inflammatory network. Cell. 2008;133:1019–1031. doi: 10.1016/j.cell.2008.03.039. [DOI] [PubMed] [Google Scholar]
- Leung CT, Brugge JS. Outgrowth of single oncogene-expressing cells from suppressive epithelial environments. Nature. 2012;482:410–413. doi: 10.1038/nature10826. [DOI] [PMC free article] [PubMed] [Google Scholar]
- Liang J, Balachandra S, Ngo S, O'Brien LE. Feedback regulation of steady-state epithelial turnover and organ size. Nature. 2017;548:588–591. doi: 10.1038/nature23678. [DOI] [PMC free article] [PubMed] [Google Scholar]
- Maruyama T, Fujita Y. Cell competition in mammals - novel homeostatic machinery for embryonic development and Cancer prevention. Current Opinion in Cell Biology. 2017;48:106–112. doi: 10.1016/j.ceb.2017.06.007. [DOI] [PubMed] [Google Scholar]
- Muta Y, Fujita Y, Sumiyama K, Sakurai A, Taketo MM, Chiba T, Seno H, Aoki K, Matsuda M, Imajo M. Composite regulation of ERK activity dynamics underlying tumour-specific traits in the intestine. Nature Communications. 2018;9:2174. doi: 10.1038/s41467-018-04527-8. [DOI] [PMC free article] [PubMed] [Google Scholar]
- O'Haver TC. MathWorks; 2014. [Google Scholar]
- Ogura Y, Wen F-L, Sami MM, Shibata T, Hayashi S. A Switch-like activation relay of EGFR-ERK signaling regulates a wave of cellular contractility for epithelial invagination. Developmental Cell. 2018;46:162–172. doi: 10.1016/j.devcel.2018.06.004. [DOI] [PubMed] [Google Scholar]
- Regot S, Hughey JJ, Bajar BT, Carrasco S, Covert MW. High-sensitivity measurements of multiple kinase activities in live single cells. Cell. 2014;157:1724–1734. doi: 10.1016/j.cell.2014.04.039. [DOI] [PMC free article] [PubMed] [Google Scholar]
- Rios-Doria J, Sabol D, Chesebrough J, Stewart D, Xu L, Tammali R, Cheng L, Du Q, Schifferli K, Rothstein R, Leow CC, Heidbrink-Thompson J, Jin X, Gao C, Friedman J, Wilkinson B, Damschroder M, Pierce AJ, Hollingsworth RE, Tice DA, Michelotti EF. A monoclonal antibody to ADAM17 inhibits tumor growth by inhibiting EGFR and Non-EGFR-Mediated pathways. Molecular Cancer Therapeutics. 2015;14:1637–1649. doi: 10.1158/1535-7163.MCT-14-1040. [DOI] [PubMed] [Google Scholar]
- Rosenblatt J, Raff MC, Cramer LP. An epithelial cell destined for apoptosis signals its neighbors to extrude it by an actin- and myosin-dependent mechanism. Current Biology. 2001;11:1847–1857. doi: 10.1016/S0960-9822(01)00587-5. [DOI] [PubMed] [Google Scholar]
- Sanchez-Vega F, Mina M, Armenia J, Chatila WK, Luna A, La KC, Dimitriadoy S, Liu DL, Kantheti HS, Saghafinia S, Chakravarty D, Daian F, Gao Q, Bailey MH, Liang W-W, Foltz SM, Shmulevich I, Ding L, Heins Z, Ochoa A, Gross B, Gao J, Zhang H, Kundra R, Kandoth C, Bahceci I, Dervishi L, Dogrusoz U, Zhou W, Shen H, Laird PW, Way GP, Greene CS, Liang H, Xiao Y, Wang C, Iavarone A, Berger AH, Bivona TG, Lazar AJ, Hammer GD, Giordano T, Kwong LN, McArthur G, Huang C, Tward AD, Frederick MJ, McCormick F, Meyerson M, Van Allen EM, Cherniack AD, Ciriello G, Sander C, Schultz N, Caesar-Johnson SJ, Demchok JA, Felau I, Kasapi M, Ferguson ML, Hutter CM, Sofia HJ, Tarnuzzer R, Wang Z, Yang L, Zenklusen JC, Zhang J, Chudamani S, Liu J, Lolla L, Naresh R, Pihl T, Sun Q, Wan Y, Wu Y, Cho J, DeFreitas T, Frazer S, Gehlenborg N, Getz G, Heiman DI, Kim J, Lawrence MS, Lin P, Meier S, Noble MS, Saksena G, Voet D, Zhang H, Bernard B, Chambwe N, Dhankani V, Knijnenburg T, Kramer R, Leinonen K, Liu Y, Miller M, Reynolds S, Shmulevich I, Thorsson V, Zhang W, Akbani R, Broom BM, Hegde AM, Ju Z, Kanchi RS, Korkut A, Li J, Liang H, Ling S, Liu W, Lu Y, Mills GB, Ng K-S, Rao A, Ryan M, Wang J, Weinstein JN, Zhang J, Abeshouse A, Armenia J, Chakravarty D, Chatila WK, de Bruijn I, Gao J, Gross BE, Heins ZJ, Kundra R, La K, Ladanyi M, Luna A, Nissan MG, Ochoa A, Phillips SM, Reznik E, Sanchez-Vega F, Sander C, Schultz N, Sheridan R, Sumer SO, Sun Y, Taylor BS, Wang J, Zhang H, Anur P, Peto M, Spellman P, Benz C, Stuart JM, Wong CK, Yau C, Hayes DN, Parker JS, Wilkerson MD, Ally A, Balasundaram M, Bowlby R, Brooks D, Carlsen R, Chuah E, Dhalla N, Holt R, Jones SJM, Kasaian K, Lee D, Ma Y, Marra MA, Mayo M, Moore RA, Mungall AJ, Mungall K, Robertson AG, Sadeghi S, Schein JE, Sipahimalani P, Tam A, Thiessen N, Tse K, Wong T, Berger AC, Beroukhim R, Cherniack AD, Cibulskis C, Gabriel SB, Gao GF, Ha G, Meyerson M, Schumacher SE, Shih J, Kucherlapati MH, Kucherlapati RS, Baylin S, Cope L, Danilova L, Bootwalla MS, Lai PH, Maglinte DT, Van Den Berg DJ, Weisenberger DJ, Auman JT, Balu S, Bodenheimer T, Fan C, Hoadley KA, Hoyle AP, Jefferys SR, Jones CD, Meng S, Mieczkowski PA, Mose LE, Perou AH, Perou CM, Roach J, Shi Y, Simons JV, Skelly T, Soloway MG, Tan D, Veluvolu U, Fan H, Hinoue T, Laird PW, Shen H, Zhou W, Bellair M, Chang K, Covington K, Creighton CJ, Dinh H, Doddapaneni H, Donehower LA, Drummond J, Gibbs RA, Glenn R, Hale W, Han Y, Hu J, Korchina V, Lee S, Lewis L, Li W, Liu X, Morgan M, Morton D, Muzny D, Santibanez J, Sheth M, Shinbrot E, Wang L, Wang M, Wheeler DA, Xi L, Zhao F, Hess J, Appelbaum EL, Bailey M, Cordes MG, Ding L, Fronick CC, Fulton LA, Fulton RS, Kandoth C, Mardis ER, McLellan MD, Miller CA, Schmidt HK, Wilson RK, Crain D, Curley E, Gardner J, Lau K, Mallery D, Morris S, Paulauskis J, Penny R, Shelton C, Shelton T, Sherman M, Thompson E, Yena P, Bowen J, Gastier-Foster JM, Gerken M, Leraas KM, Lichtenberg TM, Ramirez NC, Wise L, Zmuda E, Corcoran N, Costello T, Hovens C, Carvalho AL, de Carvalho AC, Fregnani JH, Longatto-Filho A, Reis RM, Scapulatempo-Neto C, Silveira HCS, Vidal DO, Burnette A, Eschbacher J, Hermes B, Noss A, Singh R, Anderson ML, Castro PD, Ittmann M, Huntsman D, Kohl B, Le X, Thorp R, Andry C, Duffy ER, Lyadov V, Paklina O, Setdikova G, Shabunin A, Tavobilov M, McPherson C, Warnick R, Berkowitz R, Cramer D, Feltmate C, Horowitz N, Kibel A, Muto M, Raut CP, Malykh A, Barnholtz-Sloan JS, Barrett W, Devine K, Fulop J, Ostrom QT, Shimmel K, Wolinsky Y, Sloan AE, De Rose A, Giuliante F, Goodman M, Karlan BY, Hagedorn CH, Eckman J, Harr J, Myers J, Tucker K, Zach LA, Deyarmin B, Hu H, Kvecher L, Larson C, Mural RJ, Somiari S, Vicha A, Zelinka T, Bennett J, Iacocca M, Rabeno B, Swanson P, Latour M, Lacombe L, Têtu B, Bergeron A, McGraw M, Staugaitis SM, Chabot J, Hibshoosh H, Sepulveda A, Su T, Wang T, Potapova O, Voronina O, Desjardins L, Mariani O, Roman-Roman S, Sastre X, Stern M-H, Cheng F, Signoretti S, Berchuck A, Bigner D, Lipp E, Marks J, McCall S, McLendon R, Secord A, Sharp A, Behera M, Brat DJ, Chen A, Delman K, Force S, Khuri F, Magliocca K, Maithel S, Olson JJ, Owonikoko T, Pickens A, Ramalingam S, Shin DM, Sica G, Van Meir EG, Zhang H, Eijckenboom W, Gillis A, Korpershoek E, Looijenga L, Oosterhuis W, Stoop H, van Kessel KE, Zwarthoff EC, Calatozzolo C, Cuppini L, Cuzzubbo S, DiMeco F, Finocchiaro G, Mattei L, Perin A, Pollo B, Chen C, Houck J, Lohavanichbutr P, Hartmann A, Stoehr C, Stoehr R, Taubert H, Wach S, Wullich B, Kycler W, Murawa D, Wiznerowicz M, Chung K, Edenfield WJ, Martin J, Baudin E, Bubley G, Bueno R, De Rienzo A, Richards WG, Kalkanis S, Mikkelsen T, Noushmehr H, Scarpace L, Girard N, Aymerich M, Campo E, Giné E, Guillermo AL, Van Bang N, Hanh PT, Phu BD, Tang Y, Colman H, Evason K, Dottino PR, Martignetti JA, Gabra H, Juhl H, Akeredolu T, Stepa S, Hoon D, Ahn K, Kang KJ, Beuschlein F, Breggia A, Birrer M, Bell D, Borad M, Bryce AH, Castle E, Chandan V, Cheville J, Copland JA, Farnell M, Flotte T, Giama N, Ho T, Kendrick M, Kocher J-P, Kopp K, Moser C, Nagorney D, O’Brien D, O’Neill BP, Patel T, Petersen G, Que F, Rivera M, Roberts L, Smallridge R, Smyrk T, Stanton M, Thompson RH, Torbenson M, Yang JD, Zhang L, Brimo F, Ajani JA, Gonzalez AMA, Behrens C, Bondaruk J, Broaddus R, Czerniak B, Esmaeli B, Fujimoto J, Gershenwald J, Guo C, Lazar AJ, Logothetis C, Meric-Bernstam F, Moran C, Ramondetta L, Rice D, Sood A, Tamboli P, Thompson T, Troncoso P, Tsao A, Wistuba I, Carter C, Haydu L, Hersey P, Jakrot V, Kakavand H, Kefford R, Lee K, Long G, Mann G, Quinn M, Saw R, Scolyer R, Shannon K, Spillane A, Stretch J, Synott M, Thompson J, Wilmott J, Al-Ahmadie H, Chan TA, Ghossein R, Gopalan A, Levine DA, Reuter V, Singer S, Singh B, Tien NV, Broudy T, Mirsaidi C, Nair P, Drwiega P, Miller J, Smith J, Zaren H, Park J-W, Hung NP, Kebebew E, Linehan WM, Metwalli AR, Pacak K, Pinto PA, Schiffman M, Schmidt LS, Vocke CD, Wentzensen N, Worrell R, Yang H, Moncrieff M, Goparaju C, Melamed J, Pass H, Botnariuc N, Caraman I, Cernat M, Chemencedji I, Clipca A, Doruc S, Gorincioi G, Mura S, Pirtac M, Stancul I, Tcaciuc D, Albert M, Alexopoulou I, Arnaout A, Bartlett J, Engel J, Gilbert S, Parfitt J, Sekhon H, Thomas G, Rassl DM, Rintoul RC, Bifulco C, Tamakawa R, Urba W, Hayward N, Timmers H, Antenucci A, Facciolo F, Grazi G, Marino M, Merola R, de Krijger R, Gimenez-Roqueplo A-P, Piché A, Chevalier S, McKercher G, Birsoy K, Barnett G, Brewer C, Farver C, Naska T, Pennell NA, Raymond D, Schilero C, Smolenski K, Williams F, Morrison C, Borgia JA, Liptay MJ, Pool M, Seder CW, Junker K, Omberg L, Dinkin M, Manikhas G, Alvaro D, Bragazzi MC, Cardinale V, Carpino G, Gaudio E, Chesla D, Cottingham S, Dubina M, Moiseenko F, Dhanasekaran R, Becker K-F, Janssen K-P, Slotta-Huspenina J, Abdel-Rahman MH, Aziz D, Bell S, Cebulla CM, Davis A, Duell R, Elder JB, Hilty J, Kumar B, Lang J, Lehman NL, Mandt R, Nguyen P, Pilarski R, Rai K, Schoenfield L, Senecal K, Wakely P, Hansen P, Lechan R, Powers J, Tischler A, Grizzle WE, Sexton KC, Kastl A, Henderson J, Porten S, Waldmann J, Fassnacht M, Asa SL, Schadendorf D, Couce M, Graefen M, Huland H, Sauter G, Schlomm T, Simon R, Tennstedt P, Olabode O, Nelson M, Bathe O, Carroll PR, Chan JM, Disaia P, Glenn P, Kelley RK, Landen CN, Phillips J, Prados M, Simko J, Smith-McCune K, VandenBerg S, Roggin K, Fehrenbach A, Kendler A, Sifri S, Steele R, Jimeno A, Carey F, Forgie I, Mannelli M, Carney M, Hernandez B, Campos B, Herold-Mende C, Jungk C, Unterberg A, von Deimling A, Bossler A, Galbraith J, Jacobus L, Knudson M, Knutson T, Ma D, Milhem M, Sigmund R, Godwin AK, Madan R, Rosenthal HG, Adebamowo C, Adebamowo SN, Boussioutas A, Beer D, Giordano T, Mes-Masson A-M, Saad F, Bocklage T, Landrum L, Mannel R, Moore K, Moxley K, Postier R, Walker J, Zuna R, Feldman M, Valdivieso F, Dhir R, Luketich J, Pinero EMM, Quintero-Aguilo M, Carlotti CG, Dos Santos JS, Kemp R, Sankarankuty A, Tirapelli D, Catto J, Agnew K, Swisher E, Creaney J, Robinson B, Shelley CS, Godwin EM, Kendall S, Shipman C, Bradford C, Carey T, Haddad A, Moyer J, Peterson L, Prince M, Rozek L, Wolf G, Bowman R, Fong KM, Yang I, Korst R, Rathmell WK, Fantacone-Campbell JL, Hooke JA, Kovatich AJ, Shriver CD, DiPersio J, Drake B, Govindan R, Heath S, Ley T, Van Tine B, Westervelt P, Rubin MA, Lee JI, Aredes ND, Mariamidze A. Oncogenic signaling pathways in the Cancer genome atlas. Cell. 2018;173:321–337. doi: 10.1016/j.cell.2018.03.035. [DOI] [PMC free article] [PubMed] [Google Scholar]
- Sancho M, Di-Gregorio A, George N, Pozzi S, Sánchez JM, Pernaute B, Rodríguez TA. Competitive interactions eliminate unfit embryonic stem cells at the onset of differentiation. Developmental Cell. 2013;26:19–30. doi: 10.1016/j.devcel.2013.06.012. [DOI] [PMC free article] [PubMed] [Google Scholar]
- Santos SD, Verveer PJ, Bastiaens PI. Growth factor-induced MAPK network topology shapes erk response determining PC-12 cell fate. Nature Cell Biology. 2007;9:324–330. doi: 10.1038/ncb1543. [DOI] [PubMed] [Google Scholar]
- Slattum G, Gu Y, Sabbadini R, Rosenblatt J. Autophagy in oncogenic K-Ras promotes basal extrusion of epithelial cells by degrading S1P. Current Biology. 2014;24:19–28. doi: 10.1016/j.cub.2013.11.029. [DOI] [PMC free article] [PubMed] [Google Scholar]
- Sternlicht MD, Sunnarborg SW, Kouros-Mehr H, Yu Y, Lee DC, Werb Z. Mammary ductal morphogenesis requires paracrine activation of stromal EGFR via ADAM17-dependent shedding of epithelial amphiregulin. Development. 2005;132:3923–3933. doi: 10.1242/dev.01966. [DOI] [PMC free article] [PubMed] [Google Scholar]
- Takeuchi Y, Narumi R, Akiyama R, Vitiello E, Shirai T, Tanimura N, Kuromiya K, Ishikawa S, Kajita M, Tada M, Haraoka Y, Akieda Y, Ishitani T, Fujioka Y, Ohba Y, Yamada S, Hosokawa Y, Toyama Y, Matsui T, Fujita Y. Calcium wave promotes cell extrusion. Current Biology. 2020;30:670–681. doi: 10.1016/j.cub.2019.11.089. [DOI] [PubMed] [Google Scholar]
- Tranquillo RT, Lauffenburger DA, Zigmond SH. A stochastic model for leukocyte random motility and chemotaxis based on receptor binding fluctuations. The Journal of Cell Biology. 1988;106:303–309. doi: 10.1083/jcb.106.2.303. [DOI] [PMC free article] [PubMed] [Google Scholar]
- Xu P, Derynck R. Direct activation of TACE-mediated ectodomain shedding by p38 MAP kinase regulates EGF receptor-dependent cell proliferation. Molecular Cell. 2010;37:551–566. doi: 10.1016/j.molcel.2010.01.034. [DOI] [PMC free article] [PubMed] [Google Scholar]
- Yamamoto S, Yako Y, Fujioka Y, Kajita M, Kameyama T, Kon S, Ishikawa S, Ohba Y, Ohno Y, Kihara A, Fujita Y. A role of the sphingosine-1-phosphate (S1P)-S1P receptor 2 pathway in epithelial defense against Cancer (EDAC) Molecular Biology of the Cell. 2016;27:491–499. doi: 10.1091/mbc.e15-03-0161. [DOI] [PMC free article] [PubMed] [Google Scholar]
- Yang X, Dormann D, Münsterberg AE, Weijer CJ. Cell movement patterns during gastrulation in the chick are controlled by positive and negative chemotaxis mediated by FGF4 and FGF8. Developmental Cell. 2002;3:425–437. doi: 10.1016/S1534-5807(02)00256-3. [DOI] [PubMed] [Google Scholar]
- Yao Z, Torres NM, Tao A, Gao Y, Luo L, Li Q, de Stanchina E, Abdel-Wahab O, Solit DB, Poulikakos PI, Rosen N. BRAF mutants evade ERK-Dependent feedback by different mechanisms that determine their sensitivity to pharmacologic inhibition. Cancer Cell. 2015;28:370–383. doi: 10.1016/j.ccell.2015.08.001. [DOI] [PMC free article] [PubMed] [Google Scholar]
- Zunke F, Rose-John S. The shedding protease ADAM17: physiology and pathophysiology. Biochimica Et Biophysica Acta (BBA) - Molecular Cell Research. 2017;1864:2059–2070. doi: 10.1016/j.bbamcr.2017.07.001. [DOI] [PubMed] [Google Scholar]