


Abstract
Long non-coding RNAs (lncRNAs) can affect multiple layers of gene expression to control crucial cellular functions. We have previously demonstrated that the lncRNA EPR, by controlling gene expression at different levels, affects cell proliferation and migration in cultured mammary gland cells and impairs breast tumor formation in an orthotopic transplant model in mice. Here, we used ChIRP-Seq to identify EPR binding sites on chromatin of NMuMG mammary gland cells overexpressing EPR and identified its trans binding sites in the genome. Then, with the purpose of relating EPR/chromatin interactions to the reshaping of the epitranscriptome landscape, we profiled histone activation marks at promoter/enhancer regions by ChIP-Seq. Finally, we integrated data derived from ChIRP-Seq, ChIP-Seq as well as RNA-Seq in a comprehensive analysis and we selected a group of bona fide direct transcriptional targets of EPR. Among them, we identified a subset of EPR targets whose expression is controlled by TGF-β with one of them—Arrdc3—being able to modulate Epithelial to Mesenchymal Transition. This experimental framework allowed us to correlate lncRNA/chromatin interactions with the real outcome of gene expression and to start defining the gene network regulated by EPR as a component of the TGF-β pathway.
INTRODUCTION
In the last few years a large number of long non-coding RNAs (lncRNAs) have been discovered in mammalian genomes (1,2). Recent studies pointed to lncRNAs as regulators of fundamental aspects of biology due to their ability to reprogram gene expression and influence distinct cellular functions including cell fate determination, cell cycle progression, apoptosis and aging (3,4). Altered lncRNA expression has been related to the dysregulation of crucial cellular circuitries and may be involved in multiple human diseases including cancer (5,6). LncRNAs can affect gene expression by controlling the function of transcriptional complexes, modulating chromatin structure, participating into ribonucleoprotein complexes or acting as decoys for proteins or micro-RNAs (4). The ability of lncRNAs to interact with other RNA molecules as well as with DNA and proteins accounts for their multiple roles in regulating distinct layers of gene expression (4). LncRNAs have been shown to control gene transcription at the chromatin level by targeting chromatin-modifying enzymes or transcription regulators to specific genomic sequences either via direct interaction with nucleic acids or via specific protein partners (3,4,7). Recently developed high-throughput techniques—chromatin isolation by RNA purification (ChIRP), capture hybridization analysis of RNA targets (CHART), chromatin oligo affinity precipitation (ChOP), and RNA antisense purification (RAP)—have boosted the discovery of chromatin targets of some lncRNAs (8–12). Nonetheless, limited attempts to correlate lncRNA/chromatin interactions with the actual outcome in terms of gene expression regulation have been made.
We have recently reported on EPR (acronym of Epithelial Program Regulator, a.k.a. BC030870 in mouse), an intergenic lncRNA highly enriched in epithelial tissues and well conserved in human and mouse (13). Although EPR contains an open reading frame that is translated into a small peptide localized at epithelial cell junctions, we reported that the lncRNA profoundly affects gene expression with the majority of changes being independent of the peptide biogenesis as shown by the phenotypic analysis of two independent point mutants that abrogate the peptide biogenesis (13). We also found that EPR overexpression prevents TGF-β-induced Epithelial to Mesenchymal Transition (EMT) and inhibits cell proliferation (13). This last aspect was investigated in detail and we found that EPR regulates the expression of Cdkn1a, the gene encoding the cyclin-dependent kinase inhibitor CDKN1A (p21WAF1/Cip1), at both transcriptional and post-transcriptional levels by interacting with the transcription factor SMAD3 and the RNA-binding protein KHSRP (13). EPR overexpression in mammary gland cells restrains cell proliferation and migration, and impairs breast tumor formation in an orthotopic transplant model in mice (13).
Here, we identified EPR binding sites on chromatin across the genome of EPR-overexpressing immortalized NMuMG mammary gland cells by ChIRP-Seq and, with the aim of relating EPR/chromatin interactions to the reshaping of the epitranscriptome, we profiled histone activation marks at promoter/enhancer regions by ChIP-Seq. The integration of ChIRP-Seq, ChIP-Seq as well as RNA-Seq data allowed us to derive a map of genuine direct transcriptional targets whose expression is activated by EPR in mammary gland cells and to identify a subset of targets that are regulated during TGF-β-induced EMT in mammary gland cells.
MATERIALS AND METHODS
Cell lines, transient transfections and cell treatments
Murine immortalized NMuMG cells (ATCC, no. CRL-1636) were cultured in DMEM plus 10% FBS and 10 μg/ml bovine insulin (Sigma-Aldrich). NMuMG cells stably over-expressing EPR (NMuMG-EPR) as well as cells stably transfected with the empty vector (mock) have been previously described (13) and were maintained in selective medium containing 800 μg/ml G418 (Sigma-Aldrich). Both wild-type NMuMG and NMuMG-EPR cells were transiently transfected with either control siRNAs or siRNA designed to knockdown murine EPR (5′-GAGCAAAAGAGAAUGCUUA-3′) (Thermo Fisher) using the Lipofectamine 2000 (Thermo-Fisher). NMuMG-EPR were transiently transfected with either control siRNA or with endoribonuclease-prepared esiRNA designed to knockdown murine Arrdc3 (EMU189761 from Sigma-Aldrich) using the Lipofectamine 2000 (Thermo-Fisher). For some experiments NMuMG and NMuMG-EPR cells were maintained in DMEM supplemented with 2% for 16 h prior to the addition of 5 ng/ml human recombinant TGF-β1 purchased from R&D Systems. SB431542 compound was purchased from Sigma-Aldrich, dissolved in Dimethyl sulfoxide (DMSO), and used at a 1 μM concentration.
qRT-PCR, analysis of nascent transcripts
Total RNA was isolated using the TriPure reagent (Roche) and retro-transcribed (50 ng) using Transcriptor Reverse Transcriptase (Roche) and random hexamers according to manufacturer's instructions. Quantitative PCR was performed using the Precision 2X QPCR master mix (Primer Design), and the Realplex II Mastercycler (Eppendorf) according to manufacturer's instructions. The sequence-specific primers utilized for PCR reactions are listed in Supplementary Table S1 and have been synthesized by TIB MolBiol (Genova). In order to analyze gene expression changes among the pool of nascent mRNAs, we adopted the Click-iT Nascent RNA Capture kit (ThermoFisher) and performed experiments according to manufacturer's instructions. Either NMuMG-EPR or mock cells were pulsed with 0.5 mM 5-ethynyl Uridine (EU) for 1 hour, clicked, retrotranscribed, and analyzed by qRT-PCR according to Click-iT Nascent RNA Capture kit instructions.
Chromatin isolation by RNA purification (ChIRP) and high-throughput sequencing
Chromatin isolation by RNA purification (ChIRP) was performed according to the protocol published by Chu et al. (9) with minor modifications. Briefly, 2.5 × 10⁷ NMuMG-EPR cells were crosslinked in 1% glutaraldehyde in PBS at room temperature for 10 min on an end-to-end rotator. After glutaraldehyde quenching and repeated washes, cell pellets were weighted and resuspended in 1.0 ml of complete lysis buffer (50 mM Tris–Cl pH 7.0, 10 mM EDTA, 1% SDS, 1× Complete (Roche), 500U RNAse inhibitor) per each 100 mg of cell pellet. Cell suspensions were sonicated for 90 min (power set to 70%) and the sonicated cell lysate was centrifuged at 16 100 × g at 4°C for10 minutes. Lysates were divided into two 1 ml aliquots, transferred into polypropylene tubes, mixed with 2 ml Complete Hybridization Buffer (750 mM NaCl, 1% SDS, 50 mM Tris–Cl, pH 7.0, 1 mM EDTA, 15% formamide, 1× Complete, 1000 U RNAse Inhibitor) and hybridized with 1 μl (100 pmol) of either EVEN or ODD pools of 20-mer 3′ Bio-TEG DNA oligonucleotides designed with single-molecule FISH online designer (Stellaris) (see Supplementary Table S1), respectively. Hybridization was carried out at 37°C for 4 h under continuous shaking. Since the two pools of ODD and EVEN probes are different, the two respective pools of chromatin pulled-down by off-target hybridization would be different while only the chromatin DNA associated with EPR would be commonly pulled down by both the ODD and EVEN probes (9). Seventy microliters of pre-washed C-1 magnetic beads (Thermo Fisher) were added to each hybridization mixture for 30 min at 37°C under continuous shaking. Beads were immobilized and washed four times for 5 min at 37°C with shaking (wash buffer: 2× NaCl and sodium citrate (SSC), 0.5% SDS, 1× Complete). While one aliquot (10% of the material) was utilized for RNA extraction, the remaining 90% was subject to DNA purification by incubating two times each bead pellet with 150 μl complete DNA elution buffer (50 mM NaHCO3, 1% SDS, 25 μg/ml RNAseA, 100 U/ml RNAseH) for 30 min at 37°C with shaking. Eluted DNA was incubated with Proteinase K (1 mg/ml final dilution) for 45 min at 50°C with shaking, extracted with phenol/chlorophorm/isoamylalchool and ethanol-precipitated. ChiRP was performed in triplicate and precipitated DNA was utilized either for library construction or qPCR analysis using specific primers (Supplementary Table S1). Libraries were constructed using the ChIP Elute Kit and DNA SMART ChIP-Seq Kit sequencing library preparation from low-input DNA templates (Illumina), 75 nt paired-end.
ChIP-Seq and ChIP-qPCR
ChIP experiments were performed as previously described (13) with minor modifications. Briefly, lysates were generated from 40 × 106 cells. Each lysate was immunoprecipitated with 1 μg of anti-histone H3 lysine 4 trimethylated (H3K4me3, ab8580 from Abcam), 2 μg anti-histone H3 lysine 27 acethylated (H3K27ac, ab4729 from Abcam), 4 μg anti-SMAD3 (ab28379 from Abcam) antibodies (and the corresponding control IgG). Antibodies were prebound to 20 μl of A/G protein-coupled paramagnetic beads (Thermo Fisher) in PBS/BSA 0.5% for 2 h at 4°C. Beads were then added to lysates, and incubation was allowed to proceed overnight. Beads were washed six times in a modified RIPA buffer (50 mM HEPES [pH 7.6], 500 mM LiCl, 1 mM EDTA, 1% NP-40 and 0.7% Na-deoxycholate) and once in TE containing 50 mM NaCl. DNA was eluted in TE containing 2% SDS and crosslinks reversed by incubation at 65°C for 2 h. DNA was then purified by Qiaquick columns (Qiagen). Each ChIP experiment was performed in triplicate. DNA was utilized either for library construction or qPCR analysis using specific primers (Supplementary Table S1). Libraries were constructed using the ChIP Elute Kit and DNA SMART ChIP-Seq Kit sequencing library preparation from low-input DNA templates (Illumina), 75nt paired-end. For some experiments the Magna ChIP™ A/G Chromatin Immunoprecipitation Kit (Merck–Millipore) was used with identical results.
RNA-Seq analyses
RNA-Seq data were processed as previously described in (13). Briefly, raw reads (GSE113178) were trimmed at the ends to remove low-quality calls with FASTX (http://hannonlab.cshl.edu/fastx_toolkit). Paired-end reads were aligned and mapped to indexed mm10 genome with STAR (v 2.3.0e_r291). To quantify expression levels, mapped reads were counted from BAM files with HTSeq counts version 1.2.1 in intersection-strict mode, feature type exon and id attribute gene_name against reference annotation Ensembl GRCm38.74. Abundance files were imported in R.3.1.1 with the tximport function from the package TxImport.1.2.0, with option txOut = TRUE to quantify alternatively spliced transcripts. edgeR_3.16.5 and limma_3.30.13 were used to log2 transform transcripts count in count per million (cpm). Only transcript with ≥1 cpm in at least three samples were retained. cpm were then transformed by library size and normalized by mean variance with limma-voom. Statistics and log-ratio were calculated with limma-eBayes (13). We kept mock vs EPR differentially expressed transcripts when the observed Bayesian statistic was significant (Benjamini and Hochberg corrected P value < 0.01; |log FC| > 1.5). In order to test for the biological coefficient of variation and to predict statistical power we took advantage of the RnaSeqSampleSize (Bioconductor) package (https://bioconductor.org/packages/release/data/experiment/html/RnaSeqSampleSizeData.html) applying the following set of parameters: (i) number of samples in each group: 3; (ii) minimal fold change between two groups: 2.8 (log FC 1.5); (iii) prior data: User's prior dataset with nine samples; (iv). false discovery rate: 0.01. Meta-analysis of EPR expression in mouse mammary gland datasets derived from single cell RNA-Seq (14) was performed using the online tool available at the website https://marionilab.cruk.cam.ac.uk/mammaryGland/.
Analysis of h.EPR (LINC01207) expression in human samples
Meta-analysis of RNA-Seq data of h.EPR in normal samples was performed by searching for h.EPR (LINC01207) expression in different subpopulations of FACS-sorted normal breast cells (15). Correlation analysis between the expression levels of EPR targets and epithelial markers in both breast invasive carcinoma and normal samples from the TCGA datasets as well as normal mammary gland tissues was performed using GEPIA2 (an online tool for analyzing the RNA sequencing expression data, (16)). In order to investigate h.EPR expression in breast cancer samples we interrogated publicly available cancer omics TCGA data using the interactive web resource UALCAN (17).
ChIRP-Seq analyses
Raw reads were processed with BBDUK (https://jgi.doe.gov/data-and-tools/bbtools/) to remove low quality and adapters sequences from both ends. The resulting trimmed reads were aligned by BWA-mem (18) with a mouse reference genome (mm10) and duplicate reads were marked with Sambamba (19). BigWig profiles were generated to visually inspect genomic enrichments. Peaks were detected for each sample using MACS2 (20) version 2.1.1 (parameters: -g mm –llocal 100 000). A common set of peaks were obtained by merging overlapping peaks between samples. R 3.6.2 Bioconductor package ChIPpeakAnno (21) version 3.20.0 was used to annotate the resulting peaks to the reference annotation Ensembl GRCm38 release 74. A gene is associated with a peak as a proximal target while the center of the peak itself is located up to 6 kb upstream or up to 500 bp downstream respect to the transcription start site (TSS) of the gene. A gene is associated with a peak as a distal target while: (i) the center of the peak itself is located between 50 and 6 kb upstream respect to the transcription start site (TSS) of the gene and (ii) it's the nearest gene to the peak. Motif analysis of the resulting peaks was performed using HOMER (22) version 4.9.1 tool findMotifsGenome.pl. DNA binding domains (DBD) analysis was performed using Triplex Domain Finder (23) with the default randomization processes performed for 10 000 times and the minimum length of triplex (–l) set to 14. Raw data along with processed files (BigWig) have been deposited in the GEO (https://www.ncbi.nlm.nih.gov/geo/) database with accession number GSE147208.
ChIP-Seq analyses
Raw reads were processed with BBDUK (https://jgi.doe.gov/data-and-tools/bbtools/) to remove low quality and adapters sequences from both ends. The resulting trimmed reads were aligned by BWA-mem (13) with a mouse reference genome (mm10) and duplicate reads were removed with GATK PicardTools MarkDuplicates (http://broadinstitute.github.io/picard/). BigWig profiles were generated to visually inspect genomic enrichments. Peaks were detected for each sample using MACS2 (20) version 2.1.1. Differential binding analysis was performed separately for H3K4me3 and H3k27ac experiments using R version 3.6.1 Bioconductor package DiffBind (24) version 2.14.0. R 3.6.2 Bioconductor package ChIPpeakAnno (21) version 3.20.0 was used to annotate the resulting differentially bound sites to the reference annotation Ensembl GRCm38 release 74. A gene is associated with a differentially bound site as a proximal target while the center of the site itself is located up to 6 kb upstream or up to 500 bp downstream respect to the transcription start site (TSS) of the gene. A gene is associated with a differentially bound site as a distal target while: (i) the center of the site itself is located between 50 and 6 kb upstream respect to the transcription start site (TSS) of the gene and (ii) it's the nearest gene to the site. Volcano plots showing differentially bound sites and their corresponding annotated genes were rendered using R packages ggplot2 (25) version 3.3.0. Raw data along with processed files (BigWig) have been deposited in the GEO (https://www.ncbi.nlm.nih.gov/geo/) database with accession number GSE148182.
Integrative multi-omics analyses
Intersections between annotated genes from RNA-seq, ChIRP-seq, and ChIP-seq datasets were performed and rendered using R version 3.6.1 package UpSetR (26) version 1.4.0.
RESULTS
Systematic identification of EPR-chromatin–binding sites
We have previously shown that the lncRNA EPR over-expression causes a vast reshaping of gene expression pattern in immortalized NMuMG mammary gland cells and we focused our previous studies on the transcriptional and post-transcriptional regulation of Cdkn1a gene (13). Here we wanted to systematically analyze the role of EPR on transcriptional control at the genomic scale to uncover additional direct target genes that may contribute to the multifaceted phenotype displayed by EPR-overexpressing cells.
First, we analyzed in depth our previous RNA-Seq data and noticed that 67% of the genes whose expression is significantly affected (Benjamini and Hochberg corrected P value < 0.01; |log2 FC| ≥ 1.5) in NMuMG-EPR when compared mock is upregulated.
Some of the gene expression changes detected by RNA-Seq were validated by RT-qPCR analysis in Rossi et al. (13). Here, in order to strengthen our results, we (i) extended the validation to genes whose expression increment has a FC closer to the minimum threshold (Supplementary Figure S1A) and (ii) performed statistical power analysis of the data that yielded an estimation of 94%. Then, we measured the nascent transcript levels of a number of genes upregulated in NMuMG-EPR and found that EPR overexpression results in a significant enhancement of gene transcription (Figure 1A). To select direct transcriptional targets of EPR, we adopted the experimental pipeline schematically described in Figure 1B.
Figure 1.

(A) qRT-PCR analysis of nascent mRNAs in NMuMG cells stably transfected with either the empty vector (mock, black bars) or EPR (NMuMG-EPR, green bars). Please note the logarithmic scale of the graph. The values of qRT-PCR experiments shown are averages (±SEM) of three independent experiments performed in triplicate. Statistical significance: **P < 0.001 (Student's t test). (B) Schematic representation of the experimental framework adopted in this study.
First, to perform genome-wide mapping of EPR binding sites, we used chromatin isolation by RNA purification followed by high throughput sequencing (ChIRP-Seq) (9). We generated an average of 12.5 million mapped paired-end reads for each of two independent pools of EPR-bound oligonucleotides (indicated as ODD or EVEN, see Materials and Methods and Supplementary Table S1). The two pools of oligonucleotides yielded similar ChIRP-Seq results, as revealed by a significant (P < 0.05) Pearson's correlation (r = 0.74). qRT-PCR-based analysis of input and pulled-down RNA showed that both ODD and EVEN oligonucleotides pulled-down >75% of EPR RNA while they did not pull-down Rpl32 mRNA (non-specific control, Supplementary Figure S1B). EPR binding to chromatin displayed a significant enrichment at its own genomic site of transcription while no enrichment was detected at nearby genes (in a 1 Mb region of chromosome 8) thus ruling out a possible cis-regulatory role (Supplementary Figure S1C and (13)).
Considering the concordant sites in both EVEN and ODD pools, we identified 23,382 EPR binding sites. As reported for other lncRNAs, EPR binding sites are numerous, focal, and interspersed in the genome (9,12). Binding sites are characterized by a median length of 393 nt, are evenly distributed throughout the chromosomes (Supplementary Figure S1D), and are enriched in gene-populated regions (Supplementary Figure S1E, upper panel). More specifically, EPR binding sites accumulate in proximity of the transcriptional units but are strongly depleted in the immediate adjacency of the transcription start sites (TSS) (Supplementary Figure S1E, lower panel).
We analyzed the density of EPR binding sites in the genomic regions spanning from the TSS to 500 kb upstream and tested the enrichment of genes upregulated in NMuMG-EPR compared to mock at incremental distances (50, 100, 150 and 500 kb upstream) (Fisher's exact test). As shown in the density plot presented in Supplementary Figure S1F, the highest density of binding sites is located in the region between TSS and –50 kb. Similarly, the highest concentration of peaks detected in genes upregulated in NMuMG-EPR compared to mock is located in the same region with a significant enrichment (P < 0.05, odds ratio > 1) (Supplementary Figure S1F). Thus, we focused on 5777 EPR target genes that are in this genomic region and, henceforth, we will indicate as ‘proximal’ targets those genes that show EPR binding site in a region located between the TSS and –6.0 kb and as ‘distal’ targets those genes that display EPR binding sites in a region spanning from –6.0 kb and –50 kb. Examples of EPR interaction with proximal and distal targets are shown in Figure 2A and qPCR-based validation of the ChIRP-Seq results is shown in Figure 2B.
Figure 2.
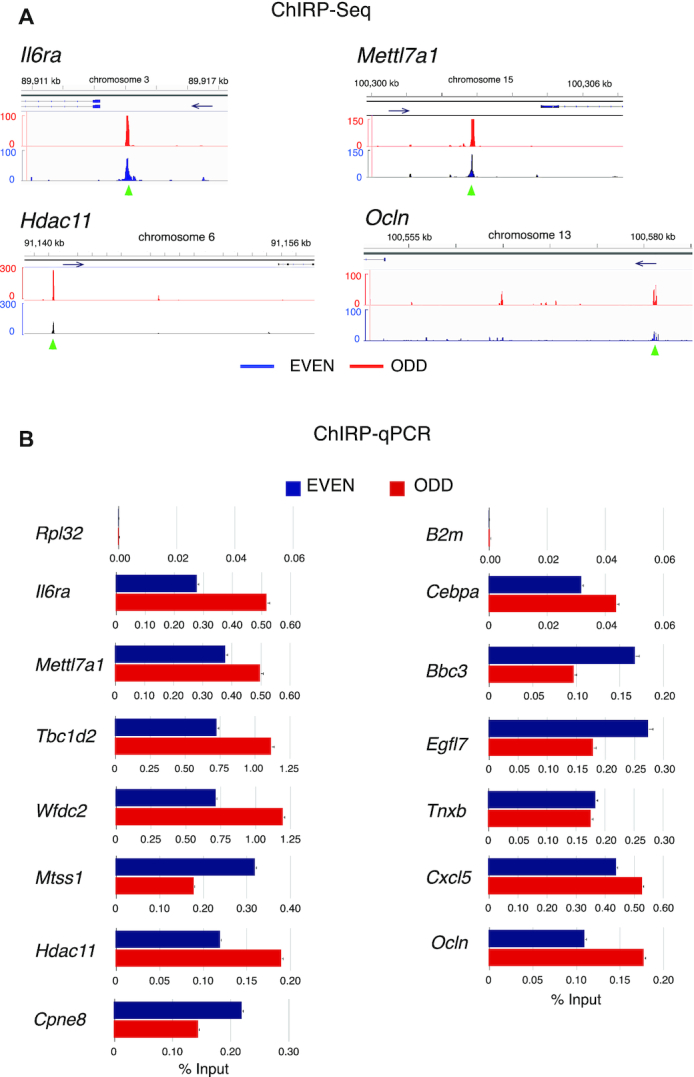
ChIRP-Seq analysis of chromatin targets of EPR. (A) Representative snapshots of ChIRP-Seq experiments—centered on the indicated genes—showing two proximal (Il6ra, Mettl7a1) and two distal (Hdac11, Ocln) targets of EPR. The genomic coordinates of each target gene are represented on the top of each panel. The position of the relevant ChIRP peaks (overlapping in both EVEN and ODD samples) is marked by a green arrowhead while blue arrows indicate the transcription direction. (B) qPCR analysis of the EPR genomic targets. Both input DNA and DNA purified using either ODD (red bars) or EVEN (blue bars) tiling oligonucleotides were analyzed by qPCR to amplify a region in Rpl32 and B2m genes (negative controls) or the indicated target genes. Values, represented as percentage of input, are averages (±SEM) of three independent experiments performed in triplicate.
We previously reported that EPR recruits SMAD3 molecules at the Cdkn1a promoter thus affecting its transcription (13). Using the HOMER tool (22) to search for de novo DNA-binding motifs in chromatin regions targeted by EPR, we found a significant enrichment, among others, of SMAD3 consensus motifs in proximal targets (Figure 3A, P < 1e–26). We validated the interaction of SMAD3 to a representative number of EPR target sites by anti-SMAD3 ChIP analysis (Figure 3B).
Figure 3.
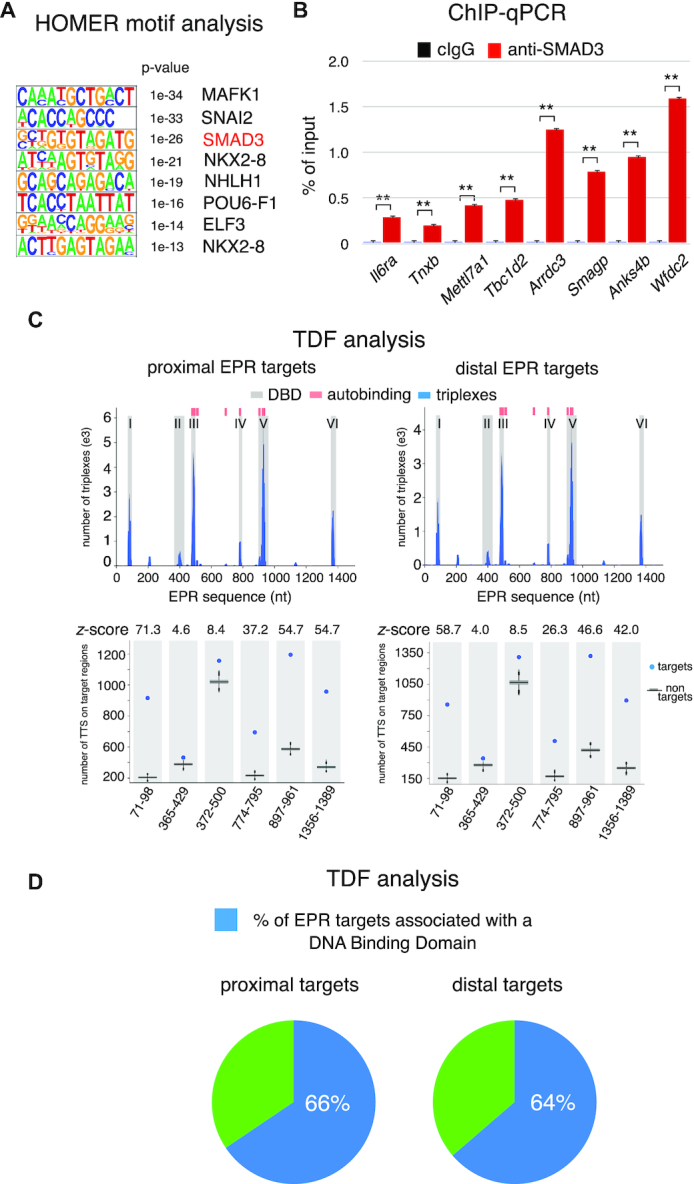
Analyses of EPR genomic targets. (A) HOMER de novo transcription factor binding motifs enriched in either proximal (left) or distal (right) binding sites of EPR to chromatin. P-values for motif enrichment are shown. (B) Chromatin prepared from NMuMG-EPR was immunoprecipitated using either normal mouse IgG (cIgG) or mouse monoclonal anti-SMAD3 antibody. The association of SMAD3 with a select group of EPR binding sites on chromatin was verified by qPCR using specific primers. The values of qPCR experiments shown are averages (±SEM) of three independent experiments performed in triplicate. Statistical significance: **P < 0.001 (Student's t test). (C) Triplex Domain Finder (TDF) analysis of the interaction between EPR and its proximal (left) or distal (right) targets. Upper panels, the number of triplexes is shown in blue while regions highlighted in grey indicate significant DNA binding domains (DBDs) (y-axis). The position of triplexes and DBDs is presented with respect to the EPR sequence (x-axis). Pink bars mark the position of EPR regions able to undergo autobinding. Lower panels, TDF analysis reveals a high propensity (higher z-score) of domains I, V and VI of EPR to form triple helices when compared to other domains. (D) Pie charts showing the percentage of EPR target sequences that can associate with EPR DNA binding domains.
Altogether, ChIRP-seq analysis allowed us to identify trans-genomic binding sites for EPR with many of them being associated to potential regulatory regions.
Interaction mode of EPR with chromatin
Formation of triple helix nucleic acid structures, involving Hoogsteen base-pairing interactions between RNA and the major groove of double-stranded DNA, has been described (27). It has been reported that several of lncRNAs use this mechanism to directly target specific sequences across the genome and exert their regulatory functions (28–30). A computational method, denominated Triplex Domain Finder (TDF), has been recently developed by Costa et al. to detect triplex forming regions in lncRNAs and in their targets across the human genome (23). We adopted TDF to investigate the ability of EPR to form triplexes with either its proximal or distal targets. TDF analysis revealed six distinct DNA Binding Domains (DBDs, designated I-VI) with domains I, V and VI displaying a high propensity (higher z-score) to form triple helices with EPR targets (Figure 3C). Our analysis revealed also that EPR has the potential to form triple helices in cis at the exact location where it is transcribed (so-called autobinding, (23,30)) (Figure 3C). Figure 3D shows that approximately two thirds of EPR targets can associate to its DBDs thus originating triplex target DNA sites (TTSs). Interestingly, these results are similar for proximal and distal regulatory targets.
Altogether, our data suggest that EPR has the potential to interact with the majority of its targets through triple helix formation.
Chromatin profiling reveals that EPR overexpression reshapes the landscape of histone marks at active promoter/enhancer regions
We investigated on a genomic scale whether EPR over-expression in NMuMG cells affects the deposition of epigenetic marks of transcriptional activation on chromatin. To this purpose, we profiled by ChIP-Seq analysis the genomic occupancy of histone H3 lysine 27 acetylated (H3K27ac)—a mark associated with active promoters and enhancers (31,32)—and of histone H3 lysine 4 trimethylated (H3K4me3)—which selectively marks active and poised transcription start sites (33,34)— in NMuMG-EPR compared to mock. As shown in the heatmaps presented in Supplementary Figure S2A and S2B, EPR over-expression enhances the deposition of either H3K27ac or H3K4me3 marks, respectively, at a large number of genes. We validated ChIP-Seq results by ChIP-qPCR analysis as presented in Supplementary Figure S2C. Volcano plot analyses shown in Figure 4A and B show that EPR over-expression strongly enhances the number of genes that are transcriptionally activated or poised to be transcribed.
Figure 4.
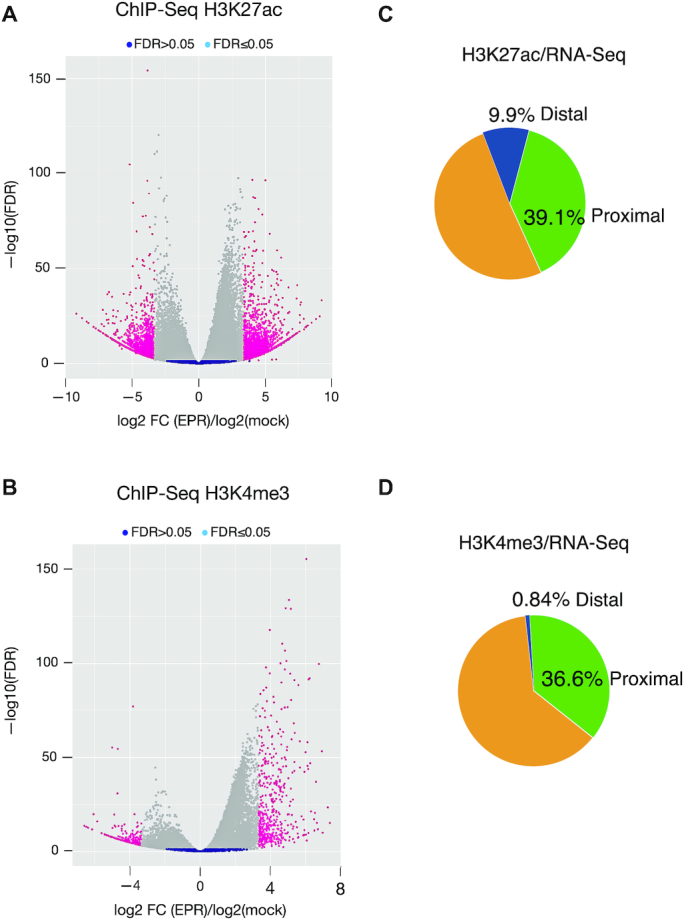
Profiling of activation histone marks. (A and B). Volcano plots showing genes with differential occupancy by either H3K27ac (panel A) or H3K4me3 (panel B) marks in NMuMG-EPR versus mock. (C and D) Pie graphs showing the percentage of genes that, among those induced in NMuMG-EPR when compared to mock, display enhanced occupancy by either H3K27ac (panel C) or H3K4me3 (panel D) marks in proximal and distal regions as indicated.
In order to correlate the induction of histone activation marks with gene expression changes, we intersected the list of genes displaying enhanced levels of either H3K27ac or H3K4me3 marks with the list of genes whose expression is increased in NMuMG-EPR when compared to mock. Figure 4C shows that 50% of genes whose expression is upregulated in NMuMG-EPR presents enhanced levels of H3K27ac (39.1% in proximal, and 9.9% in distal regions, respectively). As expected, the number of genes that display enhanced H3K4me3 mark at distal regulatory location is extremely limited (0.84%) while 37.4% of genes whose expression is upregulated in NMuMG-EPR presents enhanced levels of this activation mark at proximal regions (Figure 4D).
Altogether, our data indicate that approximately one half of genes induced by EPR overexpression display accumulation of histone marks of gene transcriptional activation predominantly at their promoter/TSS regions.
Bona fide direct transcriptional targets of EPR
Final aim of this study was to identify bona fide direct targets of EPR among genes that display enhanced deposition of histone activation marks at their promoter/enhancer regions and whose expression is increased in NMuMG-EPR.
First, to define if EPR binding to regulatory regions upstream of the TSS influences the deposition of histone activation marks, we intercrossed ChIRP-Seq data with ChIP-Seq profiles. As presented in Figure 5A, 17.25% of the proximal EPR target sites show enhanced deposition of the H3K4me3 mark upon EPR overexpression while, as expected, there was a minimal enrichment of H3K4me3 in the distal regions. In parallel, we calculated that 26.5% of EPR target genes (15.6% proximal and 10.87% distal) display enhanced accumulation of the H3K27ac mark in NMuMG-EPR compared to mock (Figure 5B).
Figure 5.

Identification of bona fide direct transcriptional targets of EPR. (A) Pie graph showing the percentage of genes that, among those directly bound by EPR, display enhanced H3K4me3 deposition at proximal or distal target regions upon EPR overexpression. (B) Pie graph showing the percentage of genes that, among those directly bound by EPR, display enhanced H3K27ac deposition at proximal or distal target regions upon EPR overexpression. (C) Pie graph showing the percentage of genes that, among those induced EPR overexpression in NMuMG cells, display EPR binding to either proximal or distal target regions. (D) UpSet plots showing the integration of the distinct genomic analyses performed in this study. The matrix shows the number of genes with the indicated combinations of enhanced gene expression (RNA-Seq), enhanced occupancy by either H3K27ac or H3K4me3, and presence of EPR binding (ChIRP-Seq). The size of datasets is represented by the horizontal bars displayed on the far right. (E) qRT-PCR analysis of the indicated transcripts in either mock or NMuMG-EPR cells. (F) qRT-PCR analysis of the indicated transcripts in either NMuMG-EPR (upper) or wild-type NMuMG cells (lower) transiently transfected with either control siRNA (siC) or siRNA designed to silence EPR expression (siEPR). The values of qRT-PCR experiments shown are averages (±SEM) of three independent experiments performed in triplicate. Statistical significance: *P < 0.01, **P < 0.001 (Student's t test).
Next, we intersected data derived from ChIRP-Seq with our previous RNA-Seq (13). As shown in Figure 5C, ∼20% of upregulated genes display binding sites for EPR in their promoter/enhancer regions (10.5% in proximal and 8.4% in distal regions, respectively).
To comprehensively integrate our data, we used UpSet plot representations. The matrix shown in Figure 5D, left panel, provides a synthetic view of the number of EPR direct genomic targets that are enriched with histone activation marks. The right panel of Figure 5D provides a view of the number of EPR targets that are enriched with the two histone activation marks and whose expression is enhanced in NMuMG-EPR compared to mock. This analysis resulted in the selection of 42 genes listed in Table 1. We calculated that 21 of these targets possess a TTS specifically associated with a DBD of EPR and, thus, may form a triple helix. Validation of the enhanced expression of a subset of these genes in NMuMG-EPR is shown in Figure 5E. Most important, Figure 5F shows that EPR silencing in both NMuMG-EPR and NMuMG cells significantly reduced the expression levels of a group of direct EPR target genes.
Table 1.
Bona fide direct transcriptional targets of EPR
| Gene name | Known biological function | TGF-β | Gene name | Known biological function | TGF-β |
|---|---|---|---|---|---|
| Anks4b | Intermicrovillar adhesion regulator | • | Hdac11 | Histone deacetylase | • |
| Arrdc3 | Negative regulator of locomotion | • | Hectd2 | Ubiquitin protein ligase | |
| Cdkn1a | Negative regulator of cell growth | Kif13b | Cytoskeleton reorganizer | • | |
| Celsr1 | Cell adhesion regulator | • | Man2b2 | Protein deglycosylase | |
| Cndp2 | Glutathione biosynthetic process regulator | Myo1d | Microfilament motor activity regulator | • | |
| Cp | Copper/iron ions transporter | • | Naip2 | Inflammasome complex component | • |
| Cpne8 | Modulator of cellular response to calcium ion | Nrbp2 | Intracellular signal transducer | ||
| Cth | Cysteine biosynthetic process component | • | Ocln | Cell-cell junction organizer | • |
| Cxcl5 | Chemokine-mediated signaling pathway component | • | Parm1 | Endoplasmic reticulum component | |
| Dnm1 | Receptor-mediated endocytosis regulator | Pik3c2b | PI3K family member, cell-cell junctions | • | |
| Ddit4 | Negative regulator of TOR signaling | Pilrb2 | Immune system regulator | • | |
| Endod1 | Endonuclease | Plac8 | Chromatin binding protein | • | |
| Erbb3 | Growth factor receptor, tight junctions component | • | Plekha7 | Epithelial cell-cell adhesion regulator | • |
| Fignl2 | Microtubule dynamics regulator | Scamp5 | Regulator of calcium-dependent exocytosis | • | |
| Fgd1 | Actin cytoskeleton organizer | Slc12a2 | Regulator of ionic balance and cell volume | • | |
| Fst | Activin antagonist | Smagp | Regulator of epithelial cell-cell contacts | • | |
| Gclc | Component of the cellular response to various stimuli | • | Spint2 | Negative regulator of cell motility | • |
| Gimd1 (Gm5549) | GTP binding protein | • | Stap2 | Signaling linker | • |
| Gsap | Regulator of proteolysis | • | Syt7 | Regulator of calcium-dependent exocytosis | |
| Grtp1 | GTPase activator | • | Tob1 | Anti-proliferative factor | • |
| H6pd | Glucose metabolism regulator, hallmark of EMT | • | Wfdc2 | Protease inhibitor | • |
List of bona fide direct transcriptional target genes of EPR. Dots mark genes whose expression is significantly down-regulated by TGF-β (24 h treatment, P< 0.001, Student's t test, see (36)).
Altogether, our strategy brought us to the identification of a set of genes that are bona fide functional direct transcriptional targets of EPR upon its binding to chromatin (from now on indicated as EPR targets).
Functional characterization of select EPR targets
We have reported that in both murine and human mammary gland cells EPR is expressed nearly exclusively in the luminal lineage (13). Thus, we investigated if EPR targets share the same cellular distribution with the lncRNA. Metadata analysis revealed that all EPR targets are expressed in luminal cells and, importantly, a large group of targets has prominent expression in mature and progenitor luminal cells when compared to other lineages as shown by both single cell RNA-Seq in mouse and RNA-Seq in human datasets (Supplementary Figure S2A and S3B, respectively, and data not shown, refs. 14,15).
Next, taking into account that EPR down-regulation by TGF-β signaling contributes to achieve the full spectrum of TGF-β effects in mammary gland cells (13), we wanted to investigate whether EPR targets undergo TGF-β-dependent regulation. Interestingly, the analysis of our previous RNA-Seq data derived from NMuMG cells treated with TGF-β (35), revealed that two thirds of EPR targets (28 out of 42) are significantly down-regulated in cells treated with TGF-β compared to control cells (Table 1). Examples of strong down-regulation of EPR targets upon 24 h of TGF-β treatment are presented in Figure 6A. The requirement of TGF-β type I receptor signaling was demonstrated by the ability of SB431542 compound (a selective inhibitor of ALK5, 4 and 7, (13)) to hinder TGF-β-induced down-regulation of EPR targets (Supplementary Figure S4). Importantly, EPR overexpression prevented TGF-β-induced down-regulation of the same targets (Figure 6B) thus indicating that EPR antagonizes the effect of TGF-β on the expression of its target genes.
Figure 6.
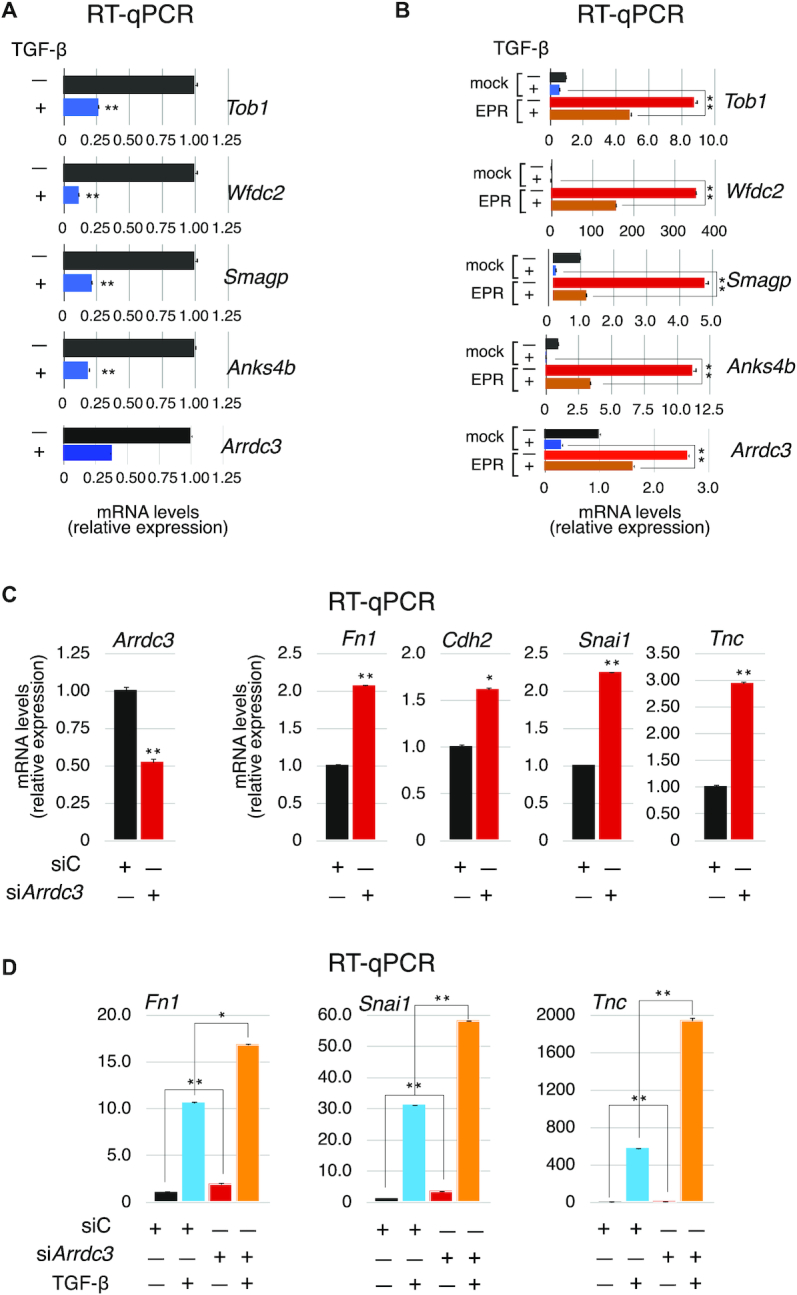
A group of direct EPR targets is regulated by TGF-β and silencing of the Arrdc3 gene upregulates the expression of EMT factors. (A) qRT-PCR analysis of the indicated targets of EPR in NMuMG cells serum-starved (2% FBS, 16 h) and either treated with TGF-β (5 ng/ml) for 24 h or untreated. (B) qRT-PCR analysis of the indicated EPR target transcripts in either mock or EPR-overexpressing (EPR) NMuMG cells serum-starved and either treated with TGF-β (+) for 24 h or left untreated (−). (C) qRT-PCR analysis of the indicated transcripts in NMuMG-EPR transiently transfected with either control esiRNA (siC) or esiRNA designed to silence Arrdc3 expression (siArrdc3). (D) qRT-PCR analysis of the indicated transcripts in NMuMG-EPR transiently transfected with either control esiRNA (siC) or esiRNA designed to silence Arrdc3 expression (siArrdc3). 24 hours after transfection, cells were serum starved and then either treated with TGF-β (+) for 24 h or left untreated (−). The values of qRT-PCR experiments shown are averages (±SEM) of three independent experiments performed in triplicate. Statistical significance: *P < 0.01, **P < 0.001 (Student's t test).
Among EPR targets, we focused on α-arrestin domain-containing protein-3 (ARRDC3) given its importance as a tumor suppressor in metastatic breast cancer (36,37) and evaluated the consequences of its siRNA-mediated silencing in NMuMG-EPR. Figure 6C shows that down-regulation of Arrdc3 in cells overexpressing EPR significantly increased the expression of the mesenchymal markers Fn1, Cdh2, Snai1 and Tnc that are hallmarks of EMT (38). Finally, Figure 6D shows that Arrdc3 knock-down in NMuMG-EPR significantly enhanced TGF-β-dependent induction of EMT markers.
Altogether our data uncover a group of TGF-β-regulated genes among EPR targets ARRDC3 being able to modulate Epithelial to Mesenchymal Transition.
DISCUSSION
Although some advances have been made over the last years through the development of novel technologies aimed at characterizing lncRNA/chromatin contacts, understanding the transcriptional control operated by lncRNAs remains a formidable challenge. A still open question in the field is to predict and define the transcriptional functionality of lncRNAs bound to chromatin. To our best knowledge, very few studies attempted to provide a comprehensive and systematic comparison between lncRNA/chromatin interactions and the final modulation of the expression of target genes (12,39). Here, we applied a combination of genomic approaches to identify target genes whose transcription is directly controlled by EPR in mammary gland cells overexpressing the lncRNA and uncovered, among them, select targets that belong to the TGF-β-modulated EMT pathway.
As it was described for other lncRNAs, EPR binds to numerous genes (9–12). To our surprise, the multi-omics selection strategy that we adopted yielded 42 genes that fulfill our experimental requirements, (i) to be directly contacted by EPR in regulatory regions upstream of the TSS, (ii) to show enhanced histone activation marks at their promoter/enhancer regions and (iii) to be upregulated in NMuMG-EPR when compared to mock. The selected genes can be considered as bona fide direct transcriptional targets of EPR and their small number can be undoubtedly ascribed to the stringent criteria that we applied to the analysis of RNA-Seq data with the purpose of minimizing the number of false positives (see Materials and Methods section). However, there can be other explanations that imply the existence of additional functional outcomes for EPR-chromatin interactions besides transcriptional activation. Although we observed a predominant upregulation of gene expression in NMuMG-EPR, it is possible that EPR interaction with some regulatory regions provokes downregulation of the expression of some target genes and additional studies will be required to explore this aspect. Indeed, our de novo motif analysis of EPR-bound genomic regions revealed enrichment of potential binding sites for transcription factors able to take part into either activation or repression complexes thus leaving open the possibility that EPR/chromatin interaction may result in either positive or negative control of gene expression. We must also consider that EPR binding to chromatin could be required for the co-transcriptional recruitment of protein complexes involved in post-transcriptional modifications of mRNA, such as polyadenylation and alternative splicing as it was suggested for other lncRNAs (40–42). Indeed, preliminary data from our laboratory indicate that EPR can associate with a polyadenylation complex (P.B. et al., unpublished).
Another interesting outcome derived from the matrix analysis presented in Figure 5D, is that we show a group of genes that are upregulated in NMuMG-EPR—in the presence or in the absence of histone activation marks—and do not interact with EPR in the regulatory regions that we analyzed. Indeed, it is possible that these genes are indirectly regulated by EPR through changes in the expression of direct EPR targets. We can also envisage the possibility that EPR binding to genomic regions that we did not analyze in this study (intronic or far-upstream enhancers) could mediate long-range three-dimensional arrangements of chromatin that can lead to enhanced expression of some genes. To this respect, chromosome conformation capture combined with high-throughput sequencing experiments applied to select genes that are upregulated in NMuMG-EPR overexpression—and do not display EPR binding to the genomic regions analyzed in this study—are in progress in our laboratory. Finally, taking into account that EPR was originally identified through its interaction with the mRNA decay promoting factor KHSRP and its ability to impair KHSRP activity (13), we can explain the upregulation of a group of genes that neither display direct interaction with EPR nor show enhanced histone activation marks with the hypothesis that their expression changes may result from the ability of EPR to prevent mRNA decay.
It has been suggested that lncRNAs may interact with chromatin via different modes (43). lncRNAs can be targeted to DNA through interaction with either chromatin and DNA modifiers, or proteins endowed with the dual capability to bind to RNA and DNA, or RNA binding proteins that, in turn, facilitate their interaction with DNA binding proteins (43). Although this represents a possible scenario for EPR that could be investigated through comprehensive searches for nuclear protein partners, our attention was drawn by the presence of stretches of high sequence homology between EPR and a large number of its target sequences. R-loops have been described as three-stranded RNA-DNA stretches that can form co-transcriptionally in the DNA template strand and mainly affect gene expression in cis. However, the evidence that EPR fails to interact with targets in cis, prompted us to exclude this mechanism and to investigate the possibility that EPR forms triple helix with DNA targets. Indeed, growing body of evidence supports the sequence-specific interaction of lncRNAs with DNA via triple-helix, a structure based on the insertion of a third strand into the major groove of the DNA duplex (27–30). This arrangement is based on the Hoogsteen base pairing rules, is usually enriched in promoters and other regulatory regions, and can play significant roles in the control of gene expression as supported by numerous experimental evidences (27–30). Intriguingly, two thirds of genes bound by EPR can associate with the lncRNA via triple-helix formation suggesting that this is the prevailing mode of EPR-DNA interaction.
In conclusion, we have identified several genes that are direct EPR targets in the genome and whose expression is regulated upon modulation of EPR levels. Interestingly, many of the bona fide direct transcriptional targets that we identified encode proteins involved in epithelial cell adhesion, polarity, migration, and proliferation accounting, at least in part, for the biological effects elicited by EPR in both cell cultures and animal models (13). We have previously provided evidence that EPR is rapidly and potently downregulated by TGF-β while its overexpression prevents TGF-β-induced EMT in mammary gland cells (13). Interestingly, our present data allow us to suggest that a large portion of EPR targets is regulated by TGF-β and silencing of one of them—the tumor suppressor Arrdc3—in NMuMG-EPR, enhances the expression of EMT mesenchymal markers. Considering that EPR directly activates at the transcriptional level a group of target genes whose expression is downregulated during TGF-β-induced EMT, it is tempting to hypothesize that EPR downregulation upon TGF-β results in downregulation of a set of EPR targets contributing to EMT. This hypothesis is corroborated also by the evidence that one of EPR targets, Ocln (a.k.a. Occludin), is a tight junction protein downregulated during EMT (44). Supplementary Figure S5A shows that OCLN expression—besides being well correlated with the prototypical epithelial factor CDH1 (a.k.a. E-Cadherin)—correlates also very well with some of the other EPR targets. Finally, the evidence that some of the EPR targets are down-regulated in breast adenocarcinomas in comparison to normal tissues is in keeping with our evidence that EPR overexpression restrains tumor growth in an animal model of orthotopic transplantation (Supplementary Figure S5B, (13)).
EPR targets that we have defined in this study represent the starting point to uncover further ramifications of EPR-centered signaling pathways.
DATA AVAILABILITY
Raw data from RNA deep-sequencing analyses have been published on the GEO archive under the accession GSE113178. These fastq files are available to the readers at the link https://www.ncbi.nlm.nih.gov/Traces/study/?acc=PRJNA450379&o=acc_s%3Aa. Raw and processed data for ChIRP-Seq and ChIP-Seq have been deposited under the accession numbers GSE147208 and GSE148182, respectively.
Supplementary Material
ACKNOWLEDGEMENTS
We thank Dr Luca Caputo (SBP Medical Discovery Institute, La Jolla, CA, USA), Davide Cittaro, Francesca Giannese, Giulia Scotti and Jose Garcia-Manteiga (IRCCS Ospedale San Raffaele) for discussions. We are grateful to people at TIB Mol. Biol. (Genova branch) for their professional assistance and to Laura Marcenaro and Laura Miscioscia for excellent administrative work.
Notes
Present address: Martina Rossi, Laboratory of Genetics and Genomics, National Institute on Aging Intramural Research Program, National Institutes of Health, Baltimore, Maryland 21224, USA.
Contributor Information
Ettore Zapparoli, Center for Omics Sciences, IRCCS Ospedale San Raffaele, 20132 Milano, Italy.
Paola Briata, Gene Expression Regulation Laboratory, IRCCS Ospedale Policlinico San Martino, 16132 Genova, Italy.
Martina Rossi, Gene Expression Regulation Laboratory, IRCCS Ospedale Policlinico San Martino, 16132 Genova, Italy.
Lorenzo Brondolo, Gene Expression Regulation Laboratory, IRCCS Ospedale Policlinico San Martino, 16132 Genova, Italy.
Gabriele Bucci, Center for Omics Sciences, IRCCS Ospedale San Raffaele, 20132 Milano, Italy.
Roberto Gherzi, Gene Expression Regulation Laboratory, IRCCS Ospedale Policlinico San Martino, 16132 Genova, Italy.
SUPPLEMENTARY DATA
Supplementary Data are available at NAR Online.
FUNDING
Associazione Italiana per la Ricerca sul Cancro [AIRC I.G. 21541 to R.G.] (in part); Italian Ministry of Health with 5 × 1000 funds 2017 (to R.G.). Funding for open access charge: Associazione Italiana per la Ricerca sul Cancro (AIRC) [I.G. 21541].
Conflict of interest statement. None declared.
REFERENCES
- 1. Deveson I.W., Hardwick S.A., Mercer T.R., Mattick J.S.. The dimensions, dynamics, and relevance of the mammalian noncoding transcriptome. Trends Genet. 2017; 33:464–478. [DOI] [PubMed] [Google Scholar]
- 2. Kopp F., Mendell J.T.. Functional classification and experimental dissection of long noncoding RNAs. Cell. 2018; 172:393–407. [DOI] [PMC free article] [PubMed] [Google Scholar]
- 3. Ransohoff J.D., Wei Y., Khavari P.A.. The functions and unique features of long intergenic non-coding RNA. Nat. Rev. Mol. Cell. Biol. 2018; 19:143–157. [DOI] [PMC free article] [PubMed] [Google Scholar]
- 4. Yao R.W., Wang Y., Chen L.L.. Cellular functions of long noncoding RNAs. Nat. Cell. Biol. 2019; 21:542–551. [DOI] [PubMed] [Google Scholar]
- 5. Arun G., Diermeier S.D., Spector D.L.. Therapeutic targeting of long non-coding RNAs in cancer. Trends Mol. Med. 2018; 24:257–277. [DOI] [PMC free article] [PubMed] [Google Scholar]
- 6. Slack F.J., Chinnaiyan A.M.. The role of non-coding RNAs in oncology. Cell. 2019; 179:1033–1055. [DOI] [PMC free article] [PubMed] [Google Scholar]
- 7. Mishra K., Kanduri C.. Understanding long noncoding RNA and chromatin interactions: what we know so far. Noncoding RNA. 2019; 5:54. [DOI] [PMC free article] [PubMed] [Google Scholar]
- 8. Simon M.D. Insight into lncRNA biology using hybridization capture analyses. Biochim. Biophys. Acta. 2016; 1859:121–127. [DOI] [PMC free article] [PubMed] [Google Scholar]
- 9. Chu C., Qu K., Zhong F.L., Artandi S.E., Chang H.Y.. Genomic maps of long noncoding RNA occupancy reveal principles of RNA-chromatin interactions. Mol. Cell. 2011; 44:667–678. [DOI] [PMC free article] [PubMed] [Google Scholar]
- 10. West J.A., Davis C.P., Sunwoo H., Simon M.D., Sadreyev R.I., Wang P.I., Tolstorukov M.Y., Kingston R.E.. The long noncoding RNAs NEAT1 and MALAT1 bind active chromatin sites. Mol. Cell. 2014; 55:791–802. [DOI] [PMC free article] [PubMed] [Google Scholar]
- 11. Zhang G., Lan Y., Xie A., Shi J., Zhao H., Xu. L., Zhu S., Luo T., Zhao T., Xiao Y. et al.. Comprehensive analysis of long noncoding RNA (lncRNA)-chromatin interactions reveals lncRNA functions dependent on binding diverse regulatory elements. J. Biol. Chem. 2019; 294:15613–15622. [DOI] [PMC free article] [PubMed] [Google Scholar]
- 12. Vidovic D., Huynh T.T., Konda P., Dean C., Cruickshan B.M, Sultan M., Coyle K.M., Gujar S., Marcato P.. ALDH1A3-regulated long non-coding RNA NRAD1 is a potential novel target for triple-negative breast tumors and cancer stem cells. Cell Death Differ. 2020; 27:363–378. [DOI] [PMC free article] [PubMed] [Google Scholar]
- 13. Rossi M., Bucci G., Rizzotto D., Bordo D., Marzi M.J., Puppo M., Flinois A., Spadaro D., Citi S., Emionite L. et al.. LncRNA EPR controls epithelial proliferation by coordinating Cdkn1a transcription and mRNA decay response to TGF-β. Nat. Commun. 2019; 10:1969. [DOI] [PMC free article] [PubMed] [Google Scholar]
- 14. Bach K., Pensa S., Grzelak M., Hadfield J., Adams D.J., Marioni J.C., Khaled W.T.. Differentiation dynamics of mammary epithelial cells revealed by single-cell RNA sequencing. Nat. Commun. 2017; 8:2128. [DOI] [PMC free article] [PubMed] [Google Scholar]
- 15. Pellacani D., Bilenky M., Kannan N., Heravi-Moussavi A., Knapp D., Gakkhar S., Moksa M., Carles A., Moore R., Mungall A.J. et al.. Analysis of normal human mammary epigenomes reveals cell-specific active enhancer states and associated transcription factor networks. Cell Rep. 2016; 17:2060–2074. [DOI] [PubMed] [Google Scholar]
- 16. Tang Z., Kang B., Li C., Chen T., Zhang Z.. GEPIA2: an enhanced web server for large-scale expression profiling and interactive analysis. Nucleic Acids Res. 2019; 47:W556–W560. [DOI] [PMC free article] [PubMed] [Google Scholar]
- 17. Chandrashekar D.S., Bashel B., Balasubramanya S.A.H., Creighton C.J., Rodriguez I.P., Chakravarthi B.V.S.K., Varambally S.. UALCAN: A portal for facilitating tumor subgroup gene expression and survival analyses. Neoplasia. 2017; 19:649–658. [DOI] [PMC free article] [PubMed] [Google Scholar]
- 18. Li H., Durbin R.. Fast and accurate short read alignment with Burrows-Wheeler transform. Bioinformatics. 2009; 25:1754–1760. [DOI] [PMC free article] [PubMed] [Google Scholar]
- 19. Tarasov A., Vilella A.J., Cuppen E., Nijman I.J., Prins P.. Sambamba: fast processing of NGS alignment formats. Bioinformatics. 2015; 31:2032–2034. [DOI] [PMC free article] [PubMed] [Google Scholar]
- 20. Zhang Y., Liu T., Meyer C.A., Eeckhoute J., Johnson D.S., Bernstein B.E., Nusbaum C., Myers R.M., Brown M., Li W., Liu X.S.. Model-based analysis of ChIP-Seq (MACS). Genome Biol. 2008; 9:R137. [DOI] [PMC free article] [PubMed] [Google Scholar]
- 21. Zhu L.J., Gazin C., Lawson N.D., Pagès H., Lin S.M., Lapointe D.S., Green M.R.. ChIPpeakAnno: a bioconductor package to annotate ChIP-seq and ChIP-chip data. BMC Bioinformatics. 2010; 11:237. [DOI] [PMC free article] [PubMed] [Google Scholar]
- 22. Heinz S., Benner C., Spann N., Bertolino E., Lin Y.C., Laslo P., Cheng J.X., Murre C., Singh H. et al.. Simple combinations of lineage-determining transcription factors prime cis-regulatory elements required for macrophage and B cell identities. Mol. Cell. 2010; 38:576–589. [DOI] [PMC free article] [PubMed] [Google Scholar]
- 23. Kuo C.C., Hanzelmann S., Senturk Cetin N., Frank S., Zajzon B., Derks J.P., Akhade V.S., Ahuja G., Kanduri C., Grummt I. et al.. Detection of RNA-DNA binding sites in long noncoding RNAs. Nucleic Acids Res. 2019; 47:e32. [DOI] [PMC free article] [PubMed] [Google Scholar]
- 24. Ross-Innes C.S., Stark R., Teschendorff A.E., Holmes K.A., Ali H.R., Dunning M.J., Brown G.D., Gojis O., Ellis I.O., Green A.R. et al.. Differential oestrogen receptor binding is associated with clinical outcome in breast cancer. Nature. 2012; 481:389–393. [DOI] [PMC free article] [PubMed] [Google Scholar]
- 25. Wickham H. ggplot2: Elegant Graphics for Data Analysis. 2016; NY: Springer-Verlag. [Google Scholar]
- 26. Conway J.R., Lex A., Gehlenborg N.. UpSetR: an R package for the visualization of intersecting sets and their properties. Bioinformatics. 2017; 33:2938–2940. [DOI] [PMC free article] [PubMed] [Google Scholar]
- 27. Li Y., Syed J., Sugiyama H.. RNA-DNA triplex formation by long noncoding RNAs. Cell Chem. Biol. 2016; 23:1325–1333. [DOI] [PubMed] [Google Scholar]
- 28. Mondal T., Subhash S., Vaid R., Enroth S., Uday S., Reinius B., Mitra S., Mohammed A., James A.R., Hoberg E. et al.. MEG3 long noncoding RNA regulates the TGF-beta pathway genes through formation of RNA-DNA triplex structures. Nat. Commun. 2015; 6:7743. [DOI] [PMC free article] [PubMed] [Google Scholar]
- 29. O’Leary V.B., Ovsepian S.V., Carrascosa L.G., Buske F.A., Radulovic V., Niyazi M., Moertl S., Trau M., Atkinson M.J., Anastasov N.. PARTICLE, a Triplex-Forming Long ncRNA, regulates locus-specific methylation in response to low-dose irradiation. Cell Rep. 2015; 11:474–485. [DOI] [PubMed] [Google Scholar]
- 30. Grote P., Wittler L., Hendrix D., Koch F., Wahrisch S., Beisaw A., Macura K., Blass G., Kellis M., Werber M. et al.. The tissue-specific lncRNA Fendrr is an essential regulator of heart and body wall development in the mouse. Dev. Cell. 2013; 24:206–214. [DOI] [PMC free article] [PubMed] [Google Scholar]
- 31. Creyghton M.P, Cheng A.W, Welstead G.G, Kooistra T., Carey B.W., Steine E.J., Hanna J., Lodato M.A., Frampton GM, Sharp P.A. et al.. Histone H3K27ac separates active from poised enhancers and predicts developmental state. Proc. Natl. Acad. Sci. U.S.A. 2010; 107:21931–21936. [DOI] [PMC free article] [PubMed] [Google Scholar]
- 32. Rada-Iglesias A., Bajpai R., Swigut T., Brugmann S.A., Flynn R.A., Wysocka J.. A unique chromatin signature uncovers early developmental enhancers in humans. Nature. 2010; 470:279–283. [DOI] [PMC free article] [PubMed] [Google Scholar]
- 33. Bernstein B.E., Kamal M., Lindblad-Toh K., Bekiranov S., Bailey D.K., Huebert D.J., McMahon S., Karlsson E.K., Kulbokas E.J. 3rd, Gingeras T.R. et al.. Genomic maps and comparative analysis of histone modifications in human and mouse. Cell. 2005; 120:169–181. [DOI] [PubMed] [Google Scholar]
- 34. Kim T.H., Barrera L.O., Zheng M., Qu C., Singer M.A., Richmond T.A., Wu Y., Green R.D., Ren B.. A high-resolution map of active promoters in the human genome. Nature. 2005; 436:876–880. [DOI] [PMC free article] [PubMed] [Google Scholar]
- 35. Puppo M., Bucci G., Rossi M., Giovarelli M., Bordo D., Moshiri A., Gorlero F., Gherzi R., Briata P.. miRNA-mediated KHSRP silencing rewires distinct post-transcriptional programs during TGF-β-induced epithelial-to-mesenchymal transition. Cell Rep. 2016; 16:967–978. [DOI] [PubMed] [Google Scholar]
- 36. Draheim K.M., Chen H.B., Tao Q., Moore N., Roche M., Lyle S.. ARRDC3 suppresses breast cancer progression by negatively regulating integrin β4. Oncogene. 2010; 29:5032–5047. [DOI] [PMC free article] [PubMed] [Google Scholar]
- 37. Adelaıde J., Finetti P., Bekhouche I., Repellini L., Geneix J., Sircoulomb F., Charafe-Jauffret E., Cervera N., Desplans J., Parzy D. et al.. Integrated profiling of basal and luminal breast cancers. Cancer Res. 2007; 67:11565–11575. [DOI] [PubMed] [Google Scholar]
- 38. Kalluri R., Weinberg R.A.. The basics of epithelial-mesenchymal transition. J. Clin. Invest. 2009; 119:1420–1428. [DOI] [PMC free article] [PubMed] [Google Scholar]
- 39. Xiu B., Chi Y., Liu L., Chi W., Zhang Q., Chen J., Guo R., Si J., Li L., Xue J. et al.. LINC02273 drives breast cancer metastasis by epigenetically increasing AGR2 transcription. Mol. Cancer. 2019; 18:187. [DOI] [PMC free article] [PubMed] [Google Scholar]
- 40. Herzel L., Ottoz D.S.M., Alpert T., Neugebauer K.M.. Splicing and transcription touch base: co-transcriptional spliceosome assembly and function. Nat. Rev. Mol. Cell Biol. 2017; 18:637–650. [DOI] [PMC free article] [PubMed] [Google Scholar]
- 41. Bentley D.L. Rules of engagement: co-transcriptional recruitment of pre-mRNA processing factors. Curr. Opin. Cell Biol. 2005; 17:251–256. [DOI] [PubMed] [Google Scholar]
- 42. Gonzalez I., Munita R., Agirre E., Dittmer T.A., Gysling K., Misteli T., Luco R.F.. A lncRNA regulates alternative splicing via establishment of a splicing-specific chromatin signature. Nat. Struct. Mol. Biol. 2015; 22:370–376. [DOI] [PMC free article] [PubMed] [Google Scholar]
- 43. Mishra K., Kanduri C.. Understanding long noncoding RNA and chromatin interactions: what we know so far. Noncoding RNA. 2019; 5:54. [DOI] [PMC free article] [PubMed] [Google Scholar]
- 44. Vincent T., Neve E. P., Johnson J.R., Kukalev A., Rojo F., Albanell J., Pietras K., Virtanen I., Philipson L., Leopold P. L. et al.. A SNAIL1-SMAD3/4 transcriptional repressor complex promotes TGF-beta mediated epithelial-mesenchymal transition. Nat. Cell Biol. 2009; 11:943–950. [DOI] [PMC free article] [PubMed] [Google Scholar]
Associated Data
This section collects any data citations, data availability statements, or supplementary materials included in this article.
Supplementary Materials
Data Availability Statement
Raw data from RNA deep-sequencing analyses have been published on the GEO archive under the accession GSE113178. These fastq files are available to the readers at the link https://www.ncbi.nlm.nih.gov/Traces/study/?acc=PRJNA450379&o=acc_s%3Aa. Raw and processed data for ChIRP-Seq and ChIP-Seq have been deposited under the accession numbers GSE147208 and GSE148182, respectively.