Fig. 7.
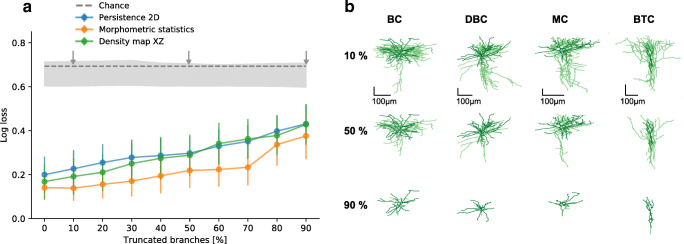
a Cross-validated log-loss of XZ density maps, morphometric statistics and z-projection-based 2D persistence as a function of truncation level. Branches were truncated to mimic what happens when neurons are only partially traced. The classification was performed on all pairs of types in V1 L2/3 data set. Dots and error bars show the means and 95% confidence intervals across all 21 pairs. Dashed grey line shows chance level at . Grey shading shows the chance-level distribution of log-losses obtained by shuffling the labels during the cross-validation (shading intervals go from the minimum to the maximum obtained chance-level values). The arrows mark the levels of truncation shown in panel B. b XZ projections of four exemplary cells at three levels of truncation: 10%, 50%, and 90%. At 50% truncation the global structure of each cell is still preserved, whereas at 90% only the dendritic structures remain. See Fig. 1 for abbreviations

