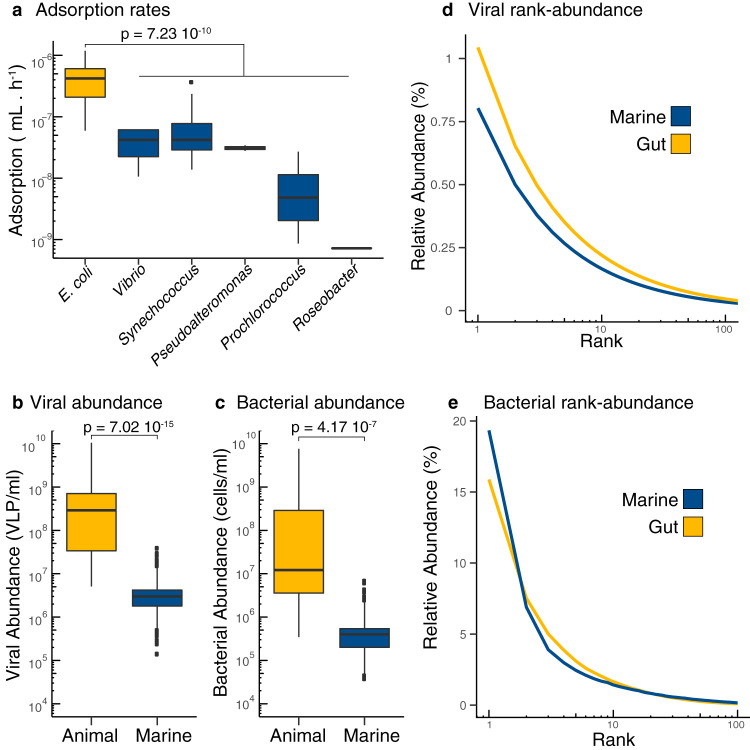
FIG 3.
Meta-analysis of COI parameters in marine and animal microbiomes. (a) Adsorption rates from single phage-host pairs of bacterial hosts derived from the mammalian gut (yellow) and marine environments (blue). The same color coding applies to all panels. (b and c) Viral abundances (b) and bacterial abundances (c) per ml in animal-associated and marine environments. (d) Rank-abundance curve displaying the top 100 ranks of phage genotypes identified in metagenomic data from human gut and marine samples. (e) Rank-abundance curve displaying the top 100 ranks of bacterial genotypes identified in metagenomic data from human gut and marine samples. The references for each original study, and the values for each data point are provided as Data Sets S1 to S5.

