

Abstract
The New York City (NYC) Department of Health and Mental Hygiene (DOHMH) has conducted prospective surveillance of nonspecific health indicators (syndromes) since 1995 (Heffernan et al., 2004a). The DOHMH syndromic surveillance system consists of (ED)-visits-based surveillance system and a few other complementary surveillance systems for Emergency Medical Services (EMS) ambulance dispatch calls, retail pharmacy sales, and work absenteeism data. These systems started operating separately, and different analytical methods are being employed by each of them. A “drop-in” syndromic surveillance system that deployed CDC field-staff to conduct 24 hours surveillance for bioterrorism related illness was implemented following the September 11th 2001 attack (Das et al., 2003; CDC, 2002). We use Table 11-1 to summarize these systems that comprise the syndromic surveillance activities in New York City. However, in the following text, the case study will focus around the ED visits based syndromic surveillance system in NYC.
Keywords: Emergency Medical Service, Chief Complaint, Syndromic Surveillance, Syndromic Surveillance System, Multiple Data Stream
The New York City (NYC) Department of Health and Mental Hygiene (DOHMH) has conducted prospective surveillance of nonspecific health indicators (syndromes) since 1995 (Heffernan et al., 2004a). The DOHMH syndromic surveillance system consists of ED visits based surveillance system and a few other complementary surveillance systems for Emergency Medical Services (EMS) ambulance dispatch calls, retail pharmacy sales, and work absenteeism data. These systems started operating separately, and different analytical methods are being employed by each of them. A “drop-in” syndromic surveillance system that deployed CDC field-staff to conduct 24-h surveillance for bioterrorism related illness was implemented following the September 11th attack (Das et al., 2003; CDC, 2002). We use Table 11-1 to summarize these systems that comprise the syndromic surveillance activities in New York City. However, in the following text, the case study will focus around the ED visits based syndromic surveillance system in NYC.
Table 11-1.
The syndromic surveillance systems in New York City.
| Syndromic system | Analytical approaches | Analysis frequency | Data transmission |
|---|---|---|---|
| Emergency Medical Services (EMS) Ambulance Dispatch Calls (Greenko et al., 2003) | An adaptation of the excess influenza mortality cyclical (linear) regression model | Daily | Calls |
| Emergency Department Visits (Heffernan et al., 2004b) | Prospective temporal and spatial scan statistics | Daily | FTP or Email attachments |
| Retail Pharmacy Sales (cough and influenza medications, and antidiarrheal medicines) | A linear regression model similar to that used in the EMS system, controlling for season, holidays, day of the week, promotional sales, positive influenza tests, and temperature | Daily (weekdays only) | FTP |
| Worker absenteeism | CUSUM method with a 14-day baseline | Daily | |
| A “drop-in” syndromic surveillance system following the 9/11 attack (CDC, 2002) | Same techniques that had been developed for the EMS ambulance dispatch system | Daily | CDC field-staff collected the data at 15 NYC hospital ERs |
NYC ED Syndromic Surveillance System Data Collection
By November 2003, 44 of NYC's 67 EDs participated in this system, thereby capturing 80% of all NYC ED patient visits (Heffernan et al., 2004a). Data files are transmitted to DOHMH daily, either as email attachments or through FTP. Half of the participating hospitals have already automated the transmission process. Files can be in several formats, most commonly as fixed-column or delimited ASCII text. “Data are read and translated into a standard format, concatenated into a single SAS dataset, verified for completeness and accuracy, and appended to a master archive.” (Heffernan et al., 2004a, 2004b).
The chief complaints captured by the ED visit records are classified into eight exclusive syndrome categories (Table 11-2) with an SAS algorithm developed in-house. This algorithm scans the chief complaint field for character strings assigned to a syndrome. The coding algorithm is designed to capture a wide variety of common misspellings and abbreviations. If the chief complaints contain words or phrases from multiple categories, it will be coded according to the following priority-based assignment scheme: common cold > sepsis/dead on arrival > respiratory > diarrhea > fever > rash > asthma > vomiting > other visits. This scheme attempts to place each chief complaint into a single, specific syndrome. The two syndromes of particular interest for bioterrorism surveillance are the respiratory and fever syndromes in persons older than 13 years of age (Heffernan et al. 2004b).
Table 11-2.
Exclusive syndrome categories of collected chief complaints in NYC ED syndromic surveillance system.
| Common cold | Sepsis | Respiratory |
|---|---|---|
| Diarrhea | Fever | Rash |
| Asthma | Vomiting |
NYC ED Syndromic Surveillance System Data Analysis and Field Investigations
The NYC ED syndromic surveillance system uses an adaption of Kulldorff and Mostashari's one-dimensional temporal to evaluate citywide trends in syndrome visits and spatial scan statistic (Kulldorff, 1997, 2001) to evaluate clustering in ED visits by hospital address and patient home zip code.
The temporal scan statistic is a special case of the prospective space-time scan statistic. The analysis is conducted in a prospective setting with daily runs and a variable-length window consisting of the last 1, 2, or 3 days. In particular, the ratio of syndrome visits to nonsyndrome (other) visits during the most recent 1, 2, or 3 days is compared with a 2-week baseline.
The spatial scan statistic approach requires comparing the observed to the expected number of cases in each geographic area. To control for purely spatial differences, expected counts of syndrome visits are derived from each area's history, rather than from the underlying census population. To detect rapidly emerging outbreaks, the approach takes the data from the observed cases from the last day and compares them with data from a 14-day baseline period, with a 1-day gap between the baseline and the date on which spatial clustering is being evaluated.
The surveillance signals produced by the system are first reviewed by medical epidemiologists on a daily basis. A report consisting of graphs and a brief summary is distributed by electronic mail to program staff. Further validations are conducted through field investigations. Detailed field investigations of syndromic signals are meant to (1) identify the etiology of signals; (2) determine why a given syndromic surveillance system failed to detect an outbreak captured through traditional surveillance; (3) validate the utility of syndromic surveillance for early infectious disease outbreak detection.
NYC ED Syndromic Surveillance System Visualization, Information Dissemination, and Reporting
Daily analyses are reviewed with a medical epidemiologist, and a report containing detailed graphs and a brief summary is distributed by email to related program staff. If a signal investigation is performed, a more detailed report will be prepared and made available by the next day. “An external report summarizing citywide public health trends is also distributed daily to state and regional health officials, the New York City Office of Emergency Management, police departments, and fire departments. Hospital-specific, confidential reports are shared quarterly with participating emergency departments, comparing their facility to overall citywide trends.” (Heffernan et al., 2004a, 2004b).
Spatial syndromic signals are followed up by reviewing the descriptive summary of the emergency department visits included in the signal. Hospital(s) contributing the largest number of excess cases are paid particular attention, by examining the specific syndromes triggering the signal and the line list of patients with their chief complaints produced, along with summary statistics for age, sex, and zip code. Syndromic signals are communicated to other hospital ED staff through phone calls to alert them of unusual disease patterns and to ask whether they have noted an increase in the frequency of syndrome visits or admission of seriously ill patients. Signals of elevated concern are further investigated by conducting field investigations including chart reviews, patient interviews, and onsite discussions with clinicians.
Some sample graphs from the presentations of DOHMH syndromic surveillance made at the National Syndromic Surveillance Conference (Mostashari,2002) are as shown in Figures 11-1 to 11-3 case study: Respiratory Illness Surveillance Using Multiple Syndromic Systems, New York City
Figure 11-2.
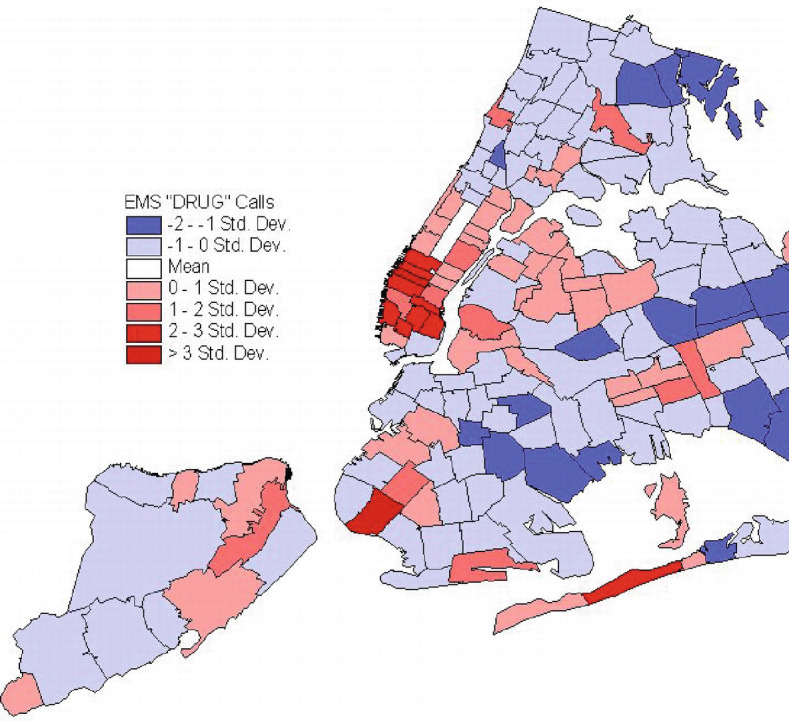

Display of epidemiology of drug overdoses from EMS “drug overdose” calls.
Figure 11-1.
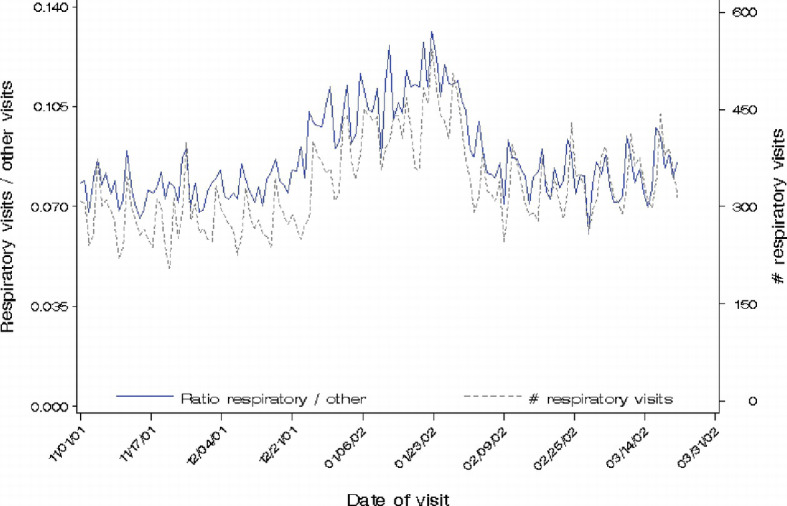

Plotting of NYC ED respiratory visits from November 2001 through March 2002.
Figure 11-3.


Display of West Nile Virus activity in New York City through September 2001.
Case Study: Respiratory Illness Surveillance Using Multiple Syndromic Systems, New York City
Community-wide increases in respiratory illness detected through syndromic surveillance are usually difficult to interpret. Syndromic surveillance analysts at the New York City Department of Health and Mental Hygiene (DOHMH) hypothesize that multiple data streams can help distinguish whether increases in respiratory illness are related to environmental allergens or infectious diseases.
For the period June 1, 2004 to May 31, 2005, the NYC DOHMH monitored several syndromic surveillance data sources daily, including ambulance dispatch calls from Emergency Medical Services (EMS), chief complaints from emergency rooms, and over-the-counter medication sales (data samples are shown in Figure 11-4). Daily citywide ratio of ED respiratory over other visits was adjusted for day-of-week and holiday effects using linear regression. Volume spikes in the daily adjusted ratio were identified using the EARS CUSUM C3 method with a 14-day baseline. During the study period, five sustained, citywide spikes in ED respiratory illness were observed. Figure 11-5 shows the plot of ED respiratory illness ratio over other visits adjusted day-of-week and holiday effects, with CUSUM signals marked and the corresponding areas shaded in gray.
Figure 11-4.


Sample ambulance dispatch calls and over-the-counter pharmacy data.
Figure 11-5.


Citywide daily day-of-week adjusted and holiday-adjusted ratios of ED respiratory/other visits, with CUSUM signals marked.
To investigate whether the signals are related to influenza or allergy season, the adjusted daily citywide ratios of OTC allergy over analgesics sales (gray), ED asthma over other visits (green), and ED fever-flu over other visits (blue) were also plotted (see Figure 11-6).
Figure 11-6.


Plots of daily citywide ratios of OTC allergy over analgesics sales (gray), ED asthma over other visits (green), and ED fever-flu over other visits (blue).
Comparing two sets of plots, i.e., the adjusted ratios of ED respiratory/other visits (Figure 11-5) and ratios of OTC, ED asthma, and ED-fever-flu (Figure 11-6), six signals of ED respiratory illness over a 15-day period in September and October were preceded by a spike in OTC allergy sales, and so were nine signals in May. These signals also coincided with increasing ED asthma visits while ED fever-flu visits remained constant. Instead, three consecutive signals in late November, 16 signals in December and 7 signals in February coincided with increasing ED fever-flu visits, while these periods showed minimal to no increases in ED asthma visits or OTC allergy sales. The signal patterns in the multiple data streams suggested that respiratory illness increases in Fall and Spring could be attributed to allergy or asthma, whereas the Winter increase in respiratory illness is more likely to be attributed to influenza (Das, 2005).
The respiratory illness syndromic surveillance practice at New York City demonstrated how multiple syndromic data streams can be helpful for characterizing ED respiratory syndrome signals.
Further Readings
We provide the following key readings for the readers who might be interested in learning more details about the New York Syndromic Surveillance system.
Contributor Information
Hsinchun Chen, Email: hchen@eller.arizona.edu.
Daniel Zeng, zeng@email.arizona.edu.
Ping Yan, pyan@email.arizona.edu.
Important readings:
- 1.Heffernan R, Mostashari F, Das D, Karpati A, Kulldorf M, Weiss D. “New York City Syndromic Surveillance Systems. MMWR (CDC) 2004;53(Suppl):23–27. [PubMed] [Google Scholar]
- 2.Heffernan, R., F. Mostashari, D. Das, M. Besculides, C. Rodriguez, J. Greenko, L. Steiner-Sichel, S. Balter, A. Karpati, P. Thomas, M. Phillips, J. Ackelsberg, E. Lee, J. Leng, J. Hartman, K. Metzger, R. Rosselli, and D. Weiss (2004). “Syndromic surveillance in public health practice, New York City.” Emerging Infectious Diseases [serial on the Internet].
- 3.Mostashari F, Fine A, Das D, Adams J, Layton M. “Use of ambulance dispatch data as an early warning system for community-wide influenza-like illness, New York City. Journal of Urban Health. 2003;80(2 Suppl 1):i43–i49. doi: 10.1007/PL00022314. [DOI] [PMC free article] [PubMed] [Google Scholar]
- 4.Heffernan R, Mostashari F, Das D, Besculides M, Rodriguez C, Greenko J, Steiner-Sichel L, Balter S, Karpati A, Thomas P, Phillips M, Ackelsberg J, Lee E, Leng J, Hartman J, Metzger K, Rosselli R, Weiss D. “System Descriptions New York City Syndromic Surveillance Systems. MMWR(CDC) 2004;53(Suppl):23–27. [PubMed] [Google Scholar]
- 5.Das, D., D. Weiss, D. Heffernan (2005) “Respiratory Illness Surveillance Using Multiple Syndromic Systems, New York City,” working document, available at: thci.org/_Documents /temp/das%202005_final.doc
References
- Das D, Weiss D, Mostashari F. "Enhanced Drop-in Syndromic Surveillance in New York City Following September 11, 2001,". J Urban Health. 2003;80:1(suppl):176–188. doi: 10.1007/PL00022318. [DOI] [PMC free article] [PubMed] [Google Scholar]
- Greenko J, Mostashari F, Fine A, Layton M. "Clinical Evaluation of the Emergency Medica Services (EMS) Ambulance Dispatch-Based Syndromic Surveillance System, New York City,". Journal of Urban Health: Bulletin of the New York Academy of Medicine. 2003;80(2):i50–i56. doi: 10.1007/PL00022315. [DOI] [PMC free article] [PubMed] [Google Scholar]
- Heffernan R, Mostashari F, Das D, Besculides M, Rodriguez C, Greenko J, Steiner-Sichel L, Balter S, Karpati A, Thomas P, Phillips M, Ackelsberg J, Lee E, Leng J, Hartman J, Metzger K, Rosselli R, Weiss D. "New York City Syndromic Surveillance Systems,". MMWR (CDC) 2004;53(Suppl):23–27. [PubMed] [Google Scholar]
- Kulldorff M. "A Spatial Scan Statistic,". Communications in Statistics: Theory and Methods. 1997;26:1481–1496. doi: 10.1080/03610929708831995. [DOI] [Google Scholar]
- Mostashari, F. 2002. "Lessons Learned from the National Syndromic Surveillance Conference. Presentation at the 2002 National Syndromic Surveillance Conference, New York." from http://dimacs.rutgers.edu/Workshops/AdverseEvent/slides/Mostashari.ppt