

Abstract
The Electronic Surveillance System for the Early Notification of Community-Based Epidemics (ESSENCE) was developed by the Johns Hopkins University Applied Physics Laboratory (JHU/APL) in collaboration with the Maryland Department of Health and Mental Hygiene, the District of Columbia Department of Health, and the Virginia Department of Health under the sponsorship of the Defense Advanced Research Projects Agency (DARPA). It is now used in the Department of Defense Global Emerging Infections System (DoD-GEIS). It is currently deployed in the National Capital Area (NCA) (Lombardo et al., 2004). The system monitors both military and civilian healthcare data daily for early outbreak detection and warning, fusing information from multiple data sources that vary in their medical specificity, spatial organization, scale, and time-series behavior (Burkom et al., 2004). ESSENCE has gone through a series of important development stages, and its most current prototype is ESSENCE IV.
Figure 10-1 shows the system architecture of ESSENCE. It collects public health status information from three major channels: clinical data, nonclinical syndromic data, and health events-related information. The accessibility of the collected information is managed by either disclosure control or sharing polices to ensure the privacy of personal healthcare information. Automated outbreak detection and alerting are supported. Situation and threat awareness and epidemiology investigation support are integrated with secured Web-based visualization and user interfaces.
Keywords: Exponentially Weight Move Average, Multiple Data Source, Defense Advance Research Project Agency, Defense Advance Research Project Agency, Outbreak Detection
The Electronic Surveillance System for the Early Notification of Community-Based Epidemics (ESSENCE) is developed by the Johns Hopkins University Applied Physics Laboratory (JHU/APL) in collaboration with the Maryland Department of Health and Mental Hygiene, the District of Columbia Department of Health, and the Virginia Department of Health under the sponsorship of the Defense Advanced Research Projects Agency (DARPA). It is now used in the Department of Defense Global Emerging Infections System (DoD-GEIS). It is currently deployed in the National Capital Area (NCA) (Lombardo et al., 2004). The system monitors both military and civilian healthcare data daily for early outbreak detection and warning, fusing information from multiple data sources that vary in their medical specificity, spatial organization, scale, and time-series behavior (Burkom et al., 2004). ESSENCE has gone through a series of important development stages, and its most current prototype is ESSENCE IV.
Figure 10-1 shows the system architecture of ESSENCE. It collects public health status information from three major channels: clinical data, nonclinical syndromic data, and health events-related information. The accessibility of the collected information is managed by either disclosure control or sharing polices to ensure the privacy of personal healthcare information. Automated outbreak detection and alerting are supported. Situation and threat awareness and epidemiology investigation support are integrated with secured Web-based visualization and user interfaces.
Figure 10-1.
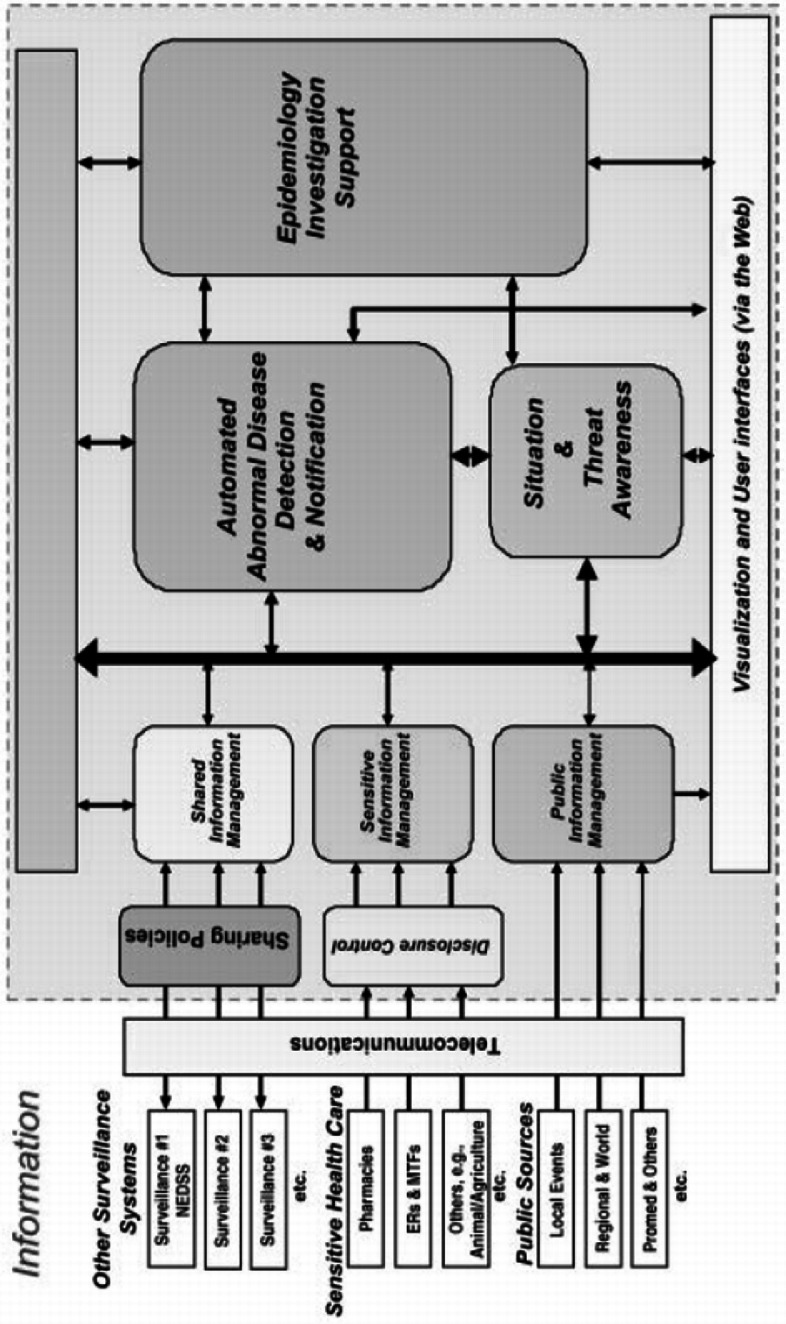

ESSENCE system architecture (Lombardo et al., 2003).
Participation of military treatment facilities (MTFs) constitutes an important part of ESSENCE system. Figure 10-2 shows all the reporting MTFs (icons are highlighted in one of three colors based on the degree of departure from historical data for one or more syndrome group on any given day).
Figure 10-2.


Graphs of all the reporting MTFs (icons are highlighted in one of three colors based on the degree of departure from historical data for one or more syndrome group on any given day).
ESSENCE Data Collection
ESSENCE now mainly collects three types of data (Lombardo et al., 2003):
Chief complaint data from hospital ERs; ICD-9-CM codes, OTC sales of pharmaceuticals, nurse hotline calls; school absenteeism; and veterinary reports; 100% of the clinical visits of military and their dependents are included.
Publicly available information (e.g., information about local endemic disease, sales promotions, and even weather events).
Information about external surveillance activities in the NCA.
The process for data collection is automated. For the electronically available clinical or nonclinical data, the system constantly polls from the hospital information system via a query software (Lombardo et al., 2003). For publicly available health event-related news, the information is collected via electronic media. External surveillance activities are continually communicated among the public health officials and epidemiologists manually or electronically.
Daily counts are placed into the following syndrome groups (Lombardo et al., 2004). (Each of these groups is defined by a specific set of ICD-9 codes.)
The free text chief complaints are processed and classified into syndrome categories with either a natural language processing algorithm (Lombardo et al., 2003) or a weighted keyword matching based parser (Lombardo, 2004). “Once converted to this common format, the information is available for use or for other surveillance activities. Within minutes of the query to the hospital emergency room electronic log, the system can forward counts of the syndrome groups to the participating hospital, state, and county surveillance activities. This information in most cases is available via electronic media. Likewise, the occurrence of high-profile events in the community may change detection and alerting thresholds” (Lombardo et al., 2003).
Table 10-1.
Syndrome categories monitored by ESSENCE II.
| Respiratory | Gastrointestinal | Rash |
|---|---|---|
| Death | Sepsis | Neurologic |
| Other | Unspecified |
The time lag in data collection is currently a major limitation of ESSENCE. Most of the data can be received within 1–3 days after patient visits. However, improved timely reporting, optimized automated data transmission, and more frequent data uploads should decrease the data lag to one day.
ESSENCE Data Analysis and System Evaluation
The temporal analysis methods for outbreak detection currently used in ESSENCE include an autoregressive modeling algorithm and the Exponentially Weighted Moving Average (EWMA) technique. CDC's Early Aberration Reporting System (EARS) algorithms are also included for temporal analysis as reference algorithms for assessing the performance enhancement provided by the ESSENCE algorithms (Lombardo et al., 2003). For spatial anomaly detection, the Kulldorff scan statistic as implemented in the SaTScan software is used as a primary spatial analysis tool. A modified version of scan statistic is also developed to produce approximate clusters of space-time interaction.
In ESSENCE, the outbreak detection methods take a “data-fusion” approach that includes multiple data streams. Burkom and Elbert applied the Kulldorff statistic to multiple data sources in ESSENCE by treating them as covariates while using whatever spatial information is available in each source (Burkom, 2003). A multiple univariate strategy can also be applied to the multiple data stream analysis, by treating each data stream separately with a univariate outbreak detection method. Then a consensus approach based on Bayes Belief Network (BBN) is used to combine the outputs of the multiple univariate algorithms to optimize the decision (Burkom et al., 2004). The BBN approach increases the sensitivity while controlling the false-alert rate. Table 10-2 lists the three categories of outbreak detection methods currently employed in ESSENCE.
Table 10-2.
Analytical methods used in ESSENCE for early outbreak detection.
| Temporal analysis | Spatial analysis | Spatial-temporal analysis |
|---|---|---|
| Autoregressive modeling | Scan statistic | Modified scan statistic |
| EWMA | ||
| EARS algorithms (as reference) |
The outbreak detection capacity with ESSENCE has been tested in a few studies. In the 2003 study (Lombardo et al., 2003), several outbreak scenarios were developed to test the performance, each scenario consisting of a series of real data streams with a simulated outbreak superimposed. The value of multiple data sources added to the detection performance is discussed by plotting the performance of the algorithms for respiratory syndrome as a function of the number of infected people and the involvement of different data sources (ER visits, absenteeism data, OTC influenza medication sales, and school absentee totals). It shows that the absenteeism data contributes to the timeliness in the detection by 2 days and require a smaller population of infected people.
In the Bio-ALIRT evaluation program, three of the ESSENCE's detection algorithms (Provider-count-adjusted MSPC, multiple univariate EWMA, and Bayes Belief Network combination) aggregating multiple data sources were tested for respiratory or gastrointestinal syndromes (Burkom et al., 2004). Sensitivity and timeliness are measured as performance assessment metrics. The performance results of the three methods are summarized in (Lombardo et al., 2004). In general, the provider-count-adjusted MSPC and multiple univariate EWMA algorithm reduce the median detection time by 5 days for the most constrained false-alert rate, whereas the BBN improved timeliness by 2 days. The BBN also detected an additional outbreak at the lowest specificity (Lombardo et al., 2004).
ESSENCE Interface, Information Dissemination, and Reporting
ESSENCE provides a map-based visualization tool that can display both raw case/event data and clusters/hotspots identified by scan statistics. The user can enter zip codes or click on an area on the map to select subsets of data of interest. The details about cases or events are presented as tables or time-series graphs. ESSENCE provides the second portal listing alerts generated as the output of the detection processes. These lists consist of color-coded flags to indicate the extent of deviations from the baseline normalcy. Upper confidence limits (UCLs) for the daily predictions are computed and used as thresholds for alerts. If an observed case count exceeds the 95% UCL but not the 99% UCL, a low-level (yellow) alert is generated. If the count exceeds the 99% UCL, a high-level (red) flag results. The user can organize the alert lists for selected data of interest. They can also sort these lists by various criteria and access data or port them to the map visualization tool to view the spatial distribution of flagged cases.
The third ESSENCE tool, the query portal, allows a user to select subsets of data and data elements from drop-down menus and view these data elements over a user-specified timeframe as graphs or tables. The fourth portal can be used to generate summary reports, which can then be exported outside of ESSENCE for further analysis. The user can select any data elements in the archive and view historic counts as well as upward or downward trends.
Information dissemination in ESSENCE is based on user roles and jurisdictions. A basic function of ESSENCE is to deliver alerts and surveillance information to the military and civilian public health authorities in the NCA. The system provides detection outputs as well as the details of underlying data streams via secure Web sites. Information is provided in many separate information layers. In ESSENCE, this data layering approach was implemented to facilitate the distribution to various user roles. “For example, a user who logs on from an emergency room may be able to see only the emergency room data from his or her jurisdiction, whereas a user recognized as a director of epidemiology would have access to all the information within his or her jurisdiction as well as the shared information from the surrounding jurisdictions in the region.” (Lombardo, 2003)
Figure 10-3.


Visualization of ESSENCE system. (a) Temporal analysis with time-series plot (source: Tricare presentation (2005c)). (b) Temporal analysis with stacked graph of time-series (source: Tricare presentation (2005c)). (c) Geospatial analysis and GIS mapping (source: ESSENCE IV project Web page). (d) GIS mapping of the National Capital Region for respiratory syndrome.
Further readings
We provide the following project link and some key readings for the readers who might be interested in learning more details about the ESSENCE system.
Project link:
Contributor Information
Hsinchun Chen, Email: hchen@eller.arizona.edu.
Daniel Zeng, zeng@email.arizona.edu.
Ping Yan, pyan@email.arizona.edu.
Important readings:
- 1.Lombardo J, Burkom H, et al. “A systems overview of the Electronic Surveillance System for the Early Notification of Community-based Epidemics (ESSENCE II) Journal of Urban Health: Bulletin of the New York Academy of Medicine. 2003;80(2):32–42. doi: 10.1007/PL00022313. [DOI] [PMC free article] [PubMed] [Google Scholar]
- 2.Burkom H, Elbert E, et al. “Role of Data Aggregation in Biosurveillance Detection Strategies with Applications from ESSENCE. MMWR (CDC) 2004;53(Suppl):67–73. [PubMed] [Google Scholar]
- 3.Lombardo J, Burkom H, et al. “Electronic Surveillance System for the Early Notification of Community-Based Epidemics (ESSENCE II), Framework for Evaluating Syndromic Surveillance Systems.” Syndromic surveillance: report from a national conference, 2003. MMWR 2004. 2004;53(Suppl):159–165. [PubMed] [Google Scholar]
References
- Burkom H, Elbert E, Feldman A, Lin J. "Role of Data Aggregation in Biosurveillance Detection Strategies with Applications from Essence,". MMWR (CDC) 2004;53(Suppl):67–73. [PubMed] [Google Scholar]
- Lombardo J, Burkom H, Pavlin J. "Electronic Surveillance System for the Early Notification of Community-Based Epidemics (ESSENCE II), Framework for Evaluating Syndromic Surveillance Systems," Syndromic surveillance: report from a national conference, 2003. MMWR 2004. 2004;53(Suppl):159–165. [PubMed] [Google Scholar]