

Abstract
Thermogravimetric analysis (TGA) is the most widespread thermal analytical technique applied to waste materials. By way of critical review, we establish a theoretical framework for the use of TGA under non-isothermal conditions for compositional analysis of waste-derived fuels from municipal solid waste (MSW) (solid recovered fuel (SRF), or refuse-derived fuel (RDF)). Thermal behaviour of SRF/RDF is described as a complex mixture of several components at multiple levels (including an assembly of prevalent waste items, materials, and chemical compounds); and, operating conditions applied to TGA experiments of SRF/RDF are summarised. SRF/RDF mainly contains cellulose, hemicellulose, lignin, polyethylene, polypropylene, and polyethylene terephthalate. Polyvinyl chloride is also used in simulated samples, for its high chlorine content. We discuss the main limitations for TGA-based compositional analysis of SRF/RDF, due to inherently heterogeneous composition of MSW at multiple levels, overlapping degradation areas, and potential interaction effects among waste components and cross-contamination. Optimal generic TGA settings are highlighted (inert atmosphere and low heating rate (⩽10°C), sufficient temperature range for material degradation (⩾750°C), and representative amount of test portion). There is high potential to develop TGA-based composition identification and wider quality assurance and control methods using advanced thermo-analytical techniques (e.g. TGA with evolved gas analysis), coupled with statistical data analytics.
Keywords: Solid recovered fuel, refuse-derived fuel, municipal solid waste, thermogravimetric analysis, compositional analysis, thermal degradation, waste-to-energy

Introduction
Solid recovered fuel (SRF) and refuse-derived fuel (RDF) are two major routes to recover energy resources from currently unrecyclable fractions of municipal solid waste (MSW). SRF is a waste-derived fuel (WDF) typically produced from non-hazardous solid waste in mechanical or mechanical–biological treatment (MBT) plants, meeting national and European Union (EU) specifications for co-combustion applications (British Standard Institution 15359, 2011; Velis et al., 2010). Co-combustion of SRF, for example in power plants (Iacovidou et al., 2018) or in cement kilns, is considered an energy efficient waste to energy (WtE) technology, to be prioritised as a WtE solution comparatively more compatible with a circular economy (European Commission, 2017). RDF is another form of MSW-derived fuel described by ASTM standards dating back in the 1980s in the United States (Milne et al., 1990), often today combusted in dedicated energy from waste plants, for instance with fluidised bed reactors (Dalai et al., 2009). Notably, and leading to confusion, the terms SRF and RDF are often used interchangeably, due to their similar composition, both being produced from MSW. We follow here the recent de facto conventions on the different scope for the terms ‘SRF’ and ‘RDF’: the former defined as complying with the standards established by the European Committee for Standardisation (CEN), while the latter being a WDF that does not follow the CEN quality management procedures, or any at all and, therefore, its content and quality being more variable and not sufficiently verified (Velis et al., 2010). Despite this difference, the similar composition between SRF and RDF served as the basis for the term SRF/RDF used in the present study. The inherent heterogeneous composition of MSW at multiple levels (assembly of items, components, materials, and chemical compounds) is a main limiting factor for turning waste into secondary resources, impeding the transition towards resources recovery and a circular economy (DOE, 2019; Esbensen and Velis, 2016). A fuel with heterogeneous composition may lead to variable thermal behaviour and therefore difficulties in adjusting the thermal recovery processes (Beckmann et al., 2012; Fritsky et al., 1994). To this end, SRF must fulfil strict quality assurance requirements, ensuring a predefined, and most importantly stable, fuel quality (Flamme and Ceiping, 2014; Velis et al., 2010).
Thermal analysis could give insights into the thermal behaviour of SRF/RDF and therefore prevent risks and optimise combustion performance, leading to confidence on SRF/RDF uptake in co-combustion/ dedicated EfW outlets. A wide variety of thermal analytical techniques are available to measure a property of an SRF/RDF sample, following a predetermined heating profile (Cheremisinoff, 1996). Thermogravimetric analysis (TGA) is one of the most widespread thermal analytical techniques, considered to be rapid, accurate, affordable, and user-friendly (Beyler and Hirschler, 2002; Gomes et al., 2018; Ray and Cooney, 2018). More information on thermal analysis and its application areas is reported by Gabbott (2008).
The TGA measures the mass change of a substance as a function of temperature or time due to decomposition, oxidation, and loss of volatiles under a specified temperature programme and atmospheric conditions (Garcia et al., 2013; Heal, 2002; Murty et al., 1996; Ramalingam and Ramakrishna, 2017). TGA can be performed either by gradually raising the temperature of the sample under a constant heating rate (non-isothermal conditions), or by keeping a constant temperature and recording the mass loss as a function of time at a fixed temperature (isothermal conditions) (Heal, 2002; Vyazovkin and Wight, 1997). The practical problem with the selection of isothermal conditions is the partial degradation of the sample before the desired temperature is reached, which leads to loss of significant thermal information (Beyler and Hirschler, 2002).
The TGA is often combined with derivative thermogravimetry (DTG) performing the rate of mass loss (Heal, 2002). Thermogravimetry (TG)–DTG curves provide both qualitative and quantitative information: qualitative includes identification of substances; and quantitative includes percentages of mass loss and characteristic temperatures at critical points (Xu et al., 2005). In waste materials, a DTG thermogram consists of a curve with several peaks/shoulders that correspond to a specific waste fraction that contains materials with similar devolatilisation behaviour (Piao et al., 2000). TG–DTG is used for compositional analysis and determination of reaction kinetics giving information on thermal stability, decomposition profile and moisture, inorganic and volatile content of the sample (Murty et al., 1996; Ramalingam and Ramakrishna, 2017; Tessier, 2018). The simultaneous application of TGA with other thermal analytical techniques, known as simultaneous thermal analysis, that can detect physical changes (e.g. glass transition/melting point) is widely used to obtain additional information (Heal, 2002).
A disadvantage of TG–DTG, especially for heterogeneous fuel mixtures, is that the DTG curves of individual components in the mixture cannot be distinguished due to overlapping reactions at similar ranges of decomposition temperature (Heal, 2002; Piao et al., 2000). For that reason, TGA is often combined with evolved gas analysis (EGA), such as Fourier-transform infrared spectroscopy, mass spectrometry, and gas chromatography, which determine the composition of the gas mixture evolved from the heated sample (Warrington, 2002). Several studies combined TGA with EGA for the determination of thermal stability of SRF/RDF and MSW (Casu et al., 2006; Cheng et al., 2007; Chhabra et al., 2019; Edo et al., 2016; Efika et al., 2015; Fernández et al., 2012; Ma et al., 2019; Singh et al., 2012; Zhou et al., 2015b).
Here, we provide a first authoritative, comprehensive and up to date review on the thermal behaviour of waste-derived materials (WDM) during TGA experiments under non-isothermal conditions, focusing on SRF/RDF derived from MSW. We offer a synthesis of comparative findings aiming to establish a theoretical framework on the use of TGA as a tool for composition identification of waste-derived items/materials. The objectives of our research include: (a) determination of typical SRF/RDF composition; (b) demonstration of prevalent TGA operating conditions used for compositional analysis of SRF/RDF; and (c) identification of thermal decomposition profiles of SRF/RDF and its prevalent components at multiple levels. We combine findings of (a–c) into suggesting possible research and development needs toward turning TGA into a tool capable of composition identification of materials present in heterogeneous waste-derived fuels. This is followed by practical guidance framing possible relevant TGA experiments and laboratory testing.
Methodology
By ways of comprehensive literature review, we collated and critically comparatively assessed recent scientific developments on compositional analysis of WDM, focusing on typical SRF/RDF, using TGA under non-isothermal conditions.
Scope and use of Preferred Reporting Items for Systematic Reviews and Meta-Analyses (PRISMA) framework
Due to the lack of acknowledged guidelines for narrative reviews, we applied the PRISMA methodology (Ferrari, 2015), a recommended reporting method adopted in systematic reviews (Selçuk, 2019). According to the PRISMA approach, three main steps including identification, screening and eligibility were set to address two interconnected research questions related to: (a) identification and percentage participation of the most prevalent waste items and polymers in commercial SRF/RDF produced from MSW (research question 1 (RQ1)); and (b) determination of non-isothermal experimental conditions usually applied in TGA of SRF/RDF and its components and identification of their thermal profiles (research question 2 (RQ2)). In the first stage, key words (RDF, SRF, MSW, plastic, biomass, biopolymer, cellulose, lignin, waste, TGA, DTG, composition, and thermal degradation), scientific databases (Scopus, Web of Science, and Google Scholar) and document types were identified, while the topic relevance of findings was assessed during the screening stage.
Eligibility criteria were posed during the eligibility stage. For the RQ1, only recent studies conducted over the last 10 years (2009–2019) that analysed the composition in commercially manufactured SRF/RDF samples were included in Table 1 whereas related existing review papers (if any) were included in the critical analysis for comparison. Older studies were excluded due to the dependence of MSW composition and therefore SRF/RDF on time leading to misinformed estimation of the current fuel composition (Abdel-Shafy and Mansour, 2018; Brunner et al., 2004; Pomberger et al., 2017). For example, the global production of plastics was increased by nearly 18% from 2010 to 2015 (Hannah and Max, 2019). More importantly, the reduction of landfill disposal rates (approximately 36% for the period 1995–2014) and the increased recycling and composition rates (27%) over the last decades due to legal requirements resulted in increased WtE rates (nearly 13%) in EU-28 (Pomberger et al., 2017). We included studies that simulated the SRF/RDF composition using synthetic mixtures to gain further insights about prevalent component thermal behaviour. We did not pose any time restriction for the identification of biomass polymers (e.g. cellulose) in prevalent waste item categories, such as wood and paper, as their composition is not considerably affected by the time. In regard to RQ2, the main eligibility criterion was the inclusion of studies that conducted only non-isothermal TGA of prevalent post-consumer items/materials, plastic and biomass polymers, and SRF/RDF. A last eligibility criterion was posed for the determination of thermal behaviour of prevalent polymers. We kept only studies that were conducted using TGA under inert atmosphere, due to a large amount of related studies and obtained awareness of the wide use of inert atmosphere during TGA of SRF/RDF and waste items/materials.
Table 1.
Typical composition of commercially produced solid recovered fuel (SRF)/refuse-derived fuel (RDF) samples from municipal solid waste, based on most prevalent waste item categories over the last 10 years (from 2009 to 2019), expressed in ‘as received’ reporting basis.
| Paper/ cardboard (% w/w) | Plastics (% w/w) |
Textiles (% w/w) |
Wood (% w/w) |
Fines (% w/w) |
Other (% w/w) |
Geographical location | References |
|---|---|---|---|---|---|---|---|
| 30 | 33 | 10 | 8 | 13 | 6 | Finland | Nasrullah et al. (2016) |
| 82 | 13 | 5a | United Kingdom (UK) | Wagland et al. (2011) | |||
| 19 | 45 | 13 | 23b | Latvia | Porshnov et al. (2018) | ||
| 47 | 31 | 7 | 4 | 1 | 10 | UK | Velis (2010) |
| 11 | 30 | 8 | 11 | 40c | Poland | Stępień et al. (2019) | |
| 59–65d | 28–31d | UK | Water and Resources Action Programme (2009) | ||||
| 10–40 | 10–40 | 0–20 | 0–20 | 2–7 | 2–40 | UK | Department for Environment, Food and Rural Affairs (2014) |
| 13e | 28 e | 10e | 0–3 | 45e* | 1–4e | Austria | Sarc et al. (2014) |
| 11 | 20 | 9 | 0–1 | 51* | 8–9 | Austria | Sarc et al. (2019) |
| 30 | 28 | 14 | 0–10 | 5 | 13–23 | Italy | Di Maria et al. (2013) |
| 56f | 27f | 17 | United States of America | Robinson et al. (2016) | |||
| 79f | 21f | UK | Efika et al. (2015) | ||||
| 46–82f | 18–54f | Greece | Skodras et al. (2009) | ||||
Notes: a5% included wood, textiles and miscellaneous combustibles; b defined as unidentified materials (composition derived from three different RDF samples); c the highest proportion of the fuel was unidentified and mineral waste (31.6% w/war); d defined as the residual stream after material recovery for recycling; e values derived from two different SRF qualities, intended for main burner fuel and hot-disc fuel; * fines defined by the cumulative passing <11.2 mm; and f defined as cellulosic and plastic fraction using thermogravimetric analysis.
Data processing
The conditions applied to the TGA experiments (heating rate, atmosphere, sample mass, and maximum temperature) in several studies were analysed and graphically presented. The results of the selected heating rates were presented in terms of TGA experiments (not based on studies), because some researchers conducted more than one TGA experiment with different heating rates. Descriptive and inferential statistics (lower and upper confidence interval (LCI–UCI) at 0.1 significance level: α = 0.1) were visually summarised in boxplots (αTIBCO Statistica™ 13.3.0 software), reporting on: (a) the range of cellulose, hemicellulose, and lignin content in several biomass waste items/materials present in SRF/RDF expressed on dry basis (% w/wd); and (b) the percentage participation of prevalent fossil-based plastic polymers in the plastic fraction of SRF/RDF (% w/w).
Three characteristic temperatures indicating the reactivity of a sample and its conversion behaviour can be obtained from the TG–DTG thermogram: (a) onset temperature (To), at which fuel starts to thermally degrade (drying and partial volatilisation); (b) peak temperature (Tp), at which the rate of mass loss is maximum (decomposition); and (c) endset temperature (Te), at which the rate of mass loss decreases to 1% w/w min−1 (He et al., 2013; Hilber et al., 2007). Here, we present comparative tables on the composition of SRF/RDF based on prevalent waste items/materials and polymers along with their characteristic decomposition temperatures (To, Tp, and Te). However, most researchers determined arbitrarily the temperatures at which the sample decomposition begins and completes, without referring to any definition. Therefore, these temperatures might be slightly different from the onset (To) and endset (Te) temperatures. For convenience, we used the terms To and Te. In addition, the maximum rate of mass loss obtained from the DTG curve was not considered, because of inconsistencies in the relevant units, and often missing information (e.g. sample mass) for the conversion unit.
SRF/RDF composition
Prevalent waste component categories (items/materials) in SRF/RDF
Table 1 features data on the composition of SRF/RDF determined by both manual sorting and TGA. Comparison between the two techniques can be obtained only at the level of two main fractions of SRF/RDF (biomass and plastic content) since TGA results described the composition based on just these two fractions due to overlapping thermal degradation areas among waste items/materials (discussed onwards). By comparing the composition of SRF/RDF conducted through TGA with that of manual sorting at the level of biomass-based and plastic-based content, the two techniques (TGA and manual sorting) demonstrate similar SRF/RDF composition (Table 1).
In a weight-related descending order, the most prevalent waste items in commercial SRF/RDF produced from MSW are paper/cardboard, plastics, textiles and wood (Table 1). This is in agreement with Vainikka et al. (2011), who collected literature findings from older studies to identify a typical SRF composition. Specifically, paper/cardboard fluctuated in a range of 40–50 w/w, plastics 25–35 w/w, textiles 10–14 w/w, and wood 3–10% w/w. The comparison between the old ranges (from 2003 to 2009) reported by Vainikka et al. (2011) with the updated typical composition of SRF/RDF (between 2009 and 2019) in Table 1, indicate that SRF/RDF composition is more dependent on other factors rather than on time. Higher variability of SRF/RDF composition is observed among the recent studies noted in Table 1 (over the last ten years) rather than between Vainikka et al. (2011) and Table 1. This might be attributed to the different quality of SRF samples depending on the type of waste input and multi-stage processing configurations (Sarc et al., 2019), seasonality (Beckmann et al., 2012), geographical location (Kljusuric et al., 2015), off-taker specifications (Sarc et al., 2019), and/or the potential bias in composition determination. ‘Fines’, consisting of several materials with particle size usually defined by the cumulative passing <15 mm or less, constituting soil, dust, plastic fragments, glass, ferrous, organic, lythoid, ferrous, and other fragments (Di Maria et al., 2013; Velis, 2010) can considerably affect the quality of SRF/RDF (Nasrullah et al., 2016). Fines is typically an unwanted waste fraction because it reduces the calorific content of overall SRF/RDF due to its high content of non-combustible/inert materials; and because it concentrates contaminants such as potentially toxic elements (PTEs) (Nasrullah et al., 2014; 2015). Nasrullah et al. (2016) examined the mass flow of PTEs during SRF production in an MBT plant, finding that 45% of mercury and arsenic content of the input waste was present in the fine fraction that was produced in primary shredding and screened out as reject fraction, whereas SRF contained only 30% of total mercury and arsenic content of the input waste.
However, many waste products consist of a variety of components with different properties. For example, beverage cartons consist of paper (approximately 75% w/w), aluminium (approximately 5% w/w), and low density polyethylene (LDPE) (approximately 20%) (Korkmaz et al., 2009). Each waste component category at item level, such as textiles, wood, paper or plastics accommodates for a tremendous variability at material or chemical compound level indicating that they are arbitrarily and loosely defined. In textiles, natural materials, such as cotton, wool, and silk fibres, or synthetic materials, such as polyester, polyamide (PA) and acrylic fibres, or a combination of them under different proportions are used for the production of textile products (Pohl, 2010). Natural fibres are mainly composed of cellulose, which is a natural biomass polymer, whereas synthetic fibres are manufactured from mainly fossil-based polymers (Miranda et al., 2007). The different chemical composition between natural and synthetic fibres results in a wide range of properties and thermal behaviour of textiles at item level (Miranda et al., 2007; Pohl, 2010). Similarly, in the waste item category of paper/cardboard, raw materials used for papermaking can be divided into two categories: wood materials, such as softwood and hardwood fibres; and non-wood materials, such as grasses, cereal straws, corn stalks, bamboo, and bagasse (Liu et al., 2018). In Europe, hardwood fibres from oak, beech, poplar, birch and eucalyptus and softwood fibres from pine and spruce are mainly used in the papermaking industry (Statistica, 2020). The fibre type and pulping process (e.g. chemical or mechanical) can lead to considerably different paper properties (Hubbe et al., 2007; Liu et al., 2018). In several species of solar biomass, the percentage participation of cellulose, hemicellulose, and lignin varies considerably. In general, hardwood and softwood have similar thermal behaviour, with the difference being that softwood has higher fire retardancy due to higher char formation (Wong et al., 2014). Pine and poplar wood are, respectively, representative of softwood and hardwood, found in MSW as, for example, fruit boxes and plywood (Cozzani et al., 1995).
Prevalent polymers in SRF/RDF
The identification of polymer composition can give a deeper understanding of SRF/RDF thermal behaviour compared to that of waste items, which feature higher variability. The identification of polymer composition can provide also valuable information on the quality of SRF/RDF such as its heating value, an economic attribute of the fuel (Water and Resources Action Programme, 2009). For example, high content of lignocellulosic material tends to lower the heating value of the WDF, because of higher heating value (HHV) range at 12–21 MJ kg−1 (Boumanchar et al., 2017; Zhao et al., 2016), whereas fossil-based plastics with HHV at 20–47 MJ kg−1 increases their average heating value (Tsiamis and Castaldi, 2016).
Even within the same polymer type, considerable differences can be observed related to its macromolecular structure, which can affect the thermal stability of the polymer (Ray and Cooney, 2018). Specifically, all of type and concentration of functional groups, polymer size as defined by the degree of polymerisation (DP) and molecular weight (Francuskiewicz, 1994), degree of branching, cross-linking, crystallinity, and amorphousness have impact on the thermal behaviour of a polymer (Ray and Cooney, 2018). For example, a branched polymer presents lower thermal stability compared to a polymer with linear structure, whereas the presence of hydrogen bonding enhances the thermal stability of polymers. In addition, cross-linked polymers, such as polyethylene (PE), have higher resistance to thermal degradation. Crystalline structures have higher stability than amorphous areas, whereas the higher the polymer size the higher the resistance to thermal degradation (Ray and Cooney, 2018). SRF/RDF is mainly composed of two fractions including a wide variety of polymer molecules: biomass (biogenic, i.e. of plant or animal origin) (Séverin et al., 2010); and fossil-based plastic.
Biopolymers content analysis of SRF/RDF
Biomass mainly features three biopolymers: cellulose; hemicellulose; and lignin (Pérez et al., 2002), although other materials such as extractives, ash, and trace elements are also present (Dufresne, 2012). SRF/RDF contains significant amounts of these polymers. Conesa and Rey (2015) determined the biomass content in three MSW-derived commercially produced SRF samples at 86.5% w/w, of which 61.1% w/w was cellulose, 31.3% w/w lignin, and 7.6% w/w hemicellulose.
Cellulose is widely used in papermaking, building, pharmaceutical, food and textile industries (Lavanya et al., 2011; Osorno and Castro, 2018; Shokri and Adibkia, 2013). Cellulose is a linear polysaccharide composed of glucose monosaccharide units. Each of its monomers bears three hydroxyl groups, which are involved in several hydrogen bonds either within the chain (intramolecular) or with other molecules (intermolecular) resulting in different crystalline arrangements (Dufresne, 2012; Park et al., 2010). The degree of crystallinity, the size, and the orientation of the molecular chain determine the structure of the polymer. There are four different types of cellulose according to its crystalline structure: cellulose I, present in the majority of lignocellulosic plants, also known as natural; and the regenerated types of cellulose II, cellulose III and cellulose IV – as detailed further elsewhere (Nunes, 2017; Park et al., 2010; Roy Choudhury, 2017). The degree of crystallinity of cellulose is variable depending on the type of fibre. For example, cellulose from cotton has 70% degree of crystallinity (Wood, 1988), whereas in wood and plant fibres the degree of crystallinity ranges between 55–70% and 60–70%, respectively (Petroudy, 2017). In addition, DP of cellulose widely varies between 1000 and 27,000 (Dufresne, 2012; Hallac and Ragauskas, 2011). For example, the DP in wood fluctuates nearly by 10,000, whereas in cotton it is approximately 15000 (Zhang and Lynd, 2004). Cellulose microfibrils that form the cellulosic fibre have variable orientation and length depending on the source (Béguin and Aubert, 1994; Dufresne, 2012). A seminal study stated that the degree of crystallinity, the DP, and the chain orientation considerably influence the thermal behaviour of cellulose (Basch and Lewin, 1973).
Hemicellulose is a biopolymer with several industrial applications, such as hydrogels, paper coatings, and adhesives (Farhat et al., 2017). Its derivatives are also used in the food and pharmaceutical industry (Menon et al., 2010). Unlike cellulose, hemicellulose is a heterogeneous polysaccharide that may be composed of several sugar units, such as galactose, glucose, mannose, xylose, and arabinose (McKendry, 2002; Pérez et al., 2002). Hemicellulose is a branched polymer and the DP can range between 80 and 200 (Gatenholm and Tenkanen, 2003; Spiridon and Popa, 2008). There are four main types of hemicellulose: xylans; mannans; xyloglucan; and β-glucans with mixed linkages (Gatenholm and Tenkanen, 2003; Heinze and Liebert, 2012).
Specifically, xylan is the most abundant hemicellulose type that is composed of 20–30% of biomass plants (Heinze and Liebert, 2012; Pauly et al., 2013). Xylans consist of a linear β-(1,4)-linked xylose backbone, which can be substituted with acids or other substituents depending on the plant source (Pauly et al., 2013). A common type of substitution occurs where the xylose backbone is substituted with α-(1,2)-linked glucuronosyl and 4-O-methyl glucuronosyl residues, known as glucuronoxylans (Scheller and Ulvskov, 2010). The absence of a repeated structure results in many variations, not all well studied (Heinze and Liebert, 2012). In many studies, xylan was selected as a representative substance of hemicellulose in WDM (Cozzani et al., 1997; Heikkinen et al., 2004; Pérez et al., 2002; Raveendran et al., 1996; Yang et al., 2006). However, Cozzani et al. (1997) reported that the selection of xylans to represent hemicellulose could be misleading: it should be considered only as one of the common types of hemicellulose. Mannans are mainly used in the food industry and can be found in the wall of algae and gymnosperms (Pauly et al., 2013). There are different types of mannans, such as linear mannan, glucomannan, galactomannan, and galactoglucomannan, depending on backbone composition and sidechain substitution (Scheller and Ulvskov, 2010). The prevalent type of hemicellulose in hardwood is glucuronoxylan (approximately 80–90% of total hemicellulose content), whereas in softwood it is glucomannan (approximately 60–75% of total hemicellulose content) (Grønli et al., 2002; Pérez et al., 2002; Spiridon and Popa, 2008).
Lignin is the second most abudant substance in nature with wide application in several industries, such as building (e.g. dyes, paints, and flooring), food, pharmaceutical, cosmetics, textile (e.g. fire reduntant coating on textiles), and heat and power plants (Berlin and Balakshin, 2014; Mandlekar et al., 2018; Watkins et al., 2015). Lignin is the most heterogeneous biopolymer due to its variable structure regarding polymer size, composition, cross-linking, and functional groups (Dence and Lin, 1992). This variability affects its reactivity and thus, its thermal behaviour (Ibrahim et al., 2011). The composition of lignin differs not only between plant species, but also between parts of the same plant (Gosselink et al., 2004). Lignin is an amorphous polyphenolic polymer with high molecular weight that mainly consists of three phenylpropanoid units: (a) trans-p-coumaryl alcohol (H unit); (c) trans-coniferyl alcohol (G unit); and (c) trans-sinapyl alcohol (S unit) depending on the plant species (Ibrahim et al., 2011). Lignin in softwoods mainly consists of G units, while in hardwood it is composed of G and S units, in a ratio ranging from 4:1 to 1:2 (Wikberg, 2005). These monomeric units form a randomised structure in a three-dimensional network inside the cell wall yielding a vast number of functional groups and linkages: (a) structure I that can be found in plants, such as grass; (b) structure II in the wood of conifer plants; and (c) structure III in the wood of deciduous plants (Gellerstedt and Henriksson, 2008; Ibrahim et al., 2011; McKendry, 2002; Watkins et al., 2015). Different functional groups, such as hydroxyl, methoxyl, carbonyl, and carboxylic, can be found in lignin at different proportions (El Mansouri and Salvadó, 2007). It is difficult to measure the DP of lignin due to the polymer fragmentation during extraction (Polymer Database, 2019a).
In addition to the native lignin in its original form, technical lignin is produced as a byproduct from pulping or cellulosic ethanol processes (Li and Takkellapati, 2018). Gani and Naruse (2007) reported a morphological difference between technical and native lignin that can affect its thermal behaviour. The chemical composition of technical lignin may vary considerably depending on the type of raw material, delignification process, and pulping conditions (Polymer Database, 2019a; Sameni et al., 2014). The main technical lignins are kraft, sulphite, and soda lignin extracted through kraft, sulphite, and soda pulping, respectively (Lu et al., 2017). The first two pulping processes account for more than 90% of the chemical pulp production worldwide (Ahvazi et al., 2016).
In Figure 1, we summarise typical ranges of biopolymers content for four main biomass waste item categories of MSW (therefore found also in SRF/RDF): (a) paper/cardboard; (b) wood; (c) non-wood biomass materials used in papermaking; and (d) natural fibresmainly used in the textile industry. The specific products associated with these item categories can either be found directly in SRF/RDF (e.g. newspapers in the item category of paper/cardboard) or affect the biomass content in SRF/RDF through their presence in the manufacturing process of prevalent waste items (e.g. straw or hemp in the category of non-wood biomass for papermaking) (see raw data in Online Supplement SI.1). Presence of extreme values (Figure 1), indicates the considerable heterogeneous composition of biomass materials that can be present in SRF/RDF. Paper/cardboard and natural fibres contain higher content of cellulose compared to wood and non-wood biomass (Watkins et al., 2015) due to the delignification process in papermaking (Viikari et al., 2009) and the need of the textile industry to use fibres with high absorbency and whiteness (Jia et al., 2018), respectively.
Figure 1.

Typical content (dry basis) of biopolymers – cellulose, hemicellulose and lignin – for four main biomass waste item categories present in municipal solid waste indicating the variable content of biopolymers in the biomass fraction of solid recovered fuel/refuse-derived fuel depending on the source (between and within biomass waste item categories): paper/cardboard; wood; non-wood biomass materials used in papermaking; and natural fibres mainly used in the textile industry. Non-outlier range defined as ⩽1 interquartile range (IQR); and extreme values defined as ⩽1.5 IQR.
The calculation of confidence intervals (LCI–UCI, α = 0.1) using the data in Figure 1, shows that the biomass waste item category of paper/cardborad contains cellulose in the range of 49.2–76.6% w/w, 6.6–19.1% w/w hemicellulose, and 1.5–20.2% w/w lignin (α = 0.1). Similarly, wood contains 44.4–46.7% w/w cellulose, 24.2–28.5% w/w hemicellulose, and 23.1–26.9% w/w lignin (α = 0.1). The ranges of cellulose, hemicellulose, and lignin fluctuated in a range of 58.7–84.1% w/w, 7.8–19.6% w/w and 0.8–16.2% w/w for natural fibress, and 41.7–58.6% w/w, 18.9– 25.5% w/w and 12.6–20.6% w/w for non-wood biomass (α = 0.1). The content of biopolymers for the wood item category has a narrower range compared to that of paper/cardboard. This difference can also be seen in Figure 1 as the interquartiles of paper/cardboard are relatively wide, whereas the interquartiles of wood are the narrowest. This variation may be attributed to the dependance of the content of biopolymers not only on the fibres type such as wood, but also on the pulping process (Liu et al., 2018).
Fossil-based plastics content analysis of SRF/RDF
Unlike biomass polymers, there is a wide variety of fossil-based plastic polymers in MSW with the most prevalent being PE, polypropylene (PP), polyvinyl chloride (PVC) and polyethylene terephthalate (PET) due to their predominance in plastic packaging, which accounts for 40–60% of overall plastics waste generation (Bodzay and Bánhegyi, 2016; European Commission, 2018). Only polyolefins (PE and PP) accounted for approximately 60% of overall plastics production in EU-28 (PlasticsEurope, 2019a; Villanueva and Eder, 2014). Figure 2 shows an indicative content of prevalent fossil-based plastic polymers that can be present in SRF/RDF arising from typical contents of these plastic polymers in the overall plastics production and plastic waste arisings (see raw data in Online Supplement SI.2). PE is by far the dominant polymer in the plastic fraction of SRF/RDF (32–43% w/w, α = 0.1), followed by PP (17–22% w/w, α = 0.1), PET (8–13% w/w, α = 0.1), PVC (6–14% w/w, α = 0.1), and other plastics including fossil-based and bio-based plastic polymers (17–30% w/w, α = 0.1).
Figure 2.
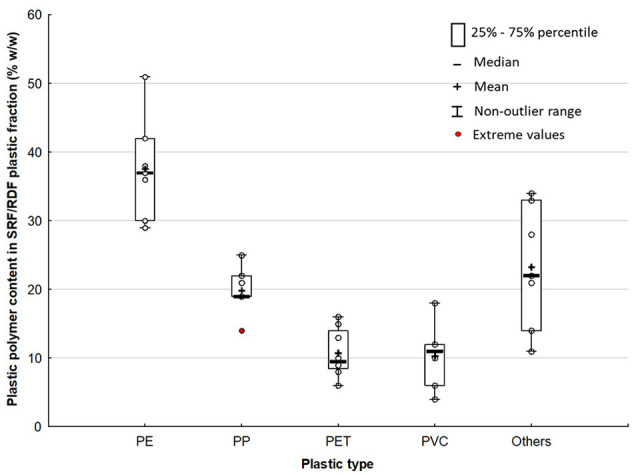
Typical content of fossil-based plastic polymers in overall plastics production and plastics waste arisings denoting an indicative content of the most prevalent plastic polymers in solid recovered fuel /refuse-derived fuel: polyethylene (PE), polypropylene (PP), polyethylene terephthalate (PET), and polyvinyl chloride (PVC). Non-outlier range defined as ⩽1 interquartile range (IQR); and extreme values defined as ⩽1.5 IQR.
However, these ranges might differ from the actual ranges of fossil-based polymers content in SRF/RDF depending on the particular sub-fractions of MSW from which SRF/RFD are generated (e.g household vs. commercial and industrial waste) (Nasrullah et al., 2014, 2015), the targeted properties for SRF/RDF, for example, maximum tolerant level of chlorine (Cl) (Department for Environment, Food and Rural Affairs, 2014), and the recovery efficiency of both MBT plants (Velis et al., 2010) and material recovery facilities (MRFs) (Cimpan et al., 2016; Iacovidou et al., 2017). For example, despite research and development efforts that have been conducted for the separation of black and highly coloured plastic materials from post-consumer plastic streams (e.g. via colour line camera; Neidel and Jakobsen, 2013), it still remains a challenge for MRFs leading to the inclusion of these materials in the residual waste stream (Forrest, 2016; Hinkel et al., 2019).
Polyethylene can be categorised based on its density, with the most common types being LDPE and high-density polyethylene (HDPE). Both PE types have similar properties, although HDPE has higher tensile strength. HDPE is mainly used for the production of bottles, packaging products with short shelf life and packaging of chemicals due to its high stiffness, barrier properties and chemical resistance, respectively (Villanueva and Eder, 2014). LDPE is mainly used for the production of plastic films due to its toughness, transparency, and flexibility (PlasticsEurope, 2019b).
The second most prevalent plastic polymer, PP, is found in two forms based on its stereochemical arrangement: isotactic PP characterised by high rigidity and hardness; and atactic PP, which is amorphous with less strength (Nicholson, 2017). However, the vast majority of commercial PP is isotactic (90–95%) (Nicholson, 2017), and it is found in flexible and rigid packaging products (Villanueva and Eder, 2014). Similarly to PE, isotactic PP has high tensile strength and chemical resistance (Gabbott, 2008; Maddah, 2016; Polymer Database, 2019b).
The presence of textiles and beverage bottles are the reasons that PET is one of the prevalent fossil-based polymers in SRF/RDF (toughness, high resistance to most solvents, and clear and optically smooth surfaces; Villanueva and Eder, 2014) – not all of them are collected for recycling and therefore, may de facto and for now still constitute part of SRF/RDF. Specifically, polyester fibres from PET constitute the most widely used synthetic fibre in the textile industry (Ravindranath and Mashelkar, 1984; Sarioğlu and Kaynak, 2017; Van der Velden et al., 2014). In 2015, nearly 15% of global plastic production was used in textile industries for the production of synthetic textiles (Geyer et al., 2017). PET accounts for 70% of global production of polyester, PA and acrylic fibres (Geyer et al., 2017).
Polyvinyl chloride is used in a variety of applications, such as construction, building, automobile, and packaging industries due to its excellent processing performance, resistance to oil and chemical reaction, and high strength (Villanueva and Eder, 2014). However, PVC is an unwanted component in SRF/RDF due to its high Cl content (46–54% w/w; Phyllis, 2019). The quality of SRF based on its Cl content has been specified by the CEN classification scheme (British Standard Institution 15359, 2011) and is a key consideration in mechanical processing of MSW into SRF (Velis et al., 2012, 2013). Indeed, we demonstrated elsewhere how Cl in SRF/RDF is an important technical limiting factor in co-combustion applications, causing several operating problems and, therefore, the fate of Cl during SRF thermal treatment must be monitored (Gerassimidou et al., 2020a). Although, near infra-red technology is an applied sorting process in MBT plants for the removal of PVC, still PVC fragments are present in SRF/RDF.
Composition of synthetic SRF/RDF
A method to obtain insights into the thermal behaviour of SRF/RDF is to artificially prepare synthetic mixtures with a known composition similar to SRF/RDF. This approach is undertaken due to the difficulty in conducting compositional analysis in commercially manufactured samples. Table 2 presents several examples of synthetic SRF/RDF samples as prepared in previous studies. The biomass fraction of simulated SRF/RDF is mainly composed of paper and/or wood. However, the composition of plastic fraction is more complicated due to the wide variety of post-consumer plastic polymers. According to Grammelis et al. (2009), cardboard and magazine paper can represent the biomass fraction of SRF/RDF better than other biomass waste items, whereas PE resembles more closely the plastic fraction compared to other plastics. The main reason that synthetic SRF/RDF samples contain PVC, which is the exclusive or the prevalent source of Cl, is that Cl should be present in order to resemble the genuine SRF/RDF (Gerassimidou et al., 2020a). However, significant inconsistencies can be noticed between the thermal behaviour of synthetic and genuine waste samples with similar composition due to the presence of plastic additives or other unknown substances in the genuine sample (Cuperus et al., 2005; Grammelis et al., 2009). For example, heat stabilisers are widely used in food plastic packaging to prevent polymer decomposition when exposed at elevated temperatures resulting in higher thermal stability compared to their synthetic pure counterparts (Hahladakis et al., 2018).
Table 2.
Composition of synthetic solid recovered fuel/refuse-derived fuel (SRF/RDF) samples prepared to simulate the thermal behaviour of actual SRF/RDF as received reporting basis.
| Paper | Plastics | Textiles | Wood | Other | References | ||
|---|---|---|---|---|---|---|---|
| Biomass | 58 | 15 | 5a | Wagland et al. (2011) | |||
| Plastics | Polyethylene (PE) | 12 | |||||
| Polypropylene (PP) | 8 | ||||||
| Polyvinyl chloride (PVC) | 2 | ||||||
| Biomass | 46.1 | 3.1b | 2.3c | 8.5d | Cuperus et al. (2005) | ||
| Plastics | PE | 23 | |||||
| PP | 16 | ||||||
| PVC | 1 | ||||||
| Biomass | 50e | Pedersen et al. (2016) | |||||
| Plastics | PE | 50 | |||||
| PP | |||||||
| Polyethylene terephthalate | |||||||
| Biomass | 44–62 | Chiemchaisri et al. (2010) | |||||
| Plastics | 38–56 | ||||||
| Biomass | 46 | Wang et al. (2002) | |||||
| Plastics | PE | 50.4 | |||||
| PVC | 3.6 | ||||||
Notes: a conifer saw dust; b sackcloth; c pallet; d grass; and e pine wood.
TGA of WDM
The SRF/RDF is decomposed in a wider temperature range at lower levels compared to fossil fuels due to its low fixed-carbon and high volatile matter (Akdağ et al., 2016; Skodras et al., 2009). For example, the range of decomposition temperature of coal is 700–800°C and petroleum coke is 500–700°C, whereas for SRF/RDF this range is 200–600°C (under oxidative conditions) (Akdağ et al., 2016). However, SRF/RDF has higher thermal resistance than MSW (Azam et al., 2019). Azam et al. (2019) investigated the thermal stability of MSW and RDF reporting that the peak decomposition temperature of MSW was lower (295°C) than that of RDF (341°C), whereas the range of decomposition temperature was wider for MSW (220–560°C) compared to RDF (236–554°C).
Experimental conditions in TGA of WDM
The experimental conditions applied in TGA (heating rate, atmospheric conditions, sample mass, and maximum temperature) affect the thermal behaviour of the sample and should be consciously selected (Bottom, 2008; Haines, 2002). The selection of experimental conditions depends on sample characteristics, such as particle size, calorific content, inorganic content, impurities, and chemical composition (Heal, 2002). Figure 3 summarises conditions used in non-isothermal TGA experiments for the investigation of thermal behaviour of WDM (see raw data in Online Supplement SI.3).
Figure 3.

Non-isothermal conditions applied in thermogravimetric analysis (TGA) experiments for the investigation of thermal behaviour of municipal solid waste, solid recovered fuel/refuse-derived fuel (SRF/RDF), and several waste items/materials on an as received reporting basis, indicating the typical experimental conditions used in TGA compositional analysis of SRF/RDF: (a) selected heating rates per TGA experiment; (b) selected atmospheric condition per study; (c) selected sample mass per study; and (d) selected maximum temperature per study.
Heating rate affects the range of decomposition temperature of the sample (Marsh et al., 2007; Park et al., 2012; Slopiecka et al., 2012; Wang et al., 2020; Yurdakul and Atimtay, 2015). Increased heating rates result in higher decomposition temperatures and higher rates of mass loss due to the changes in activation energy and/or different heat dissipation rates (Conesa and Rey, 2015; Lin et al., 1999; Park et al., 2012; Quan et al., 2016; Yang et al., 2001; Yurdakul and Atimtay, 2015). High heating rates can lead to significant overlapping effects between the heating profiles of the components contained in the sample resulting in interpretation problems of the results, for example, in a mixture of plastics that contains polymers with similar ranges of decomposition temperature (Bottom, 2008; Luo et al., 2018; Marsh et al., 2007). But, too low heating rates are time consuming (Bottom, 2008; Heal, 2002). Figure 3 shows that nearly 55% of total TGA experiments of WDM was conducted using a heating rate of 10°C min−1 or less, with a view to obtaining a comparatively better resolution of the decomposition profile of the samples. Heating rate can, also, affect the yields of products during thermal treatment. For example, Efika et al. (2015) found that increasing heating rates during pyrolysis induced higher gas yields and reduced liquid and solid yields. In TGA experiments conducted for compositional analysis purposes of WDM, the heating rate should be relatively low so that the peaks of DTG curves of waste components can be as discernible as possible (Beckmann et al., 2012).
The gaseous atmospheric conditions used in the TGA experiment is a crucial factor that affects the type of thermal process, for example, combustion occurs in the presence of (over)stoichiometric oxygen, whereas pyrolysis occurs in the presence of inert, non-oxidising atmosphere, resulting in different thermal decomposition profiles of the sample and product formation (Bottom, 2008; Conesa and Rey, 2015). The presence of oxygen increases the rate of mass loss, and therefore reduces the range of decomposition temperature (Grammelis et al., 2009; Skodras et al., 2009). Specifically, Conesa and Rey (2015) reported that SRF is thermally decomposed in a range at nearly 50°C lower during combustion compared to pyrolysis. The majority of the studies (76%) selected an inert atmosphere, using mainly nitrogen (Figure 3). Studies interested in the thermal degradation of SRF/RDF selected an inert atmosphere, whereas studies interested in the combustion behaviour selected oxidative conditions (air or oxygen). The preference for an inert atmosphere is attributed to the fact that combustion is more rapid than pyrolysis, and reactions between oxygen and waste components (e.g. lignin) might occur (Conesa and Rey, 2015; Long et al., 2017; Soares et al., 1995) making the compositional analysis of the sample more complicated. In TGA compositional analysis experiments, typically inert gas is preferred, such as nitrogen or argon, to avoid oxidation reactions (Bottom, 2008). A few researchers applied both atmospheres to draw comparisons (Conesa and Rey, 2015; Edo et al., 2016; Grammelis et al., 2009; Skodras et al., 2009).
Sample size selected in TGA experiments should be relatively small, in comparison to other analytical laboratory techniques, ranging on the milligram scale at around 10–100 mg, and mainly have, as far as possible, the sample exposed to uniform thermal conditions (Heal, 2002). Such a small sample mass of SRF/RDF can make the acquisition of representative analytical results a major challenge, as we established in detail (Gerassimidou et al., 2020b). Therefore, major attention should be paid on the sampling process before TGA (Robinson et al., 2016). A larger sample would have required more energy and associated heat transfer to obtain uniform reaction conditions throughout the sample body (Robinson et al., 2016). Despite the inherent heterogeneity of SRF/RDF, 55% of studies selected a sample mass ⩽10 mg, whereas only one study (5% of total number) selected 30 mg (Figure 3). However, it is worth noting that most of the studies (56%) omitted to report the sample mass used in the TG experiments.
Sampling method and sample preparation, known as sub-sampling plan, can be significant sources of variability of analytical results, especially for heterogeneous materials (Gerlach and Nocerino, 2003; Ramsey and Thompson, 2007). Before TGA, samples should be pulverised to fine powders, whilst ideally avoiding the evaporation of volatiles (e.g. mercury or moisture), melting of fragments with low melting points (e.g. polyolefins; Pedersen et al., 2016), and other related processes induced by the heat generated during pulverisation (Gerlach and Nocerino, 2003). Cryogenic shredding is able to produce a fine particle size at very low temperature using liquid nitrogen, thus, preventing such unwanted processes (Junghare et al., 2017). Robinson et al. (2016) examined the influence of sample preparation of RDF on the repeatability of TGA results. Several RDF samples were prepared by using a variety of equipment and procedures, such as knife milling, quartering milling, and cryogenic milling, finding that cryogenic grinding provided repeatable results. The particle size of the test SRF/RDF sample defined by the cumulative passing of sieve must be typically less than 0.25 mm to obtain uniform thermal behaviour throughout the sample body (Beckmann et al., 2012; Robinson et al., 2016).
The maximum temperature applied in a TGA experiment might not be sufficient to ascertain the sample degradation (maximum temperature ⩾ Te). It should suffice at least for the main stages of sample decomposition (inclusion of DTG peaks). Figure 3 shows that 24% of the total studies selected a temperature range starting from room temperature and ending between 550 and 750°C, whereas the majority of researchers (51%) selected a maximum temperature ranging between 750 and 950°C.
Thermal behaviour of SRF/RDF
The thermal degradation of SRF/RDF is mainly a result of the thermal degradation of the biogenic (cellulosic) and plastic fraction (Danias and Liodakis, 2018). Table 3 illustrates the main characteristic points of TG–DTG curves arising from the thermal behaviour reported for SRF/RDF. Differences among the decomposition profiles of SRF/RDF could be due to differing experimental conditions and differing composition of SRF/RDF samples between studies, for example, the presence of food waste into SRF can lower its To (Edo et al., 2016).
Table 3.
Characteristic points of thermogravimetry–derivative thermogravimetry (TG–DTG) curves of solid recovered fuel/refuse-derived fuel (RDF) from municipal solid waste (MSW) including onset temperature (To), endset temperature (Te), number of DTG peak/shoulder, peak temperature (Tp), and residue under specific experimental conditions (gas atmosphere and heating rate) over the last ten years as received reporting basis.
| Atmosp.1 | Heat. rate (°C min−1) |
Decomposition temp
(°C) |
No. of peak | Tp (°C)4 | Residue (% w/w)5 | References | |
|---|---|---|---|---|---|---|---|
| To2 | Te3 | ||||||
| Inert | 10 | 200 | 800 | 2 | 312, 495 | 13 | Efika et al. (2015) |
| Inert | 10 | 180 | 750 | 3 | 270, 470, 660 | n. a. | Stępień et al. (2019) |
| Inert | 10 | n. a. | n. a. | 2a | 336, 476 | 20 | Edo et al. (2016) |
| Inert | 10 | 200 | 500 | 2 | 310, 450 | 25 | Silva et al. (2015) |
| Inert | 10 | 250 | 500 | 3 | 285, 352, 450 | 15 | Bosmans et al. (2014) |
| Inert | 20 | 250 | 550 | 2 | 348, 480 | 20 | Grammelis et al. (2009) |
| Inert | 20 | 200 | 550 | 2 | 350, 500 | 22 | Skodras et al. (2009) |
| Inert | 20 | 230 | 700 | n. a. | 320–340 | 12 | Tokmurzin et al. (2019) |
| Inert | 25 | 180 | 700 | 3 | 342, 472, 670 | 17 | Robinson et al. (2016) |
| Inert | 25 | 200 | 500 | 2 | 300, 470 | n. a. | Singh et al. (2012) |
| Inert | 5–50b | 200 | 750 | 3 | 325–365, 440–495, 645–710 | 20–24 | Çepelioğullar et al. (2016) |
| Oxidative | 5 | 235 | 2–3c | 280, 440 | n. a. | Medic-Pejic et al. (2016) | |
| Oxidative | 10 | 236 | 554 | 2 | 341, 465 | 9 | Azam et al. (2019) |
| Oxidative | 10 | 200 | 540 | 2 | 340, 460 | n. a. | Chae et al. (2019) |
| Oxidative | 10 | 200 | 600 | 2d | 320, 500 | 21 | Akdağ et al. (2016) |
| 3d | 330, 400, 510 | 19 | |||||
| Oxidative | 10 | 200 | 500 | 3a | 225, 331, 461 | n. a. | Edo et al. (2016) |
| Oxidative | 10 | 233 | 700 | 3 | 283, 463, 618 | n. a. | Chen et al. (2018) |
| Oxidative | 20 | 200 | 500 | 2 | 310, 460 | 11 | Grammelis et al. (2009) |
Notes: 1 atmospheric conditions, gas used in the thermogravimetric analysis experiment; 2onset temperature; 3 endset temperature; 4 peak temperature at each DTG shoulder; 5 residue, non-volatile matter left after degradation; a data derived from three samples that resemble RDF, one from residue of MSW containing plastics, paper, textiles and low amounts of food waste, and the other two from derived-materials consisting of residual MSW after drying and separation of incombustibles and food waste; b eight different heating rates were used – 5, 10, 15, 20, 25, 30, 40, and 50; c derived from 10 different samples at different seasons and different locations; d two different samples from two different cities; and n. a., not available.
Table 3 shows that SRF/RDF is mainly decomposed in a range of 200–600°C and its non-volatile content fluctuates between 10 and 20%. The DTG thermogram of SRF/RDF mainly consists of either two or three peaks/shoulders excluding the peak due to moisture evaporation. The first peak represents the degradation of cellulosic fraction (200–400°C) and the second represents the degradation of plastics (400–600°C) (Edo et al., 2016; Efika et al., 2015; Grammelis et al., 2009). The thermal decomposition of plastics at higher temperatures compared to lignocellulosic materials reveals the higher thermal stability of the plastic fraction (Skodras et al., 2009). The highest rate of mass loss was observed either in the first or in the second DTG peak depending on the composition of SRF/RDF. A last DTG shoulder might occur at elevated temperatures (600–700°C) due to the interaction of char with gas (e.g. oxygen) along with ash deformation leading to the formation of mineral matter (Çepelioğullar et al., 2016). Grammelis et al. (2009) stated that the decomposition behaviour of SRF/RDF is comparable with that of beverage cartons, which was decomposed into two stages due to degradation of paper (200–400°C) and plastic content (450–550°C), respectively.
Older studies conducted before 2009 found similar results with the current studies, although the waste composition changes over time due to the development of the MSW treatment performance, such as increasing recycling and composting rates (Pomberger et al., 2017). For example, Lin et al. (1999) reported two main distinct stages of mass loss during RDF pyrolysis: the first stage due to cellulosic degradation and partial degradation of PVC (Tp: 327°C); and the second stage due to plastics (Tp: 460°C). Similar thermal profiles of RDF decomposition were found by Cozzani et al. (1995). There are also older studies that reported three DTG peaks at similar temperature ranges to those of recent studies (Casu et al., 2006; Cheng et al., 2007).
Figure 4 shows a typical TG–DTG thermogram of SRF/RDF based on the most prevalent polymers, including its moisture content under inert atmosphere and low heating rate (10°C min−1) as perceived from literature findings. Overlapping effects occur between prevalent polymers such as cellulose – hemicellulose and PE – PP and PET –polyolefins, but lignin and PVC overlap with all waste polymers due to their wide range of decomposition temperature.
Figure 4.

Typical thermogravimetry–derivative thermogravimetry (TG–DTG) thermogram of solid recovered fuel/refuse-derived fuel (SRF/RDF) based on the most prevalent component polymers: water, cellulose, lignin, xylan, polyethylene (PE), polypropylene (PP), polyethylene terephthalate (PET), and polyvinyl chloride (PVC) (represents the chlorine content) under inert atmosphere and low heating rate (10°C min−1) as received reporting basis. Main features of the generalised average SRF/RDF thermal decomposition behaviour are: (a) considerable overlapping effects between prevalent polymers; (b) wider range of decomposition temperature for biopolymers than fossil-based polymers; (c) similar temperature ranges for the degradation of prevalent fossil-based plastic polymers except PVC; and (d) complete thermal degradation of most of the prevalent components in SRF/RDF at nearly 550°C (axis of DTG curve was omitted due to unit inconsistencies among different studies leading to inability to obtain related information).
Thermal behaviour of waste component categories (item/material)
Table 4 illustrates characteristic points of the TG–DTG curves of prevalent waste items/materials present in SRF/RDF categorised by the main waste items wood, paper, and textile materials. In the case of plastics, researchers used to analyse plastic polymers instead of post-consumer plastic materials that is presented in the next sub-section. The degradation of the major biomass material occurs between 200 and 400°C with a Tp ranging from 355 to 370°C (Chen et al., 2015; Cozzani et al., 1997; Sørum et al., 2001). The decomposition of lignocellulosic components usually consists of two stages: the first stage is attributed to the degradation of hemicellulose (200–350°C), cellulose (250–400°C), and partial decomposition of lignin (200–400°C); and the second stage is attributed to the degradation of the remaining lignin and charring of leftover (400–800°C) (Boumanchar et al., 2017; Chhabra et al., 2019; Heikkinen et al., 2004; Porshnov et al., 2018; Skreiberg et al., 2011). In biomass mixtures, the DTG shoulder of hemicellulose might seem as a pronounced shoulder of cellulose rather than as a well-defined peak due to their similar decomposition ranges resulting in partial overlap (Bosmans et al., 2014; Grønli et al., 2002).
Table 4.
Characteristic points of thermogravimetry–derivative thermogravimetry (TG–DTG) curves (onset temperature (To), endset temperature (Te), number of DTG peak/shoulder, peak temperature (Tp), and residue) of prevalent items/materials in SRF/RDF including wood, paper/cardboard and textiles under specific experimental conditions (gas atmosphere and heating rate) as received reporting basis.
| Waste category | Waste component | Atmosp.1 | Heat rate (°C min−1) |
To (°C) 2 | Te (°C) 3 | No. of peaks | Tp (°C)4 | Residue (% w/w)5 |
References |
|---|---|---|---|---|---|---|---|---|---|
| Wood | Mixed-wood pellets | Inert | 5 | n. a. | n. a. | 1 | 348 | 7 | Skreiberg et al. (2011) |
| 20 | 1 | 370 | 14 | ||||||
| Oxidative | 5 | n. a. | n. a. | 2 | 315, 443 | <1 | |||
| 20 | 2 | 340, 464 | <1 | ||||||
| Pine–spruce mix | Inert | 10 | 250 | 500 | 2 | 320, 358 | 7 | Edo et al. (2016) | |
| Oxidative | 10 | 287 | 495 | 2 | 350, 470 | ||||
| Pine wood | Inert | 5, 20, 40 | 260–280 | 405–480 | 2 | 325–400, 385–450 |
20 | Williams and Besler (1996) | |
| Saw dust | Inert | 20 | 200 | 420 | 1 | 359 | 18 | Ma et al. (2019) | |
| Poplar wood | Inert | 2 & 5 | 177 | 377 | 2 | 257, 362 | 28 | Slopiecka et al. (2012) | |
| 10 & 15 | 177 | 467 | 1 | 342 | 26 | ||||
| Poplar wood | Inert | 10 | 150 | 500 | 2 | 345, 490 | 31 | Chen et al. (2015) | |
| Hardwood | Inert | 5 | 243 | 369 | 1 | 347 | 18 | Grønli et al. (2002) | |
| Softwood | 235 | 375 | 1 | 348 | 23 | ||||
| Hardwood | Inert | 20 | n. a. | n. a. | 1 | 371–376 | Heikkinen et al. (2004) | ||
| Softwood | 1 | 374–381 | |||||||
| Paper/cardboard | Paper waste | Inert | 30 | 230 | 600 | 3 | 370, 516, 575 | Chhabra et al. (2019) | |
| Paper waste | Inert | 10 | 300 | 400 | 1 | 350 | 7 | Chen et al. (2015) | |
| Paper* | Inert | 20 | n. a. | n. a. | 1 | 361–372 | n. a. | Heikkinen et al. (2004) | |
| Paperboard | Inert | 20 | 200 | 800 | 2 | 361, 732 | 30 | Ma et al. (2019) | |
| Glossy paper | Inert | 5 | n. a. | n. a. | 2 | 340, >600 | 21 | Skreiberg et al. (2011) | |
| 20 | 2 | 362, >600 | 22 | ||||||
| Oxidative | 5 | n. a. | n. a. | 2 | 317, >600 | 20 | |||
| 20 | 2 | 337, >600 | 23 | ||||||
| Paper** | Inert | 20 | 300 | 400 | 1 | 365–375 | 20–26 | Grammelis et al. (2009) | |
| Oxidative | 20 | 240–260 | n. a. | 1 | 334–342 | 5–23 | |||
| Tissue paper | Inert | 10 | 250 | 400 | 1 | 353 | 7 | Zhou et al. (2015b) | |
| Non-packaging paper waste | Inert | 10 | 200 | 450 | 1 | 325 | 29 | Silva et al. (2015) | |
| Newspaper | Inert | 3–9 | 250 | 400 | 1 | 351 | n. a. | Lin et al. (1999) | |
| Toilet paper | Inert | 3–9 | 250 | 400 | 1 | 347 | n. a. | ||
| Beverage carton | Inert | 20 | 200 | 550 | 2 | 373, 488 | 7 | Grammelis et al. (2009) | |
| Textiles | Textile | Inert | 30 | 260 | 500 | 2 | 350, 488 | n. a. | Chhabra et al. (2019) |
| Cotton clothes | Inert | 20 | 300 | 410 | 1 | 373 | 10 | Ma et al. (2019) | |
| Polyester fabrics | Inert | 10 | 375 | 475 | 1 | 438 | 18 | Chen et al. (2015) | |
| Textile waste | Inert | 10 | 200 | 500 | 2 | 330, 440 | 18 | Silva et al. (2015) | |
| Textile waste | Inert | 1, 5, 10, 20, 40, 60 |
105–119 | 433–520 | 3 | 199–291, 318–392, 377–449 |
10–12 | Muralidhara and Sreenivasan (2010) | |
| 10 | 115 | 474 | 3 | 245, 354, 424 | 11 | ||||
Notes: 1 atmospheric conditions, gas used in the thermogravimetric analysis experiment; 2 onset temperature; 3 endset temperature; 4 peak temperature at each DTG shoulder; 5 residue, non-volatile matter left after degradation; * included cardboard, corrugated paper, egg carton, facial tissue, glossy paper, newspaper, office paper, and paper sludge; ** five types of paper were analysed including magazine paper, cardboard, recycling paper, newspaper and copy paper; and n. a., not available.
Table 4 shows that the DTG thermogram of wood contains either one or two shoulders. This difference can be attributed to the incomplete degradation of lignin when the TGA experiment might be completed before the complete lignin degradation (around 900°C) or to overlapping effects between cellulose and hemicellulose intensified by high heating rates. Slight differences might be observed between the TG–DTG thermograms of softwood and hardwood due to different chemical composition. For example, the reactivity of hemicellulose is higher for hardwoods than softwoods and, therefore, the degradation zone of cellulose and hemicellulose can be better distinguished in hardwoods (Grønli et al., 2002). Softwood is less thermally stable and decomposed at a wider temperature range compared to hardwood, although a common devolatilisation mechanism could describe the thermal behaviour of both (Grønli et al., 2002). However, additives such as melamine and nitrogenated adhesives used in wood furniture manufacturing can considerably affect the TG–DTG thermogram of wood by lowering the Tp due to their inorganic salt content (Moreno and Font, 2015).
Similarly to wood, paper is decomposed in one or two stages depending on its biochemical composition. The first stage is attributed to degradation of cellulosic matter (200–400°C) and the second (>550°C) caused by the conversion of paper additives, such as calcium carbonate (CaCO3), to reaction products (Chhabra et al., 2019; Cozzani et al., 1995; Skreiberg et al., 2011). Grammelis et al. (2009) compared the pyrolytic behaviour of five different types of paper namely magazine paper, cardboard, recycling paper, newspaper, and copy paper. These paper samples presented similar profiles of decomposition temperature, but they differed in thermal reactivity (rate of mass loss), with copy paper being the most reactive. A pronounced shoulder was more evident in the DTG thermogram of newspaper compared to other paper samples due to its higher hemicellulose content (Grammelis et al., 2009). Catalytic effects induced by inorganic substances (e.g. ash) and residues from papermaking (e.g. sulphate production process) can also lead to cellulose decomposition at lower temperatures (Sørum et al., 2001).
Textiles may consist of natural or synthetic fibres which correspond to similar thermal behaviour with that of cellulosic and plastic materials, respectively (Cozzani et al., 1995). Table 4 shows that textiles are devolatilised into one, two or three main distinct regions: initial, main and char decomposition (Miranda et al., 2007; Zhu et al., 2004). One stage occurs in purely synthetic or natural fibres, whereas three stages occur in blended fibres. Two stages are related to natural fibres due to degradation of cellulosic matter. In the first stage (100–300°C) the mass loss is low, whereas in the second stage the loss is fast and high (250–400°C). The third stage is due to the presence of synthetic polymers and/or char formation (380–500°C) (Chhabra et al., 2019; Miranda et al., 2007; Zhu et al., 2004).
Rubber is a separate waste component category that can be found in SRF/RDF at low proportions, which does not exceed 6% w/w (Nasrullah et al., 2016; Stępień et al., 2019; Velis, 2010). Rubber composition varies depending on the elastomer type, such as nitrile, fluorocarbon, chloroprene, silicone, polyacrylate, polyurethane, styrene–butadiene, and natural (Datwyler, 2020). The thermal behaviour of rubber is not described in the present study due to the wide variety of chemical constituents used for its production and its low proportion in SRF/RDF. However, Boumanchar et al. (2017) reported that the decomposition profile of synthetic rubber is similar with that of a plastic mixture consisting of PE, PP, and PVC.
Thermal behaviour of prevalent polymers in SRF/RDF
Thermal degradation of fossil-based plastics
The mechanism for the degradation of plastic polymers is based on the chain scission of macromolecules following a multistep pathway: (a) initiation, in which free radicals are formed resulting in a more reactive and unstable polymer; (b) propagation, in which char is formed; and (c) termination, in which inactive by-products are formed via radical coupling or radical disproportionation (Ray and Cooney, 2018). The stage of propagation consists of a series of reactions that involve intramolecular (within a single polymer chain) and intermolecular (between polymer chains) hydrogen transfer followed by the reverse process of polymerisation, often referred as unzipping or depolymerisation (Beyler and Hirschler, 2002).
The literature findings showed that the most prevalent post-consumer plastic polymers are PE, PP, PET, and PVC. The thermal degradation of these plastic polymers occurs in a single narrow DTG shoulder, except for PVC that consists of two-step degradation during pyrolysis (Table 5). The thermal stability of polymers in a descending order is as follows: PE > PP > PET > PVC (Hujuri et al., 2008; Lin et al., 1999).
Table 5.
Characteristic points of thermogravimetry–derivative thermogravimetry (TG–DTG) curves of prevalent fossil-based plastic polymers in solid recovered fuel/refuse-derived fuel including onset temperature (To), endset temperature (Te), number of DTG peak/shoulder, peak temperature (Tp), and residue under inert atmosphere as received reporting basis.
| Polymer | Heat rate (°C min−1) |
To
(°C)1 |
Te
(°C)2 |
Number of peaks | Tp
(°C)3 |
Residue (% w/w)4 |
References | |
|---|---|---|---|---|---|---|---|---|
| Polyethylene (PE) | High-density polyethylene (HDPE) | 3, 5, 7, 9 | 443 | 535 | 1 | 470 | n. a. | Lin et al. (1999) |
| Low-density polyethylene (LDPE) | 425 | 565 | 468 | n. a. | ||||
| HDPE | 2, 5, 10, 20 | 350 | 464–511 | 1 | 444–483 | n. a. | Yang et al. (2001) | |
| LDPE | 10 | 310 | 497 | 468 | n. a. | |||
| LDPE | 10, 20, 30, 40 | 450 | 520 | 1 | 470 | <1 | Park et al. (2012) | |
| HDPE | 5 | 446 | 472 | 1 | 464 | <1 | Mumbach et al. (2019) | |
| Recovered HDPE* | 412 | 474 | 456 | 14 | ||||
| LDPE | 440 | 471 | 466 | <1 | ||||
| Recovered LDPE* | 429 | 471 | 455 | 3 | ||||
| PE | 10–40 | 408 | 504 | 1 | 463 | <1 | Wang et al. (2020) | |
| PE | 10 | 400 | 500 | 1 | <1 | Ray and Cooney (2018) | ||
| HDPE | 10 | 350 | 500 | 1 | 479 | <1 | Sørum et al. (2001) | |
| LDPE | n. a. | n. a. | 475 | <1 | ||||
| LDPE | 10 | 341 | 495 | 1 | 463 | n. a. | Hujuri et al. (2008) | |
| HDPE | 10 | 350 | 500 | 1 | 479 | <1 | Sørum et al. (2001) | |
| LDPE | 475 | |||||||
| LDPE | 10 | 341 | 495 | 1 | 463 | n. a. | Hujuri et al. (2008) | |
| PE | 15 | 430 | 519 | 1 | 485 | <1 | Yu et al. (2019) | |
| HDPE | 20 | 450 | 550 | 1 | 493 | n. a. | Heikkinen et al. (2004) | |
| LDPE | 20 | 450 | 550 | 1 | 491 | n. a. | ||
| Isotactic polypropylene (PP) | Pure PP | 5 | 413 | 451 | 1 | 423 | n. a. | Mumbach et al. (2019) |
| Recovered PP* | 425 | 456 | 443 | n. a. | ||||
| 10 | 340 | 452 | 1 | 486 | <1 | Părpăriţă et al. (2014) | ||
| 10 | 350 | 495 | 1 | 437 | n. a. | Yang et al. (2001) | ||
| 10 | 337 | 471 | 1 | 446 | n. a. | Hujuri et al. (2008) | ||
| 10 | 350 | 500 | 1 | 460 | <1 | Sørum et al. (2001) | ||
| 15 | 390 | 480 | 1 | 447 | <1 | Yu et al. (2019) | ||
| 20 | 420 | 500 | 1 | 472 | n. a. | Heikkinen et al. (2004) | ||
| 30 | 400 | 516 | 1 | 480 | n. a. | Chhabra et al. (2019) | ||
| Polyethylene terephthalate (PET) | PET-bottlers | 5, 10, 20, 40, 50 | 385–425 | 550 | 1 | 427–465 | 12–14 | Das and Tiwari (2019) |
| 5, 10, 15, 25 | 366–398 | 514–519 | 1 | 430–465 | 85–95 | Saha et al. (2006) | ||
| 5, 10, 20, 40 | 360–379 | 460–521 | 1 | 419–455 | 20–22 | Özsin et al. (2019) | ||
| 10 | 370 | 460 | 1 | 441 | n. a. | Yang et al. (2001) | ||
| 10 | 400 | 460 | 1 | 15 | Ray and Cooney (2018) | |||
| 10 | n. a. | n. a. | 1 | 384 | 17 | Miri et al. (2019) | ||
| 15 | 430 | 470 | 1 | 433 | n. a. | Yu et al. (2019) | ||
| 20 | n. a. | n. a. | 1 | 444 | n. a. | Heikkinen et al. (2004) | ||
| 30 | 380 | 500 | 1 | 450 | n. a. | Chhabra et al. (2019 ) | ||
| Polyvinyl chloride (PVC) | 3, 5, 7, 9 | 210 | 530 | 2 | 380, 443 | n. a. | Lin et al. (1999) | |
| 5, 10, 20, 40 | 235–240 | 515–578 | 2 | 270–318, approximately 450 |
10–12 | Özsin et al. (2019) | ||
| 10 | 200 | 500 | 3 | 287, 331, 462 | n. a. | Yang et al. (2001) | ||
| 10 | 220 | 580 | 2 | 286, 475 | n. a. | Zhou et al. (2015b) | ||
| 10 | 200 | 550 | 2 | 290, 450 | 10 | Sørum et al. (2001) | ||
| 15 | 297 | 570 | 2 | 330, 460 | 9 | Yu et al. (2019) | ||
| 20 | 260 | 550 | 2 | 305, 467 | n. a. | Heikkinen et al. (2004) | ||
| 20 | 300 | 520 | 2 | n. a. | Erickson (2007) | |||
| Plastic mixture** | 10, 20, 30, 40 | 260 | 540 | 2 | 300, 450 | 10 | Park et al. (2012) | |
Notes: 1 onset temperature; 2 endset temperature; 3 peak temperature at each DTG shoulder; 4 residue, non-volatile matter left after degradation; * recovered plastic materials from the process of recycling paper scrap; ** mixture of polystyrene, LDPE, PP and PVC; and n. a., not available.
During pyrolytic conditions, PE decomposition starts at 310–450°C and completes at 460–560°C, depending on its density and the heating rate, whereas the Tp occurs in a range of 450–490°C. Between the most popular types of PE, LDPE, and HDPE, the second demonstrates higher thermal stability due to its lower degree of branching (Ray and Cooney, 2018). However, both PE types have quite similar decomposition profiles (Kuźnia and Magdziarz, 2013). PP degradation is quite similar to that of LDPE (Park et al., 2012; Sørum et al., 2001), although PP has lower thermal stability (Chhabra et al., 2019; Ray and Cooney, 2018) due to the presence of tertiary carbon in the main chain (Beyler and Hirschler, 2002). PP degradation temperatures range from 340–400°C to 450–520°C with a Tp between 420 and 490°C during pyrolysis (Table 5). Similarly, PET degradation starts at 360–430°C and completes at 460–550°C with a Tp ranging from 420 to 465°C (Table 5). In contrast to polyolefins that leave almost zero residue at the end of the TGA experiment (<1% w/w), the residue from PET is nearly 15%. This high residue can be attributed to PET reinforcement with glass fibres, a plastic material widely used in many application areas to improve the strengthen of PET (Pedersen et al., 2016). The lower stability of PET compared to polyolefins is due to the poor stability of ester bonds in PET chains (Chen et al., 2015).
The PVC decomposition begins at considerably lower temperatures (200–300°C) (Williams and Williams, 1999) and completes at higher temperatures (500–580°C) compared to other polymers. The low thermal stability of PVC is attributed to the presence of chloride groups leading to the formation of highly unstable free radicals (Ray and Cooney, 2018). Table 5 shows that the degradation of PVC consists of two DTG peaks during pyrolysis: the first peak (270–380°C) is due to the release of hydrogen chloride (HCl) (dehydrochlorination stage); and the second (440–470°C) is due to the degradation of hydrocarbons (Beyler and Hirschler, 2002; Heikkinen et al., 2004). During the stage of dehydrochlorination, nearly 60% of mass loss is induced (Ma et al., 2002) which is almost equal with the Cl content of PVC. Some studies reported three DTG peaks for PVC with the first two peaks slightly overlapping (Yang et al., 2001; Yu et al., 2016).
However, the decomposition profile of pure polymers might not fully correspond to the profile of the related plastic items present in SRF/RDF due to cross-contamination leading to lower thermal stability (Mumbach et al., 2019; Silva et al., 2015). Silva et al. (2015) reported that the DTG thermogram, of pure PP differs from that of packaging PP waste, which had a wider range of decomposition temperature with two DTG shoulders instead. Similar results were also found for LDPE films extracted from mixed waste. In addition, Mumbach et al. (2019) compared the thermal behaviour of pure polymers, such as HDPE, LDPE, and PP with the respective recovered plastic polymers from the process of recycling paper scrap. Pure polyolefins completely degraded without leaving any residue (<1% w/w), but recovered polyolefins left considerable amounts of residue due to the presence of impurities and glue materials (Mumbach et al., 2019). The thermal stability of recovered PE was lower compared to pure PE due to impurities, whereas the stability of recovered PP was higher than that of pure PP (Mumbach et al., 2019). The higher thermal stability of recovered PP could be explained by the presence of biomass materials even at low concentrations. Părpăriţă et al. (2014) reported that the thermal reactivity of PP was increased in PP/biomass composites either due to the behaviour of PP to act as a physical barrier to the volatilisation of biomass or due to the reaction of radicals resulting from PP degradation, which otherwise could attack the PP chain, with O-containing structures from lignin degradation (Părpăriţă et al., 2014). Despite cross-contamination, the presence of additives in plastic items used to improve the properties of polymers, such as flame retardants, can considerably affect the thermal degradation of plastic materials (Sabet et al., 2019). For example, the addition of 2% w/w nanoglass flakes in PET increases the degree of crystallinity and, therefore, a shift of the degradation zone of PET towards higher temperatures (nearly 10°C) can be induced (Miri et al., 2019).
Thermal degradation of biopolymers
The decomposition mechanism of biopolymers involves four main steps: (a) cross-linking of biopolymer chains; (b) unzipping of biopolymer chain; (c) devolatilisation and char formation; and (d) further decomposition and repolymerisation (Beyler and Hirschler, 2002). More information on mechanisms and product formation involved during pyrolysis of biopolymers is given by Collard and Blin (2014). Hemicellulose is thermally decomposed first, followed by cellulose and lignin (Beyler and Hirschler, 2002). Xylan is the most commonly used substitute for hemicellulose especially in thermal analysis of WDM. Depending on the heating rate, cellulose decomposition typically starts at 250–300°C and is completed at 360–410°C, while the Tp fluctuates in a range of 320–390°C (Table 6). Similarly, xylan degradation begins at temperatures of 190–250°C and completes at 250–370°C, with a Tp ranging from 240 to 300°C, whereas lignin degradation occurs in a wider range starting from 100–200°C to 500–900°C (Table 6).
Table 6.
Characteristic points of thermogravimetry–derivative thermogravimetry (TG–DTG) curves of prevalent biopolymers present in solid recovered fuel/refuse derived-fuel including onset temperature (To), endset temperature (Te), number of DTG peak/shoulder, peak temperature (Tp), and residue under inert atmosphere as received reporting basis.
| Polymer | Heat rate (°C min−1) |
To
(°C)1 |
Te
(°C)2 |
Number of peaks | Tp (°C)3 | Residue (% w/w)4 | References | |
|---|---|---|---|---|---|---|---|---|
| Cellulose | Methyl cellulose (MC)5 | 5, 20, 40, 80 | 300–325 | 380–430 | 1 | 350–390 | 8 | Williams and Besler (1996) |
| MC5 | 5 | 250 | 350 | 1 | 318 | 18 | Meng et al. (2015b) | |
| MC5 | 5 | 327 | 407 | 1 | 337 | n. a. | Giudicianni et al. (2013) | |
| MC5 | 10 | 315 | 400 | 1 | 355 | 7 | Yang et al. (2007) | |
| MC5 | 10 | 310 | 390 | 1 | 360 | 12 | Wu et al. (2009) | |
| MC5 | 10 | n. a. | n. a. | 1 | 343 | 21 | Meng et al. (2015a); Zhou et al. (2015a) | |
| MC5 | 10 | 300 | 400 | 1 | 344 | 9 | Zhou et al. (2015a) | |
| MC5 | 10 | 300 | 400 | 1 | 335 | 10 | Zhang et al. (2016) | |
| MC5 | 10 | 300 | 400 | 1 | 344 | 9 | Long et al. (2016) | |
| 10 | 257 | 405 | 1 | 335 | 5 | Zhao et al. (2018) | ||
| MC5 | 10 | 300 | 400 | 1 | 335 | n. a. | Chen et al. (2019) | |
| MC5 | 20 | 300 | 400 | 1 | 350 | 8 | Lai et al. (2018) | |
| MC5 | 20 | 280 | 360 | 1 | 339 | 7 | Stefanidis et al. (2014) | |
| α-cellulose | 20 | 260 | 410 | 1 | 375 | 16 | Quan et al. (2016) | |
| Xylan | 3, 10, 20, 80 | 185–214 | 354–369 | 2 | 234–273, 267–304 | n. a. | Shen et al. (2010) | |
| 5, 20, 40, 80 | 250–290 | 320–400 | 1 | 285–325 | 20 | Williams and Besler (1996) | ||
| 5 | 227 | n. a. | 2 | 247, 333 | n. a. | Giudicianni et al. (2013) | ||
| 10 | 220 | 315 | 1 | 268 | 20 | Yang et al. (2007) | ||
| 10 | 200 | 340 | 2 | 245, 285 | n. a. | Chen et al. (2019) | ||
| 10 | 210 | 320 | 1 | 290 | 45 | Wu et al. (2009) | ||
| 10 | n. a. | n. a. | 2 | 250, 274 | 23 | Meng et al. (2015a, 2015b) | ||
| 10 | 200 | 350 | 2 | 245, 296 | 27 | Zhou et al. (2015a) | ||
| 10 | 200 | 350 | 2 | 240, 290 | 20 | Zhang et al. (2016) | ||
| 10 | 200 | 350 | 2 | 245, 296 | 27 | Long et al. (2016) | ||
| 20 | 210 | 370 | 2 | 210, 370 | 14 | Quan et al. (2016) | ||
| 20 | 200 | 320 | 2 | 246, 295 | 25 | Stefanidis et al. (2014) | ||
| 20 | 200 | 250 | n. a. | 283 | 27 | Wang et al. (2013) | ||
| 20 | 190 | 400 | 2 | 250, 300 | 20 | Lai et al. (2018) | ||
| Lignin | Klason | 5, 20, 40, 80 | 300 | 430–530 | 1 | 380–460 | 55 | Williams and Besler (1996) |
| Alkali | 5 | n. a. | n. a. | 1 | 363 | n. a. | Huang et al. (2011) | |
| Alkali | 10–40 | 194 | 900 | 1 | 361 | 47 | Wang et al. (2020) | |
| Alkali | 10 | 160 | 900 | n. a. | 46 | Yang et al. (2007) | ||
| Alkali | 10 | 200 | 550 | 1 | 352 | 65 | Wu et al. (2009) | |
| Alkali | 10 | 220 | 800 | 2 | 300, 680 | 45 | Zhang et al. (2016) | |
| Alkali | 10 | 200 | 600 | 1 | 340 | 54 | Quan et al. (2016) | |
| Alkali | 10 | 210 | 520 | 1 | 315 | 48 | Zhao et al. (2018) | |
| Dioxane lignin (DL)6 | 10 | 138 | 780 | 2 | 350, 763 | 43 | Chen et al. (2019) | |
| DL6 | 10 | n. a. | n. a. | 2 | 342, 764 | 40 | Meng et al. (2015a, 2015b) | |
| DL6 | 10 | 200 | 800 | 2 | 337, 768 | 46 | Zhou et al. (2015a) | |
| DL6 | 10 | 200 | 800 | 2 | 338, 768 | 46 | Long et al. (2016) | |
| Klason | 20 | 200 | 500 | 1 | 387 | n. a. | Cabeza et al. (2015) | |
| Alkali | 20 | 200 | 550 | 1 | 325 | 55 | Lai et al. (2018) | |
| Kraft | 20 | 105 | 800 | 1 | 350 | 34 | Ibrahim et al. (2011) | |
| Kraft | 20 | 140 | 600 | 1 | 380 | 41 | Stefanidis et al. (2014) | |
| Soda | 20 | 105 | 800 | 1 | 360 | 37 | Ibrahim et al. (2011) | |
| * | 200 | 500 | 2 | 280–390, approximately 420 |
Brebu and Vasile (2010) | |||
Notes: 1 onset temperature; 2 endset temperature; 3 peak temperature at each DTG shoulder; 4 residue, non-volatile matter left after degradation; 5 microcrystalline cellulose; 6 dealkaline lignin produced from the dealkalisation of papermaking black liquid; * derives from a review paper on the typical degradation of lignin during pyrolysis; and n. a., not available.
Among the biopolymers, lignin has the lowest rate of mass loss and cellulose has the highest (Chen et al., 2019; Giudicianni et al., 2013; Lai et al., 2018; Meng et al., 2015a; Quan et al., 2016; Stefanidis et al., 2014; Wu et al., 2009; Yang et al., 2007; Zhang et al., 2016; Zhao et al., 2018). Specifically, the DTG thermogram of cellulose is sharp and narrow due to its homogeneous unbranched structure (Stefanidis et al., 2014), whereas the DTG curve of xylan is slightly shorter (Giudicianni et al., 2013). Two DTG shoulders close to each other during xylan pyrolysis were reported (Table 6). This first peak might be attributed to the cleavage of bonds between xylan units and the second peak is due to the fragmentation of other depolymerised units (Quan et al., 2016; Shen et al., 2010). The DTG shoulder of lignin tends to have a long tail beyond 500°C due to the large array of chemical groups (Brebu and Vasile, 2010; Quan et al., 2016). Lignin contains hydroxyl and methoxy branched chains, which can easily break at low temperatures; but, also contains aromatic compounds, which have high thermal stability (Zheng et al., 2019). Lignin degradation usually consists of two DTG peaks, the first is due to cracking of hydroxyl groups in lateral chains (300–380°C) (Giudicianni et al., 2013) and the second is due to the decomposition of carbonaceous matters (>650°C) (Chen et al., 2019).
The highest percentage of mass loss occurs in cellulose degradation and the lowest in lignin degradation (Table 6). The mass loss of lignin can reach up to 70% at elevated temperatures (approximately 900°C) indicating its slow carbonisation (Yang et al., 2006) due to the presence of cross-linked aromatic molecules (Stefanidis et al., 2014). The higher residue content in xylan compared to cellulose is attributed to the different decomposition mechanisms for the variety of sugar units that compose xylan (Stefanidis et al., 2014).
The thermal behaviour of biopolymers seems to be more variable than that of fossil-based polymers due to their inherent heterogeneous chemical structure. For example, commercial cellulose widely used for experimentation (e.g. microcrystalline cellulose and filter paper cellulose) has higher thermal stability and narrower DTG curves compared to cellulose isolated from biomass materials (Galiwango et al., 2019; Zhang et al., 2018) due to different crystallinities (Ramiah, 1970; Zhang et al., 2018). Xylan is more thermally resistant compared to glucomannan due to its different chemical composition, whereas the thermal stability of lignin depends on the isolation method (Ramiah, 1970). In addition, technical lignin contains impurities that depend on the extraction process (e.g. kraft pulping) and biomass source, resulting in a variable thermal behaviour and especially charred residue (Sameni et al., 2014). Insights on the thermal behaviour of native lignin are usually obtained by the thermal degradation of biomass materials (e.g. wood), as its structure changes during isolation (Casillas et al., 2018). This is the main reason that Table 6 includes information only on technical lignin.
Interaction effects between waste materials
Interaction effects between two or more materials occur when the total effect produced by the blend of these materials is higher (synergy) or lower (antagonism) than the sum of the individual materials (Farrow et al., 2013). It has been reported that the interaction effects between waste components are negligible during TGA experiments (Cozzani et al., 1995; Danias and Liodakis, 2018; Heikkinen et al., 2004; Skodras et al., 2009). In that case, the thermal behaviour of a mixture can be described using the weighed sum method (WSM). According to the WSM ‘the thermal degradation curve of a mixture is equal to the sum of contributions of the corresponding individual components’ (Heikkinen et al., 2004):
| (1) |
where: Ymix is the approximated mass loss rate of the mixture, xi is the proportion of i component in the mixture, yi is the mass loss rate of i component and n is the number of components.
The WSM has been reported as a useful tool for the quantification of waste composition (Cozzani et al., 1995, 1997) or for the estimation of waste devolatilisation based on the thermograms of waste components (Fritsky et al., 1994; Heikkinen et al., 2004; Lin et al., 1999). Despite the above claims, evidence of interactions among waste components (items, materials, and chemical compounds) exists. Grammelis et al. (2009) reported that the decomposition rate of RDF is higher than those of individual waste components. Interaction between PVC and cellulose in the form of cotton or tissue paper was noticed by many researchers (Grammelis et al., 2009; Ma et al., 2019; Matsuzawa et al., 2001; Sørum and Task, 2001; Yu et al., 2016; Zhou et al., 2015b). Specifically, the released HCl from PVC reacts with cellulose increasing biomass reactivity.
Interactions among biomass components (Akubo et al., 2019; Cabeza et al., 2015; Hosoya et al., 2007; Jaffar et al., 2020) and between biomass and fossil-based plastics (Özsin et al., 2019; Wang et al., 2020) were identified through kinetic and compositional analysis of pyrolysis products using TGA–EGA. Zhao et al. (2018) reported that the presence of lignin reduced the pyrolysis rate of cellulose, whereas the presence of cellulose and hemicellulose promote the production of more phenolic substances during lignin pyrolysis. In addition, Long et al. (2016) reported that the formation of char from xylan at low temperature induced the inhibition of heat and mass transfer processes of cellulose. In contrast, other researchers found the interaction among biomass components as insignificant (Cao et al., 2019; Raveendran et al., 1996).
Interactions among plastic polymers were also identified. For example, Williams and Williams (1999) reported that plastic mixtures had a higher yield of pyrolysis products compared to the yields of the single plastics. Singh et al. (2019) found that the thermal degradation of a plastic mixture (HDPE, PP, PET, and polystyrene) started earlier and the rate of mass loss was considerably lower than the degradation of individual polymers. So far, there is no clear evidence about whether considerable interaction effects occur between waste materials and therefore the use of the WSM might be controversial for compositional analysis of WDM through TGA.
Discussion
The present study describes the thermal behaviour of SRF/RDF during TGA experiments as a complex mixture consisting of several components at multiple levels including an assembly of prevalent waste items, materials, and chemical compounds. This approach offers valuable insights into the presence of overlapping effects among waste components and therefore a better understanding of thermal behaviour and properties of a complex mixture. However, waste-derived samples constitue a mixture of numerous components and the inclusion of TGA thermograms of a wider variety of waste items/materials would give a better estimation of SRF/RDF thermal behaviour (e.g. rubber, leather, other plastics, fines, and inert materials).
Despite that, the results revealed some neglected aspects that should be considered in the future: (a) the content of prevalent polymers in SRF/RDF is affected by different factors across the supply chain (type of feedstock, process efficiency, and end user requirements; Sarc et al., 2019) which are not well known yet; (b) despite the great potential of TGA regarding waste composition identification, the importance of thermogravimetry for assuring quality of SRF/RDF, is far from standardised or sufficiently developed in that capacity; and (c) minimum attention has been paid to the role of sample preparation and sampling process (sub-sampling plan), two critical factors for the acquisition of representative analytical results, in TGA compositional analysis of WDM.
So far, few research efforts related to the compositional analysis of SRF/RDF have been conducted by using the TGA analytical technique along with the WSM (Cozzani et al., 1995; Grammelis et al., 2009; Heikkinen et al., 2004; Skodras et al., 2009). However, this methodological approach was abandoned since recent research evidences the existence of interaction effects between waste components (e.g. PVC with cellulose; Ma et al., 2019; Yu et al., 2016; Zhou et al., 2015b). Despite these claims, the selection of the level (item, materials or chemical compounds) at which the waste sample can be sufficiently described as a mixture of several components including the identification of their thermal profiles makes the use of TGA for compositional analysis of waste samples quite challenging. This difficulty has led to another research direction, the description of thermal behaviour of SRF/RDF performing kinetic analysis with the use of TGA (Azam et al., 2019; Bosmans et al., 2014; Grammelis et al., 2009), often combined with EGA (Conesa and Rey, 2015; Singh et al., 2012). However, kinetics models are affected by the sample composition and experimental TGA conditions which are both variable (Conesa and Rey, 2015) and therefore they might not be able to describe simultaneous reactions during the decomposition process (Masnadi et al., 2014).
Current research trends in solid waste management have shown that machine learning (ML), application of artificial intelligence aiming to automate analytical model building (Pezzè and Zhang, 2014), has been increasingly used for waste modelling. Specifically, ML algorithms, such as artificial neural network, support vector machine, and regression and decision trees, were developed to build models for the prediction of the thermal behaviour of solid waste (Çepelioğullar et al., 2016; Pandey et al., 2016), the prediction of regional waste generation (Abbasi and El Hanandeh, 2016; Johnson et al., 2017; Kannangara et al., 2018; Kontokosta et al., 2018; Soni et al., 2019), and the prognostication of solid waste properties such as HHV (Rostami and Baghban, 2018).
A novel approach consisting of advanced thermal analytical techniques (e.g. TGA–EGA), statistically designed experiments (design of experiments) able to simulate the composition and thermal behaviour of SRF/RDF (e.g. mixture design; Cornell, 2011) followed by ML modelling could create robust tools (Salmaso et al., 2019) of quality assurance and control for finely shredded (fluff/pellet) SRF/RDF (e.g. <40 mm) that is hard/impossible to identify otherwise (e.g. by manual sorting or TGA on its own). However, results showed that simulated waste samples have different thermal behaviour to genuine waste samples. In order to overcome the barrier, the validation and verification of waste modelling needs to be conducted by analysisng genuine waste samples.
Conclusion
Here we provide a comprehensive review on the use of TGA as a tool for compositional analysis of WDM, focusing on SRF/RDF produced from MSW. For TGA-based compositional analysis of complex and inherent heterogeneous WDM, the investigation of the TGA thermogram of SRF/RDF as a mixture of components is a recommended approach. Specifically, a complex mixture of components at multiple levels including an assembly of waste items, materials, and chemical compounds is able to reveal overlapping degradation areas. We conclude that:
• (1) In SRF/RDF, the most prevalent waste items/materials (paper/cardboard, plastics, textiles and wood) are arbitrarily and loosely defined as they constitute sub-mixtures of a variety of components. The wood fraction presented a relatively uniform thermal behaviour, whereas paper/cardboard and textiles had a more variable decomposition profile due to the variety of materials and manufacturing processes applied in the paper and textile industries. However, the thermal behaviour of plastics was mainly investigated at the level of chemical compounds (polymers) indicating the importance to determine the thermal behaviour of SRF/RDF at this level.
• (2) The dominant polymers in SRF/RDF are biopolymers including cellulose, hemicellulose, and lignin (biomass) which can be found in biomass waste item categories (paper/cardboard, wood, non-wood biomass for papermaking, and natural fibres) and fossil-based plastic polymers including PE, PP, PET, and PVC (plastics). Polyolefins and PET mainly represent plastic packaging and synthetic fibres, respectively, whereas PVC represents the Cl content in simulated SRF/RDF samples. Xylan was found to be the most commonly used substitute for hemicellulose in thermal analysis of WDM.
• (3) The thermal stability of polymers depends on their macromolecular structure. Biopolymers present a more variable thermal behaviour than plastic polymers due to the variety of natural sources (e.g. wood species) and/or the extraction method (e.g. type of pulping). Lignin is the most heterogeneous biopolymer, whereas cellulose is the most homogeneous. However, the presence of additives in post-consumer plastic materials can considerably change the properties and consequently the thermal stability of plastic materials in SRF/RDF.
• (3) Although TGA is one of the most widespread thermal analytical techniques, it is far from a standardised technique regarding assuring quality of SRF/RDF. The majority of TGA experiments of WDM were conducted under moderate conditions indicating the difficulty of researchers to deal with both complex SRF/RDF composition (heating rate ⩽10°C and inert atmosphere) and the maintenance of uniform thermal conditions throughout the TGA experiment (sample mass ⩽10 mg). Therefore, inert atmosphere, low heating rate (⩽10°C), sufficient temperature range for the material degradation (maximum temperature ⩾750°C), and a representative amount of test portion depending on sample preparation are recommended for TGA compositional analysis of SRF/RDF. However, many studies omitted to report the sample mass indicating that no special attention is paid to this condition and therefore the inherent heterogeneity of solid waste might be underestimated. In addition, the inconsistency of units for the rate of weight loss in the literature did not allow to obtain comparable insights on the variability of thermal reactivity of commercial SRF/RDF samples.
• (4) Differences between the thermal behaviour of synthetic and genuine waste samples exist due to cross-contamination, the potential presence of interaction effects among waste components, and the presence of other unknown substances at low concentrations (e.g. extractives, additives, and adhesives). Despite the existence of interaction effects among waste components (especially between cellulose and PVC), this research aspect is not well known yet, which presents contradictory claims.
• (5) The TG–DTG thermogram of SRF/RDF typically consists of two peaks arising from the degradation of biomass and plastic materials in a temperature range of 200–600°C. Overlapping effects can occur in the following combinations: cellulose – hemicellulose and PE – PP and PET – polyolefins, while PVC and lignin overlap with all prevalent polymers. Fossil-based plastic polymers have quite similar decomposition profiles, except for PVC. The cellulose thermogram is similar to hemicellulose (xylan), whereas lignin has a completely differentiated thermal behaviour.
The main limitations of TGA use for compositional analysis are the presence of considerable overlapping degradation areas among the individual waste components, the uncertainty on the existence of interaction effects, and the difficulty to obtain representative analytical results. However, simulation of TGA thermograms of SRF/RDF by statistically designed experiments under a well-established sub-sampling plan along with applications of artificial intelligence can lead to TGA becoming a strong tool for composition identification of WDM.
Our critical analysis can be used to guide choices for TGA-based compositional analysis of WDM, and it offers a basis for the development of quality assurance and control tools combining advanced thermo-analytical techniques (TGA–EGA) with advanced statistical data analytics.
Supplemental Material
Supplemental material, WMR941085_supp_mat for Characterisation and composition identification of waste-derived fuels obtained from municipal solid waste using thermogravimetry: A review by Spyridoula Gerassimidou, Costas A Velis, Paul T Williams and Dimitrios Komilis in Waste Management & Research
Acknowledgments
We are grateful to the University of Leeds for the technical support on this work.
Footnotes
Declaration of conflicting interests: The authors declared no potential conflicts of interest with respect to the research, authorship, and/or publication of this article.
Funding: The authors received no financial support for the research, authorship, and/or publication of this article.
ORCID iD: Costas A. Velis  https://orcid.org/0000-0002-1906-726X
Supplemental material: Supplemental material for this article is available online.
References
- Abbasi M, El Hanandeh A. (2016) Forecasting municipal solid waste generation using artificial intelligence modelling approaches. Waste Management 56: 13–22. [DOI] [PubMed] [Google Scholar]
- Abdel-Shafy HI, Mansour MSM. (2018) Solid waste issue: Sources, composition, disposal, recycling, and valorization. Egyptian Journal of Petroleum 27: 1275–1290. [Google Scholar]
- Ahvazi B, Cloutier E, Wojciechowicz O, et al. (2016) Lignin profiling: A guide for selecting appropriate lignins as precursors in biomaterials development. ACS Sustainable Chemistry Engineering 4: 5090–5105. [Google Scholar]
- Akdağ AS, Atımtay A, Sanin F. (2016) Comparison of fuel value and combustion characteristics of two different RDF samples. Waste Management 47: 217–224. [DOI] [PubMed] [Google Scholar]
- Akubo K, Nahil MA, Williams PT. (2019) Pyrolysis-catalytic steam reforming of agricultural biomass wastes and biomass components for production of hydrogen/syngas. Journal of the Energy Institute 92: 1987–1996. [Google Scholar]
- Azam M, Jahromy SS, Raza W, et al. (2019) Comparison of the combustion characteristics and kinetic study of coal, municipal solid waste, and refuse-derived fuel: Model-fitting methods. Energy Science Engineering 7: 2646–2657. [Google Scholar]
- Basch A, Lewin M. (1973) The influence of fine structure on the pyrolysis of cellulose. I. Vacuum pyrolysis. Journal of Polymer Science: Polymer Chemistry Edition 11: 3071–3093. [Google Scholar]
- Beckmann M, Pohl M, Bernhardt D, et al. (2012) Criteria for solid recovered fuels as a substitute for fossil fuels—A review. Waste Management & Research 30: 354–369. [DOI] [PubMed] [Google Scholar]
- Béguin P, Aubert J-P. (1994) The biological degradation of cellulose. FEMS Microbiology Reviews 13: 25–58. [DOI] [PubMed] [Google Scholar]
- Berlin A, Balakshin M. (2014) Industrial lignins: Analysis, properties, and applications. In: Huang J, Fu S, Gan L. (eds) Bioenergy Research: Advances and Applications. Amsterdam: Elsevier, 315–336. [Google Scholar]
- Beyler CL, Hirschler MM. (2002) Thermal decomposition of polymers. SFPE Handbook of Fire Protection Engineering 2: 111–131. [Google Scholar]
- Bodzay B, Bánhegyi G. (2016) Polymer waste: Controlled breakdown or recycling? International Journal of Design Sciences Technology 22: 109–138. [Google Scholar]
- Bosmans A, De Dobbelaere C, Helsen L. (2014) Pyrolysis characteristics of excavated waste material processed into refuse derived fuel. Fuel 122: 198–205. [Google Scholar]
- Bottom R. (2008) Thermogravimetric analysis. In: Gabbott P. (ed.) Principles Applications of Thermal Analysis. Hoboken, NY: Blackwell Publishing, 87–118. [Google Scholar]
- Boumanchar I, Chhiti Y, Alaoui FEM’h, et al. (2017) Effect of materials mixture on the higher heating value: Case of biomass, biochar and municipal solid waste. Waste Management 61: 78–86. [DOI] [PubMed] [Google Scholar]
- Brebu M, Vasile C. (2010) Thermal degradation of lignin – A review. Cellulose Chemistry and Technology 44: 353–363. [Google Scholar]
- Brunner PH, Morf L, Rechberger H. (2004) VI.3 Thermal waste treatment – A necessary element for sustainable waste management. In: Twardowska I HEA. (ed.) Solid Waste: Assessment, Monitoring and Remediation. Amsterdam: Elsevier, 783–806. [Google Scholar]
- British Standard Institution 15359 (2011) Solid recovered fuels. Specifications and classes. British Standard Institution. Available at: https://shop.bsigroup.com/ProductDetail?pid=000000000030202007 (accessed 10 January 2020).
- Cabeza A, Sobrón F, Yedro F, et al. (2015) Autocatalytic kinetic model for thermogravimetric analysis and composition estimation of biomass and polymeric fractions. Fuel 148: 212–225. [Google Scholar]
- Cao W, Li J, Martí-Rosselló T, et al. (2019) Experimental study on the ignition characteristics of cellulose, hemicellulose, lignin and their mixtures. Journal of the Energy Institute 92: 1303–1312. [Google Scholar]
- Casillas RR, Rodríguez KFB, Cruz-Estrada RH, et al. (2018) Isolation and characterization of cellulose nanocrystals created from recycled laser printed paper. BioResources 13: 7404–7429. [Google Scholar]
- Casu S, Galvagno S, Calabrese A, et al. (2006) Steam gasification of Refuse-Derived Fuel pyrolysis: Influence of process temperature on yield and product composition. Journal of Thermal Analysis and Calorimetry 80: 477–482. [Google Scholar]
- Çepelioğullar Ö, Mutlu İ, Yaman S, et al. (2016) A study to predict pyrolytic behaviors of refuse-derived fuel (RDF): Artificial neural network application. Journal of Analytical Applied Pyrolysis 122: 84–94. [Google Scholar]
- Chae J, Zhang M, Yang S, et al. (2019) A study on the secondary air injection method of the combustor considering characteristics of solid refuse fuels. Waste and Biomass Valorization 1–16. Epub before print 30 July 2019. DOI: 10.1007/s12649-019-00769-9. [DOI] [Google Scholar]
- Chen S, Meng A, Long Y, et al. (2015) TGA pyrolysis and gasification of combustible municipal solid waste. Journal of the Energy Institute 88: 332–343. [Google Scholar]
- Chen W-H, Wang C-W, Ong HC, et al. (2019) Torrefaction, pyrolysis and two-stage thermodegradation of hemicellulose, cellulose and lignin. Fuel 258: 116168. [Google Scholar]
- Chen X, Xie J, Mei S, et al. (2018) NOx and SO2 emissions during co-combustion of RDF and anthracite in the environment of precalciner. Energies 11: 337. [Google Scholar]
- Cheng Z, Chen H-l, Zhang Y, et al. (2007) An application of thermal analysis to household waste. Journal of ASTM International 4: 1–10. [Google Scholar]
- Cheremisinoff NP. (1996) Thermal analysis. In: Cheremisinoff NP. (ed.) Polymer Characterization: Laboratory Techniques and Analysis. Westwood, NJ: Noyes Publications, 17–24. [Google Scholar]
- Chhabra V, Bambery K, Bhattacharya S, et al. (2019) Thermal and in situ infrared analysis to characterise the slow pyrolysis of mixed municipal solid waste (MSW) and its components. Renewable Energy 148: 388–401. [Google Scholar]
- Chiemchaisri C, Charnnok B, Visvanathan C. (2010) Recovery of plastic wastes from dumpsite as refuse-derived fuel and its utilization in small gasification system. Bioresource Technology 101: 1522–1527. [DOI] [PubMed] [Google Scholar]
- Cimpan C, Maul A, Wenzel H, et al. (2016) Techno-economic assessment of central sorting at material recovery facilities: –The case of lightweight packaging waste. Journal of Cleaner Production 112: 4387–4397. [Google Scholar]
- Collard F-X, Blin J. (2014) A review on pyrolysis of biomass constituents: Mechanisms and composition of the products obtained from the conversion of cellulose, hemicelluloses and lignin. Renewable and Sustainable Energy Reviews 38: 594–608. [Google Scholar]
- Conesa JA, Rey L. (2015) Thermogravimetric and kinetic analysis of the decomposition of solid recovered fuel from municipal solid waste. Journal of Thermal Analysis and Calorimetry 120: 1233–1240. [Google Scholar]
- Cornell JA. (2011) Experiments with Mixtures: Designs, Models, and the Analysis of Mixture Data. New York: John Wiley & Sons. [Google Scholar]
- Cozzani V, Lucchesi A, Stoppato G, et al. (1997) A new method to determine the composition of biomass by thermogravimetric analysis. The Canadian Journal of Chemical Engineering 75: 127–133. [Google Scholar]
- Cozzani V, Petarca L, Tognotti L. (1995) Devolatilization and pyrolysis of refuse derived fuels: Characterization and kinetic modelling by a thermogravimetric and calorimetric approach. Fuel 74: 903–912. [Google Scholar]
- Cuperus G, Van Dijk E, De Boer R. (2005) Pre-normative research on SRF. TAUW; Available at: http://erfo.info/fileadmin/user_upload/erfo/documents/standardisation/Final_report_Prenormative_research_on_solid_recovered_fuel.pdf (accessed 8 January 2018). [Google Scholar]
- Dalai AK, Batta N, Eswaramoorthi I, et al. (2009) Gasification of refuse derived fuel in a fixed bed reactor for syngas production. Waste Management 29: 252–258. [DOI] [PubMed] [Google Scholar]
- Danias P, Liodakis S. (2018) Characterization of refuse derived fuel using thermogravimetric analysis and chemometric techniques. Journal of Analytical Chemistry 73: 351–357. [Google Scholar]
- Das P, Tiwari P. (2019) Thermal degradation study of waste polyethylene terephthalate (PET) under inert and oxidative environments. Thermochimica Acta 679: 178340. [Google Scholar]
- Datwyler (2020) Rubber materials and elastomer compound information. Available at: http://usa.datwyler.com/materials.html#sbr (accessed 22 January 2020).
- Department for Environment, Food and Rural Affairs (2014) Refuse derived fuel market in England – Summary of responses to the call for evidence December 2014. Department for Environment Food and Rural Affairs; Available at: https://assets.publishing.service.gov.uk/government/uploads/system/uploads/attachment_data/file/381621/rdf-market-sum-response-201412.pdf (accessed 16 March 2020). [Google Scholar]
- Dence C, Lin S. (eds) (1992) Methods in Lignin Chemistry. Berlin: Springer. [Google Scholar]
- Di Maria F, Micale C, Sordi A, et al. (2013) Urban mining: Quality and quantity of recyclable and recoverable material mechanically and physically extractable from residual waste. Waste Management 33: 2594–2599. [DOI] [PubMed] [Google Scholar]
- DOE (2019) Waste-to-energy from municipal solid wastes. Available at: https://www.energy.gov/sites/prod/files/2019/08/f66/BETO–Waste-to-Energy-Report-August–2019.pdf (accessed 8 July 2020).
- Dufresne A. (2012) Cellulose and potential reinforcement. In: Dufresne A. (ed.) Nanocellulose: From Nature to High Performance Tailored Materials. Berlin: Walter de Gruyter GmbH, 1–42. [Google Scholar]
- Edo M, Budarin V, Aracil I, et al. (2016) The combined effect of plastics and food waste accelerates the thermal decomposition of refuse-derived fuels and fuel blends. Fuel 180: 424–432. [Google Scholar]
- Efika EC, Onwudili JA, Williams PT. (2015) Products from the high temperature pyrolysis of RDF at slow and rapid heating rates. Journal of Analytical Applied Pyrolysis 112: 14–22. [Google Scholar]
- El Mansouri N-E, Salvadó J. (2007) Analytical methods for determining functional groups in various technical lignins. Industrial Crops and Products 26: 116–124. [Google Scholar]
- Erickson KL. (2007) Thermal decomposition of polymers in nitrogen and in air. Sandia National Laboratory. Available at: https://www.osti.gov/servlets/purl/1147465 (accessed 8 July 2020).
- Esbensen KH, Velis C. (2016) Transition to circular economy requires reliable statistical quantification and control of uncertainty and variability in waste. Waste Management & Research 34: 1197–1200. [DOI] [PubMed] [Google Scholar]
- European Commission (2017) Communication from the Commission to the European Parliament, the Council, the European Economic and Social Committee and the Committee of the Regions – The role of waste-to-energy in the circular economy. Available at: https://eur-lex.europa.eu/legal-content/EN/TXT/PDF/?uri=CELEX:52017DC0034&from=en (accessed 16 March 2020).
- European Commission (2018) Communication from the Commission to the European Parliament, the Council, the European Economic and Social Committee and the Committee of the Regions – A European Strategy for Plastics in a Circular Economy. Available at: https://eur-lex.europa.eu/legal-content/EN/TXT/HTML/?uri=CELEX:52018DC0028&from=EN (accessed 16 March 2020).
- Farhat W, Venditti R, Quick A, et al. (2017) Hemicellulose extraction and characterization for applications in paper coatings and adhesives. Industrial Crops and Products 107: 370–377. [Google Scholar]
- Farrow TS, Sun C, Snape CE. (2013) Impact of biomass char on coal char burn-out under air and oxy-fuel conditions. Fuel 114: 128–134. [Google Scholar]
- Fernández JM, Plaza C, Polo A, et al. (2012) Use of thermal analysis techniques (TG–DSC) for the characterization of diverse organic municipal waste streams to predict biological stability prior to land application. Waste Management 32: 158–164. [DOI] [PubMed] [Google Scholar]
- Ferrari R. (2015) Writing narrative style literature reviews. Medical Writing 24: 230–235. [Google Scholar]
- Flamme S, Ceiping J. (2014) Quality assurance of solid recovered fuels (SRF). ZKG International 67: 54–57. [Google Scholar]
- Forrest M. (2016) Recycling of polyethylene terephthalate. In: Forrest M. (ed.) Separation and Sorting Technologies. Shropshire, UK: Smithers Rapra, 75–97. [Google Scholar]
- Francuskiewicz F. (1994) The Size of Polymer Molecules—Mean Values and Distributions of the Molecular Weight. Polymer Fractionation. New York: Springer, 6–9. [Google Scholar]
- Fritsky KJ, Miller DL, Cernansky NP. (1994) Methodology for modeling the devolatilization of refuse-derived fuel from thermogravimetric analysis of municipal solid waste components. Air Waste 44: 1116–1123. [Google Scholar]
- Gabbott P. (2008) Principles and Applications of Thermal Analysis. New York, NY: John Wiley & Sons. [Google Scholar]
- Galiwango E, Rahman NSA, Al-Marzouqi AH, et al. (2019) Isolation and characterization of cellulose and α-cellulose from date palm biomass waste. Heliyon 5: e02937. [DOI] [PMC free article] [PubMed] [Google Scholar]
- Gani A, Naruse I. (2007) Effect of cellulose and lignin content on pyrolysis and combustion characteristics for several types of biomass. Renewable Energy 32: 649–661. [Google Scholar]
- Garcia R, Pizarro C, Lavin AG, et al. (2013) Biomass proximate analysis using thermogravimetry. Bioresource Technology 139: 1–4. [DOI] [PubMed] [Google Scholar]
- Gatenholm P, Tenkanen M. (2003) Hemicelluloses: Science and Technology. Washington, DC: American Chemical Society. [Google Scholar]
- Gellerstedt G, Henriksson G. (2008) Lignins: Major sources, structure and properties. In: Belgacem NM, Gandin A. (eds) Monomers, Polymers and Composites from Renewable Resources. Amsterdam: Elsevier, 201–224. [Google Scholar]
- Gerassimidou S, Velis AC, Williams TP, et al. (2020. a) Chlorine in waste-derived solid recovered fuel (SRF), co-combusted in cement kilns: A systematic review of sources, reactions, fate and implications. Critical Reviews in Environmental Science and Technology 9: 1–47. [Google Scholar]
- Gerassimidou S, Velis CA, Bourne RA, et al. (2020. b) Statistical quantification of sub-sampling representativeness and uncertainty for waste-derived solid recovered fuel (SRF): Comparison with theory of sampling (ToS). Journal of Hazardous Materials 388: 122013. [DOI] [PubMed] [Google Scholar]
- Gerlach R, Nocerino J. (2003) Guidance for obtaining representative laboratory analytical subsamples from particulate laboratory samples. United States Environmental Protection Agency; Available at: https://nepis.epa.gov/Exe/ZyPDF.cgi/2000GTWM.PDF?Dockey=2000GTWM.PDF (accessed 22 March 2020). [Google Scholar]
- Geyer R, Jambeck JR, Law KL. (2017) Production, use, and fate of all plastics ever made. Science Advances 3: e1700782. [DOI] [PMC free article] [PubMed] [Google Scholar]
- Giudicianni P, Cardone G, Ragucci R. (2013) Cellulose, hemicellulose and lignin slow steam pyrolysis: Thermal decomposition of biomass components mixtures. Journal of Analytical Applied Pyrolysis 100: 213–222. [Google Scholar]
- Gomes J, Batra J, Chopda VR, et al. (2018) Chapter 25 - Monitoring and control of bioethanol production from lignocellulosic biomass. In: Bhaskar T, Pandey A, Mohan S, et al. (eds) Waste Biorefinery: Potential and Perspectives. Amsterdam: Elsevier, 727–749. [Google Scholar]
- Gosselink R, Abächerli A, Semke H, et al. (2004) Analytical protocols for characterisation of sulphur-free lignin. Industrial Crops and Products 19: 271–281. [Google Scholar]
- Grammelis P, Basinas P, Malliopoulou A, et al. (2009) Pyrolysis kinetics and combustion characteristics of waste recovered fuels. Fuel 88: 195–205. [Google Scholar]
- Grønli MG, Várhegyi G, Di Blasi C. (2002) Thermogravimetric analysis and devolatilization kinetics of wood. Industrial & Engineering Chemistry Research 41: 4201–4208. [Google Scholar]
- Hahladakis JN, Velis CA, Weber R, et al. (2018) An overview of chemical additives present in plastics: Migration, release, fate and environmental impact during their use, disposal and recycling. Journal of Hazardous Materials 344: 179–199. [DOI] [PubMed] [Google Scholar]
- Haines PJ. (ed.) (2002) Principles of Thermal Analysis and Calorimetry. Cambridge: Royal Society of Chemistry. [Google Scholar]
- Hallac BB, Ragauskas AJ. (2011) Analyzing cellulose degree of polymerization and its relevancy to cellulosic ethanol. Biofuels, Bioproducts and Biorefining 5: 215–225. [Google Scholar]
- Hannah R, Max R. (2019) Plastic pollution. Our world in data. Available at: https://ourworldindata.org/plastic-pollution (accessed 9 January 2020).
- He C, Giannis A, Wang J-Y. (2013) Conversion of sewage sludge to clean solid fuel using hydrothermal carbonization: Hydrochar fuel characteristics and combustion behavior. Applied Energy 111: 257–266. [Google Scholar]
- Heal G. (2002) Thermogravimetry and derivative thermogravimetry. In: Haines PJ. (ed.) Principles of Thermal Analysis Calorimetry. Cambridge: Royal Society of Chemistry, 10–53. [Google Scholar]
- Heikkinen J, Hordijk Jd, de Jong W, et al. (2004) Thermogravimetry as a tool to classify waste components to be used for energy generation. Journal of Analytical Applied Pyrolysis 71: 883–900. [Google Scholar]
- Heinze T, Liebert T. (2012) Celluloses and polyoses/hemicelluloses. Reference Module in Materials Science and Materials Engineering 10: 83–152. [Google Scholar]
- Hilber T, Martensen M, Maier J, et al. (2007) A method to characterise the volatile release of solid recovered fuels (SRF). Fuel 86: 303–308. [Google Scholar]
- Hinkel M, Blume S, Hinchliffe D, et al. (2019) Guidelines on pre- and co-processing of waste in cement production. Gesellschaft Fur Internationale Zusammenarbeit GmbH (GIZ). Available at: https://www.geocycle.com/sites/geocycle/files/atoms/files/co-processing_supporting_document_giz-holcim_guidelines_0.pdf (accessed 17 March 2020).
- Hosoya T, Kawamoto H, Saka S. (2007) Cellulose–hemicellulose and cellulose–lignin interactions in wood pyrolysis at gasification temperature. Journal of Analytical Applied Pyrolysis 80: 118–125. [Google Scholar]
- Huang Y, Kuan W, Chiueh P, et al. (2011) A sequential method to analyze the kinetics of biomass pyrolysis. Bioresource Technology 102: 9241–9246. [DOI] [PubMed] [Google Scholar]
- Hubbe MA, Venditti RA, Rojas OJ. (2007) What happens to cellulosic fibers during papermaking and recycling? A review. BioResources 2: 739–788. [Google Scholar]
- Hujuri U, Ghoshal AK, Gumma S. (2008) Modeling pyrolysis kinetics of plastic mixtures. Polymer Degradation and Stability 93: 1832–1837. [Google Scholar]
- Iacovidou E, Hahladakis J, Deans I, et al. (2018) Technical properties of biomass and solid recovered fuel (SRF) co-fired with coal: Impact on multi-dimensional resource recovery value. Waste Management 73: 535–545. [DOI] [PubMed] [Google Scholar]
- Iacovidou E, Velis CA, Purnell P, et al. (2017) Metrics for optimising the multi-dimensional value of resources recovered from waste in a circular economy: A critical review. Journal of Cleaner Production 166: 910–938. [Google Scholar]
- Ibrahim MNM, Zakaria N, Sipaut CS, et al. (2011) Chemical and thermal properties of lignins from oil palm biomass as a substitute for phenol in a phenol formaldehyde resin production. Carbohydrate Polymers 86: 112–119. [Google Scholar]
- Jaffar MM, Nahil MA, Williams PT. (2020) Pyrolysis–catalytic hydrogenation of cellulose–hemicellulose–lignin and biomass agricultural wastes for synthetic natural gas production. Journal of Analytical Applied Pyrolysis 145: 104753. [Google Scholar]
- Jia C, Chen C, Kuang Y, et al. (2018) From wood to textiles: Top-down assembly of aligned cellulose nanofibers. Advanced Materials 30: 1801347. [DOI] [PubMed] [Google Scholar]
- Johnson NE, Ianiuk O, Cazap D, et al. (2017) Patterns of waste generation: A gradient boosting model for short-term waste prediction in New York City. Waste Management 62: 3–11. [DOI] [PubMed] [Google Scholar]
- Junghare H, Hamjade M, Patil C, et al. (2017) A Review on cryogenic grinding. International Journal of Current Engineering and Technology 7: 420–423. [Google Scholar]
- Kannangara M, Dua R, Ahmadi L, et al. (2018) Modeling and prediction of regional municipal solid waste generation and diversion in Canada using machine learning approaches. Waste Management 74: 3–15. [DOI] [PubMed] [Google Scholar]
- Kljusuric JG, Čačić J, Misir A, et al. (2015) Geographical region as a factor influencing consumers’ perception of functional food – Case of Croatia. British Food Journal 117: 1017–1031. [Google Scholar]
- Kontokosta CE, Hong B, Johnson NE, et al. (2018) Using machine learning and small area estimation to predict building-level municipal solid waste generation in cities. Computers, Environment and Urban Systems 70: 151–162. [Google Scholar]
- Korkmaz A, Yanik J, Brebu M, et al. (2009) Pyrolysis of the tetra pak. Waste Management 29: 2836–2841. [DOI] [PubMed] [Google Scholar]
- Kuźnia M, Magdziarz A. (2013) Research on thermal decomposition of waste PE/PP. Chemical Process Engineering 34: 165–174. [Google Scholar]
- Lai Z, Li S, Zhang Y, et al. (2018) Influence of urea formaldehyde resin on the pyrolysis of biomass components: Cellulose, hemicellulose, and lignin. BioResources 13: 2218–2232. [Google Scholar]
- Lavanya D, Kulkarni P, Dixit M, et al. (2011) Sources of cellulose and their applications—A review. International Journal of Drug Formulation and Research 2: 19–38. [Google Scholar]
- Li T, Takkellapati S. (2018) The current and emerging sources of technical lignins and their applications. Biofuels, Bioproducts and Biorefining 12: 756–787. [DOI] [PMC free article] [PubMed] [Google Scholar]
- Lin K-S, Wang HP, Liu S-H, et al. (1999) Pyrolysis kinetics of refuse-derived fuel. Fuel Processing Technology 60: 103–110. [Google Scholar]
- Liu Z, Wang H, Hui L. (2018) Pulping and papermaking of non-wood fibers. In: Salim NK. (ed.) Pulp and Paper Processing. London: IntechOpen, 3–31. [Google Scholar]
- Long Y, Meng A, Chen S, et al. (2017) Pyrolysis and combustion of typical wastes in a newly designed macro thermogravimetric analyzer: Characteristics and simulation by model components. Energy & Fuels 31: 7582–7590. [Google Scholar]
- Long Y, Zhou H, Meng A, et al. (2016) Interactions among biomass components during co-pyrolysis in (macro) thermogravimetric analyzers. Korean Journal of Chemical Engineering 33: 2638–2643. [Google Scholar]
- Lu Y, Lu Y-C, Hu H-Q, et al. (2017) Structural characterization of lignin and its degradation products with spectroscopic methods. Journal of Spectroscopy 2017: 1–15. Available at: https://www.hindawi.com/journals/jspec/2017/8951658/ (accessed 8 July 2020). [Google Scholar]
- Luo J, Li Q, Meng A, et al. (2018) Combustion characteristics of typical model components in solid waste on a macro-TGA. Journal of Thermal Analysis and Calorimetry 132: 553–562. [Google Scholar]
- Ma S, Lu J, Gao J. (2002) Study of the low temperature pyrolysis of PVC. Energy & Fuels 16: 338–342. [Google Scholar]
- Ma W, Rajput G, Pan M, et al. (2019) Pyrolysis of typical MSW components by Py-GC/MS and TG-FTIR. Fuel 251: 693–708. [Google Scholar]
- Maddah H. (2016) Polypropylene as a promising plastic: A review. American Journal of Polymer Science 6: 1–11. [Google Scholar]
- Mandlekar N, Cayla A, Rault F, et al. (2018) An overview on the use of lignin and its derivatives in fire retardant polymer systems. In: Matheus P. (ed.) Lignin – Trends Applications. Rjieka, Croatia: InTech, 207–231. [Google Scholar]
- Marsh R, Griffiths A, Williams K, et al. (2007) Physical and thermal properties of extruded refuse derived fuel. Fuel Processing Technology 88: 701–706. [Google Scholar]
- Masnadi MS, Habibi R, Kopyscinski J, et al. (2014) Fuel characterization and co-pyrolysis kinetics of biomass and fossil fuels. Fuel 117: 1204–1214. [Google Scholar]
- Matsuzawa Y, Ayabe M, Nishino J. (2001) Acceleration of cellulose co-pyrolysis with polymer. Polymer Degradation and Stability 71: 435–444. [Google Scholar]
- McKendry P. (2002) Energy production from biomass (part 1): Overview of biomass. Bioresource Technology 83: 37–46. [DOI] [PubMed] [Google Scholar]
- Medic-Pejic L, Fernandez-Anez N, Rubio-Arrieta L, et al. (2016) Thermal behaviour of organic solid recovered fuels (SRF). International Journal of Hydrogen Energy 41: 16556–16565. [Google Scholar]
- Meng A, Chen S, Long Y, et al. (2015. a) Pyrolysis and gasification of typical components in wastes with macro-TGA. Waste Management 46: 247–256. [DOI] [PubMed] [Google Scholar]
- Meng A, Chen S, Zhou H, et al. (2015. b) Pyrolysis and simulation of typical components in wastes with macro-TGA. Fuel 157: 1–8. [DOI] [PubMed] [Google Scholar]
- Menon V, Prakash G, Rao M. (2010) Value added products from hemicellulose: Biotechnological perspective. Global Journal of Biochemistry 1: 36–67. [Google Scholar]
- Milne T, Brennan S, Glenn B. (1990) Sourcebook of Methods of Analysis for Biomass and Biomass-Conversion Processes. US Department of Energy; Available at: https://www.nrel.gov/docs/legosti/old/3548.pdf (accessed 30 March 2020). [Google Scholar]
- Miranda R, Sosa-Blanco C, Bustos-Martinez D, et al. (2007) Pyrolysis of textile wastes: I. Kinetics and yields. Journal of Analytical Applied Pyrolysis 80: 489–495. [Google Scholar]
- Miri FS, Ehsani M, Khonakdar HA, et al. (2019) A comprehensive study on physical, mechanical, and thermal properties of poly (ethylene terephthalate) filled by micro-and nanoglass flakes. Journal of Vinyl Additive Technology 1–10. Epub ahead of print 16 December 2019. DOI: 10.1002/vnl.21753. [DOI] [Google Scholar]
- Moreno AI, Font R. (2015) Pyrolysis of furniture wood waste: Decomposition and gases evolved. Journal of Analytical Applied Pyrolysis 113: 464–473. [Google Scholar]
- Mumbach GD, de Sousa Cunha R, Machado RAF, et al. (2019) Dissolution of adhesive resins present in plastic waste to recover polyolefin by sink–float separation processes. Journal of Environmental Management 243: 453–462. [DOI] [PubMed] [Google Scholar]
- Muralidhara K, Sreenivasan S. (2010) Thermal degradation kinetic data of polyester, cotton and polyester–cotton blended textile material. World Applied Sciences Journal 11: 184–189. [Google Scholar]
- Murty M, Rangarajan P, Grulke E, et al. (1996) Thermal degradation/hydrogenation of commodity plastics and characterization of their liquefaction products. Fuel Processing Technology 49: 75–90. [Google Scholar]
- Nasrullah M, Vainikka P, Hannula J, et al. (2014) Mass, energy and material balances of SRF production process. Part 1: SRF produced from commercial and industrial waste. Waste Management 34: 1398–1407. [DOI] [PubMed] [Google Scholar]
- Nasrullah M, Vainikka P, Hannula J, et al. (2015) Mass, energy and material balances of SRF production process. Part 3: Solid recovered fuel produced from municipal solid waste. Waste Management & Research 33: 146–156. [DOI] [PubMed] [Google Scholar]
- Nasrullah M, Vainikka P, Hannula J, et al. (2016) Elemental balance of SRF production process: Solid recovered fuel produced from municipal solid waste. Waste Management & Research 34: 38–46. [DOI] [PubMed] [Google Scholar]
- Neidel TL, Jakobsen JB. (2013) Report on initial assessment of relevant recycling technologies. Plastic ZERO – Public Private Cooperations for Avoiding Plastic as a Waste. Available at: https://ec.europa.eu/environment/life/project/Projects/index.cfm?fuseaction=home.showFile&rep=file&fil=PLASTIC_ZERO_annex_d32_action4.2_report_on_assessment_sept2013_final.pdf (accessed 2 April 2020).
- Nicholson JW. (2017) The Chemistry of Polymers. London: Royal Society of Chemistry. [Google Scholar]
- Nunes R. (2017) 13 – Rubber nanocomposites with nanocellulose. In: Thomas S, Hanna JM. (eds.) Progress in Rubber Nanocomposites. Cambridge, MA: Woodhead Publishing, 463–494. [Google Scholar]
- Osorno DMS, Castro C. (2018) Cellulose application in food industry: A review. In: Somashekar S, Thejas UG. (eds) Emergent Research on Polymeric and Composite Materials. Hershey, PA: IGI Global, 38–77. [Google Scholar]
- Özsin G, Pütün AE, Pütün E. (2019) Investigating the interactions between lignocellulosic biomass and synthetic polymers during co-pyrolysis by simultaneous thermal and spectroscopic methods. Biomass Conversion Biorefinery 9: 593–608. [Google Scholar]
- Pandey DS, Das S, Pan I, et al. (2016) Artificial neural network based modelling approach for municipal solid waste gasification in a fluidized bed reactor. Waste Management 58: 202–213. [DOI] [PubMed] [Google Scholar]
- Park S, Baker JO, Himmel ME, et al. (2010) Cellulose crystallinity index: Measurement techniques and their impact on interpreting cellulase performance. Biotechnology for Biofuels 3: 10. [DOI] [PMC free article] [PubMed] [Google Scholar]
- Park SS, Seo DK, Lee SH, et al. (2012) Study on pyrolysis characteristics of refuse plastic fuel using lab-scale tube furnace and thermogravimetric analysis reactor. Journal of Analytical Applied Pyrolysis 97: 29–38. [Google Scholar]
- Părpăriţă E, Nistor MT, Popescu M-C, et al. (2014) TG/FT–IR/MS study on thermal decomposition of polypropylene/biomass composites. Polymer Degradation and Stability 109: 13–20. [Google Scholar]
- Pauly M, Gille S, Liu L, et al. (2013) Hemicellulose biosynthesis. Planta 238: 627–642. [DOI] [PubMed] [Google Scholar]
- Pedersen MN, Jensen PA, Hjuler K, et al. (2016) Agglomeration and deposition behavior of solid recovered fuel. Energy Fuels 30: 7858–7866. [Google Scholar]
- Pérez J, Munoz-Dorado J, De la Rubia T, et al. (2002) Biodegradation and biological treatments of cellulose, hemicellulose and lignin: An overview. International Microbiology 5: 53–63. [DOI] [PubMed] [Google Scholar]
- Petroudy S. (2017) Physical and mechanical properties of natural fibers. In: Fan M, Fu F. (eds) Advanced High Strength Natural Fibre Composites in Construction. London: Woodhead Publishing, 59–83. [Google Scholar]
- Pezzè M, Zhang C. (2014) Automated test oracles: A survey. In: Memon A. (ed.) Advances in Computers. Waltham, MA: Elsevier, 1–48. [Google Scholar]
- Phyllis E. (2019) Database for biomass and waste. Phyllis2. Available at: https://phyllis.nl/Browse/Standard/ECN-Phyllis#pvc (accessed 12 January 2020).
- Piao G, Aono S, Kondoh M, et al. (2000) Combustion test of refuse derived fuel in a fluidized bed. Waste Management 20: 443–447. [Google Scholar]
- PlasticsEurope (2019. a) Annual review 2017–2018. Available at: https://www.plasticseurope.org/en/resources/publications/498-plasticseurope-annual-review-2017-2018 (accessed 21 January 2020).
- PlasticsEurope (2019. b) Polyolefins. Available at: https://www.plasticseurope.org/en/about-plastics/what-are-plastics/large-family/polyolefins (accessed 12 January 2020).
- Pohl G. (ed.) (2010) Textiles, Polymers and Composites for Buildings. Cambridge: Woodhead Publishing. [Google Scholar]
- Polymer Database (2019. a) Lignin and its derivatives. Available at: http://polymerdatabase.com/polymer%20classes/Lignin%20type.html (accessed 12 January 2020).
- Polymer Database (2019. b) Melting points of polymers. Available at: http://polymerdatabase.com/polymer%20physics/Polymer%20Tm%20C.html (accessed 8 January 2020).
- Pomberger R, Sarc R, Lorber K. (2017) Dynamic visualisation of municipal waste management performance in the EU using ternary diagram method. Waste Management 61: 558–571. [DOI] [PubMed] [Google Scholar]
- Porshnov D, Ozols V, Ansone-Bertina L, et al. (2018) Thermal decomposition study of major refuse derived fuel components. Energy Procedia 147: 48–53. [Google Scholar]
- Quan C, Gao N, Song Q. (2016) Pyrolysis of biomass components in a TGA and a fixed-bed reactor: Thermochemical behaviors, kinetics, and product characterization. Journal of Analytical Applied Pyrolysis 121: 84–92. [Google Scholar]
- Ramalingam M, Ramakrishna S. (2017) Nanofiber Composites for Biomedical Applications. Cambridge: Woodhead Publishing. [Google Scholar]
- Ramiah M. (1970) Thermogravimetric and differential thermal analysis of cellulose, hemicellulose, and lignin. Journal of Applied Polymer Science 14: 1323–1337. [Google Scholar]
- Ramsey MH, Thompson M. (2007) Uncertainty from sampling, in the context of fitness for purpose. Accreditation Quality Assurance 12: 503–513. [Google Scholar]
- Raveendran K, Ganesh A, Khilar KC. (1996) Pyrolysis characteristics of biomass and biomass components. Fuel 75: 987–998. [Google Scholar]
- Ravindranath K, Mashelkar R. (1984) Finishing stages of PET synthesis: A comprehensive model. AIChE Journal 30: 415–422. [Google Scholar]
- Ray S, Cooney RP. (2018) Thermal degradation of polymer and polymer composites. In: Kutz M. (ed.) Handbook of Environmental Degradation of Materials. Kidlington: William Andrew, 185–206. [Google Scholar]
- Robinson T, Bronson B, Gogolek P, et al. (2016) Sample preparation for thermo-gravimetric determination and thermo-gravimetric characterization of refuse derived fuel. Waste Management 48: 265–274. [DOI] [PubMed] [Google Scholar]
- Rostami A, Baghban A. (2018) Application of a supervised learning machine for accurate prognostication of higher heating values of solid wastes. Energy Sources, Part A: Recovery, Utilization, and Environmental Effects 40: 558–564. [Google Scholar]
- Roy Choudhury AK. (2017) Acid–alkali finish. In: Roy C, Asim K. (eds) Principles of Textile Finishing. Kidlington: Woodhead Publishing, 79–108. [Google Scholar]
- Sabet M, Soleimani H, Hosseini S. (2019) Thermal and flammable stability of radiated LDPE and composites. International Journal of Plastics Technology 23: 239–245. [Google Scholar]
- Saha B, Maiti A, Ghoshal A. (2006) Model-free method for isothermal and non-isothermal decomposition kinetics analysis of PET sample. Thermochimica Acta 444: 46–52. [Google Scholar]
- Salmaso L, Pegoraro L, Giancristofaro RA, et al. (2019) Design of experiments and machine learning to improve robustness of predictive maintenance with application to a real case study. Communications in Statistics-Simulation and Computation 1–13. Epub before print 12 August 2019. DOI: 10.1080/03610918.2019.1656740. [DOI] [Google Scholar]
- Sameni J, Krigstin S, dos Santos Rosa D, et al. (2014) Thermal characteristics of lignin residue from industrial processes. BioResources 9: 725–737. [Google Scholar]
- Sarc R, Lorber KE, Pomberger R, et al. (2014) Design, quality, and quality assurance of solid recovered fuels for the substitution of fossil feedstock in the cement industry. Waste Management & Research 32: 565–585. [DOI] [PubMed] [Google Scholar]
- Sarc R, Seidler I, Kandlbauer L, et al. (2019) Design, quality and quality assurance of solid recovered fuels for the substitution of fossil feedstock in the cement industry–Update 2019. Waste Management & Research 37: 885–897. [DOI] [PubMed] [Google Scholar]
- Sarioğlu E, Kaynak HK. (2017) PET bottle recycling for sustainable textiles. In: Nurhan OC. (ed.) Polyester: Production, Characterization and Innovative Applications. Rijeka: IntechOpen, 5–20. [Google Scholar]
- Scheller HV, Ulvskov P. (2010) Hemicelluloses. Annual Review of Plant Biology 61: 263–289. [DOI] [PubMed] [Google Scholar]
- Selçuk A. (2019) A guide for systematic reviews: PRISMA. Turkish Archives of Otorhinolaryngology 57: 57–58. [DOI] [PMC free article] [PubMed] [Google Scholar]
- Séverin M, Velis CA, Longhurst PJ, et al. (2010) The biogenic content of process streams from mechanical–biological treatment plants producing solid recovered fuel. Do the manual sorting and selective dissolution determination methods correlate? Waste Management 30: 1171–1182. [DOI] [PubMed] [Google Scholar]
- Shen D, Gu S, Bridgwater AV. (2010) Study on the pyrolytic behaviour of xylan-based hemicellulose using TG–FTIR and Py–GC–FTIR. Journal of Analytical Applied Pyrolysis 87: 199–206. [Google Scholar]
- Shokri J, Adibkia K. (2013) Application of cellulose and cellulose derivatives in pharmaceutical industries. In: Van De Ven TGM. (ed.) Cellulose: Medical, Pharmaceutical and Electronic Applications. Rijeka: IntechOpen, 47–66. [Google Scholar]
- Silva RB, Martins-Dias S, Arnal C, et al. (2015) Pyrolysis and char characterization of refuse-derived fuel components. Energy & Fuels 29: 1997–2005. [Google Scholar]
- Singh R, Ruj B, Sadhukhan A, et al. (2019) Thermal degradation of waste plastics under non-sweeping atmosphere: Part 1: Effect of temperature, product optimization, and degradation mechanism. Journal of Environmental Management 239: 395–406. [DOI] [PubMed] [Google Scholar]
- Singh S, Wu C, Williams PT. (2012) Pyrolysis of waste materials using TGA-MS and TGA-FTIR as complementary characterisation techniques. Journal of Analytical Applied Pyrolysis 94: 99–107. [Google Scholar]
- Skodras G, Grammelis P, Basinas P, et al. (2009) A thermochemical conversion study on the combustion of residue-derived fuels. Water, Air, Soil Pollution: Focus 9: 151–157. [Google Scholar]
- Skreiberg A, Skreiberg Ø, Sandquist J, et al. (2011) TGA and macro-TGA characterisation of biomass fuels and fuel mixtures. Fuel 90: 2182–2197. [Google Scholar]
- Slopiecka K, Bartocci P, Fantozzi F. (2012) Thermogravimetric analysis and kinetic study of poplar wood pyrolysis. Applied Energy 97: 491–497. [Google Scholar]
- Soares S, Camino G, Levchik S. (1995) Comparative study of the thermal decomposition of pure cellulose and pulp paper. Polymer Degradation and Stability 49: 275–283. [Google Scholar]
- Soni U, Roy A, Verma A, et al. (2019) Forecasting municipal solid waste generation using artificial intelligence models—A case study in India. SN Applied Sciences 1: 162. [Google Scholar]
- Sørum L, Grønli M, Hustad J. (2001) Pyrolysis characteristics and kinetics of municipal solid wastes. Fuel 80: 1217–1227. [Google Scholar]
- Sørum L, Task I. (2001) Characterisation of MSW for combustion systems. SINTEF Energy Research. Available at: http://task36.ieabioenergy.com/wp-content/uploads/2016/06/Characterisation_of_MSW_for_Combustion_Studies-2001.pdf (accessed 16 March 2020).
- Spiridon I, Popa VI. (2008) Hemicelluloses: Major sources, properties and applications. In: Belgacem NM, Gandin A. (eds) Monomers, Polymers and Composites from Renewable Resources. Amsterdam: Elsevier, 289–304. [Google Scholar]
- Statistica (2020) Distribution of Confederation of European Paper Industries’ (CEPI) wood consumption in 2017, by species. Available at: https://www.statista.com/statistics/1003376/cepi-wood-consumption-shares/?fbclid=IwAR2QLi3CS0Exie4EXNvECmkOTtkbHWbhyCXg89BuooHvuvcihFihXmv4Hv8 (accessed 8 July 2020).
- Stefanidis SD, Kalogiannis KG, Iliopoulou EF, et al. (2014) A study of lignocellulosic biomass pyrolysis via the pyrolysis of cellulose, hemicellulose and lignin. Journal of Analytical Applied Pyrolysis 105: 143–150. [Google Scholar]
- Stępień P, Pulka J, Serowik M, et al. (2019) Thermogravimetric and calorimetric characteristics of alternative fuel in terms of its use in low-temperature pyrolysis. Waste Biomass and Valorization 10: 1669–1677. [Google Scholar]
- Tessier D. (2018) Testing thermal properties of textiles. In: Dolez P, Vermeersch O, Izquierdo V. (eds) Advanced Characterization and Testing of Textiles. Cambridge: Woodhead Publishing, 71–92. [Google Scholar]
- Tokmurzin D, Aiymbetov B, Abylkhani B, et al. (2019) Fixed-bed gasification and pyrolysis of organic fraction of MSW blended with coal samples. Chemical Engineering Transactions 72: 163–168. [Google Scholar]
- Tsiamis DA, Castaldi MJ. (2016) Determining accurate heating values of non-recycled plastics (NRP). Earth Engineering Center City, University of New York; Available at: https://plastics.americanchemistry.com/Energy-Values-Non-Recycled-Plastics.pdf (accessed 16 March 2020). [Google Scholar]
- Vainikka P, Enestam S, Silvennoinen J, et al. (2011) Bromine as an ash forming element in a fluidised bed boiler combusting solid recovered fuel. Fuel 90: 1101–1112. [Google Scholar]
- Van der Velden NM, Patel MK, Vogtländer JG. (2014) LCA benchmarking study on textiles made of cotton, polyester, nylon, acryl, or elastane. The International Journal of Life Cycle Assessment 19: 331–356. [Google Scholar]
- Velis C. (2010) Solid recovered fuel production through the mechanical–biological treatment of wastes. PhD Thesis. School of Applied Sciences, Cranfield University, UK. [Google Scholar]
- Velis C, Longhurst PJ, Drew GH, et al. (2010) Production and quality assurance of solid recovered fuels using mechanical—Biological treatment (MBT) of waste: A comprehensive assessment. Critical Reviews in Environmental Science and Technology 40: 979–1105. [Google Scholar]
- Velis C, Wagland S, Longhurst P, et al. (2012) Solid recovered fuel: Influence of waste stream composition and processing on chlorine content and fuel quality. Environmental Science and Technology 46: 1923–1931. [DOI] [PubMed] [Google Scholar]
- Velis CA, Wagland S, Longhurst P, et al. (2013) Solid recovered fuel: Materials flow analysis and fuel property development during the mechanical processing of biodried waste. Environmental Science and Technology 47: 2957–2965. [DOI] [PubMed] [Google Scholar]
- Viikari L, Suurnäkki A, Grönqvist S, et al. (2009) Forest products: Biotechnology in pulp and paper processing. In: Schaechter M. (ed.) Encyclopedia of Microbiology. Amsterdam: Academic Press, 80–94. [Google Scholar]
- Villanueva A, Eder P. (2014) End-of-waste criteria for waste plastic for conversion. Joint Research Centre – Institute for Prospective Technological Studies; Available at: https://publications.jrc.ec.europa.eu/repository/bitstream/JRC91637/2014-jrc91637%20.pdf (accessed 16 March 2020). [Google Scholar]
- Vyazovkin S, Wight CA. (1997) Isothermal and nonisothermal reaction kinetics in solids: In search of ways toward consensus. The Journal of Physical Chemistry A 101: 8279–8284. [Google Scholar]
- Wagland ST, Kilgallon P, Coveney R, et al. (2011) Comparison of coal/solid recovered fuel (SRF) with coal/refuse derived fuel (RDF) in a fluidised bed reactor. Waste Management 31: 1176–1183. [DOI] [PubMed] [Google Scholar]
- Wang S, Ru B, Lin H, et al. (2013) Degradation mechanism of monosaccharides and xylan under pyrolytic conditions with theoretic modeling on the energy profiles. Bioresource Technology 143: 378–383. [DOI] [PubMed] [Google Scholar]
- Wang Z, Huang H, Li H, et al. (2002) HCl formation from RDF pyrolysis and combustion in a spouting–moving bed reactor. Energy & Fuels 16: 608–614. [Google Scholar]
- Wang Z, Liu G, Shen D, et al. (2020) Co-pyrolysis of lignin and polyethylene with the addition of transition metals-Part I: Thermal behavior and kinetics analysis. Journal of the Energy Institute 93: 281–291. [Google Scholar]
- Warrington S. (2002) Simultaneous thermal analysis techniques. In: Haines PJ. (ed.) Principles of Thermal Analysis and Calorimetry. London: RSC Paperbacks, 166–189. [Google Scholar]
- Watkins D, Nuruddin M, Hosur M, et al. (2015) Extraction and characterization of lignin from different biomass resources. Journal of Materials Research and Technology 4: 26–32. [Google Scholar]
- Wikberg H. (2005) Advanced solid state NMR spectroscopic techniques in the study of thermally modified wood. PhD Thesis. Department of Chemistry University of Helsinki, Finland. Available at: https://core.ac.uk/download/pdf/14916662.pdf (accessed 8 July 2020 ).
- Williams PT, Williams EA. (1999) Interaction of plastics in mixed-plastics pyrolysis. Energy & Fuels 13: 188–196. [Google Scholar]
- Williams TP, Besler S. (1996) The influence of temperature and heating rate on the slow pyrolysis of biomass. Renewable Energy 1481: 6–7. [Google Scholar]
- Wong KK, Gamage N, Setunge S, et al. (2014) Thermal behaviour of hardwood and softwood composites. Advanced Materials Research 905: 220–225. [Google Scholar]
- Wood TM. (1988) Preparation of crystalline, amorphous, and dyed cellulase substrates. Methods in Enzymology 160: 19–25. [Google Scholar]
- Water and Resources Action Programme (2009) Commercial scale mixed plastics recycling. Water and Resources Action Programme. Available at: http://www.wrap.org.uk/sites/files/wrap/Commercial%20Scale%20Mixed%20Plastics%20Recycling%2019%206%20FINAL%20FINAL%20VERSION.pdf (accessed 17 March 2020).
- Wu Y-m, Zhao Z-l, Li H-b, et al. (2009) Low temperature pyrolysis characteristics of major components of biomass. Journal of Fuel Chemistry Technology 37: 427–432. [Google Scholar]
- Xu W, Li S, Whitely N, et al. (2005) Fundamentals of TGA and SDT. Available at: https://ruc.udc.es/dspace/bitstream/handle/2183/11485/CC-80%20art%201.pdf (accessed 22 March 2020).
- Yang H, Yan R, Chen H, et al. (2006) In-depth investigation of biomass pyrolysis based on three major components: Hemicellulose, cellulose and lignin. Energy & Fuels 20: 388–393. [Google Scholar]
- Yang H, Yan R, Chen H, et al. (2007) Characteristics of hemicellulose, cellulose and lignin pyrolysis. Fuel 86: 1781–1788. [Google Scholar]
- Yang J, Miranda R, Roy C. (2001) Using the DTG curve fitting method to determine the apparent kinetic parameters of thermal decomposition of polymers. Polymer Degradation and Stability 73: 455–461. [Google Scholar]
- Yu J, Sun L, Ma C, et al. (2016) Thermal degradation of PVC: A review. Waste Management 48: 300–314. [DOI] [PubMed] [Google Scholar]
- Yu J, Wang P, Ni F, et al. (2019) Characterization of microplastics in environment by thermal gravimetric analysis coupled with Fourier transform infrared spectroscopy. Marine Pollution Bulletin 145: 153–160. [DOI] [PubMed] [Google Scholar]
- Yurdakul S, Atimtay A. (2015) Investigation of emissions from thermal oxidation of waste wood samples using spectral methods. International Journal of Global Warming 7: 423–438. [Google Scholar]
- Zhang J, Zhong Z, Zhang B, et al. (2016) Prediction of kinetic parameters of biomass pyrolysis based on the optimal mixture design method. Clean Technologies and Environmental Policy 18: 1621–1629. [Google Scholar]
- Zhang YHP, Lynd LR. (2004) Toward an aggregated understanding of enzymatic hydrolysis of cellulose: noncomplexed cellulase systems. Biotechnology and Bioengineering 88: 797–824. [DOI] [PubMed] [Google Scholar]
- Zhang Z, Zhu M, Zhang D. (2018) A thermogravimetric study of the characteristics of pyrolysis of cellulose isolated from selected biomass. Applied Energy 220: 87–93. [Google Scholar]
- Zhao L, Giannis A, Lam W-Y, et al. (2016) Characterization of Singapore RDF resources and analysis of their heating value. Sustainable Environment Research 26: 51–54. [Google Scholar]
- Zhao S, Liu M, Zhao L, et al. (2018) Influence of interactions among three biomass components on the pyrolysis behavior. Industrial and Engineering Chemistry Research 57: 5241–5249. [Google Scholar]
- Zheng Y, Tao L, Yang X, et al. (2019) Comparative study on pyrolysis and catalytic pyrolysis upgrading of biomass model compounds: Thermochemical behaviors, kinetics, and aromatic hydrocarbon formation. Journal of the Energy Institute 92: 1348–1363. [Google Scholar]
- Zhou H, Long Y, Meng A, et al. (2015. a) A novel method for kinetics analysis of pyrolysis of hemicellulose, cellulose, and lignin in TGA and macro-TGA. RSC Advances 5: 26509–26516. [Google Scholar]
- Zhou H, Long Y, Meng A, et al. (2015. b) Interactions of three municipal solid waste components during co-pyrolysis. Journal of Analytical Applied Pyrolysis 111: 265–271. [Google Scholar]
- Zhu P, Sui S, Wang B, et al. (2004) A study of pyrolysis and pyrolysis products of flame-retardant cotton fabrics by DSC, TGA, and PY–GC–MS. Journal of Analytical Applied Pyrolysis 71: 645–655. [Google Scholar]
Associated Data
This section collects any data citations, data availability statements, or supplementary materials included in this article.
Supplementary Materials
Supplemental material, WMR941085_supp_mat for Characterisation and composition identification of waste-derived fuels obtained from municipal solid waste using thermogravimetry: A review by Spyridoula Gerassimidou, Costas A Velis, Paul T Williams and Dimitrios Komilis in Waste Management & Research