

Many studies show that the uncultured microbes that dominate global marine sediments do not actually increase in population size as they are buried in marine sediments; rather, they exist in a sort of prolonged torpor for thousands of years. This is because, although studies have shown biomass turnover in these clades, no evidence has ever been found that deeper sediments have larger populations for specific clades than shallower layers. We discovered that they actually do increase population sizes during burial, but only in the upper few centimeters. This suggests that marine sediments may be a vast repository of mostly nongrowing microbes with a thin and relatively rapid area of cell abundance increase in the upper 10 cm, offering a chance for subsurface organisms to undergo natural selection.
KEYWORDS: biogeochemistry, marine sediments, subsurface biosphere
ABSTRACT
Global marine sediments harbor a large and highly diverse microbial biosphere, but the mechanism by which this biosphere is established during sediment burial is largely unknown. During burial in marine sediments, concentrations of easily metabolized organic compounds and total microbial cell abundance decrease. However, it is unknown whether some microbial clades increase with depth. We show total population increases in 38 microbial families over 3 cm of sediment depth in the upper 7.5 cm of White Oak River (WOR) estuary sediments. Clades that increased with depth were more often associated with one or more of the following: anaerobes, uncultured, or common in deep marine sediments relative to those that decreased. Maximum doubling times (in situ steady-state growth rates could be faster to balance cell decay) were estimated as 2 to 25 years by combining sedimentation rate with either quantitative PCR (qPCR) or the product of the fraction read abundance of 16S rRNA genes and total cell counts (FRAxC). Doubling times were within an order of magnitude of each other in two adjacent cores, as well as in two laboratory enrichments of Cape Lookout Bight (CLB), NC, sediments (average difference of 28% ± 19%). qPCR and FRAxC in sediment cores and laboratory enrichments produced similar doubling times for key deep subsurface uncultured clades Bathyarchaeota (8.7 ± 1.9 years) and Thermoprofundales/MBG-D (4.1 ± 0.7 years). We conclude that common deep subsurface microbial clades experience a narrow zone of growth in shallow sediments, offering an opportunity for selection of long-term subsistence traits after resuspension events.
IMPORTANCE Many studies show that the uncultured microbes that dominate global marine sediments do not actually increase in population size as they are buried in marine sediments; rather, they exist in a sort of prolonged torpor for thousands of years. This is because, although studies have shown biomass turnover in these clades, no evidence has ever been found that deeper sediments have larger populations for specific clades than shallower layers. We discovered that they actually do increase population sizes during burial, but only in the upper few centimeters. This suggests that marine sediments may be a vast repository of mostly nongrowing microbes with a thin and relatively rapid area of cell abundance increase in the upper 10 cm, offering a chance for subsurface organisms to undergo natural selection.
INTRODUCTION
Marine sediments harbor one of the largest microbiomes on Earth, comprising ∼2.9 × 1029 microbial cells (1). In most marine sediments, total microbial cells decrease with depth in a log-log relationship, since the energy available to support the microbial community decreases as resources are depleted (1, 2). Therefore, most microbes in marine sediments are nutrient-limited and in a state of near-zero growth (3, 4). Bulk sedimentary microbial communities have been calculated to have turnover times (the word turnover is used here to reflect the possibility that net cell growth may not have occurred) on the order of tens to hundreds of years, based on microbial respiration rates and energetic requirements (5, 6), as well as incorporation of isotopically labeled substrates (7). The assembly of these deep subsurface communities over many meters of burial appears to occur through selective survival (8) or environmental filtering (9), rather than net growth. Only the most abundant organisms—or those best suited to the changing redox regime—persist, while all other clades die off (8–11). However, marine sediment microbes appear to have adaptations to marine sediments, since enzyme affinity (lower Km values) to carbon substrates increases with depth and specialization shifts to highly degraded substrates with depth (12). These adaptations imply that heritable natural selection has occurred in a sedimentary environment, which implies that these common subsurface clades experience net growth, rather than just persistence, at some point during burial. This net growth may occur in the upper few centimeters of sediments, since bulk microbes have been shown to grow and increase biomass in upper sedimentary layers (13, 14). Growth of clades common to subsurface environments, such as Chloroflexi, Bathyarchaeota, and Thaumarchaeota, has been shown by uptake of 13C-labeled organic and inorganic carbon in freshwater sediments (15) and oxygenated deep-sea sediments (16). However, the methods used in these growth studies did not show whether this growth resulted in net population increases with increasing depth. We therefore hypothesized that growth occurs for common subsurface clades in the upper few centimeters of marine sediments, over relatively short time intervals of a few tens of years. This growth would have been missed by previous studies that demonstrated persistence rather than growth of subsurface clades during burial (8–11) because these studies were conducted in deeper sediments, after population size increases had largely ceased.
Microbial populations in marine sediments are phylogenetically diverse (17), so clades may differ in their response to burial. One option for a burial response is that the cells from each clade die off at similar rates, with no evidence of growth (Fig. 1). The second option is that some clades experience growth as they are buried, allowing them to increase their population size, even as whole-community cell numbers decrease (Fig. 1). In the second option, the rate of increase in total population size, or doubling time, therefore represents a minimum growth rate estimate. The maximum growth rate could be even higher since growth and death rates may be in equilibrium at each depth layer. Our method does not measure steady-state growth, which is better tackled with substrate incorporation measurements (7, 15, 16). Marine sediments contain many phylogenetically divergent noncultured cells (PDNC) belonging to high-level taxonomic groups with no cultured representatives (18). We hypothesized that (i) some PDNC clades increase in cell abundance with depth in the upper 10 cm of coastal sediments; (ii) their doubling times are slower than the <24 h doubling times of most microbial cultures; and (iii) doubling times are specific to each clade, and are therefore repeatable in different sediment cores and laboratory incubations. We addressed these hypotheses in two experiments. In the first, we measured changes in cell abundance of each microbial taxon with burial depth in two adjacent cores in a marine-influenced estuary (White Oak River estuary). We chose this estuary because the sedimentation rate is well characterized and steady over time (19), so core depth can be used as a proxy for time. The upper 10 cm represent 40 years of burial time. As with most marine sediments, they contain diverse PDNCs (20). In the second experiment, we measured changes in cell abundance of each microbial taxon over time in an unamended marine sediment kept under anoxic conditions for 802 days. The purpose of this second experiment was to demonstrate growth of slow-growing organisms directly, without inferring time from core depth. For this experiment, we used sediments from Cape Lookout Bight (CLB), since the high lability of organic matter means that metabolism of the natural population is fast enough to measure on a laboratory timescale (21, 22).
FIG 1.

Options for how an individual clade of microbes (red cells) either decreases (option 1) or increases (option 2) with total population decrease at 1 cm sediment depth.
Measuring microbial growth rates in natural marine sediments is not straightforward. Quantification methods, such as catalyzed reporter deposition fluorescent in situ hybridization (CARD-FISH) and quantitative PCR (qPCR) are often inaccurate in marine sediments, due to problems with permeabilizing cells and amplification biases (23, 24). These methods are also limited because they only measure the microbial groups targeted by the chosen probes or primers. Measuring the relative abundance of 16S rRNA gene sequence reads amplified from marine sediments encompasses a wider range of phylogenetic groups, but also does not provide accurate quantifications since 16S rRNA gene copy number per genome, DNA extraction methods, and primer sequences are biased (25).
However, when considering relative population increases, these biases cancel each other out (Fig. 2). To quantify the relative population changes with depth, one can multiply the fraction of 16S rRNA gene read abundance by the total cell counts (FRAxC) at two or more depths or time points. FRAxC ratios at different depths or time points has the bias term in both the numerator and the denominator, so it cancels out, allowing the quantification of relative changes in population size (i.e., a 2-fold increase or a doubling in the example in Fig. 2), but not the exact number of cells that have been gained or lost, over the time interval (22). A second measurement for doubling time was made using qPCR assays, which can also be used to calculate relative population doubling times for different levels of taxonomic resolution depending on the primer choice (23). We found that PDNC and clades that could be inferred to be anaerobic increased with population doubling times of 2 to 25 years, with good replication for each clade with FRAxC and qPCR, between duplicate cores from the WOR estuary, and between cores from the WOR estuary and CLB sediment incubations. Close relatives of cultures and aerobic organisms decreased with population half-lives that were not replicable through the different measurements.
FIG 2.

Example to explain how fraction read abundance times cell abundance (FRAxC) works. The total cell count (gray) decreases with depth. The absolute abundance of an imaginary clade of organisms (red) is equal to the total cell abundance multiplied by the fraction of 16S rRNA gene reads of the red clade and a bias term that cannot be measured accurately and is different for each clade of microbes. Assuming that this bias term is similar over adjacent sediment depths for the same clade of microbes, the relative increase in the red clade with depth can be measured absolutely, since the bias term cancels out.
RESULTS
Sulfate concentrations and porosity were constant with depth in the upper 5 cm of core 34 and the upper 3 cm of core 31 (Fig. 3) due to bioirrigation and bioturbation. Below this, sulfate concentrations decreased due to microbial sulfate reduction, as has been observed in other cores at this site (26, 27). Total cell abundance decreased with depth (Fig. S1 in the supplemental material). The FRAxC and qPCR of total archaea, Bathyarchaeota (previously called MCG or MG 1.3) (28), and Thermoprofundales (previously called MBG-D) (29) increased slightly below the depth of bioirrigation in both WOR cores (Fig. 4). The FRAxC and qPCR of total bacteria decreased with depth in both cores. qPCR values were lower than FRAxC values, demonstrating that these methods are subject to amplification biases and are best used to measure relative changes rather than absolute values (23). The doubling times measured with FRAxC and qPCR methods were within a year of each other for Bathyarchaeota and MBG-D (Table 1), suggesting that FRAxC is as good a measure of relative abundance as qPCR. FRAxC, however, opens the possibility of measuring doubling times for any clade represented in the 16S rRNA gene libraries, without developing primer sets for each one.
FIG 3.
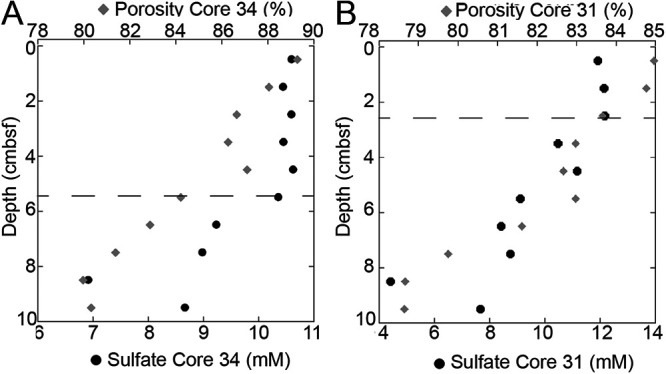
Sulfate and porosity in White Oak River estuary sediments. Bioirrigation depth (dashed line) determined where porosity and sulfate first started to decrease consistently with depth in core 34 (A), which was adjacent to core 30, and core 31 (B), which was adjacent to core 32. The one centimeter intervals did not provide enough sediment volume for both DNA and geochemistry analyses to be performed on the same core.
FIG 4.

Archaea, Bathyarchaeota, and MBG-D, but not bacteria, increase in the 3 cm below the depth of bioirrigation in White Oak River estuary sediments in core 30 (A and B) and core 32 (C to E), using the product of the fraction of 16S rRNA gene read abundance and cell counts (FRAxC) and quantitative PCR (qPCR) measurements. Gray dotted line is the depth of bioirrigation determined in Fig. 1. Note variations in scale in the x axes.
TABLE 1.
Doubling times (in years) for all clades that increased in both cores of White Oak River (WOR) estuary sediments and replicate incubations from the Cape Lookout Bight (CLB) marine sediments
| Clade | WOR marine sediment |
CLB marine sediment |
||||
|---|---|---|---|---|---|---|
| Core 30 |
Core 32 |
Incubation 2 | Incubation 3 | |||
| FRAxCa | qPCRb | FRAxC | qPCR | FRAxC | FRAxC | |
| Bathyarchaeota, or MCG | 10.1 | 10.3 | 8.9 | 10.0 | 6.4 | 6.3 |
| Group C3, MCG-related | 16.2 | - | 14.9 | - | 2.1 | 1.8 |
| Thermoprofundales (MBG-D) | 4.6 | - | 3.4 | 4.8 | 3.4 | 4.4 |
| Thermoprofundales (MG-III) | 3.7 | - | 2.8 | - | 1.4 | 1.5 |
| Thermoprofundales (20a-9) | 7.1 | - | 3.7 | - | 0.8 | 0.7 |
FRAxC denotes values calculated by the increase of the product of 16S rRNA gene read percentages and total cells over depth (WOR) or time (CLB).
qPCR denotes values calculated by the increase of qPCR of 16S rRNA genes over depth. Hyphen indicates no data because qPCR was not attempted for that clade or sample.
Using FRAxC in the WOR cores, the doubling time (defined as a positive value for doubling time) or half-life (defined as a negative value for doubling time) was calculated for each family-level clade across the three centimeters below the bioirrigated upper layer (5.5, 6.5, and 7.5 cm for core 30 and 3.5, 4.5, and 5.5 cm for core 32; see Table S1). These three depths produced the highest number of clades that increased with depth. A similar increase in the relative contribution from anaerobic organisms was observed immediately below the bioirrigation zone in the marine sediments of Aarhus Bay, Denmark (9). Of the 315 clades, 278 were present in both cores, and 167 had R2 >0.4 to the curve fit to equation 1, meaning that a change in FRAxC over depth could be observed. The lenient cutoff R2 >0.4 was chosen in order to perform downstream analyses on the largest possible selection of clades. Of these clades, 134 had doubling times or half-lives between 2 and 25 years. This means that the sampling interval of ∼8 years was sufficient to resolve clades that underwent at least a third of one doubling or halving in that interval. Clades that increased faster or more slowly with depth were outside the detection limit. Read abundance between different clades did not correlate with doubling time (Fig. 5). In other words, a clade’s relative abundance in the 16S rRNA gene libraries did not bias whether it would increase or decrease with depth.
FIG 5.

No trend between turnover time and the number of reads of 16S rRNA genes for core 30 (A) and core 32 (B). Turnover times were calculated from changes in FRAxC with depth and equation 1.
To determine how sensitive doubling times were to differences in the cell abundance curves used to calculate FRAxC, comparisons were made with cell counts from a 2012 WOR core (22) and estuarine sediments from Ashleworth Quay, UK (30). For core 30, 92% and 100% of the clades with doubling times of 2 to 25 years still fell within that range using the 2012 and Ashleworth Quay cell counts. For core 32, these numbers were 98% and 100%. This suggests that this method is fairly robust to variations in cell abundance curves.
The direction of either increase or decrease was replicable in WOR cores 30 and 32 for 131 out of 133 clades (Fig. 6a). Clades that usually increased with depth were common marine subsurface inhabitants: Chloroflexi, Deltaproteobacteria, Bathyarchaeota, Lokiarchaeota, MBG-D, etc (31). Those that decreased with depth were common seawater inhabitants: Betaproteobacteria, Alphaproteobacteria, Gammaproteobacteria, Thaumarchaeota (MG-I), Bacteroidetes, Acidobacteria (32). Thuamarchaeota species are only found in marine sediments in oxic layers (33), which can often stretch to tens of meters (34), but the sediments in our study were anoxic. Clades from uncultured phyla were more likely to increase rather than decrease with depth (9/11 clades). Clades from orders, families, genera, or species with cultured representatives were more likely to decrease rather than increase with depth (57/60 clades). This suggests that easily cultured organisms were dying off whereas difficult-to-culture clades, or PDNC, were increasing in cell abundance. Aerobes and nitrate reducers were more likely to decrease with depth (23/23 clades where all cultures are obligate aerobes or nitrate reducers, Fig. 7). Doubling times for clades that increased were well correlated for individual clades between the two WOR cores (slope = 0.87, R2 = 0.64), suggesting that the populations may have been growing at rates determined by their particular physiological traits. The mean deviation from the mean between the duplicate cores was 28% ± 19%. This suggests that calculated doubling times were accurate at least within an order of magnitude. In contrast, half-lives for clades that decreased were poorly correlated for individual clades between cores (Fig. 6, slope = 0.27, R2 = 0.11). A number of factors could contribute to this poor fit in the accumulation of relic DNA, which can reach high proportions in sediment (35). For microbes capable of entering dormant states, biphasic models have been used to account for the slowing of decay over time as a greater proportion of populations shift to resistant states (36). Clades that decreased with depth may have been net dying or decaying because they could not meet their energetic requirements, and, unlike the doubling times of the growing populations, their rates of decay/death were not specific to their clades’ specific physiologies. These results support the conclusion that FRAxC doubling times represent real population changes during burial.
FIG 6.
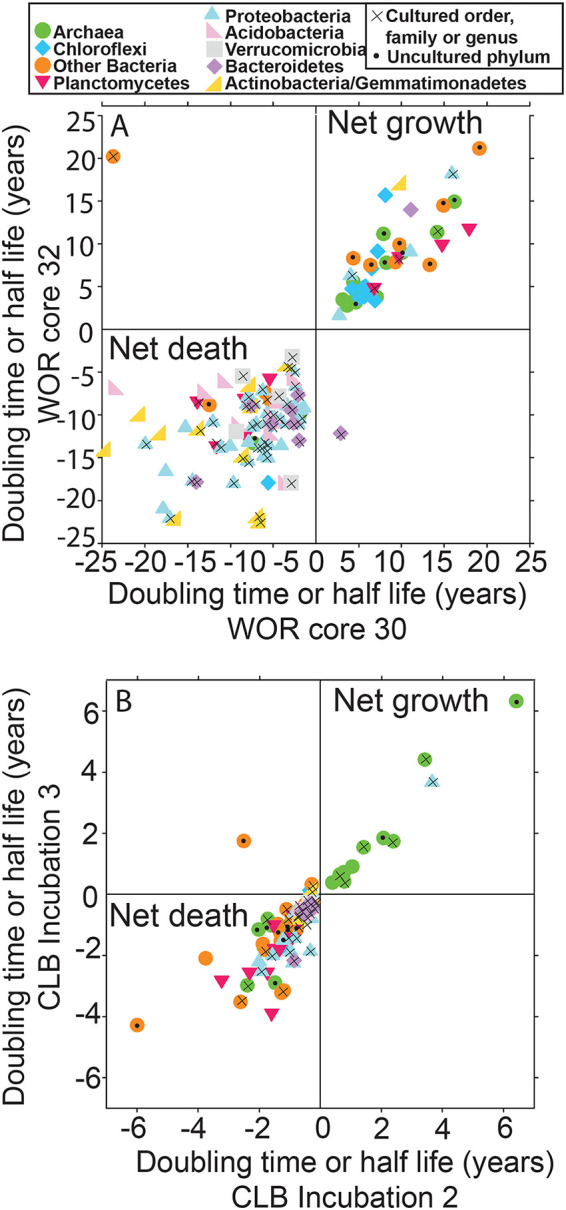
Multiyear doubling times for uncultured microbes in marine sediments, measured in down-core trends in White Oak River estuary. Replicates are plotted against each other to show good correlation between clades that increase (upper right quadrants) or decrease (lower left quadrants) with depth. Clades that grow tend to be common subsurface clades (in dark colors) and uncultured phyla (black dots); clades that decay tend to be common seawater clades (in pale colors) and more closely related to cultured phyla (x’s).
FIG 7.
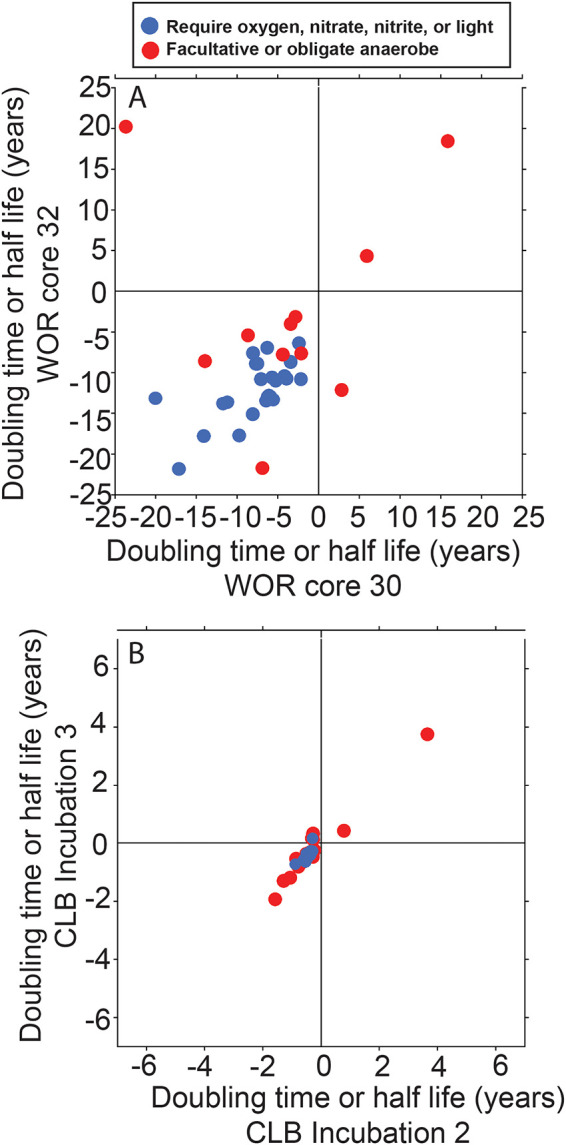
The subset of clades from Fig. 6 that contain cultured phyla. Clades where all cultured relatives are oxygen- or nitrate-reducing are in blue, and clades that contain at least some non-nitrogen-cycling facultative anaerobes are in red.
As a separate check on the feasibility of these doubling times, we used the depth-integrated sulfate reduction rate (0.93 μM cm−3 d−1, calculated as the average slope of sulfate concentrations over the depths considered for microbial doubling times using the same age model to convert depth to time) (Fig. 3) to estimate a doubling time for sulfate reducers of 12 years, assuming that 10% of total cells were sulfate reducers with growth yields of 2 g cell C/mol (3, 37), and cell carbon contents of 23 fg/cell (38). This falls well within our results from FRAxC of 2- to 25-year doubling times, including one clade with cultured sulfate reducers, Desulfarculaceae, that had doubling times of 15 and 18 years in the two cores. Previous work in arctic and temperate marine sediments also supports generation times of over a year in marine sediment incubations where total cell abundance of sulfate reducing bacteria held constant despite increasing metabolic rates over a year-long incubation (39).
We also tracked community succession in marine sediment from Cape Lookout Bight, NC, in two laboratory mesocosms under methanogenic conditions over 2.2 years (Fig. 6b). Doubling times or half-lives were calculated with FRAxC for each family-level clade present in the incubations using time points between 40 and 802 days (40, 47, 54, 61, 75, 80, 86, 94, 107, 114, 122, and 802 days, Table S2). All 601 taxa were present in both incubations. R-squared was not a good method of quality control for the CLB incubation data because the data were not evenly distributed across the time interval. Instead, an abundance cutoff was imposed such that each clade must have had at least one time point with a value of at least 14 for ln(FRAxC), which left 195 taxa remaining. Of these, 96%, or 188, had doubling times or half-lives between 0.1 and 7 years (Fig. 6b, Table S2). As with the WOR cores, the sampling interval of 0.1 to 2.2 years was sufficient to resolve clades that underwent a least a third of one doubling or halving in that interval, with slower or faster clades falling outside the detection limit. Also, similarly to the WOR cores, the direction of increase or decrease was replicable in duplicate incubations (182/188 clades), clades that increased were more similar between replicate incubations (slope = 1.05, R2 = 0.96), and clades that decreased were less similar between replicate cores (slope = 0.83, R2 = 0.53). The clades that increased over time in the CLB incubations were largely methane-cycling archaea (Methanosarcinales, Methanomicrobiales, and ANME-1), which was expected since the onset of methanogenesis occurred during the sampling interval. The doubling times of methanogen-like archaea of 0.3 to 0.8 years were consistent with a previous measurement of a doubling time of 0.6 years for one of these clades, ANME-1, grown in an enrichment (40).
Of the five clades that increased in both the WOR sediments and the CLB incubations (Bathyarchaeota, C3, MBG-D, MG-III, and 20a-9), four increased faster in the CLB incubations, but most had multiyear doubling times in both types of experiments and measurement methods (Table 1). Two clades (Bathyarchaeota and MBG-D) had both types of measurements (qPCR and FRAxC) in both types of experiments (WOR cores and CLB incubations). The mean of all these measurements resulted in doubling times of 8.7 ± 1.9 years for Bathyarchaeota and 4.1 ± 0.7 years for MBG-D; the relatively small standard deviation suggests that these doubling times are accurate within a few years. Many of the clades with slower doubling times in the WOR cores were present in the CLB incubations, but did not have doubling times that met our quality cutoff. We may have been able to resolve their growth rates if we had waited ∼8 years. The lab incubation experiment therefore also supports a multiyear population doubling time for anaerobic uncultured marine subsurface organisms, in an experimental system that rules out diffusional mixing and depositional changes as drivers for the population changes.
DISCUSSION
The repeatable increase in cell abundance of microbial taxa in the WOR cores suggest that the log-log decay rate with depth for the total microbial community does not apply to some clades within the marine sediment biosphere. Some clades experience periods of net growth, resulting in population increases during burial (option 2 in Fig. 1). Two alternative possibilities could also explain an increase with depth in sediment cores, without indicating population growth. First, this increase could represent a mixing curve between a deep source of microbial cells diffusing up toward the surface sediments. Second, the increase could be the result of depositional changes, with greater loading of these subsurface clades in previous depositional events. However, the fact that growth was seen for these organisms in the CLB incubation experiment supports the growth interpretation.
Should the population doubling times estimated here approximate the growth rates of these clades, then these microbes would be considered dormant or inactive relative to pure cultures (4). However, laboratory growth rates are calculated assuming a negligible death rate. If the natural populations in our experiments are in steady state with some resource that gradually increases with depth (such as a lessening influence of bioturbation, for example), then cell replication is roughly balanced by cell death, so an increase in total population size does not necessarily reflect the growth rate, which may be much faster.
The finding that deep subsurface organisms experience a period of growth early in their burial phase has important implications for microbial adaptations to the marine subseafloor biosphere. Many of these clades have been shown to be dormant or nongrowing for most of the sediment column (3, 10). In other environments, such as agricultural soils, periods of dormancy are interspersed with periods of growth (4). Our results suggest that the period of growth for marine sediment microbes may occur in the upper few cm. The coastal sediments in our study likely differ both in quality and type of organic matter substrates from deep-sea sediments, suggesting that this growth zone could occur at a greater depth in deep-sea sediments. Our work suggests that such a growth zone likely occurs over a time period that is much shorter than the full marine sediment column, which can be millions of years old.
This suggests a possible mechanism for adaptation to long-term dormancy in marine sediments, building on the concept of the growth advantage in stationary phase (GASP) phenotype, where E. coli cells that have been starved for years outcompete fresh cells under low-substrate conditions (41). Our results suggest that these GASP-like adaptations to long-term starvation could also be selected for after resuspension events, allowing GASP to be extrapolated over much longer timescales in marine sediment, as was predicted previously (42). If deep sedimentary cells with subsistence-promoting or GASP-like mutations are resuspended either by a storm or sediment slumping, these organisms would have a growth advantage over others as they were buried a second time through the relatively brief and shallow growth zone. This means that although evolutionary changes do not occur during the process of burial and near-zero cell growth over thousands of years (8), the ability to subsist over thousands of years in marine sediment is a trait that could have been selected for within the growth zone in shallow sediments. Microbes might even be ejected from deeper sediments depths by mud volcanoes into overlying seawater, where they can be carried by currents and redeposited at the seafloor (43–45). Our results suggest that such organisms may revive and begin growing shortly after deposition.
If these doubling times are similar to growth rates, then these organisms grow much more slowly than most laboratory cultures, which double in less than a day. This agrees with previous work showing that microbes grow much more slowly in the environment than in laboratory culture. Staphylococcus aureus grows 48-fold faster in culture than it does in an infected lung (46) and Leucothrix mucor grows 7-fold faster in culture than it does in seawater (47). The observation that so many of the clades that increased in abundance in our study belong to uncultured clades suggests that low growth rates may be a reason why so many of them remain uncultured. Recent successes with culturing slow-growing strains from the previously uncultured phyla Lokiarchaeota and Atribacteria attest to the necessity of extremely long wait times for growth, even 2,000 days in one case (48, 49). Label incorporation in some of these clades has been shown to occur over only a few weeks (15, 16), and cell increases over a few months (50) under incubation experiments shows that even PDNC may have the ability to speed up under the right growth conditions.
Even if it is possible to speed up such organisms sufficiently to culture them, their traits expressed under such conditions are likely to greatly diverge from those expressed in their natural environment. Therefore, even when cultures are available, it is crucial to study these organisms in their natural environmental settings. Using label incorporation (7, 15, 16, 46, 51, 52), or tracking slow growth in a mixed population under different conditions, will allow for growth experiments on the environmentally abundant, evolutionarily distinct, uncultured microbes from resource-limited environments. Such experiments are necessary to assess modifications to cell cycle regulation, proteins, or plasma membranes that enable such extraordinarily slow growth, as well as to determine how this narrow growth zone in surficial sediments may select for the traits that enable long-term subsistence of the deep subsurface biosphere.
MATERIALS AND METHODS
Sample acquisition and treatment.
Four sediment cores of ∼10 cm depth each were retrieved from Station H, WOR estuary (34 44.490’ N, 77 07.44’ W) May 16, 2016, in about 1.5 m water depth, with water salinity of 11 ppt (cores 30, 21, 32, and 34). Each core was sectioned into 1-cm intervals later that day at room temperature (roughly equal to the measured in situ water temperature of 25°C) at the University of North Carolina Institute for Marine Sciences after being kept at about this temperature during transport. Two cores (cores 30 and 32) were sectioned for qPCR and 16S rRNA gene libraries, two cores (cores 34 and 31, which were taken adjacent to cores 30 and 32, respectively) were sectioned for sulfate concentrations and porosity. The core for cell counts was taken May 28, 2013 (core 7) from the same site (34°44.482’N, 77°7.435’W), and was sectioned in 3-cm intervals. The top 3 cm of marine sediment from CLB (34.6205°N, 76.5500°W) was collected from 10 m of water depth on October 2, 2013 and combined into a 2-liter Erlenmeyer flask that was incubated anoxically for 802 days, as reported previously (22), without any amendment of substrates.
Geochemistry.
To measure sulfate, a 15-ml plastic tube was filled completely with sediment and centrifuged at 5,000 × g for 5 min. A syringe was used to remove the supernatant below the air interface. The porewater was filtered using a 0.2-μm syringe filter into 100 μl of 10% HCl to a final volume of 1 ml. Porewater sulfate concentrations were determined by ion chromatography (Dionex, Sunnyvale, CA). Porosity was determined by comparing dry and wet weights as described previously (26).
DNA extraction, qPCR, sequencing, and data analysis.
Each 1-cm depth interval of cores 30 and 32 was placed into a Whirlpak bag and frozen immediately on dry ice for later DNA extraction after storage at −80°C. DNA was extracted from frozen sediments (MoBio RNA Powersoil kit with DNA accessory) and enumerated on a NanoDrop 3000. At the time points from the CLB incubations, DNA was extracted from frozen samples using the FastDNA kit for soil (MP Bio, Santa Ana, CA). For both the WOR cores and the CLB incubations, the V4 region of each DNA extract was amplified using the universal primers 515f and 806r (53), prepared via Nexterra kit and sequenced at the Center for Environmental Biotechnology at the University of Tennessee (Knoxville, TN) on an Illumina MiSeq. These extraction kits and primers are biased (54), therefore the relative abundance of one clade was not measured against any other clades, and the absence of a particular clade from the data set was not considered to be meaningful. Only taxa that appeared in both kits were compared. 16S rRNA gene reads were processed, chimera-checked, and classified via Silva taxonomy (v126) (55) in mothur (56). All calculations were performed on clades at the fifth taxonomic level, which is roughly the family level, only from clades with >150 total reads in the Miseq run, which left 327 clades from core 30 and 288 clades from core 32.
Quantitative PCR (qPCR) was used to determine the 16S rRNA gene abundance of bacteria, archaea, Bathyarchaeota, and Marine Benthic Group D (MBG-D) in the Thermoplasmata (with the latter for core 32 only) using the Quantifast SYBRGreen kit (Qiagen) on a Bio-Rad Opticon2 thermocycler. Since absolute gene abundance cannot be accurately measured for DNA in marine sediments (23, 24), only the relative changes in gene abundance were measured. Our primers were MCG528F and MCG732R for Bathyarchaeota (20), MBG-D322F and MBG-D569R for Marine Benthic Group D (57), ARCH915F (58) and ARC1059R (59) for archaea, and BAC340F and BAC515R for bacteria (60).
Population doubling time calculations.
Population doubling times for a family-level classification were calculated from relative 16S rRNA gene abundances and total cell counts as described previously (22), with the following relationship:
| (1) |
where td,i is the doubling time of the ith family clade, t is the elapsed time, FRAi,t is the fraction read abundance of the ith clade at time t, and Ctot,t is the total number of cells at time t. The product of the fraction 16S rRNA gene abundance of a particular clade and the total cell abundance will be referred to as the FRAxC of a particular clade. To calculate the population doubling for a specific group of target organisms using qPCR, we used the following relationship:
| (2) |
where copies is the number of copies of target 16S rRNA gene quantified via qPCR. Equations 1 and 2 are equivalent to ln(2) divided by the slope time versus the natural log of FRAiCtot or the natural log of copiesi. For incubations from CLB, time from the start of the experiment was known. For samples taken from the WOR estuary, time at each depth was determined based on an age model (61), using the porosity measurements for core 31 and a sedimentation rate of 0.26 cm/year (19).
Cell counts.
Sediments were fixed in 3% paraformaldehyde for 1 to 4 h, washed twice with phosphate-buffered saline (PBS), and stored at –20°C in PBS:ethanol. Sediments were sonicated at 20% power for 40 s, diluted to 1:40 in PBS, filtered onto a 0.2-μm polycarbonate filter (Fisher Scientific, Waltham, MA), stained with SYBR Gold (Invitrogen, Carlsbad, CA), and counted at ×100 magnification on an epifluorescence microscope. To interpolate cell counts into 1 cm intervals, an exponential curve fit was applied to the samples within the 0 to 10 cm interval with the following fit: depth = 137.77 exp(−1 × 10⁻⁹ × cells/ml), R2 = 0.94. Two more cell count curves were used to test the sensitivity of doubling times to cell count profile variations. In one, cell counts from a 2012 WOR core were previously published (22), and resulted in the following curve fit over 0 to 10 cm: depth = 14.13 exp(−4 × 10⁻¹⁰ × cells/ml), R2 = 0.93. In the second, cell counts were taken using WebPlotDigitizer from previously published estuarine sediments from Ashleworth Quay (30). For the CLB incubations, SYBR Gold direct counts of paraformaldehyde-fixed cells were performed as described previously (22).
Data availability.
16S rRNA gene reads were deposited in the NCBI Sequence Read Archive (SRA) with BioProject accession numbers PRJNA614649 for WOR sediments and PRJNA321388 for CLB incubations.
Supplementary Material
ACKNOWLEDGMENTS
We thank Michael Piehler for lab space at the University of North Carolina Institute for Marine Sciences, Frank Löffler, Steve Wilhelm, and Erik Zinser for sharing laboratory equipment, Dan Williams and Ameen Abdel-Khalek for help in lab and with sequencing, and Andreas Schramm for planting the seed of the idea of growth in the upper 10 cm.
This material is based upon work supported by (i) the National Science Foundation under grant numbers OCE-1431598 (to K.G.L.); (ii) the NSF Center for Dark Energy Biosphere Investigations (OCE-0939564) contribution number 540 (to K.G.L.); (iii) the Alfred P. Sloan Foundation Fellowship (FG-2015-65399, to K.G.L.); (iv) NASA Astrobiology Institute (NNX16AL59G, to K.G.L.); and (v) the Simons Foundation (404586, to K.G.L.).
Footnotes
Supplemental material is available online only.
REFERENCES
- 1.Kallmeyer J, Pockalny R, Adhikari RR, Smith DC, D'Hondt S. 2012. Global distribution of microbial abundance and biomass in subseafloor sediment. Proc Natl Acad Sci U S A 109:16213–16216. doi: 10.1073/pnas.1203849109. [DOI] [PMC free article] [PubMed] [Google Scholar]
- 2.Parkes RJ, Cragg BA, Wellsbury P. 2000. Recent studies on bacterial populations and processes in subseafloor sediments : a review. Hydrogeol J 8:11–28. doi: 10.1007/PL00010971. [DOI] [Google Scholar]
- 3.Hoehler TM, Jørgensen BB. 2013. Microbial life under extreme energy limitation. Nat Rev Microbiol 11:83–94. doi: 10.1038/nrmicro2939. [DOI] [PubMed] [Google Scholar]
- 4.Lennon JT, Jones SE. 2011. Microbial seed banks: the ecological and evolutionary implications of dormancy. Nat Rev Microbiol 9:119–130. doi: 10.1038/nrmicro2504. [DOI] [PubMed] [Google Scholar]
- 5.Braun S, Mhatre SS, Jaussi M, Røy H, Kjeldsen KU, Pearce C, Seidenkrantz M-S, Jørgensen BB, Lomstein BA. 2017. Microbial turnover times in the deep seabed studied by amino acid racemization modelling. Sci Rep 7:5680. doi: 10.1038/s41598-017-05972-z. [DOI] [PMC free article] [PubMed] [Google Scholar]
- 6.Jorgensen BB. 2011. Deep subseafloor microbial cells on physiological standby. Proc Natl Acad Sci 108:18193–18194. doi: 10.1073/pnas.1115421108. [DOI] [PMC free article] [PubMed] [Google Scholar]
- 7.Trembath-Reichert E, Morono Y, Ijiri A, Hoshino T, Dawson KS, Inagaki F, Orphan VJ. 2017. Methyl-compound use and slow growth characterize microbial life in 2-km-deep subseafloor coal and shale beds. Proc Natl Acad Sci U S A 114:E9206–E9215. doi: 10.1073/pnas.1707525114. [DOI] [PMC free article] [PubMed] [Google Scholar]
- 8.Starnawski P, Bataillon T, Ettema TJG, Jochum LM, Schreiber L, Chen X, Lever MA, Polz MF, Jørgensen BB, Schramm A, Kjeldsen KU. 2017. Microbial community assembly and evolution in subseafloor sediment. Proc Natl Acad Sci U S A 114:2940–2945. doi: 10.1073/pnas.1614190114. [DOI] [PMC free article] [PubMed] [Google Scholar]
- 9.Marshall IPG, Ren G, Jaussi M, Aa B, Bo L, Jørgensen B, Røy H, Kjeldsen KU. 2019. Environmental filtering determines family-level structure of sulfate-reducing microbial communities in subsurface marine sediments. ISME J 13:1920–1932. doi: 10.1038/s41396-019-0387-y. [DOI] [PMC free article] [PubMed] [Google Scholar]
- 10.Kirkpatrick JB, Walsh EA, D’Hondt S. 2016. Fossil DNA persistence and decay in marine sediment over hundred-thousand-year to million-year time scales. Geology 44:615–618. doi: 10.1130/G37933.1. [DOI] [Google Scholar]
- 11.Jochum LM, Chen X, Lever MA, Loy A, Jørgensen BB, Schramm A, Kjeldsen U. 2017. Depth distribution and assembly of sulfate-reducing microbial communities in marine sediments of Aarhus Bay. Appl Environ Microbiol 83:e01547-17. doi: 10.1128/AEM.01547-17. [DOI] [PMC free article] [PubMed] [Google Scholar]
- 12.Steen AD, Kevorkian RT, Bird JT, Dombrowski N, Baker BJ, Hagen SM, Mulligan KH, Schmidt JM, Webber AT, Royalty T, Alperin MJ. 2019. Kinetics and identities of extracellular peptidases in subsurface sediments of the White Oak River Estuary, North Carolina. Appl Environ Microbiol 85:e00102-19. doi: 10.1128/AEM.00102-19. [DOI] [PMC free article] [PubMed] [Google Scholar]
- 13.Karl D, Novitsky J. 1988. Dynamics of microbial growth in surface layers of a coastal marine sediment ecosystem. Mar Ecol Prog Ser 50:169–176. doi: 10.3354/meps050169. [DOI] [Google Scholar]
- 14.Novitsky J, Karl D. 1986. Characterization of microbial activity in the surface layers of a coastal subtropical sediment. Mar Ecol Prog Ser 28:49–55. doi: 10.3354/meps028049. [DOI] [Google Scholar]
- 15.Coskun ÖK, Pichler M, Vargas S, Gilder S, Orsi WD. 2018. Linking uncultivated microbial populations and benthic carbon turnover by using quantitative stable isotope probing. Appl Environ Microbiol 84:e01083-18. doi: 10.1128/AEM.01083-18. [DOI] [PMC free article] [PubMed] [Google Scholar]
- 16.Vuillemin A, Wankel SD, Coskun ÖK, Magritsch T, Vargas S, Estes ER, Spivack AJ, Smith DC, Pockalny R, Murray RW, Hondt SD, Orsi WD. 2019. Archaea dominate oxic subseafloor communities over multimillion-year time scales. Sci Adv 5:eaaw4108. doi: 10.1126/sciadv.aaw4108. [DOI] [PMC free article] [PubMed] [Google Scholar]
- 17.Parkes RJ, Webster G, Cragg BA, Weightman AJ, Newberry CJ, Ferdelman TG, Kallmeyer J, Jørgensen BB, Aiello IW, Fry JC. 2005. Deep sub-seafloor prokaryotes stimulated at interfaces over geological time. Nature 436:390–394. doi: 10.1038/nature03796. [DOI] [PubMed] [Google Scholar]
- 18.Lloyd KG, Steen AD, Ladau J, Yin J, Crosby L. 2018. Phylogenetically novel uncultured microbial cells dominate Earth microbiomes. mSystems 3:e00055-18. doi: 10.1128/mSystems.00055-18. [DOI] [PMC free article] [PubMed] [Google Scholar]
- 19.Benninger LK, Martens CS. 1983. Sources and fates of sedimentary organic matter in the White Oak and Neuse estuaries. Report of the Water Resources Research Institute of the University of North Carolina, UNC-WRRI-83–194. [Google Scholar]
- 20.Kubo K, Lloyd KG, F Biddle J, Amann R, Teske A, Knittel K. 2012. Archaea of the Miscellaneous Crenarchaeotal Group are abundant, diverse and widespread in marine sediments. ISME J 6:1949–1965. doi: 10.1038/ismej.2012.37. [DOI] [PMC free article] [PubMed] [Google Scholar]
- 21.Alperin MJ, Blair NE, Albert DB, Hoehler TM, Martens CS. 1992. Factors that control the stable carbon isotopic composition of methane produced in an anoxic marine sediment. Global Biogeochem Cycles 6:271–291. doi: 10.1029/92GB01650. [DOI] [Google Scholar]
- 22.Kevorkian R, Bird JT, Shumaker A, Lloyd KG. 2018. Estimating population turnover rates by relative quantification methods reveals microbial dynamics in marine sediment. Appl Environ Microbiol 84:e01443-17. doi: 10.1128/AEM.01443-17. [DOI] [PMC free article] [PubMed] [Google Scholar]
- 23.Lloyd KG, May MK, Kevorkian RT, Steen AD. 2013. Meta-analysis of quantification methods shows that archaea and bacteria have similar abundances in the subseafloor. Appl Environ Microbiol 79:7790–7799. doi: 10.1128/AEM.02090-13. [DOI] [PMC free article] [PubMed] [Google Scholar]
- 24.Buongiorno J, Turner S, Webster G, Asai M, Shumaker AK, Roy T, Weightman A, Schippers A, Lloyd KG. 2017. Interlaboratory quantification of Bacteria and Archaea in deeply buried sediments of the Baltic Sea (IODP Expedition 347). FEMS Microbiol Ecol 93:fix007. doi: 10.1093/femsec/fix007. [DOI] [PubMed] [Google Scholar]
- 25.Polz MF, Cavanaugh CM. 1998. Bias in template-to-product ratios in multitemplate PCR. Appl Environ Microbiol 64:3724–3730. doi: 10.1128/AEM.64.10.3724-3730.1998. [DOI] [PMC free article] [PubMed] [Google Scholar]
- 26.Lloyd KG, Alperin MJ, Teske A. 2011. Environmental evidence for net methane production and oxidation in putative ANaerobic MEthanotrophic (ANME) archaea. Environ Microbiol 13:2548–2564. doi: 10.1111/j.1462-2920.2011.02526.x. [DOI] [PubMed] [Google Scholar]
- 27.Martens CS, Albert DB, Alperin MJ. 1998. Biogeochemical processes controlling methane in gassy coastal sediments—Part 1. A model coupling organic matter flux to gas production, oxidation and transport. Methods 18:1741–1770. doi: 10.1016/S0278-4343(98)00056-9. [DOI] [Google Scholar]
- 28.Meng J, Xu J, Qin D, He Y, Xiao X, Wang F. 2014. Genetic and functional properties of uncultivated MCG archaea assessed by metagenome and gene expression analyses. ISME J 8:650–659. doi: 10.1038/ismej.2013.174. [DOI] [PMC free article] [PubMed] [Google Scholar]
- 29.Zhou Z, Liu Y, Lloyd KG, Pan J, Yang Y, Gu J-D, Li M. 2019. Genomic and transcriptomic insights into the ecology and metabolism of benthic archaeal cosmopolitan, Thermoprofundales (MBG-D archaea). ISME J 13:885–901. doi: 10.1038/s41396-018-0321-8. [DOI] [PMC free article] [PubMed] [Google Scholar]
- 30.Wellsbury P, Herbert RA, Parkes RJ. 1996. Bacterial activity and production in near-surface estuarine and freshwater sediments. FEMS Microbiol Ecol 19:203–214. doi: 10.1111/j.1574-6941.1996.tb00213.x. [DOI] [Google Scholar]
- 31.Teske A, Sørensen KB. 2008. Uncultured archaea in deep marine subsurface sediments: have we caught them all? ISME J 2:3–18. doi: 10.1038/ismej.2007.90. [DOI] [PubMed] [Google Scholar]
- 32.Galand PE, Casamayor EO, Kirchman DL, Lovejoy C. 2009. Ecology of the rare microbial biosphere of the Arctic Ocean. Proc Natl Acad Sci U S A 106:22427–22432. doi: 10.1073/pnas.0908284106. [DOI] [PMC free article] [PubMed] [Google Scholar]
- 33.Lloyd KG, Albert DB, Biddle JF, Chanton JP, Pizarro O, Teske A. 2010. Spatial structure and activity of sedimentary microbial communities underlying a Beggiatoa spp. mat in a Gulf of Mexico hydrocarbon seep. PLoS One 5:e8738. doi: 10.1371/journal.pone.0008738. [DOI] [PMC free article] [PubMed] [Google Scholar]
- 34.Teske A, Durbin A, Ziervogel K, Cox C, Arnosti C. 2011. Microbial community composition and function in permanently cold seawater and sediments from an Arctic fjord of Svalbard. Appl Environ Microbiol 77:2008–2018. doi: 10.1128/AEM.01507-10. [DOI] [PMC free article] [PubMed] [Google Scholar]
- 35.Lennon JT, Muscarella ME, Placella SA, Lehmkuhl BK. 2018. How, when, and where relic DNA affects microbial diversity. mBio 9:e00637-18. doi: 10.1128/mBio.00637-18. [DOI] [PMC free article] [PubMed] [Google Scholar]
- 36.Brouwer AF, Eisenberg MC, Remais JV, Collender PA, Meza R, Eisenberg J. 2017. Modeling biphasic environmental decay of pathogens and implications for risk analysis. Environ Sci Technol 51:2186–2196. doi: 10.1021/acs.est.6b04030. [DOI] [PMC free article] [PubMed] [Google Scholar]
- 37.Bertran E, Waldeck A, Wing BA, Halevy I, Leavitt WD, Bradley AS, Johnston DT. 2020. Oxygen isotope effects during microbial sulfate reduction : applications to sediment cell abundances. ISME J 14:1508–1519. doi: 10.1038/s41396-020-0618-2. [DOI] [PMC free article] [PubMed] [Google Scholar]
- 38.Braun S, Morono Y, Littmann S, Kuypers M, Aslan H, Dong M, Jorgensen BB, Lomstein BA. 2016. Size and carbon content of sub-seafloor microbial cells at Landsort Deep, Baltic Sea. Front Microbiol 7:1375. doi: 10.3389/fmicb.2016.01375. [DOI] [PMC free article] [PubMed] [Google Scholar]
- 39.Robador A, Brüchert V, Jørgensen BB. 2009. The impact of temperature change on the activity and community composition of sulfate-reducing bacteria in arctic versus temperate marine sediments. Environ Microbiol 11:1692–1703. doi: 10.1111/j.1462-2920.2009.01896.x. [DOI] [PubMed] [Google Scholar]
- 40.Nauhaus K, Albrecht M, Elvert M, Boetius A, Widdel F. 2007. In vitro cell growth of marine archaeal-bacterial consortia during anaerobic oxidation of methane with sulfate. Environ Microbiol 9:187–196. doi: 10.1111/j.1462-2920.2006.01127.x. [DOI] [PubMed] [Google Scholar]
- 41.Finkel SE. 2006. Long-term survival during stationary phase: evolution and the GASP phenotype. Nat Rev Microbiol 4:113–120. doi: 10.1038/nrmicro1340. [DOI] [PubMed] [Google Scholar]
- 42.Lever MA, Rogers KL, Lloyd KG, Overmann J, Schink B, Thauer RK, Hoehler TM, Jørgensen BB. 2015. Life under extreme energy limitation : a synthesis of laboratory- and field-based investigations. FEMS Microbiol Rev 39:688–728. doi: 10.1093/femsre/fuv020. [DOI] [PubMed] [Google Scholar]
- 43.Hoshino T, Toki T, Ijiri A, Morono Y, Machiyama H, Ashi J, Okamura K, Inagaki F. 2017. Atribacteria from the subseafloor sedimentary biosphere disperse to the hydrosphere through submarine mud volcanoes. Front Microbiol 8:1135. doi: 10.3389/fmicb.2017.01135. [DOI] [PMC free article] [PubMed] [Google Scholar]
- 44.Chakraborty A, Ruff SE, Dong X, Ellefson ED, Li C, Brooks JM, McBee J, Bernard BB, Hubert CRJ. 2020. Hydrocarbon seepage in the deep seabed links subsurface and seafloor biospheres. Proc Natl Acad Sci U S A 117:11029–11037. doi: 10.1073/pnas.2002289117. [DOI] [PMC free article] [PubMed] [Google Scholar]
- 45.Ruff SE, Felden J, Gruber-Vodicka HR, Marcon Y, Knittel K, Ramette A, Boetius A. 2019. In situ development of a methanotrophic microbiome in deep-sea sediments. ISME J 13:197–213. doi: 10.1038/s41396-018-0263-1. [DOI] [PMC free article] [PubMed] [Google Scholar]
- 46.Kopf SH, Sessions AL, Cowley ES, Reyes C, Van Sambeek L, Hu Y, Orphan VJ, Kato R, Newman DK. 2016. Trace incorporation of heavy water reveals slow and heterogeneous pathogen growth rates in cystic fibrosis sputum. Proc Natl Acad Sci U S A 113:E110–E116. doi: 10.1073/pnas.1512057112. [DOI] [PMC free article] [PubMed] [Google Scholar]
- 47.Brock TD. 1967. Bacterial growth rate in the sea: direct analysis by thymidine autoradiography. Science 155:81–83. doi: 10.1126/science.155.3758.81. [DOI] [PubMed] [Google Scholar]
- 48.Imachi H, Nobu MK, Nakahara N, Morono Y, Ogawara M, Takaki Y, Takano Y, Uematsu K, Ikuta T, Ito M, Matsui Y, Miyazaki M, Murata K, Saito Y, Sakai S, Song C, Tasumi E, Yamanaka Y, Yamaguchi T, Kamagata Y, Tamaki H, Takai K. 2019. Isolation of an archaeon at the prokaryote-eukaryote interface. bioRxiv doi: 10.1101/726976. [DOI] [PMC free article] [PubMed]
- 49.Katayama T, Nobu MK, Kusada H, Meng X-Y, Yoshioka H, Kamagata Y, Tamaki H. 2019. Membrane-bounded nucleoid discovered in a cultivated bacterium of the candidate phylum “Atribacteria”. bioRxiv doi: 10.1101/728279. [DOI]
- 50.Yu T, Wu W, Liang W, Lever MA, Hinrichs K-U, Wang F. 2018. Growth of sedimentary Bathyarchaeota on lignin as an energy source. Proc Natl Acad Sci U S A 115:6022–6027. doi: 10.1073/pnas.1718854115. [DOI] [PMC free article] [PubMed] [Google Scholar]
- 51.Morono Y, Terada T, Nishizawa M, Ito M, Hillion F, Takahata N, Sano Y, Inagaki F. 2011. Carbon and nitrogen assimilation in deep subseafloor microbial cells. Proc Natl Acad Sci U S A 108:18295–18300. doi: 10.1073/pnas.1107763108. [DOI] [PMC free article] [PubMed] [Google Scholar]
- 52.Hatzenpichler R, Scheller S, Tavormina PL, Babin BM, Tirrell DA, Orphan VJ. 2014. In situ visualization of newly synthesized proteins in environmental microbes using amino acid tagging and click chemistry. Environ Microbiol 16:2568–2590. doi: 10.1111/1462-2920.12436. [DOI] [PMC free article] [PubMed] [Google Scholar]
- 53.Caporaso JG, Lauber CL, Walters WA, Berg-Lyons D, Huntley J, Fierer N, Owens SM, Betley J, Fraser L, Bauer M, Gormley N, Gilbert JA, Smith G, Knight R. 2012. Ultra-high-throughput microbial community analysis on the Illumina HiSeq and MiSeq platforms. ISME J 6:1621–1624. doi: 10.1038/ismej.2012.8. [DOI] [PMC free article] [PubMed] [Google Scholar]
- 54.Parada AE, Needham DM, Fuhrman JA. 2016. Every base matters : assessing small subunit rRNA primers for marine microbiomes with mock communities, time series and global field samples. Environ Microbiol 18:1403–1414. doi: 10.1111/1462-2920.13023. [DOI] [PubMed] [Google Scholar]
- 55.Pruesse E, Quast C, Knittel K, Fuchs BM, Ludwig W, Peplies J, Glöckner FO. 2007. SILVA: a comprehensive online resource for quality checked and aligned ribosomal RNA sequence data compatible with ARB. Nucleic Acids Res 35:7188–7196. doi: 10.1093/nar/gkm864. [DOI] [PMC free article] [PubMed] [Google Scholar]
- 56.Schloss PD, Westcott SL, Ryabin T, Hall JR, Hartmann M, Hollister EB, Lesniewski RA, Oakley BB, Parks DH, Robinson CJ, Sahl JW, Stres B, Thallinger GG, Van Horn DJ, Weber CF. 2009. Introducing mothur: open-source, platform-independent, community-supported software for describing and comparing microbial communities. Appl Environ Microbiol 75:7537–7541. doi: 10.1128/AEM.01541-09. [DOI] [PMC free article] [PubMed] [Google Scholar]
- 57.Lloyd KG, Schreiber L, Petersen DG, Kjeldsen KU, Lever MA, Steen AD, Stepanauskas R, Richter M, Kleindienst S, Lenk S, Schramm A, Jørgensen BB. 2013. Predominant archaea in marine sediments degrade detrital proteins. Nature 496:215–218. doi: 10.1038/nature12033. [DOI] [PubMed] [Google Scholar]
- 58.Stahl DA, Amann R. 1991. Development and application of nucleic acid probes. John Wiley & Sons, Chichester, UK. [Google Scholar]
- 59.Yu Y, Lee C, Kim J, Hwang S. 2005. Group-specific primer and probe sets to detect methanogenic communities using quantitative real-time polymerase chain reaction. Biotechnol Bioeng 89:670–679. doi: 10.1002/bit.20347. [DOI] [PubMed] [Google Scholar]
- 60.Nadkarni MA, Martin FE, Jacques NA, Hunter N. 2002. Determination of bacterial load by real-time PCR using a broad-range (universal) probe and primers set. Microbiology 148:257–266. doi: 10.1099/00221287-148-1-257. [DOI] [PubMed] [Google Scholar]
- 61.Larowe DE, Amend JP. 2015. Power limits for microbial life. Front Microbiol 6:718. doi: 10.3389/fmicb.2015.00718. [DOI] [PMC free article] [PubMed] [Google Scholar]
Associated Data
This section collects any data citations, data availability statements, or supplementary materials included in this article.
Supplementary Materials
Data Availability Statement
16S rRNA gene reads were deposited in the NCBI Sequence Read Archive (SRA) with BioProject accession numbers PRJNA614649 for WOR sediments and PRJNA321388 for CLB incubations.