Abstract
PD-1 blockade has transformed the management of advanced clear cell renal cell carcinoma (ccRCC), but the drivers and resistors of PD-1 response remain incompletely elucidated. Here, we analyzed 592 tumors from advanced ccRCC patients enrolled in prospective clinical trials of treatment with PD-1 blockade by whole-exome and RNA-sequencing, integrated with immunofluorescence analysis, to uncover the immunogenomic determinants of therapeutic response. While conventional genomic markers (tumor mutation burden, neoantigen load) and degree of CD8+ T cell infiltration were not associated with clinical response, we discovered numerous chromosomal alterations associated with response or resistance to PD-1 blockade. These advanced ccRCC tumors were highly CD8+ T cell infiltrated, with only 27% having a non-infiltrated phenotype. Our analysis revealed that infiltrated tumors are depleted of favorable PBRM1 mutations and enriched for unfavorable chromosomal losses of 9p21.3 when compared to non-infiltrated tumors, demonstrating how the potential interplay of immunophenotypes with somatic alterations impacts therapeutic efficacy.
Keywords: Renal cell carcinoma, Immunotherapy, Programmed Cell Death 1 Receptor/antagonists and Inhibitors, Genomics, Gene Expression Profiling
Immune checkpoint inhibitors (ICI) have become a key component of the therapeutic armamentarium for many cancer types1. PD-1 blockade has been particularly transformative for the management of advanced clear cell renal cell carcinoma (ccRCC), where anti-PD-1 based therapies are now standard-of-care options in both the front-line and treatment refractory settings2–6. Across solid tumor malignancies, response to PD-1 blockade has been associated with numerous tumor-intrinsic (e.g. high tumor mutation burden7, high neoantigen load8) and microenvironment features (an increased infiltration by T cells9,10). In contrast to most other types of anti-PD-1 responsive solid tumors, ccRCC has only a modest mutation burden11. Moreover, a high infiltration by CD8+ T cells in this setting has been previously associated with a worse prognosis12. Previous genetic characterizations of ccRCC have contributed greatly to our knowledge of its tumor biology and its disease progression13,14, but the role of genomic alterations and patterns of immune infiltration (i.e. CD8+ T cell inflamed, excluded, or desert)15,16 in responsiveness to PD-1 blockade remain undefined. Drawing from three prospective clinical trials of PD-1 blockade (with one study where mTOR inhibition was administered to the control arm) in advanced ccRCC2,17,18, we performed an integrated genetic, transcriptomic, and immunopathologic analysis of advanced-stage ccRCC tumors from 592 patients. This analysis uncovered the landscape of somatic alterations in advanced ccRCC, and defined novel copy number changes associated with both the patterns of immune infiltration in ccRCC and the clinical outcome to PD-1 blockade.
Genomic features of advanced ccRCC
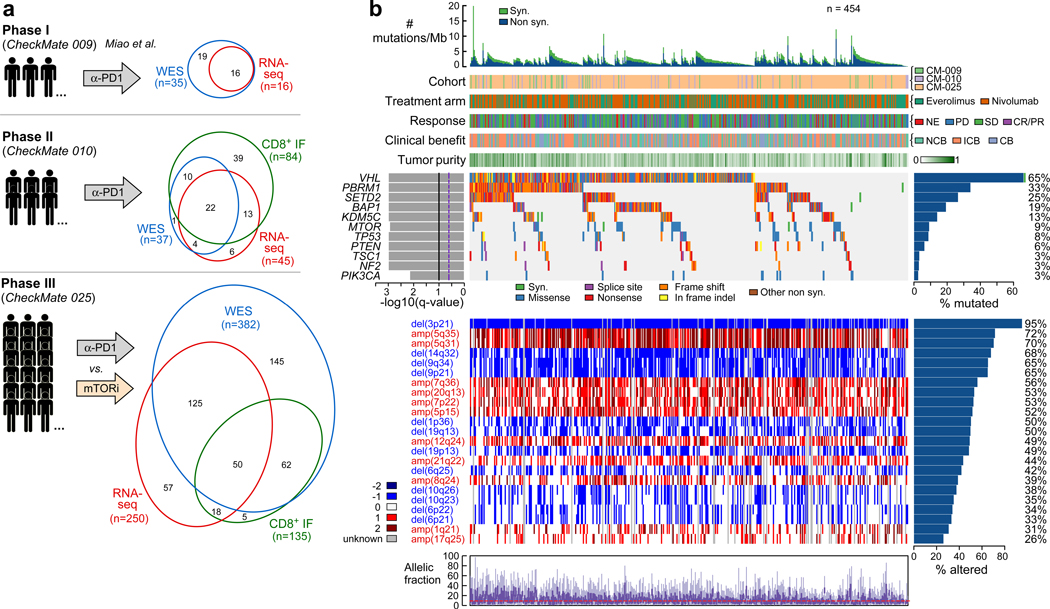
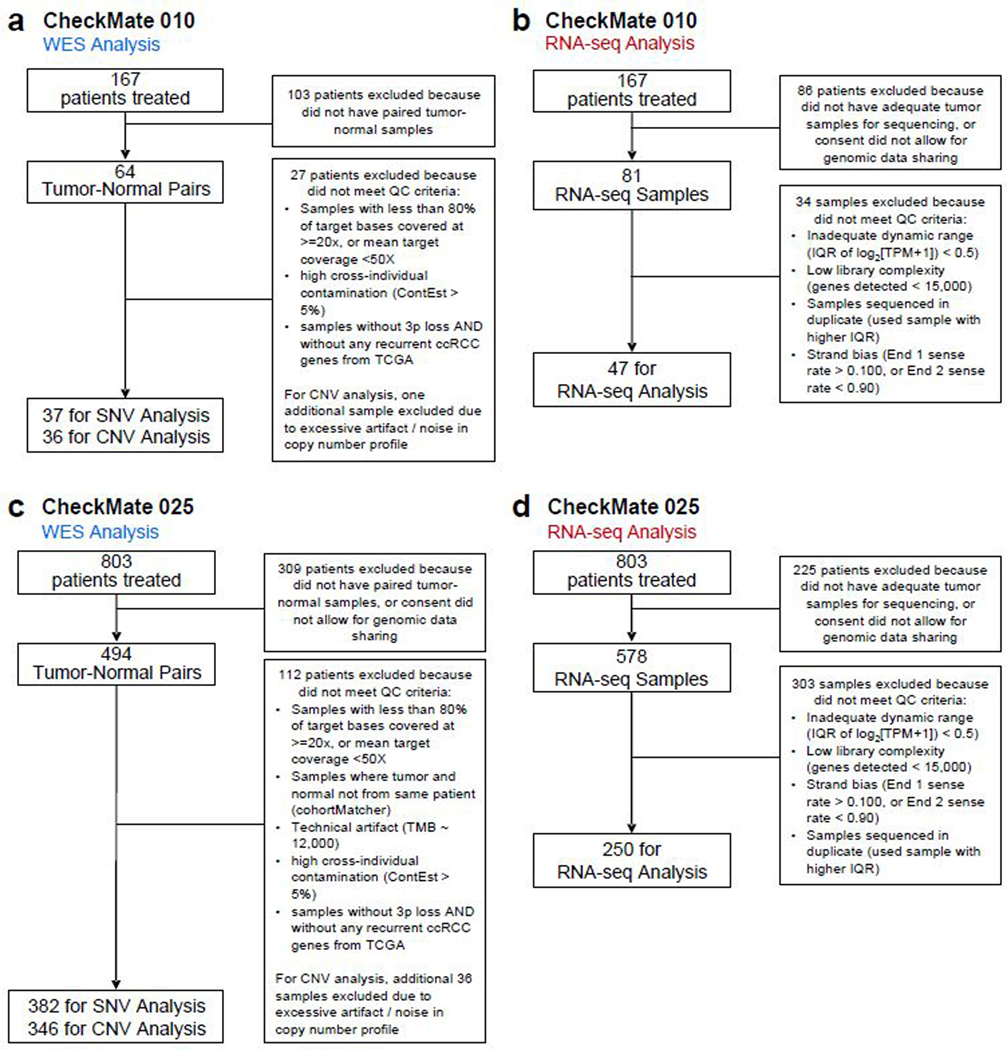
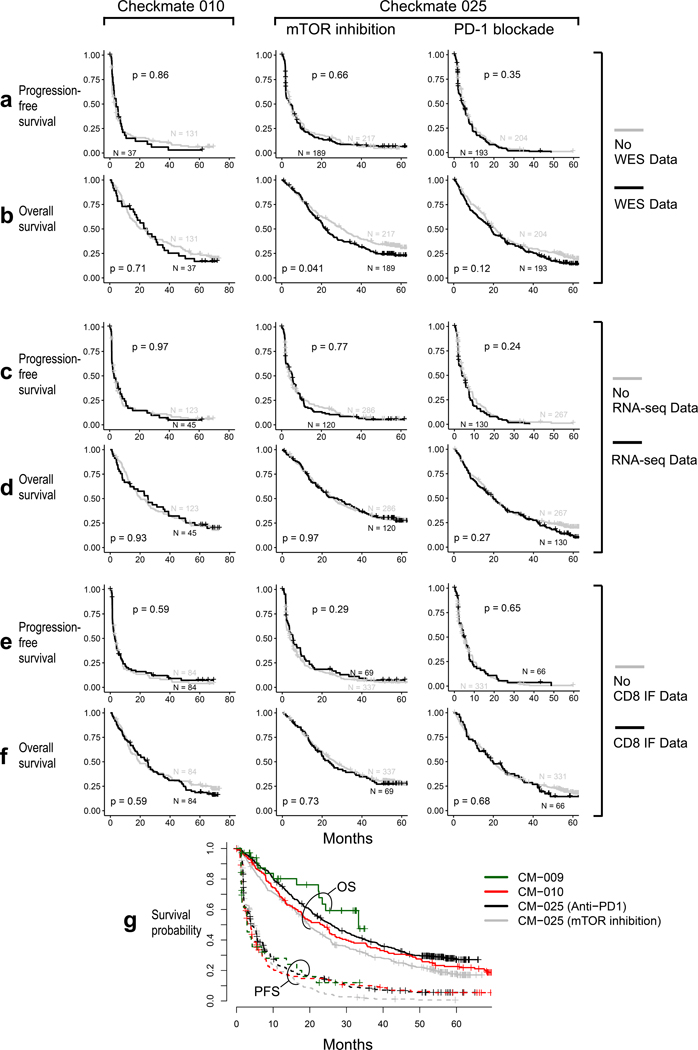
Nivolumab (anti-PD-1) attained FDA-approval for the treatment of ccRCC based on the results of CheckMate 025 (CM-025), a randomized phase III trial which demonstrated an overall survival (OS) benefit with nivolumab over the mTOR inhibitor everolimus in previously treated patients with ccRCC2. This trial followed phase I and phase II studies conducted in a similar clinical setting (CheckMate 009 [CM-009]19, and CheckMate 010 [CM-010], respectively). We performed whole-exome sequencing (WES) of DNA extracted from clinically annotated tumor specimens and from whole blood (as matched germline source) from patients enrolled on CM-010 and CM-025. From the tumor specimens, we also generated RNA-sequencing (RNA-seq) data, and undertook spatial analysis of CD8+ T cell infiltrates by immunofluorescence (IF) (Fig. 1a, patient sample-level information, including clinical annotation, is provided in Supplementary Table 1). These data were further combined with existing WES and RNA-seq data generated from CM-00919. Following quality control (Extended Data Fig. 1), WES data were available from 454 patients (261 patients treated with anti-PD1, 193 patients treated with mTOR inhibition; Supplementary Table 2). No significant differences in clinical response rates or progression-free survival (PFS) were observed between patients included in this study after quality control filtering, and those who were excluded due to lack of available tumor material, consent for genomic studies, or high-quality sequencing data (Extended Data Fig. 2).
Figure 1.
Somatic alteration landscape of the Checkmate cohorts. (a) Immunogenomic characterization of Checkmate cohorts. WES, RNA-seq and IF data were generated from samples collected prior to PD-1 blockade (or mTOR inhibition) from three prospective clinical trials (Checkmate-009, −010, −025). (b) Somatic alterations in ccRCC. Top histogram, mutation rate per sample; Top tracks, indication of cohort and treatment arm, clinical outcome and purity of each sample. Left histograms, MutSig2CV significance for recurrently mutated genes; right histograms, frequency of somatic alterations. Upper heatmap, distribution of synonymous and nonsynonymous mutation events; middle heatmap, distribution of copy number events (negative values indicating loss, positive indicating gain; 1 and 2 indicating low and high amplitude, respectively). Lower chart, allele fractions per sample.
By applying MutSig2CV20, we identified 17 recurrently mutated genes (q < 0.05; Supplementary Table 3), 11 of which were found in at least 10 patient samples (Fig 1b). In agreement with previous large-scale sequencing studies13, the top putative candidate drivers from these cohorts with advanced ccRCC were VHL (65%), PBRM1 (33%), SETD2 (25%), BAP1 (19%), and KDM5C (13%). We also identified frequent somatic single nucleotide variants (sSNVs) in the PI(3)K-AKT-mTOR pathway, including MTOR (9%), PTEN (6%), TSC1 (3%) and PIK3CA (3%) mutations. Numerous significantly recurrent copy number alterations were identified (Supplementary Table 3). By GISTIC221, nearly all samples (95%) had loss of chromosome 3p, a defining feature of ccRCC that is frequently concurrent with 5q gain (found in 72% of our cohorts)22. We also detected a high frequency of 9p (65%) and 14q (68%) losses, events previously identified as hallmark drivers of ccRCC metastasis14 (Fig 1b).
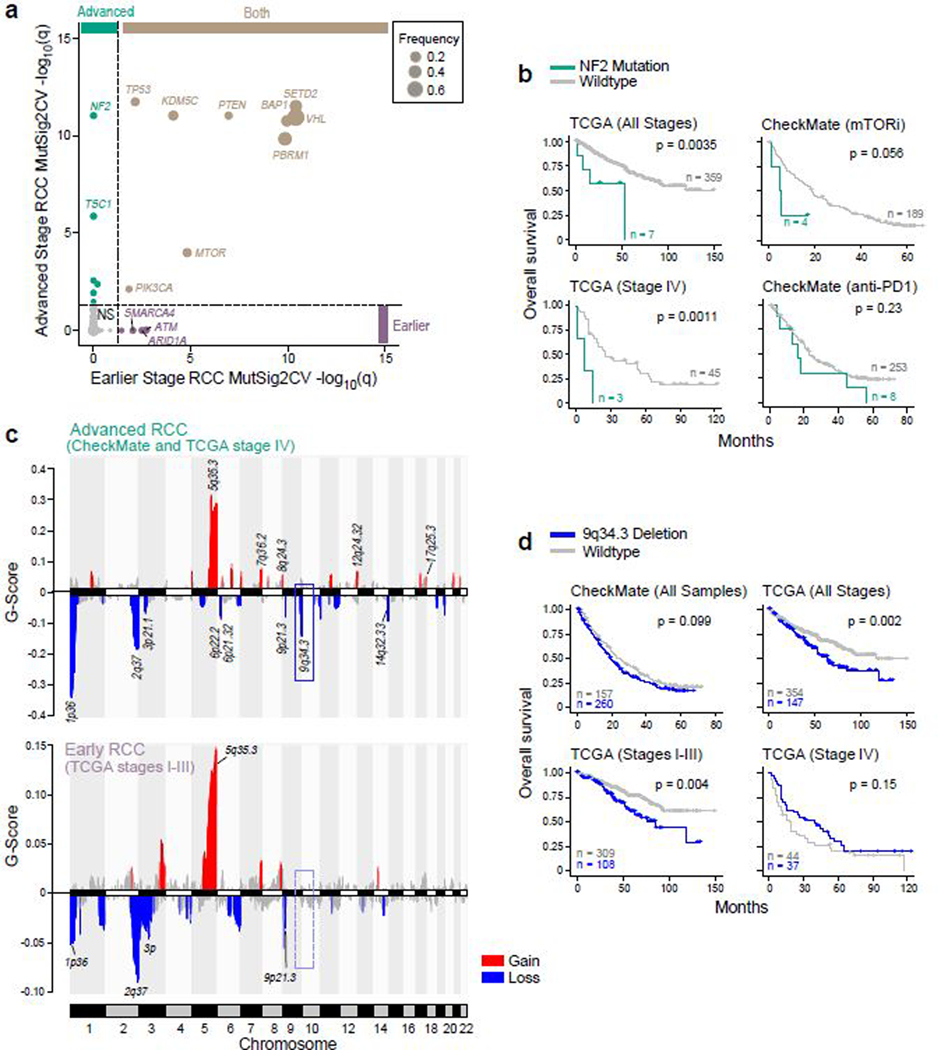
To determine whether advanced ccRCC (stage IV) is enriched for particular somatic alterations compared to earlier (stage I-III) disease, we compared the data generated from the CheckMate cohorts (where all patients had advanced disease at the time of trial enrollment) with TCGA ccRCC data (n=366 with mutation data; n=501 with copy number data), of which fewer than 20% of patients had stage IV disease (Fig. 2, Supplementary Table 3). The most common significantly mutated genes (i.e. VHL, PBRM1, SETD2, BAP1, KDM5C) were recurrent in both earlier and advanced disease (Fig. 2a). Earlier stage disease had recurrent mutations in members of the mammalian SWI/SNF chromatin remodeling complexes23 (ARID1A and SMARCA4) and in the DNA damage repair pathway (ATM). In contrast, in advanced disease we identified recurrent mutations in the PI(3)K-AKT-mTOR pathway member TSC1, and in NF2, a tumor suppressor that encodes a member of the Hippo signaling pathway. NF2 mutations have previously been described in other aggressive kidney cancer histologies, including unclassified RCC24, collecting duct cacinoma25, sarcomatoid histology26, and type 2 papillary RCC27. Here, we found NF2 mutations to associate with a worse overall survival (OS) in all stages of ccRCC, though this appeared to be abrogated by PD-1 blockade (Fig. 2b).
Figure 2.
Genomic features of advanced renal cell carcinoma (RCC) tumors. (a) NF2 and TSC1 genes are recurrently mutated in advanced RCC. MutSig2CV q-values for early stage RCC (TCGA stages I-III, n = 452 patients) versus corresponding q-values for advanced stage RCC samples (CheckMate cohorts + TCGA stage IV, n = 1089 patients). Dotted lines indicate a MutSig2CV FDR threshold of q = 0.05. (b) NF2 mutations are associated with worse OS across RCC stages (two-sided log-rank test). (c) 9q34.3 locus is recurrently deleted in advanced RCC. Upper panel, GISTIC2 peaks in advanced RCC. Lower panel, GISTIC2 peaks in earlier stage RCC. Recurrent copy number events (GISTIC2 q < 0.1) are colored by gain and loss. (d) 9q34.3 loss is associated with worse OS in earlier stage disease (two-sided log-rank test).
Our analysis also revealed advanced ccRCC (Fig. 2c, Supplementary Table 3) to be enriched for recurrent losses in chromosome 6p21.32 and 6p22.2, that contain members of the immunoproteasome (PSMB8, PSMB9), antigen presentation machinery (TAP1, TAP2, TAPBP), and HLA class II alleles. We also identified loss of 9q34.3 as a frequent event in advanced RCC. The broader 9q34 region includes TSC128, while the 9q34.3 cytoband specifically contains numerous histone lysine methyltransferases.29 Of note, 9q34.3 loss was not associated with altered survival in patients who already had advanced disease, but rather was associated with worse survival only in patients with earlier stage disease (Fig. 2d).
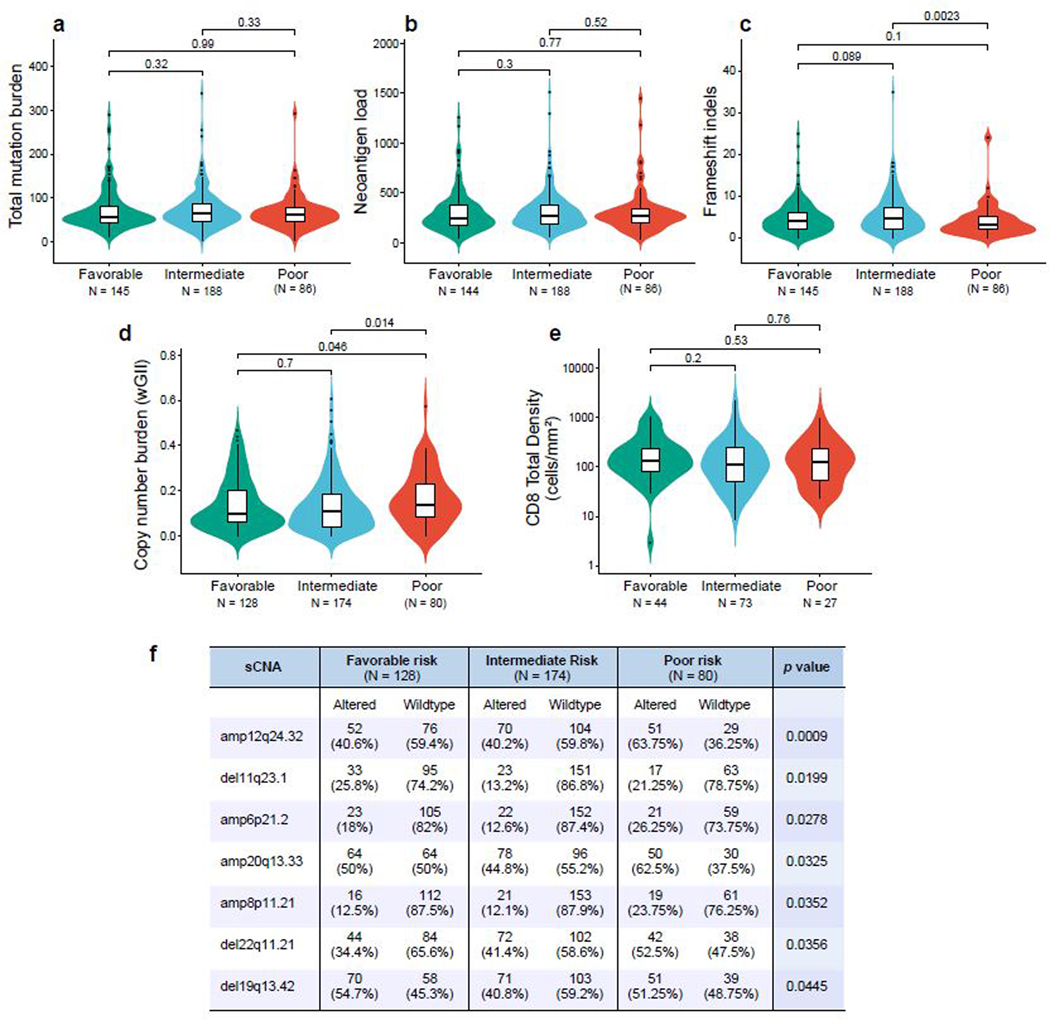
Within advanced ccRCC, validated prognostic models have been used to stratify patients as favorable, intermediate, or poor risk based on a combination of clinical and laboratory parameters30,31. We examined whether genomic features differed between prognostic risk groups (Extended Data Fig 3). There were no differences in the total number of nonsynonymous mutations or neoantigens between risk groups. However, poor risk tumors did have a higher somatic copy number alteration burden (as measured by the weighted genome integrity index, wGII), which has previously been associated with a more aggressive phenotype in ccRCC14.
Somatic alteration burden and HLA zygosity are not associated with therapeutic outcomes
Somatic alterations can lead to the formation of neoantigens; neoantigen load per tumor has been associated with response to PD-1 blockade in several tumor types.8,32,33 Although ccRCC has a modest total mutation burden, it has a relatively high proportion of frameshift insertions and deletions (indels), which can potentially generate novel open reading frames (neoORFs) and consequently, may provide a rich source of neoantigens34. To investigate whether the somatic alteration burden in ccRCC is indeed associated with response to PD-1 blockade, we categorized ccRCC specimens based on previously defined criteria for clinical response, namely either conventional objective response categories or “clinical benefit” criteria19. Briefly, patients with objective responses (complete or partial), or stable disease with tumor shrinkage and PFS of at least 6 months, were classified as having clinical benefit (CB). Patients with progressive disease and PFS less than 3 months were classified as having no clinical benefit (NCB). All other patients were classified as intermediate clinical benefit (ICB). For our analysis, we compared responding (CB) patients with therapy-resistant (NCB) patients.
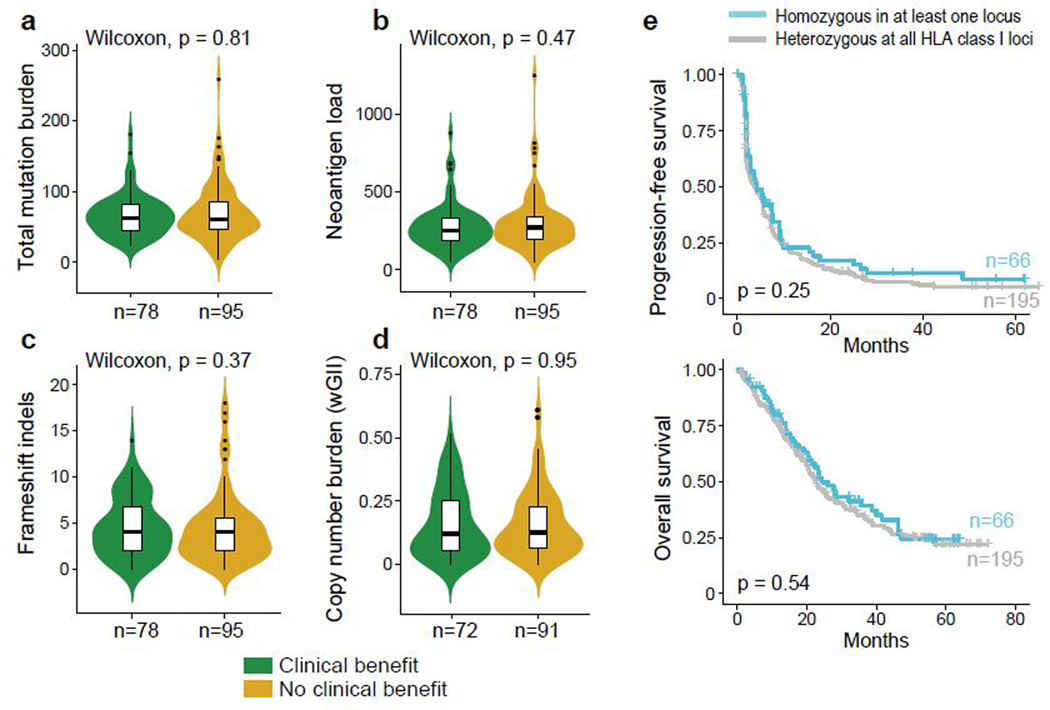
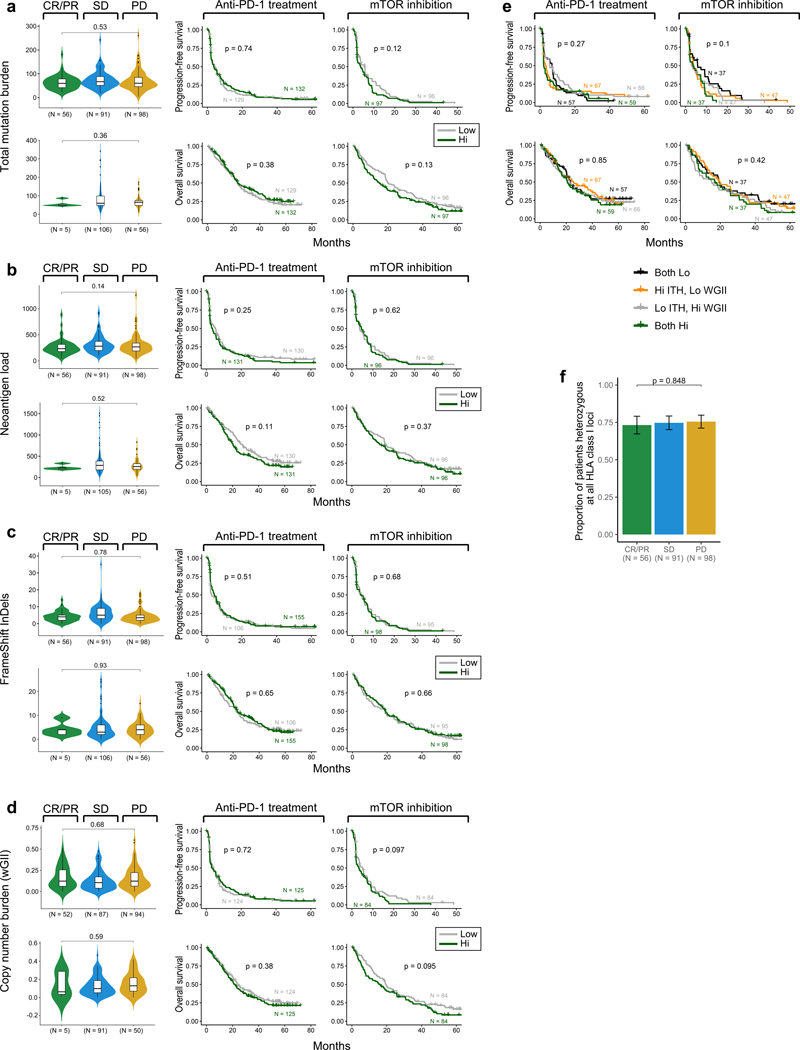
In our study cohorts, neither the total number of nonsynonymous mutations (Fig. 3a), neoantigens (Fig. 3b), frameshift indels (Fig. 3c), nor somatic copy number alterations (wGII; Fig. 3d)14 was associated with clinical response or improved survival with PD-1 blockade or mTOR inhibition (Extended Data Fig. 4). Germline factors, such as HLA class I genotype, can affect the ability to present immunogenic antigens, and therefore also may influence response to PD-1 blockade. However, we did not find any association between maximal HLA class I heterozygosity (i.e. heterozygous at HLA-A, HLA-B, and HLA-C) and improved survival with PD-1 blockade in these ccRCC cohorts (Fig. 3e).
Figure 3.
Somatic alteration burden and HLA zygosity are not associated with clinical outcome with PD-1 blockade. (a-d). Measures of sample-wide somatic burden, including number of (a) tumor mutations, (b) neoantigen load, (c) frameshift indels and (d) weighted genome integrity index (wGII) were not associated with clinical benefit with PD-1 blockade (two-sided Wilcoxon rank-sum test). Boxplot hinges represent 25th to 75th percentiles, central lines represent the medians, the whiskers extend to highest and lowest values no greater than 1.5× interquartile range and the dots indicate outliers; the violin component refers to the kernel probability density and encompasses all cells. (e) HLA zygosity was not associated with progression-free or overall survival (two-sided log-rank test).
Genomic correlates of response and resistance to PD-1 blockade
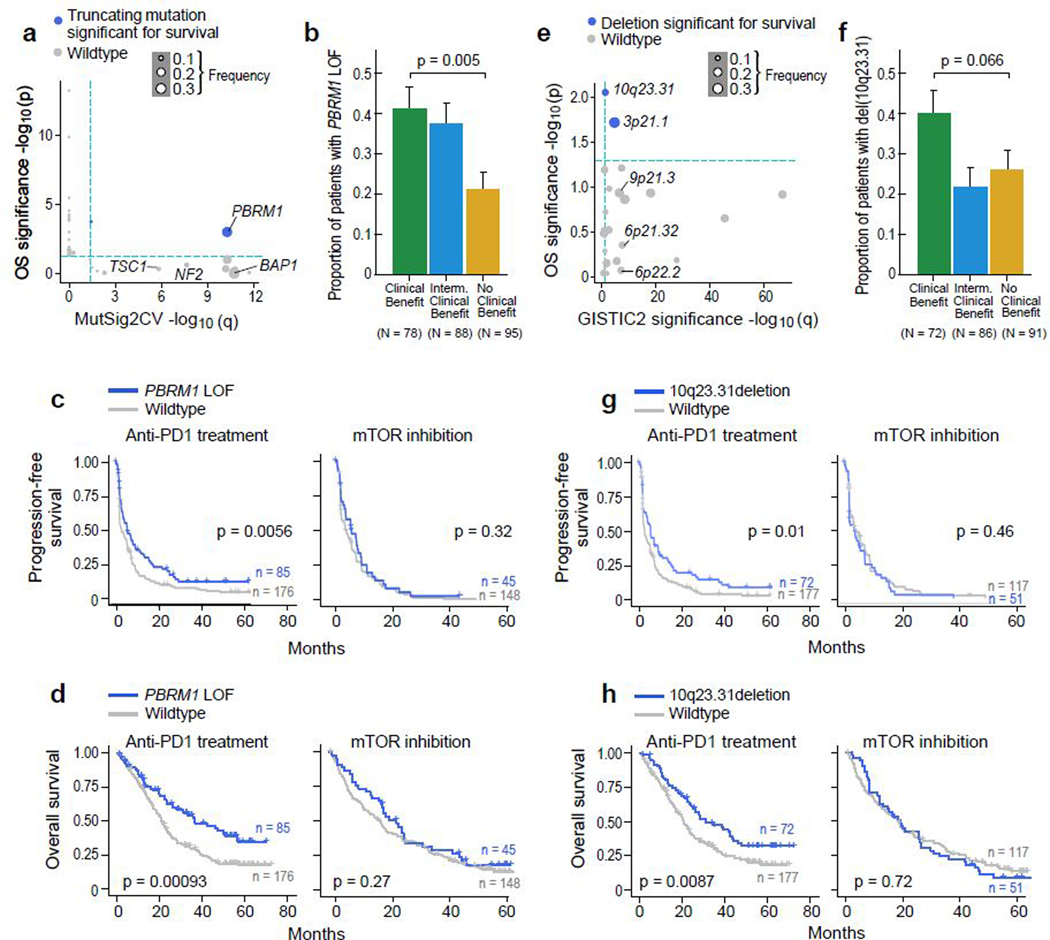
We systematically evaluated whether any individual mutations or copy number alterations were associated with response or resistance to PD-1 blockade by determining if any (i) were significantly recurrent (using MutSig2CV for mutations, and GISTIC2 for copy number alterations), and further, (ii) had a significant effect on survival (PFS and OS) with PD-1 blockade but not with mTOR inhibition. For sSNVs and somatic insertion and deletions (sIndels), we focused on truncating mutations (frameshift indels, nonsense, and splice site mutations), as these are most likely to lead to loss-of-function19. Within the CM-009 cohort, truncating mutations in PBRM1 were previously associated with improved survival following PD-1 blockade in previously treated (anti-angiogenic-refractory) patients19, which was then validated using the CM-025 cohort35. Our pooled analysis of all three cohorts (consisting mostly of previously treated, anti-angiogenic-refractory patients) again demonstrated the association of truncating mutations in PBRM1 with improved response and survival (p < 0.001 for OS). We found that PBRM1 alterations were associated with higher angiogenesis gene expression36 (p < 0.001, Wilcoxon rank-sum test for angiogenesis signature), but lower IL6-JAK-STAT3 signaling (p = 0.01 for ssGSEA scores). No other recurrent sSNVs or sIndels were associated with improved survival with PD-1 blockade (Fig. 4a-d, Extended Data Fig. 5a for PFS).
Figure 4.
Genomic correlates of response and resistance to anti-PD-1 therapy. (a) PBRM1 truncating mutations are recurrent (MutSig2CV q < 0.05) and associated with better survival (p < 0.05, two-sided univariable cox regression with mutation status as a categorical covariate) with anti-PD-1 therapy (n = 249 patients with anti-PD-1 therapy). Truncating mutations in PBRM1 are associated with improved (b) response (p = 0.005, two-sided Fisher’s exact test for clinical benefit vs. no clinical benefit tumors. Error bars are SEM and measure of center is mean), (c) PFS, and (d) OS with PD-1 blockade but not with mTOR inhibition (two-sided log-rank test). (e) Deletions in 10q23.31 are recurrent (GISTIC2 q < 0.1) and associated with improved progression-free and overall survival (p < 0.05, two-sided univariate cox regression with copy number deletion status as a categorical covariate) following anti-PD-1 therapy but not mTOR inhibition (two-sided log-rank test, n = 249 patients with anti-PD-1 therapy). Deletions in 10q23.31 are associated with (f) response (p = 0.066, two-sided Fisher’s exact test for clinical benefit vs. no clinical benefit tumors. Error bars are SEM and measure of center is mean), (g) PFS, and (h) OS with PD-1 blockade but not with mTOR inhibition (two-sided log-rank test).
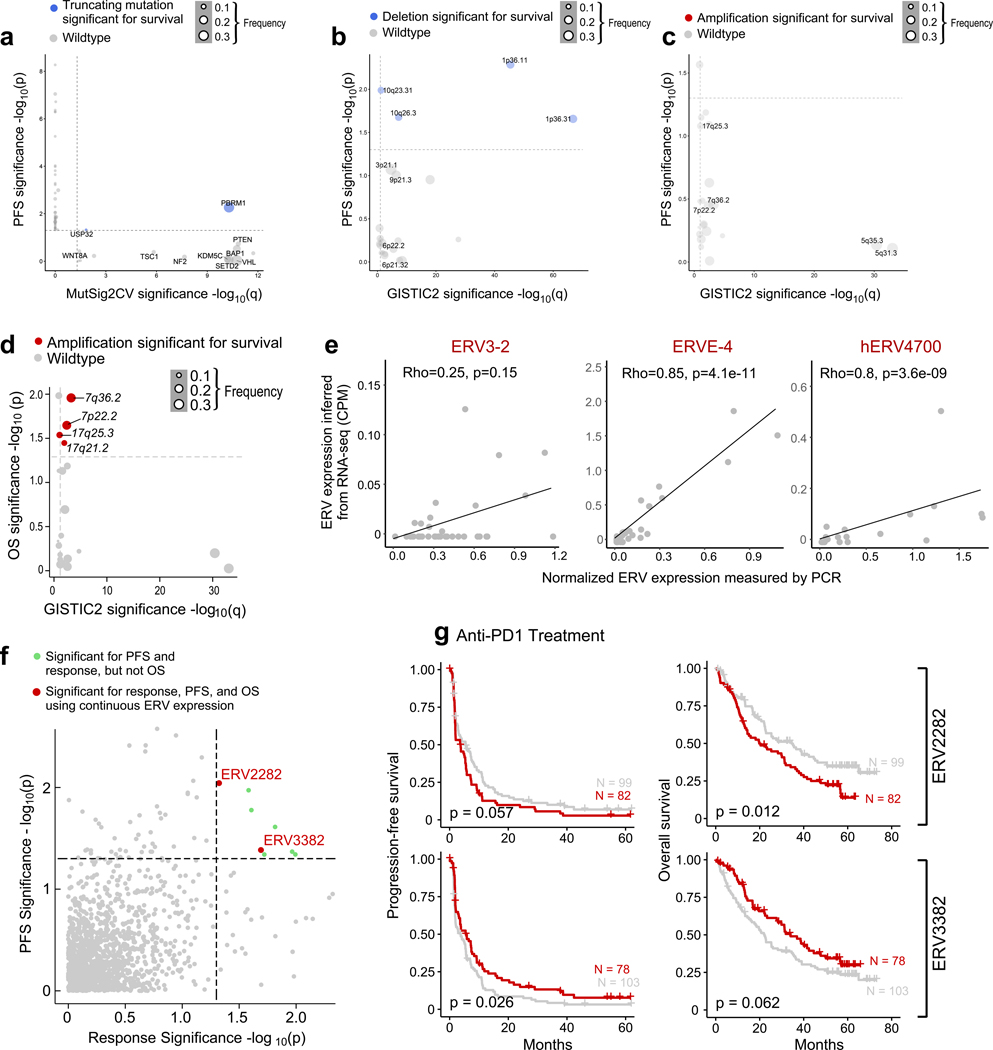
Among the significantly recurrent somatic copy number alterations (sCNAs), only focal loss of 10q23.31 (in 35% of tumors) was associated with improved PFS and OS following PD-1 blockade, but not mTOR inhibition (Fig. 4e-h, Extended Data Fig. 5b for PFS). The 10q23.31 cytoband contains the tumor suppressor PTEN – whose loss previously has been shown to associate with increased PI(3)K-AKT-mTOR pathway activity and resistance to PD-1 blockade37,38. By gene set enrichment analysis (GSEA)39 using the 50 Hallmark genes sets from the Molecular Signatures Database40, ccRCC tumors with del(10q23.31) did not reveal an increase in mTOR pathway activity, arguing against a functional role for PTEN loss in these patients. The only enriched gene signature associated with 10q23.31 loss involved Hedgehog signaling (q = 0.18, Wilcoxon rank-sum test). Of note, multiple negative regulators of Hedgehog signaling, including SUFU and BTRC, are located on chromosome 10q, slightly distal to PTEN (10q24.32)41, and thus may play a functional role in these patients. In contrast, no chromosomal gains were associated with both PFS and OS after anti-PD-1 therapy (Extended Data Fig. 5c-d)
Human endogenous retroviruses (ERVs) are aberrantly expressed in ccRCC42,43, with specific ERVs associated with improved response to ICI44, and one ERV epitope (derived from HERVE-4) identified as target antigen in a long-term responder to allogeneic stem cell transplant for ccRCC45. We therefore evaluated whether ERV expression was associated with response or survival in this cohort. We experimentally validated RNA-seq—based inference of ERV expression by RT-qPCR (Extended Data Fig. 5e). Of note, ERV3–2 expression was not reliably inferred using RNA-seq data, highlighting a potential limitation of using RNA-seq to measure ERV expression in FFPE tissue. With this notable constraint, we identified two ERVs (out of 3,173) that were potentially weakly associated with clinical outcomes in this anti-PD-1 treated cohort (Extended Data Fig. 5f-g).
Baseline CD8+ T cell infiltration does not predict response to PD-1 blockade
Beyond tumor-intrinsic properties, a common paradigm in solid tumor immunology is that effective responses to PD-1 blockade occur when tumors are highly inflamed with CD8+ T cells (“infiltrated” or “hot” tumors), and that tumors lacking such an infiltrate (“deserts” or immunologically “cold” tumors) are resistant to these therapies15,16. Another proposed mechanism of resistance is immune exclusion, whereby CD8+ T cells are recruited to the tumor, but are unable to infiltrate the tumor core. Immune exclusion was recently described in nearly 50% of metastatic urothelial carcinoma, and was associated with resistance to PD-L1 blockade10.
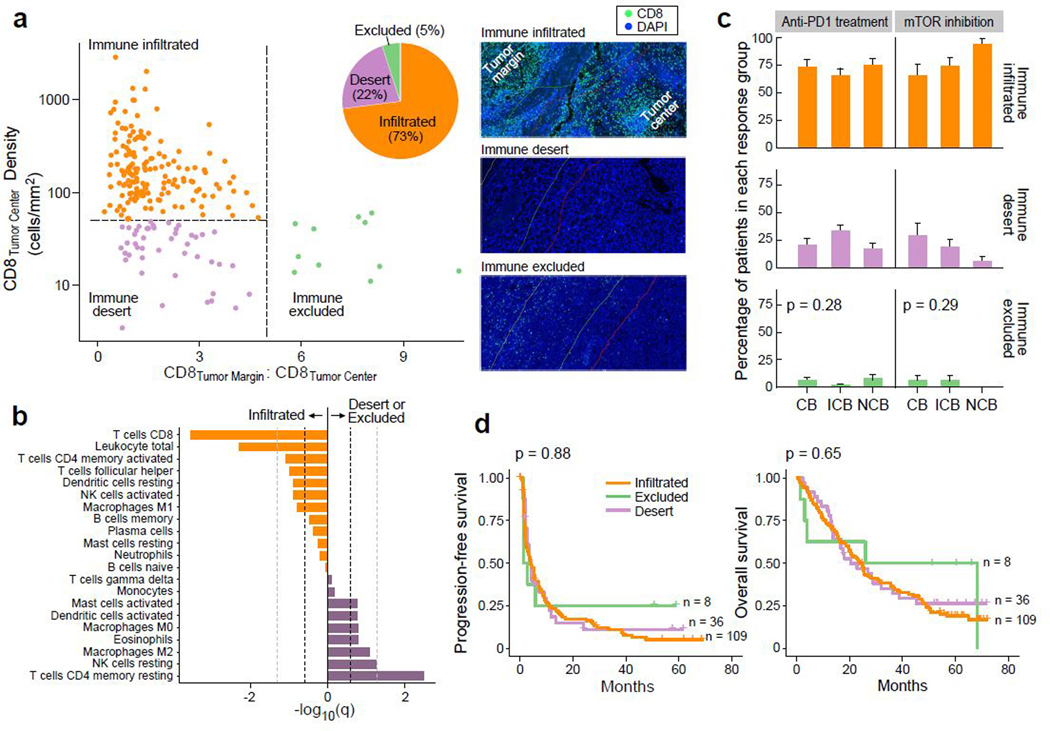
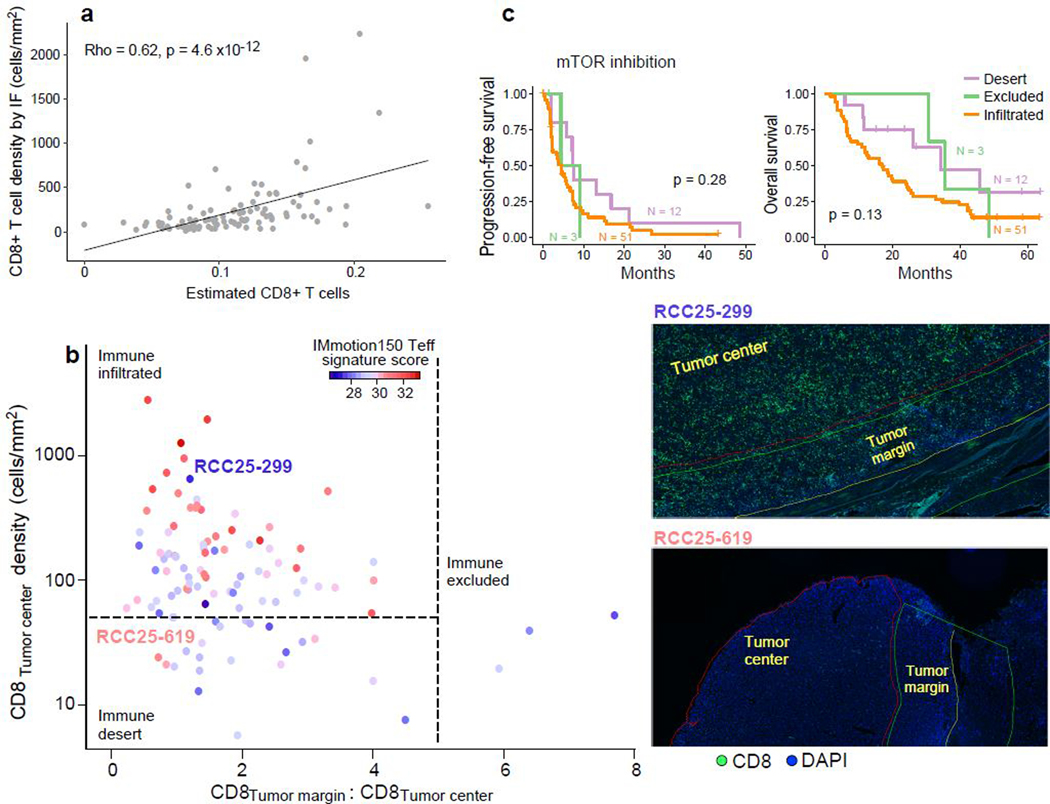
To establish the patterns of CD8+ T cell infiltration in advanced ccRCC, and explore their associations with response to anti-PD-1 therapy, we performed CD8 IF analysis on 219 tumor samples (153 treated with PD-1 blockade, 66 treated with mTOR inhibition), quantifying the density of CD8+ cells in the tumor center and the tumor margin (Fig. 5a). Tumors were categorized as either “immune excluded” (at least five-fold greater CD8+ T cells in the tumor margin than in the tumor center), “immune desert” (not excluded, and below the 25th percentile for CD8+ T cells [50 cells/mm2] in the tumor center), or “immune infiltrated” (not excluded, and at or above the 25th percentile for CD8+ T cells in the tumor center). Unlike urothelial cancer, only 5% of ccRCC were immune excluded, while the majority (73%) were immune infiltrated (median: 155 CD8+ T cells/mm2). By immune deconvolution of the matched bulk transcriptomes (using CIBERSORTx)46 (Fig. 5b, Extended Data Fig. 6a), we observed that infiltrated tumors were enriched in anti-tumorigenic M1 macrophages, activated CD4+ memory T cells and activated NK cells. By contrast, CD8+ deserts and excluded tumors were enriched in pro-tumorigenic M2 macrophages, resting CD4+ memory T cells and resting NK cells. This is consistent with prior reports demonstrating an association between CD8+ T cell infiltration and NK cell, CD4+ T cell, and macrophage cells expressing anti-tumorigenic markers in ccRCC47. However, the use of transcriptomic data to infer immune cell infiltration can lead to misclassifications (Extended Data Fig. 6b).
Figure 5.
Baseline CD8+ infiltration of RCC tumors is not associated with response to anti-PD-1 therapy. (a) The majority of ccRCC samples (73%) are infiltrated with CD8+ T cells (n = 160 for infiltrated, n = 48 for desert, n = 11 for excluded groups). Thresholds of tumor center density (horizontal dotted line; 25th percentile or 50 CD8+ T cells/mm2) and ratio of tumor margin to tumor center densities (vertical dotted line; CD8 tumor margin:tumor center ratio >=5) were used for immune phenotyping, and classifications were confirmed by manual review by pathologists (see Methods). Right panels, CD8 and DAPI staining of representative samples (from n = 219 stained samples) classified as immune infiltrated (top), desert (middle) and excluded (bottom). (b) Immune compartments with a higher relative proportion in immune infiltrated and non-infiltrated samples, by CIBERSORTx deconvolution of RNA-seq data. Dotted lines indicate FDR threshold of q = 0.25 (dark) and q = 0.05 (light) respectively (two-sided Wilcoxon rank-sum test and Benjamini-Hochberg method for FDR correction, n = 79 infiltrated and n = 24 non-infiltrated). (c-d). No association was observed between immune infiltration phenotype and (c) clinical benefit (two-sided chi-squared test, n = 153 patients with anti-PD-1 treatment and n = 66 patients with mTOR inhibition. Error bars are SEM and measure of center is mean.) or (d) survival (two-sided log-rank test) with PD-1 blockade.
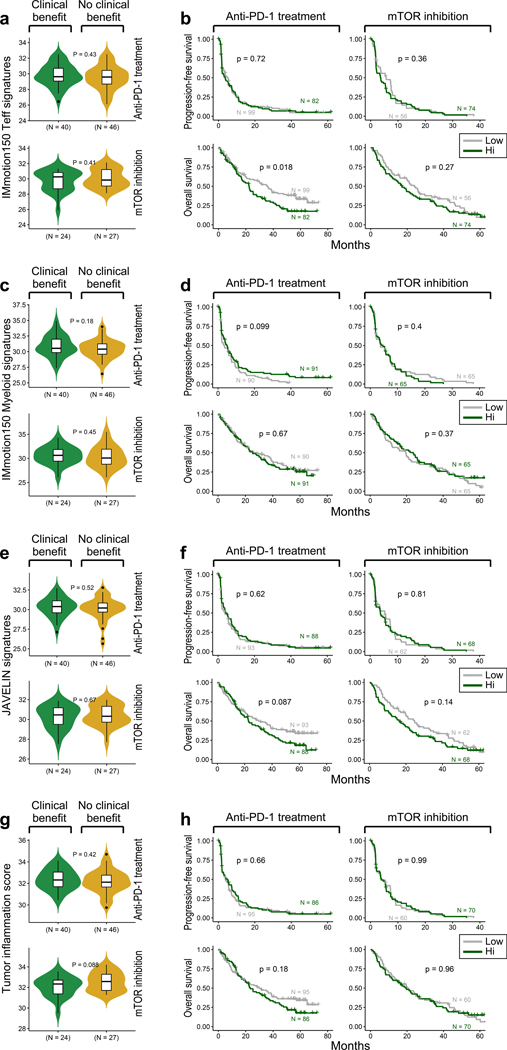
We observed no difference in the proportions of infiltrated, desert, or excluded tumors between patients who experienced clinical benefit, intermediate clinical benefit, or no clinical benefit with anti-PD-1 therapy (p = 0.28) or mTOR inhibition (p = 0.29, Fig. 5c). There was no difference in PFS or OS between the different immune phenotypes in patients treated with PD-1 blockade (Fig. 5d) or mTOR inhibition (Extended Data Fig. 6c). Further, we assessed numerous immune-related gene expression signatures36,48,49, but did not observe any association between high signature expression and improved response or survival with anti-PD-1 therapy (Extended Data Fig. 7).
Interplay of immune phenotypes and somatic alterations influence response to PD-1 blockade
Given the unexpected finding that tumors with immune excluded and desert phenotypes (“non-infiltrated”) respond similarly to PD-1 blockade as CD8+ T cell infiltrated tumors, we investigated whether any tumor-intrinsic features affect response within the context of different immune subtypes. We therefore systematically evaluated somatic events for preferential enrichment in either infiltrated or non-infiltrated tumors.
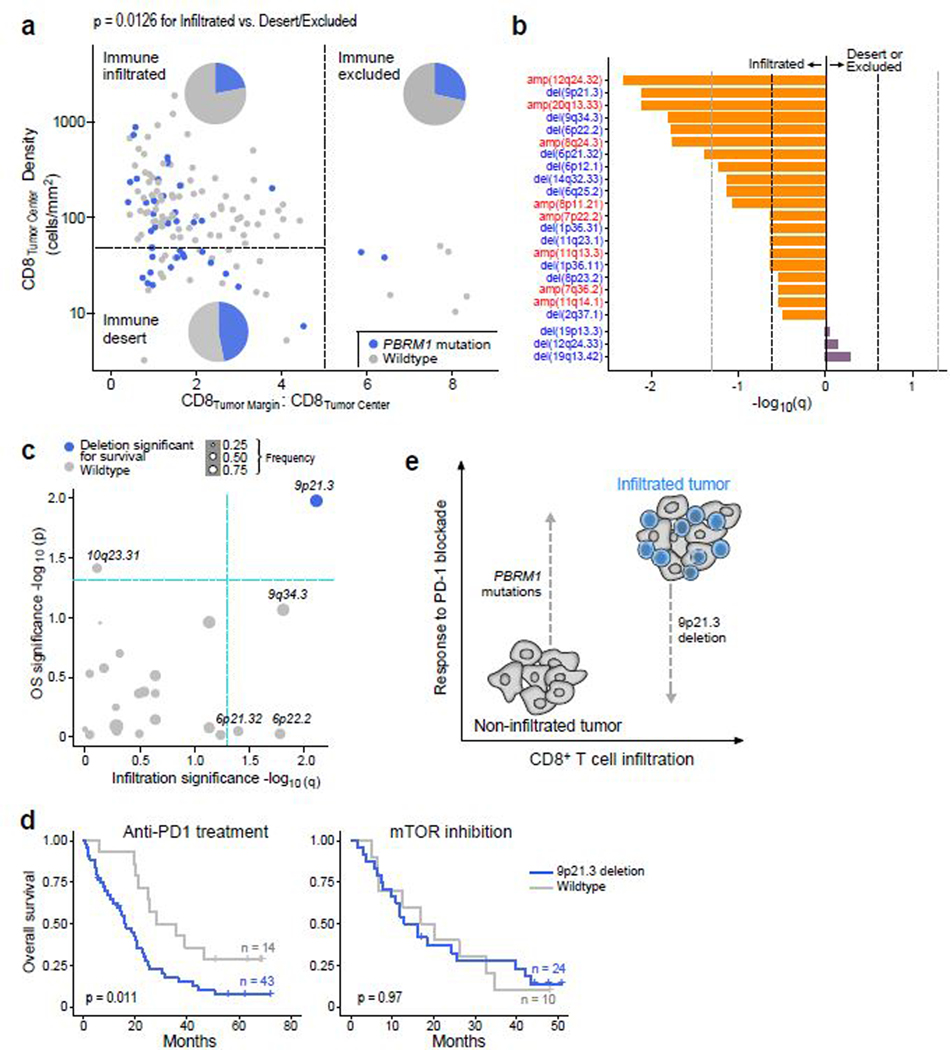
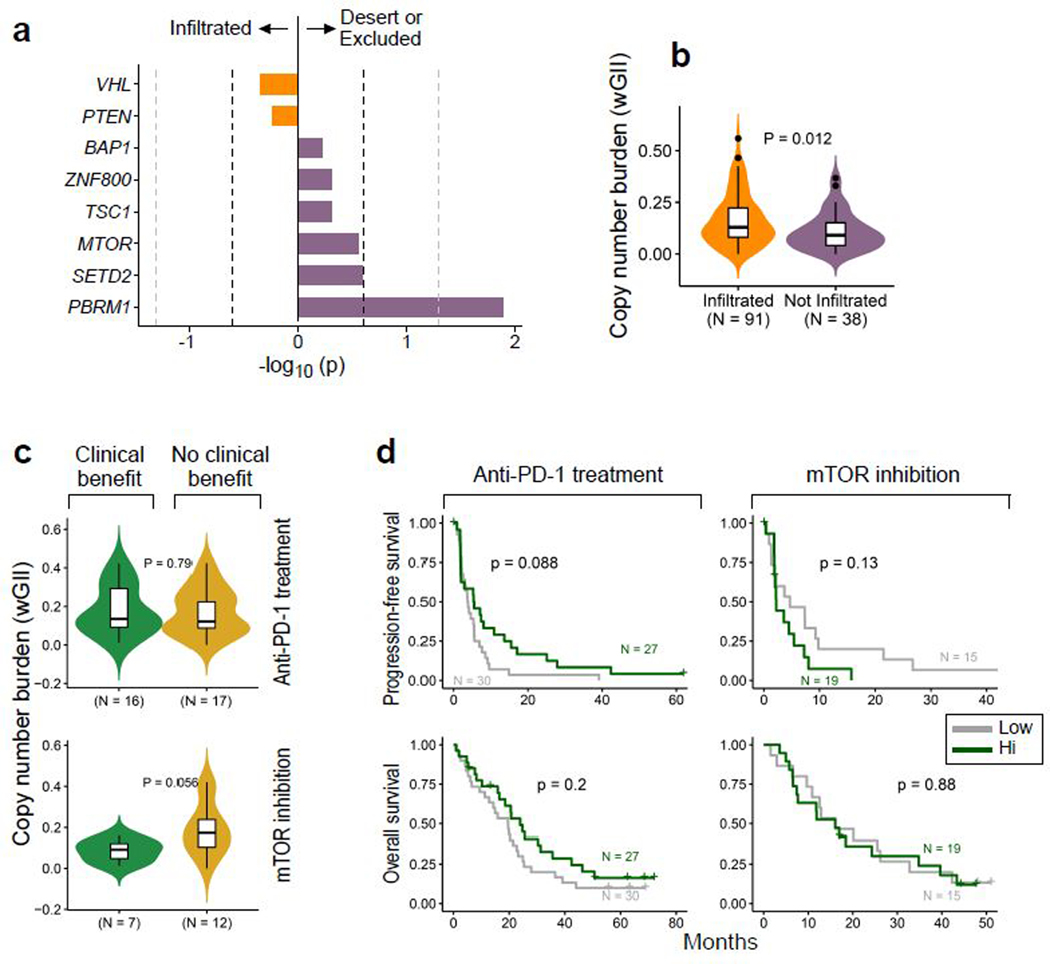
Of the recurrent sSNVs and sIndels, only truncating mutations in PBRM1 were enriched in non-infiltrated tumors, and no mutations were enriched in infiltrated tumors (Extended Data Fig. 8a). Consistent with this finding, tumors with PBRM1 mutations had a lower total CD8+ T cell infiltration by IF (p = 0.013, Wilcoxon rank-sum test). PBRM1 mutations, which we found to be associated with improved response, PFS, and OS with PD-1 blockade (Fig. 4a-b), were detected in 47% of immune deserts and 29% of immune excluded tumors, but only 22% of immune infiltrated tumors (Fig. 6a, p = 0.01 for non-infiltrated vs. infiltrated tumors). As for sCNAs, none were enriched in non-infiltrated tumors, but multiple focal chromosomal losses or gains were detected more frequently in infiltrated tumors (e.g amplifications of 12q24.32, 20q13.33, and 8q24.3; and deletions of 9p21.3, 9q34.3, 6p22.2, and 6p21.32; all q < 0.05, Fig. 6b). Infiltrated tumors had higher wGII (i.e. more genomic instability) than non-infiltrated tumors (p = 0.01), however, the degree of chromosomal instability (wGII high vs. low) was not associated with survival in infiltrated tumors (Extended Data Fig. 8b-d).
Figure 6.
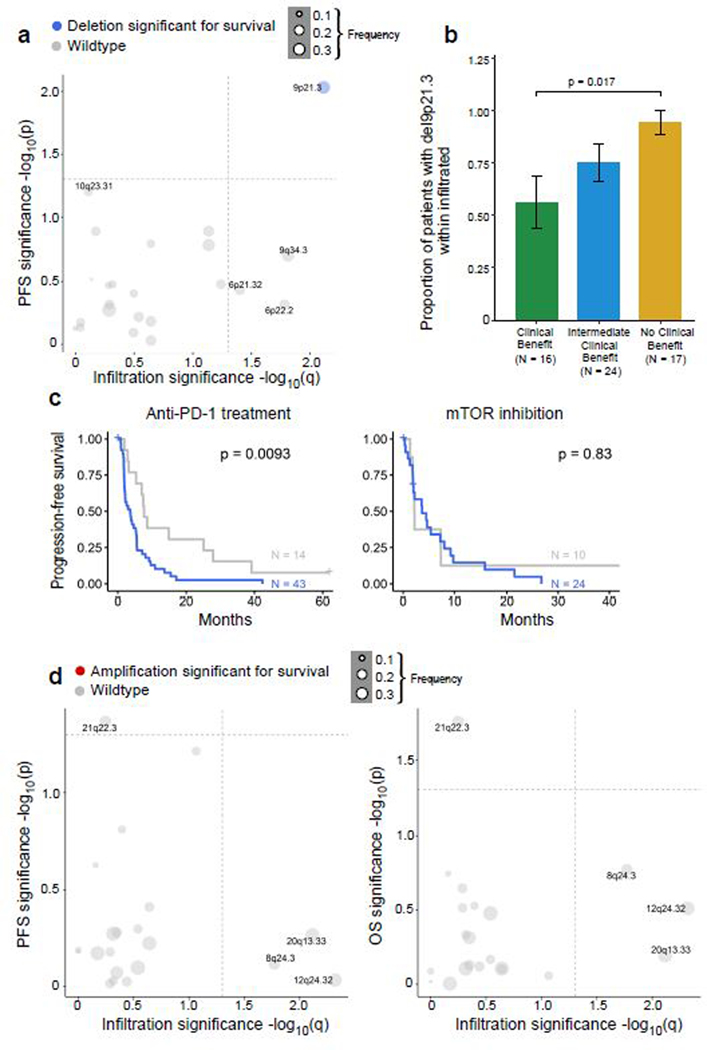
Potential interplay of immune infiltration and genomic features modulate response to PD-1 blockade. (a) Truncating mutations in PBRM1 are preferentially enriched in non-infiltrated (desert or excluded) samples as compared to infiltrated samples (two-sided Fisher’s exact test for infiltrated vs. non-infiltrated tumors, p = 0.0126, n = 105 infiltrated and n = 39 non-infiltrated). (b) Numerous copy number aberrations are significantly enriched in infiltrated samples (two-sided Fisher’s exact test for infiltrated vs. non-infiltrated tumors, n = 91 infiltrated and n = 38 non-infiltrated). Dotted lines indicate a q-value of 0.25 (dark) and 0.05 (light). (c) 9p21.3 loss is enriched in immune infiltrated samples (two-sided Fisher’s exact test, q < 0.05) and associated with altered PFS and OS (two-sided log-rank test, p < 0.05) following anti-PD-1 therapy (n = 57 infiltrated patients with anti-PD-1 therapy). (d) del(9p21.3) is associated with worse OS following PD-1 blockade but not mTOR inhibition (two-sided log-rank test). (e) Schematic representation of potential interplay of immune infiltration and tumor genomics. CD8+ T cell infiltrated tumors are poised to respond to PD-1 blockade, but are also enriched for unfavorable 9p21.3 deletions, which decreases survival in this context. By contrast, non-infiltrated tumors may be less likely to respond, but are enriched for favorable PBRM1 mutations, which are associated with improved clinical outcome with anti-PD-1 therapy.
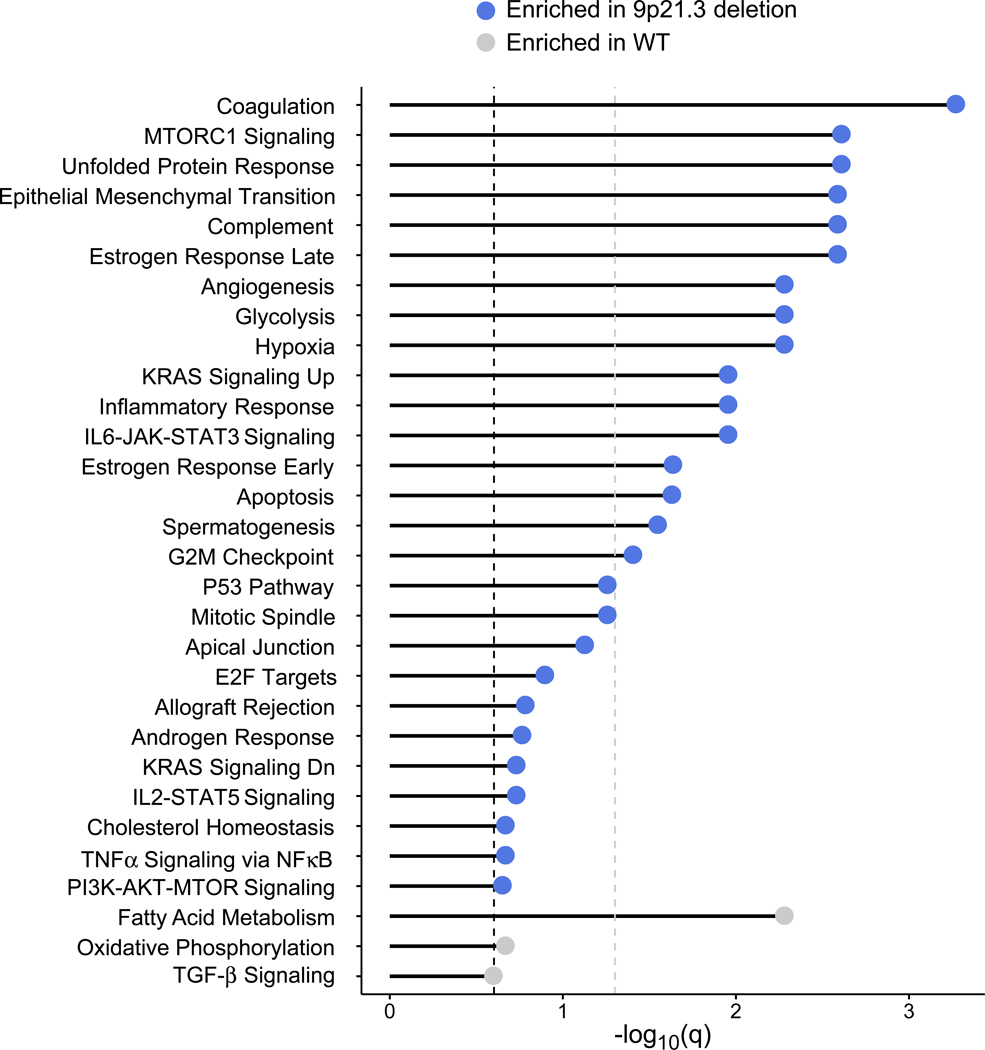
As the overall copy number burden did not affect survival, we explored whether any individual chromosomal loss or gain was (i) enriched in infiltrated tumors, and (ii) associated with altered PFS and OS within those infiltrated tumors. No chromosomal amplifications fulfilled these criteria (Extended Data Fig. 9). Among chromosomal losses, only del(9p21.3) was enriched in infiltrated tumors, and also associated with worse PFS and OS in infiltrated tumors with PD-1 blockade, but not with mTOR inhibition (Fig. 6c-d, Extended Data Fig. 9a-c). Tumors with del(9p21.3) had a higher total CD8+ T cell infiltration as compared to wildtype (p = 0.002, Wilcoxon rank-sum test). 9p21.3, which contains the CDKN2A (encoding the tumor suppressor p16) and CDKN2B genes, is a recurrent deletion event in ccRCC13,50, and is associated with the development of metastasis and with worsened survival14. By GSEA, 9p21.3 deleted tumors displayed an increase in mTOR signaling (Extended Data Fig. 10), which previously was shown to be associated (via PTEN loss) with resistance to anti-PD-1 therapy37,38. Interestingly, multiple other hallmark gene signatures were enriched in 9p21.3 loss, including angiogenesis, hypoxia, and glycolysis (with a relative depletion in oxidative phosphorylation and fatty acid metabolism), raising the possibility that multiple biologic processes could contribute to the poor outcome of PD-1 treated patients with this chromosomal alteration.
Discussion
The common paradigm in solid tumor immunology that pre-existing CD8+ T cell infiltration, in combination with high numbers of nonsynonymous mutations (which, in the context of diverse HLA class I alleles, may be presented as neoantigens) drives response to PD-1 blockade7,8,15,32,33, has not been thoroughly explored in ccRCC. Clear cell RCC has challenged conventional wisdom in cancer immunology, because ccRCC has a modest mutation burden11 yet is responsive to immunotherapies, and higher CD8+ T cell infiltration has traditionally correlated with a worse prognosis12. Through a comprehensive immunogenomic characterization of advanced ccRCC treated with PD-1 blockade, we identified numerous copy number alterations in advanced ccRCC, including deletions of 9q34.3, and loss of the regions of 6p containing components of antigen presenting machinery and HLA class II molecules. However, in contrast to other cancer types, tumor mutation burden, neoantigen load, and HLA zygosity were not associated with response to anti-PD-1 therapy in ccRCC. Further, we found only two (out of 3,173) ERVs with a potentially weak association with clinical outcomes in this dataset, which may be due to limitations in inferring ERV expression from FFPE tissue, or because expression alone is insufficient to predict response to PD-1 blockade for many ERVs.
We defined the patterns of CD8+ T cell infiltration in ccRCC, and demonstrated that, in contrast to other genitourinary malignancies10, immune exclusion is a rare immune phenotype. Importantly, we found that immune infiltrated tumors did not differ in response to or survival following PD-1 blockade in comparison to immune desert and excluded tumors. To explain this observation, we integrated genomic and transcriptomic analysis with immune phenotyping by CD8 IF. Of note, we elected to use immunofluorescence as a “gold standard” approach to quantifying CD8+ T cell infiltration in tumors, given the very substantial limitations in using only transcriptomic data to perform immune classifications. We identified that CD8+ T cell infiltrated tumors are relatively depleted for PBRM1 mutations (which are associated with response19,35), and are enriched for chromosomal losses of 9p21.3 (which is associated with resistance to PD-1 blockade in infiltrated tumors). Overall then, although infiltrated tumors are immunogenically “hot” (and therefore, should conceptually be primed to respond better to PD-1 blockade), they are relatively depleted of PBRM1 mutations (which are correlated with improved survival with anti-PD-1 therapy), and are enriched for 9p21.3 deletions (which are associated with worse outcomes with PD-1 blockade) (Fig. 6e). Our integrative approach provides a potential explanation for why CD8+ T cell infiltration by itself is not associated with response to anti-PD-1 therapy, and also puts forward a conceptual framework for analyzing and understanding mechanisms of response and resistance to PD-1 blockade in other tumor types. Given the limited number of samples for which immunofluorescence and WES data were available, this potential interplay between CD8+ T cell infiltration and del(9p21.3) will need to be confirmed in future studies of anti-PD-1 monotherapy in ccRCC.
This study does have several important limitations. There are inherent constraints in bulk genomic and transcriptomic analyses, and ultimately, single cell transcriptomic approaches will be needed to comprehensively understand tumor and immune cell composition and cellular states, and to fully dissect heterogeneity within these defined immune phenotypes. Further, genomic and immune assessments are based on a single tumor sample from each patient, which likely does not capture the entirety of the genomic heterogeneity found in ccRCC51,52 or the potential immune heterogeneity that has been described in other tumor types53. With respect to the therapeutic setting, these clinical studies were performed in the previously treated, anti-angiogenic refractory setting, and prior studies of front-line anti-PD-L1—based-therapy did not demonstrate a benefit from PBRM1 mutations in the first-line setting. Further, the exact mechanism by which PBRM1 alterations could alter response to PD-1 blockade remains largely undefined. In agreement with prior studies36,54, PBRM1 alterations were associated with higher angiogenesis gene expression; however, in contrast to past reports55,56, we found PBRM1 alterations were associated with lower IL6-JAK-STAT3 signaling, potentially attributable to differences in cohorts (including differences in immune infiltration), or to limitations in transcriptomic analysis from FFPE tissue. As mostly archival (prior to anti-angiogenic therapy) tumor specimens were available for study, not all tumors may have been at an advanced stage at the time of tissue sampling, and the somatic alteration landscape and immune infiltrate may have further evolved prior to PD-1 blockade; such changes would not be captured by the current study. Further, patients with particularly aggressive disease unfortunately may not have survived long enough to participate in these trials, and thus this type of ccRCC patient would not have been included in our analysis. Finally, our study examines only clear cell histology, but there is an unmet clinical need for improved understanding of and therapy for non-clear cell RCCs.
The current study nonetheless provides critical insights into immunogenomic mechanisms contributing to response and resistance to immunotherapy in ccRCC. Moving forward, it will be critical to validate these findings in future clinical trials, and to explore the interaction of immune infiltration and somatic alterations in the context of anti-PD-1—based combination therapies, as these regimens have become standard-of-care first-line therapeutic options for patients with advanced ccRCC3–5. Given the additional complexity of drug-drug interactions in combination therapy, where improved efficacy may result from independent, additive, or synergistic effects57, it is essential to first gain insight into the biology underlying response and resistance to anti-PD-1 monotherapy, in order to better understand the effects of these drugs in combination. The detailed clinical, genomic, transcriptomic, and immunopathology data produced by this study will serve as a valuable resource for the cancer immunology community. This work, therefore, will be important for ongoing initiatives in precision medicine and immuno-oncology, helping to identify which patients are likely to respond to current therapies, and providing fundamental information to aid in development of rational combination therapies to overcome resistance in the future.
Methods
Clinical cohorts
Patient data from three prospective clinical trials of the anti-PD-1 antibody nivolumab in advanced clear cell renal cell carcinoma (ccRCC) were used in this study – CheckMate 009 (CM-009; NCT01358721)17, CheckMate 010 (CM-010; NCT01354431)18 and CheckMate 025 (CM-025; NCT01668784)4. Patients enrolled in these CM-010 and CM-025 had advanced (metastatic) renal cell carcinoma, clear cell histology, and had progressed on at least one prior systemic anti-angiogenic therapy (CM-009 had similar eligibility criteria, though a subset of N=10 patients were treated with nivolumab as front-line therapy). CM-010 was a phase II dose-finding study of nivolumab, which found no dose-dependent relationship with progression free survival (PFS). CM-025 was a randomized phase III trial which demonstrated an improved overall survival (OS) with nivolumab over the mTOR inhibitor everolimus. Institutional Review Board approval and informed consent was obtained prior to tissue acquisition and genomic sequencing. Analysis was performed under a secondary use protocol, approved by the Dana-Farber Cancer Institute IRB. Formalin-fixed, paraffin embedded tumor tissue (mostly archival; see Supplementary Table 1 for timing of sample collection) and peripheral blood (for germline control) were obtained prior to initial anti-angiogenic therapy for patients enrolled in the CM-010 and CM-025. All genomic, transcriptomic, and immunofluorescence analysis for CM-010 and CM-025 was performed on these tissue samples. Patients who were consented for genomic studies and had tumor material that passed quality control were included in this post-hoc analysis; these patients did not differ significantly from other patients enrolled in the initial clinical trials with respect to PFS. For this analysis, data from CM-010 and CM-025 were combined with WES, RNA-seq, and clinical data from the phase I CM-009 study19.
DNA and RNA library preparation and sequencing
DNA/RNA extraction.
DNA and RNA extractions were performed using the AllPrep DNA/RNA FFPE Mini Kit (Qiagen). RNA quality was assessed with Caliper LabChip GX2 (Perkin Elmer) and RNA 6000 Nano Kit reagents for CM-010 and CM-025 respectively. The percentage of fragments with a size greater than 200nt (DV200) was calculated.
RNA-Seq libraries were prepared using a transcriptome capture approach (TruSeq RNA Access Library Prep Kit (Illumina)) following a validated SOP. Briefly, total RNA samples are fragmented, randomly primed for first and second strand cDNA synthesis ensuring strandedness, and then enriched into indexed double-straned cDNA libraries. Indexed libraries are then subsequently enriched for coding RNA using hybrid capture probes specific for coding RNA. After enrichment, the libraries were quantified with qPCR using the KAPA Library Quantification Kit for Illumina Sequencing Platforms for CM-010 and by Agilent D1000 Assay using the TapeStation (Agilent) for CM-025, followed by equimolar pooling. Flowcell cluster amplification and sequencing were performed according to the manufacturer’s protocols using HiSeq 2000 or 2500 (Illumina). Each run was a 76bp paired-end for CM-010 and 50bp paired-end for CM-025.
WES libraries were performed using the KAPA Library Prep kit, with palindromic forked adapters from Integrated DNA Technologies for CM-010 and the SureSelectXT v5 Kit (Agilent) following validated SOPs for both the DNA extracted from tumors and germline control samples for CM-025. Hybridization and capture were performed using the relevant components of Illumina’s Rapid Capture Enrichment Kit for CM-010 and by a liquid-phase hybridization capture step aimed to enrich for exonic regions of protein-coding genes for CM-025. All library construction, hybridization and capture steps were automated on the Agilent Bravo liquid handling system. Libraries were then quantitatively and qualitatively evaluated using qPCR and Agilent’s D1000 Assay using the TapeStation (Agilent), respectively. Finally, equimolar amounts of libraries were pooled and sequenced using Illumina HiSeq2500 following a 2×76 2×100 paired-end sequencing recipes for CM-010 and CM-025 respectively.
Mutation analysis
We have utilized the Getz Lab CGA WES Characterization pipeline [https://docs.google.com/document/d/1VO2kX_fgfUd0×3mBS9NjLUWGZu794WbTepBel3cBg08/edit] developed at the Broad Institute to call, filter and annotate somatic mutations for CM-010 and CM-025. Paired-end Illumina reads were aligned to the hg19 human genome reference using the Picard pipeline [https://software.broadinstitute.org/gatk/documentation/tooldocs/4.0.1.0/picard_fingerprint_CrosscheckFingerprints.php https://software.broadinstitute.org/gatk/documentation/tooldocs/4.0.0.0/picard_analysis_CollectMultipleMetrics.php]. Cross-sample contamination were assessed with the ContEst58 tool, and samples with ≥5% contamination were excluded. Point mutations and indels were identified using MuTect59 and Strelka60, respectively. Mutations were annotated using Oncotator61. Possible artifacts due to orientation bias, germline variants, sequencing and poor mapping were filtered using a variety of tools including Orientation Bias Filter62, MAFPoNFilter20, and RealignmentFilter.
In addition to the biases filtered by the CGA WES characterization pipeline, there are other artifacts that can arise in FFPE data. For example, we observed occasional false mutation calls in homopolymeric tracts or in difficult to align regions of the genome, which were characterized by the presence of many aligned reads with several mismatches (on manual IGV review). Therefore in this study, beyond the CGA WES characterization pipeline, we further implemented a specific set of filters in order to reduce the high false positive rate in CM-010 and CM-025. For every set of reads in the tumor sample that aligned to the reference at the same start and/or end positions, only one read corresponding to the best alignment was kept. Optical and PCR duplicates were removed. Only reads that had no more than one additional event (SNV, insertion, deletion) apart from the mutation were considered. In this step, events that were also represented in the normal sample at allele frequency ≥ 2% were considered to be germline variants, and were not counted as additional events. Aligned reads in the normal sample with no more than 3 events were used to calculate the allele frequency of an event in the normal sample. Finally, only mutations that had at least one supporting read in both orientations, or at least 3 reads in any one orientation, were preserved. In addition, mutations in all genes that were identified as recurrent by MutSig2CV20 were visually inspected in IGV63.
Published mutations calls for CM-00919 were reannotated by Oncotator61 in order to obtain gene annotations consistent with CM-010 and CM-025 for downstream analysis.
Recurrently mutated genes in a given cohort were identified by MutSig2CV using an FDR threshold of 0.0520.
Copy number analysis
Copy number events were called and filtered using GATK4 ModelSegments [https://gatkforums.broadinstitute.org/dsde/discussion/11682/; https://gatkforums.broadinstitute.org/dsde/discussion/11683] Copy number panel-of-normals was created based on matched germline samples in a given cohort. We applied a custom conversion script to format the outputs of ModelSegments (both copy ratio and allelic fraction) to be compatible with ABSOLUTE64, the tool used to estimate sample purity and ploidy as well as cancer cell fractions (CCFs). ABSOLUTE solutions were picked by two independent analysts; a third analyst was consulted in cases of discordant calls. The final chosen purity and ploidy solutions were used to estimate CCFs for detected somatic alterations in each sample. Mutations were considered clonal if the expected CCF of the mutation as estimated by ABSOLUTE was 1, or if the estimated probability of the mutation being clonal was greater than 0.5.
Samples that lacked both a 3p deletion as well as mutations in any of the previously identified recurrent genes in TCGA were removed from downstream analyses. Additionally, samples with excessively noisy copy number profiles (i.e. were unable to be adequately fitted to thresholded ploidy profiles by ABSOLUTE due to excessive noise) were excluded from downstream copy number analyses. GISTIC221 was used to identify recurrent amplification and deletion events in each cohort (q < 0.1). ISAR-GISTIC65 was deployed to estimate purity- and ploidy-corrected segment values.
Analysis of advanced ccRCC
Mutation and copy data for TCGA patients were downloaded from NCI Genomics Data Commons (GDC) from the following locations:
public MC3 mutation annotation file - mc3.v0.2.8.PUBLIC.maf.gz (https://api.gdc.cancer.gov/data/1c8cfe5f-e52d-41ba-94da-f15ea1337efc);
SNP6 whitelisted copy number segments file - broad.mit.edu_PANCAN_Genome_Wide_SNP_6_whitelisted.seg (https://api.gdc.cancer.gov/data/00a32f7a-c85f-4f86-850d-be53973cbc4d).
Clinical data for TCGA clear cell renal cell carcinoma (KIRC) was downloaded from the cBioPortal (https://www.cbioportal.org/study/clinicalData?id=kirc_tcga). KIRC samples from stages I-III were considered early stage whereas those from stage IV were considered advanced stage. The advanced stage cohort was comprised of samples from CM-009, CM-010, CM-025 and stage IV samples TCGA KIRC.
Sample-level somatic alteration burden statistics
Tumor mutation burden (TMB) was calculated as the sum of all non-synonymous mutations in a sample. The variant classes used for TMB were De_novo_Start_InFrame, De_novo_Start_OutOfFrame, Frame_Shift_Del, Frame_Shift_Ins, In_Frame_Del, In_Frame_Ins, Missense_Mutation, Nonsense_Mutation, Nonstop_Mutation, Splice_Site, Start_Codon_Del, Start_Codon_Ins, Start_Codon_SNP and Stop_Codon_Del. Similarly, the FrameShift indels metric (FS) was calculated as the sum of all frameshift mutations (frameshift insertions and frameshift deletions) per sample. Neoantigen load was computed as the sum of all predicted HLA:peptide binders within a sample with percentile rank less than 2.0, based on each patient’s inferred HLA class I alleles (Polysolver66). Copy number burden (or chromosomal instability) was estimated by the Weighted Genome Integrity Index (wGII) score, which was computed as follows: the ploidy of the sample was first determined as the weighted median integer copy number, with weights equal to the lengths of the copy number segments. For each of the 22 autosomal chromosomes, the percentage of gained and lost genomic material was calculated relative to the ploidy of the sample. The wGII score of a sample was defined as the average of this percentage value over the 22 autosomal chromosomes.
HLA and neoantigen analysis
Polysolver66 was used to computationally infer alleles and mutations in class I HLA genes (HLA-A/B/C). Binding affinities were predicted for all possible mutation-bearing or neoORF-derived 9 and 10-mer peptides against all inferred HLA alleles within a sample using NetMHCpan-4.067. Strong and weak affinity neoantigen binders were identified based on the percentile ranks (≤ 0.5% for strong, ≤ 2% for weak).
Transcriptomic analysis
RNA-seq data from the CheckMate 010 and 025 cohorts were aligned using STAR68, quantified using RSEM69, and evaluated for quality using RNA-seqQC270. Samples were excluded if they had an interquartile range of log2(TPM+1) < 0.5 (indicating low dynamic range), had less than 15,000 genes detected (indicating low library complexity), had an End 2 Sense Rate<0.90, or End 1 Sense Rate>0.10 (as defined by RNA-seqQC2, indicating strand bias). For samples where RNA-seq was performed in duplicates, the run with a higher interquartile range of log2(TPM+1), utilized as a surrogate for better quality data, was used. For the CheckMate 009 cohort, the previously published TPM matrix was used19. We subsequently filtered genes that were not expressed in any of the samples (in each cohort independently) then upper quartile-normalized the TPMs to an upper quartile of 1000, and log2-transformed them. Since the sequencing had been performed in 4 separate batches, principal component analysis (PCA) was used to evaluate for batch effects and 4 batches were observed. These 4 batches were corrected for using ComBat71. Subsequently, a PCA was performed on the ComBat-corrected expression matrix to confirm that batch effects had been adequately corrected for. Moreover, a constant that was equal to the first integer above the minimum negative expression value obtained post-ComBat (constant of +21) to eliminate negative gene expression values that were a by-product of ComBat correction. The ComBat-corrected expression matrix was used for all downstream analyses.
We implemented a pipeline to quantify the expression of ERVs in RNA-seq data. Briefly, a reference set of 3,173 hERV sequences was first obtained from Vargiu et al72. Bowtie2 v2.3.4.3 was used to align RNA-Seq FASTQ files for pairs to hg38 human transcriptome. All unmapped, single-end mapped, and ill-formed pair-end alignments to the human transcriptome were selected and aligned to hERV reference transcriptome using bowtie2. Mapped reads to hERV reference were kept, followed by filtering of single-end perfect matches to the human transcriptome. Finally, pair-end alignments with no more than one mismatch and single-end alignments with perfect matches to the hERV reference but not to human transcriptome were preserved. Duplicates in the final kept reads were removed using MarkDuplicates tool in Picard v2.19.0 [http://broadinstitute.github.io/picard] and then quantified using HTSeq73 v0.11.0 with the settings (htseq-count --stranded=no --mode=union --secondary-alignments=score --supplementary-alignments=score --nonunique=all -a 0). Raw counts of paired-end and single-end alignments were added with different weights (pair-counts*2 + single-counts) and then normalized to counts per million total FASTQ reads (CPM). CPM was used for experimental validation with RT-qPCR measurements. For survival and response analysis, ERV raw counts were normalized using the R package “DESeq2”74 v1.24.0, filtered for hERVs that were expressed in at least one sample in each Checkmate cohort independently, and log2-transformed. Batch effects were corrected by ComBat71 using the R package “sva”, and a constant equal to the first integer above the minimum negative expression value post-ComBat was added. The ComBat-corrected hERV expression matrix was used for downstream analyses. For each ERV, univariable Cox regression models for OS and PFS were computed for anti-PD-1—treated patients with ERV expression included as a continuous independent. For response, Wilcoxon rank-sum test (clinical benefit vs. no clinical benefit) was performed for each ERV for anti-PD-1—treated patients. For individual ERVs significant for association with response, PFS, and OS, ERV expression was dichotomized at its median expression (within the overall group of 311 patients with RNA-seq) for each ERV individually, the Kaplan-Meier method was used to summarize the survival outcomes (PFS and OS) of the groups (high vs. low) dichotomized at the median of ERV expression, and the groups were compared using the log-rank test.
Gene set enrichment analysis (GSEA39) was performed using MSigDB’s hallmark gene sets40. Single sample GSEA (ssGSEA) was additionally computed using the R package “GSVA” to obtain sample-level GSEA scores39. Differential gene expression analysis was run using the non-parametric Wilcoxon rank-sum test on ssGSEA scores and Benjamini-Hochberg false discovery rate correction with q<0.25 considered significant.
Signature analysis was performed using five immune-related signatures listed below:
IMmotion150_Angio: VEGFA, KDR, ESM1, PECAM1, ANGPTL4, CD34. (Note: PECAM1 was not in the batch-corrected expression matrix)
IMmotion150_Teff: CD8A, EOMES, PRF1, IFNG, CD274.
IMmotion150_Myeloid: IL6, CXCL1, CXCL2, CXCL3, CXCL8, PTGS2. (Note: IL6 was not in the batch-corrected expression matrix)
JAVELIN: CD3G, CD3E, CD8B, THEMIS, TRAT1, GRAP2, CD247, CD2, CD96, PRF1, CD6, IL7R, ITK, GPR18, EOMES, SIT1, NLRC3, CD244, KLRD1, SH2D1A, CCL5, XCL2, CST7, GFI1, KCNA3, PSTPIP1. (Note: CCL5 was not in the batch-corrected expression matrix)
Tumor Inflammation Score (TIS): PSMB10, HLA-DQA1, HLA-DRB1, CMKLR1, HLA-E, NKG7, CD8A, CCL5, CXCL9, CD27, CXCR6, IDO1, STAT1, TIGIT, LAG3, CD274, PDCD1LG2, CD276. (Note: CCL5 was not in the batch-corrected expression matrix)
The signature score was calculated as the arithmetic mean of expression of all genes in that signature for each sample. Comparison of each signature score between groups (clinical benefit vs. no clinical benefit, CR/PR vs. PD) were done with the non-parametric Wilcoxon rank-sum test, separately for Anti-PD1 treatment and mTOR inhibition. All comparisons were two-sided with an alpha-level of 0.05.
The CIBERSORTx deconvolution algorithm46 was used to infer immune cell infiltration from RNA-seq data (Job type: “Impute cell fractions”), in absolute mode, on the LM22 signature, with B mode batch correction (in order to correct for the batch effect between the LM22 signature, which was derived from microarray data, and the data used in this study which consisted of RNA-seq), with quantile normalization disabled, and in 1000 permutations. All samples which had a p-value for deconvolution >0.05 were considered to have failed deconvolution and were therefore discarded from all downstream analyses. Relative cell proportions were obtained by normalizing the CIBERSORTx output to the sample-level sum of cell counts (in order to obtain percentages of immune infiltration). A constant of 10−06 was added to all proportions in order to allow the computation of immune cell ratios. All immune cell proportions and ratios were compared using a non-parametric Wilcoxon rank-sum test with Benjamini-Hochberg correction and a q-value threshold of 0.05 for statistical significance.
RT-qPCR for validation of ERV expression
RNAs were extracted using the AllPrep DNA/RNA FFPE Mini Kit (Qiagen) from a 5 cm2 tumor-enriched area macrodissected from 4-mm-thick FFPE tissue sections prepared form a single tumor block. The tumor-enriched area contained an estimated percentage of TCs that ranged from 30% to 70%. Total RNA was assessed for quality using the Caliper LabChip GX2 (Perkin Elmer). The percentage of fragments with a size greater than 200nt (DV200) was calculated using software. An aliquot of 200ng of RNA was used as the input for first strand cDNA synthesis using TruSeq RNA Access Library Prep Kit (Illumina, San Diego, California, USA). Synthesis of the second strand of cDNA was followed by indexed adapter ligation. After RNA isolation, 400 ng of total RNA were treated with ezDNase (Life technologies). Transcript specific cDNA synthesis was then performed using a cocktail containing the different PCR reverse primers (see table of primer sequences below) and the SuperScript IV Reverse Transcriptase Kit (Life Technologies). RT-PCRs were performed in triplicate in 384 well plates on a 7900 Fast Real-Time PCR Detection System (Applied Biosystem) using the TaqMan Universal PCR Master Mix reagent (Life Technologies). 16 ng and 8 ng of reverse transcribed RNA were used per PCR reaction to amplify the cDNA of the hERVs and the reference genes, respectively. Primer and probe sequences used are listed in the table below. Relative transcript expression levels were calculated using the standard curve methods. Serial dilution of reverse transcribed RNA from a ccRCC from the TCGA (TCGA_CZ_5468_01) known to expresses high levels of ERVE4 and hERV470043 was used as reference samples to generate the standard curves. Mean expression level of each transcript was calculated from the three technical replicates. hERV expression levels were normalized using the geometric mean of HPRT and 18S mean expression levels.
| Transcript | Forward Primer | Reverse Primer | Probe | Amplicon Size | Reference (PMID) |
|---|---|---|---|---|---|
| ERVE-4/CT-RCC/HERV-E | GCAGATCCTGGGAGCACTCT | TGTTCAACCGCTGTGTTAATTCTC | TGCCCTGGTCAAATGCCTTGCG | 104 bp | 45 |
| ERV3.2 | TACAAGGAGGCAGGTGGAAG | TTCCCATGTGTGTTCCCTGA | TGGGAGGCTAGCTATTCCGGAAGCA | 102 bp | |
| hERV4700 GAG | GACGCTCCCAGCAGAATAAA | CCGGTCAGGAAACCAAGAAA | TTGTCTGTGGCTTGTCCTGCTACA | 99 bp | 43 |
| hERV4700 POL | CCATCCTTGGATGTCACTAGAC | CCAGGGTTACCACTGCATATC | TACGTGGACGGGAGCAACTTTGTC | 101 bp | 43 |
| hERV4700 ENV | CTGCTTAGGTCCATCCAGAATC | TGATCAGGTGACGGAGTGTA | ACGGCTCCCTCTGGACTATACTGG | 97 bp | 43 |
| HPRT | GGCAGTATAATCCAAAGATGGTCAA | GTCTGGCTTATATCCAACACTTCGT | CAAGCTTGCTGGTGAAAAGGACCCC | 80 bp | 75 |
| 18S | GTGACGGGGAATCAGGGTTC | CTGCCTTCCTTGGATGTGGT | CGGAGAGGGAGCCTGAGAAACGGC | 70 bp |
Multiplex immunofluorescence assay and image analysis
Cluster of differentiation (CD8) immunostain was performed as part of either a 5-plex (CM-010) or 6-plex (CM-025) fluorescent IHC panel using the Opal multiplex IHC system (PerkinElmer) on 4 mm-thick formalin-fixed paraffin-embedded tissue sections. Specifically, anti-CD8 antibody (C8/144B, mouse monoclonal antibody, Agilent - 1:10000 in CM-010 and 1:5000 in CM-025) was detected using the Opal 520 fluorophore (1:50 in CM-010 and 1:150 in CM-025, FITC); slides were then counterstained with Spectral DAPI (PerkinElmer) and manually coverslipped. The staining protocol was optimized by staining nonneoplastic tonsil tissue and obtaining a staining pattern in accordance with published data76,77.
The slides were imaged using the Vectra 3 automated quantitative pathology imaging system (PerkinElmer) and whole slide multispectral images were acquired at 10x magnification.
Digital whole slide multispectral images in .qptiff file format were uploaded into HALO Image Analysis platform version 2.1.1637.18 (Indica Labs). For each case annotations were created as follows: a yellow line was drawn at the interface between the tumor and the surrounding tissue; a tumor margin (TM) including 500 μm in and out from the interface was automatically created using the appropriate advanced annotation tool (green layer); the tumor center (TC) was set to include the whole remaining tumor area (red layer). Empty spaces, necrosis, red blood cells and fibrotic septa were excluded from the analyzed area using classifiers and/or additional annotations. Image analysis algorithms were built using Indica Labs High-Plex FL v2.0 module to measure the area within each layer, perform DAPI-based nuclear segmentation and detect CD8 (FITC)-positive cells by setting a dye cytoplasm positive threshold. A unique algorithm was created for each tumor and its accuracy was validated through visual inspection by at least one pathologist (M.F. and/or M.S.).
CM-010 multiplex immunofluorescence assay.
Paraffin embedded tissue sections were rehydrated and boiled in EDTA buffer pH 8 (Life Technologies) with a pressure cooker (Biocare Medical) for 30 seconds at 125°C. Tissue sections were allowed to cool down at room temperature before being incubated for 10 minute with a peroxidase block (Dual Endogenous Enzyme Block, Agilent) and for 15 minute with a protein block (Serum Free Block, Agilent). Tissue sections were then incubated for 60 min at room temperature with the primary antibody diluted in Antibody Diluent with Background Reducing Components (Agilent). Sections were next incubated for 10 minutes at room temperature with EnVision horseradish (HRP)-conjugated antibody (Agilent) and HRP-mediated visualization was performed by using Opal Fluorochrome working solution for 5 minutes (PerkinElmer). Tissue sections were washed for 5 minutes in wash buffer (0.1 mM Tris, pH7.4 + 0.05% Tween 20) between each step. To strip the primary and secondary antibodies, the slides were boiled in AR6 buffer (PerkinElmer) using a 1300W microwave oven (Panasonic) for 5 minutes at a power level of 2. After cooling down at room temperature, tissue sections were incubated with the protein block and another staining cycle was performed. At last, nuclei were counterstained with Spectral DAPI (PerkinElmer) for 5 min at room temperature and tissue sections were manually coverslipped using Prolong Gold Antifade Mountant (Life Technologies).
CM-025 multiplex immunofluorescence assay.
Slides were baked for 30 min at 60°C and automated multiplex IF was performed with BOND RX (Leica Biosystems) using BOND Polymer Refine Detection Kit (Leica Biosystems). First, tissue sections were deparaffinized using BOND Dewax Solution (Leica Biosystems) at 72°C for 30 min and rehydrated. Antigen retrieval was performed using BOND Epitope Retrieval Solution 1 (Leica Biosystems; citrate, pH 6.0) at 98°C for 10 min. Tissue sections were then washed with BOND Wash Solution (Leica Biosystems) for 9 min, incubated at room temperature with BOND Peroxide Block (Leica Biosystems) for 10 min and washed again for 6 min before incubation with Dako Protein Block Serum-Free (Agilent) for 15 min. Sections were next incubated for 40 min at room temperature with the primary antibody diluted in Leica Biosystems BOND Primary Antibody Diluent (CD8), washed for 6 minutes and incubated at room temperature with BOND Post Primary (Leica Biosystems) for 15 min. Tissue sections were then washed for 6 min and incubated with BOND Polymer (Leica Biosystems) at room temperature for 10 min, washed again for 8 min and incubated for 5 min with Opal Fluorophore Working Solution (PerkinElmer). After an additional 8 min wash, primary and secondary antibody stripping was performed using BOND Epitope Retrieval Solution 1 (Leica Biosystems; citrate, pH 6.0) at 98°C for 10 min to allow for another round of staining. Of note, an extra antigen retrieval step was performed after the last staining cycle to reduce background. Finally, nuclei were counterstained with DAPI (PerkinElmer) for 10 min at room temperature and tissue sections were manually coverslipped with Invitrogen ProLong Diamond Antifade Mountant (Thermo Fisher Scientific).
Immunophenotype assignment
Tumors were categorized as either “immune excluded” (at least five-fold greater CD8+ cells in the tumor margin than in the tumor center), “immune desert” (not excluded, and below the 25th percentile for CD8+ cells [50 cells/mm2] in the tumor center), or “immune infiltrated” (not excluded, and at or above the 25th percentile for CD8+ cells in the tumor center). For immune exclusion, there was a clear threshold (5) based on the distribution of the CD8 in tumor margin to tumor center ratio. We utilized agnostic algorithms to attempt to define an optimal cutpoint between infiltrated and desert tumors (recursive partitioning [rpart() function from rpart package in R] and maximally selected rank statistic [maxstat.test() function from maxstat package in R]). We did not identify any threshold containing at least 10% of patients that resulted in a statistically significant difference in PFS or OS between infiltrated and desert tumors. A median cutoff was explored for CD8+ T cells in the tumor center; however, upon visual inspection, cases with a substantial degree of inflammation in the tumor center were found to be misclassified as “desert” We therefore examined the lower (Q1) quartile of CD8+ T cells in the tumor center, and this threshold was confirmed by visual review by a trained pathologist (M.F.). All cases were visualized by independently by two pathologists (M.F. and M.S.) to confirm they were classified correctly.
Statistical analysis
All study findings in the pooled cohort were repeated within each cohort. The inference results and direction of association in the pooled cohort data is similar with the within-cohort data (figures not shown). The combined failure-time endpoints plot for all cohorts graphically shows no significant difference in both endpoints among the cohorts (Extended Data Fig. 2g). Kaplan-Meier analysis and univariable Cox regression analysis (coxph() function) were done using the R packages survival and survminer to evaluate the association between progression-free and overall survival times and genomic alterations (amplification, deletion, truncating mutation, HLA heterozygosity or infiltration). Significance testing for differences in progression-free survival (PFS) or overall survival (OS) was performed using the log-rank test (survdiff() function) at a significance level of p < 0.05. Additional multivariable analysis including MSKCC risk group, lines of therapy (≤1 or ≥2), or timing of sample collection (days before beginning trial therapy) as covariates confirmed the significant association of truncating mutations in PBRM1, del(10q23.31), and del(9p21.3) within infiltrated tumors as significantly associated with altered PFS and OS. All comparisons of discrete variables between groups (clinical benefit vs. no clinical benefit, CRPR vs. PD, genomic alteration vs. WT, or infiltrated vs. not infiltrated) were done with the non-parametric Wilcoxon rank-sum test (wilcox.test() or stat_compare_means(method = “wilcox”) R function, two-sided, from stats or matrixTests package). All comparisons were two-sided with an alpha-level of 0.05. For all box-plots, data distribution is shown through the violin-plot, the center line represents the median; the box limits represents the upper and lower quartiles; and the whiskers represent 1.5 times the interquartile range (outlier points outside of this range are shown as part of the box-plot). Comparisons of the copy number alterations by infiltration state were done with Fisher’s exact tests (fisher.test() R function, two-sided, from stats package). The Benjamini-Hochberg method for controlling false discovery rate (FDR) was applied to control for multiple hypothesis testing among different comparisons: for immune infiltration phenotype comparisons with a threshold of q < 0.05; for ssGSEA and CIBERSORTx scores comparisons with two thresholds of q < 0.05 and q < 0.25. All statistical analyses and figures were generated in R version 3.6.0.
DATA AVAILABILITY STATEMENT:
All relevant data are available from the authors and/or are included with the manuscript. Clinical data about the patients and tumor immunophenotyping are listed in Supplementary Table 1. Somatic mutations are available in Supplementary Table 2. Significantly recurrent mutations (by MutSig2CV) and copy number alterations (by GISTIC2) are available in supplementary table 3. Normalized RNA-seq expression data, single sample gene set enrichment scores, immune deconvolution (by CIBERSORTx), and ERV expression (inferred from RNA-seq data) are available in Supplementary Table 4. WES data from patients who consented to deposition have been submitted to the European Genome-phenome Archive (Accession numbers EGAS00001004290, EGAS00001004291, EGAS00001004290).
CODE AVAILABILITY STATEMENT:
Algorithms used for data analysis are all publicly available from the indicated references in the Methods section.
Extended Data
Extended Data Fig 1.
Sample inclusion and exclusion criteria including quality control filtering for CM-010
Extended Data Fig 2.
Response and survival for sequenced vs non-sequenced patients in each cohort
Extended Data Fig 3.
Genomic and immune features associated with MSKCC risk groups
Extended Data Fig 4.
Survival of patients with high versus low somatic alteration burden
Extended Data Fig 5.
Genomic correlates of survival following anti-PD-1 or mTOR treatment
Extended Data Fig 6.
Characterization of immune infiltration and its association with clinical outcome
Extended Data Fig 7.
Immune-related gene signature expression is not associated with improved response or survival with anti-PD-1 therapy
Extended Data Fig 8.
Enrichment of individual mutations and chromosomal instability in infiltrated versus noninfiltrated tumors
Extended Data Fig 9.
Association of focal amplifications and deletions with T cell infiltration and survival with PD1 blockade
Extended Data Fig 10.
GSEA of 9p21 3 deleted tumors versus wildtype using the Hallmark gene sets
Supplementary Material
ACKNOWLEDGMENTS:
We are grateful to G. Getz, I. Leshchiner, S. Moreno, R. Beroukhim, M. Sticco-Ivins, S. Gohil, P. Bachireddy, M. Atkins, K. Mahoney, R. Bhatt, G. Bouchard, and M. Lee for discussions and input. We also appreciate the efforts of all study nurses and clinical staff that made this study feasible, and patients who generously provided their samples for this research. This works was supported in part by Dana-Farber / Harvard Cancer Center Kidney Cancer SPORE (P50-CA101942–12), DOD CDMRP (W81XWH-18–1-0480), and in part by Bristol-Myers Squibb. D.A.B. is supported by the John. R. Svenson Fellowship. C.J.W. acknowledges support from NIH: NCI-1RO1CA155010 and NIH/NCI U24 CA224331. This work was supported in part by The G. Harold and Leila Y. Mathers Foundation. C.J.W. is a scholar of the Leukemia and Lymphoma Society, and is supported in part by the Parker Institute for Cancer Immunotherapy. S.A.S acknowledges support by the NCI (R50RCA211482). T.K.C. is supported in part by the Dana-Farber/Harvard Cancer Center Kidney SPORE and Program, the Kohlberg Chair at Harvard Medical School and the Trust Family, Michael Brigham, and Loker Pinard Funds for Kidney Cancer Research at DFCI.
D.A.B. reported nonfinancial support from Bristol-Myers Squibb, honoraria from LM Education/Exchange Services, and personal fees from Octane Global, Defined Health, Dedham Group, Adept Field Solutions, Slingshot Insights, Blueprint Partnerships, Charles River Associates, Trinity Group, and Insight Strategy, outside of the submitted work. M.S. reported grants from Exelixis and Pfizer. G.J.F. and A.H.S. have patents/pending royalties on the PD-1 pathway from Roche, Merck, Bristol-Myers-Squibb, EMD-Serono, Boehringer-Ingelheim, AstraZeneca, Dako and Novartis. G.J.F. has equity in Nextpoint, Triursus, and Xios. G.J.F. has served on advisory boards for Roche, Bristol-Myers-Squibb, Xios, Origimed, NextPoint, and IgM. G.J.F. has received research funding from Bristol-Myers Squibb, outside of the submitted work. A.H.S. has served on advisory boards for Novartis, Surface Oncology, Elstar, SQZ Biotechnologies, Adaptimmune, Elpiscience, Monopteros. A.H.S. has received research funding from Novartis, Roche, UCB, Ipsen, Quark and Merck. D.F.M. reported personal fees from Bristol-Myers Squibb, Pfizer, Merck, Novartis, Exelixis, Array BioPharm, Genentech, Alkermes, Jounce Therapeutics, X4 Pharma, Peloton, EMD Serono, and Eli Lilly; research support from Bristol-Myers Squibb, Prometheus Laboratories, Merck, Genentech, Pfizer, Exelixis, Novartis, X4 Pharma, Alkermes, and Peloton. E.V.A. had a patent to the association of mutations in PBAF genes and response to cancer immunotherapy pending. E.V.A. reported personal fees from Tango Therapeutics, Genome Medical, Invitae, Illumina, and Dynamo; grants from Novartis, Bristol-Myers Squibb-IION, nonfinancial support from Genentech, personal fees from Synapse and Microsoft outside the submitted work. S.S. reported personal fees from Merck, AstraZeneca, Bristol-Myers Squibb, AACR, and NCI, grants from Bristol-Myers Squibb, AstraZeneca, Novartis, and Exelixis, and royalties from Biogenex. C.J.W. is a founder and equity holder of Neon Therapeutics and a member of its scientific advisory board. S.A.S. reported nonfinancial support from Bristol-Myers Squibb outside the submitted work. S.A.S. previously advised and has received consulting fees from Neon Therapeutics. S.A.S. reported nonfinancial support from Bristol-Myers Squibb, and equity in Agenus Inc., Agios Pharmaceuticals, Breakbio Corp., Bristol-Myers Squibb and NewLink Genetics, outside the submitted work. T.K.C. reported grants and personal fees from Astra Zeneca, personal fees from Bayer, grants and personal fees from Bristol-Myers Squibb, personal fees from Cerulean, grants and personal fees from Eisai, personal fees from Foundation Medicine Inc, grants and personal fees from Exelixis, grants and personal fees from Genentech, personal fees from Roche, grants and personal fees from GlaxoSmithKline, grants and personal fees from Merck, from Novartis, Peloton, and Pfizer, personal fees from Prometheus Labs, grants and personal fees from Corvus, personal fees from Ipsen, grants from Tracon, grants from Astellas outside the submitted work.
Footnotes
COMPETING INTERESTS:
The other authors declare no potential conflicts of interest.
MAIN REFERENCES:
- 1.Ribas A. & Wolchok JD Cancer immunotherapy using checkpoint blockade. Science 359, 1350–1355, doi: 10.1126/science.aar4060 (2018). [DOI] [PMC free article] [PubMed] [Google Scholar]
- 2.Motzer RJ et al. Nivolumab versus Everolimus in Advanced Renal-Cell Carcinoma. N Engl J Med 373, 1803–1813, doi: 10.1056/NEJMoa1510665 (2015). [DOI] [PMC free article] [PubMed] [Google Scholar]
- 3.Motzer RJ et al. Avelumab plus Axitinib versus Sunitinib for Advanced Renal-Cell Carcinoma. N Engl J Med 380, 1103–1115, doi: 10.1056/NEJMoa1816047 (2019). [DOI] [PMC free article] [PubMed] [Google Scholar]
- 4.Motzer RJ et al. Nivolumab plus Ipilimumab versus Sunitinib in Advanced Renal-Cell Carcinoma. N Engl J Med 378, 1277–1290, doi: 10.1056/NEJMoa1712126 (2018). [DOI] [PMC free article] [PubMed] [Google Scholar]
- 5.Rini BI et al. Pembrolizumab plus Axitinib versus Sunitinib for Advanced Renal-Cell Carcinoma. N Engl J Med 380, 1116–1127, doi: 10.1056/NEJMoa1816714 (2019). [DOI] [PubMed] [Google Scholar]
- 6.Choueiri TK & Motzer RJ Systemic Therapy for Metastatic Renal-Cell Carcinoma. N Engl J Med 376, 354–366, doi: 10.1056/NEJMra1601333 (2017). [DOI] [PubMed] [Google Scholar]
- 7.Yarchoan M, Hopkins A. & Jaffee EM Tumor Mutational Burden and Response Rate to PD-1 Inhibition. N Engl J Med 377, 2500–2501, doi: 10.1056/NEJMc1713444 (2017). [DOI] [PMC free article] [PubMed] [Google Scholar]
- 8.Rizvi NA et al. Cancer immunology. Mutational landscape determines sensitivity to PD-1 blockade in non-small cell lung cancer. Science 348, 124–128, doi: 10.1126/science.aaa1348 (2015). [DOI] [PMC free article] [PubMed] [Google Scholar]
- 9.Cristescu R. et al. Pan-tumor genomic biomarkers for PD-1 checkpoint blockade-based immunotherapy. Science 362, doi: 10.1126/science.aar3593 (2018). [DOI] [PMC free article] [PubMed] [Google Scholar]
- 10.Mariathasan S. et al. TGFbeta attenuates tumour response to PD-L1 blockade by contributing to exclusion of T cells. Nature 554, 544–548, doi: 10.1038/nature25501 (2018). [DOI] [PMC free article] [PubMed] [Google Scholar]
- 11.Lawrence MS et al. Mutational heterogeneity in cancer and the search for new cancer-associated genes. Nature 499, 214–218, doi: 10.1038/nature12213 (2013). [DOI] [PMC free article] [PubMed] [Google Scholar]
- 12.Fridman WH, Zitvogel L, Sautes-Fridman C. & Kroemer G. The immune contexture in cancer prognosis and treatment. Nat Rev Clin Oncol 14, 717–734, doi: 10.1038/nrclinonc.2017.101 (2017). [DOI] [PubMed] [Google Scholar]
- 13.Cancer Genome Atlas Research, N. Comprehensive molecular characterization of clear cell renal cell carcinoma. Nature 499, 43–49, doi: 10.1038/nature12222 (2013). [DOI] [PMC free article] [PubMed] [Google Scholar]
- 14.Turajlic S. et al. Tracking Cancer Evolution Reveals Constrained Routes to Metastases: TRACERx Renal. Cell 173, 581–594 e512, doi: 10.1016/j.cell.2018.03.057 (2018). [DOI] [PMC free article] [PubMed] [Google Scholar]
- 15.Binnewies M. et al. Understanding the tumor immune microenvironment (TIME) for effective therapy. Nat Med 24, 541–550, doi: 10.1038/s41591-018-0014-x (2018). [DOI] [PMC free article] [PubMed] [Google Scholar]
- 16.Chen DS & Mellman I. Elements of cancer immunity and the cancer-immune set point. Nature 541, 321–330, doi: 10.1038/nature21349 (2017). [DOI] [PubMed] [Google Scholar]
- 17.Choueiri TK et al. Immunomodulatory Activity of Nivolumab in Metastatic Renal Cell Carcinoma. Clin Cancer Res 22, 5461–5471, doi: 10.1158/1078-0432.CCR-15-2839 (2016). [DOI] [PMC free article] [PubMed] [Google Scholar]
- 18.Motzer RJ et al. Nivolumab for Metastatic Renal Cell Carcinoma: Results of a Randomized Phase II Trial. J Clin Oncol 33, 1430–1437, doi: 10.1200/JCO.2014.59.0703 (2015). [DOI] [PMC free article] [PubMed] [Google Scholar]
- 19.Miao D. et al. Genomic correlates of response to immune checkpoint therapies in clear cell renal cell carcinoma. Science 359, 801–806, doi: 10.1126/science.aan5951 (2018). [DOI] [PMC free article] [PubMed] [Google Scholar]
- 20.Lawrence MS et al. Discovery and saturation analysis of cancer genes across 21 tumour types. Nature 505, 495–501, doi: 10.1038/nature12912 (2014). [DOI] [PMC free article] [PubMed] [Google Scholar]
- 21.Mermel CH et al. GISTIC2.0 facilitates sensitive and confident localization of the targets of focal somatic copy-number alteration in human cancers. Genome Biol 12, R41, doi: 10.1186/gb-2011-12-4-r41 (2011). [DOI] [PMC free article] [PubMed] [Google Scholar]
- 22.Mitchell TJ et al. Timing the Landmark Events in the Evolution of Clear Cell Renal Cell Cancer: TRACERx Renal. Cell 173, 611–623 e617, doi: 10.1016/j.cell.2018.02.020 (2018). [DOI] [PMC free article] [PubMed] [Google Scholar]
- 23.Mashtalir N. et al. Modular Organization and Assembly of SWI/SNF Family Chromatin Remodeling Complexes. Cell 175, 1272–1288 e1220, doi: 10.1016/j.cell.2018.09.032 (2018). [DOI] [PMC free article] [PubMed] [Google Scholar]
- 24.Chen YB et al. Molecular analysis of aggressive renal cell carcinoma with unclassified histology reveals distinct subsets. Nat Commun 7, 13131, doi: 10.1038/ncomms13131 (2016). [DOI] [PMC free article] [PubMed] [Google Scholar]
- 25.Pal SK et al. Characterization of Clinical Cases of Collecting Duct Carcinoma of the Kidney Assessed by Comprehensive Genomic Profiling. Eur Urol 70, 516–521, doi: 10.1016/j.eururo.2015.06.019 (2016). [DOI] [PubMed] [Google Scholar]
- 26.Malouf GG et al. Genomic Characterization of Renal Cell Carcinoma with Sarcomatoid Dedifferentiation Pinpoints Recurrent Genomic Alterations. Eur Urol 70, 348–357, doi: 10.1016/j.eururo.2016.01.051 (2016). [DOI] [PubMed] [Google Scholar]
- 27.Pal SK et al. Characterization of Clinical Cases of Advanced Papillary Renal Cell Carcinoma via Comprehensive Genomic Profiling. Eur Urol 73, 71–78, doi: 10.1016/j.eururo.2017.05.033 (2018). [DOI] [PubMed] [Google Scholar]
- 28.van Slegtenhorst M. et al. Identification of the tuberous sclerosis gene TSC1 on chromosome 9q34. Science 277, 805–808, doi: 10.1126/science.277.5327.805 (1997). [DOI] [PubMed] [Google Scholar]
- 29.Yan L. et al. Genetic alteration of histone lysine methyltransferases and their significance in renal cell carcinoma. PeerJ 7, e6396, doi: 10.7717/peerj.6396 (2019). [DOI] [PMC free article] [PubMed] [Google Scholar]
- 30.Heng DY et al. Prognostic factors for overall survival in patients with metastatic renal cell carcinoma treated with vascular endothelial growth factor-targeted agents: results from a large, multicenter study. J Clin Oncol 27, 5794–5799, doi: 10.1200/JCO.2008.21.4809 (2009). [DOI] [PubMed] [Google Scholar]
- 31.Motzer RJ et al. Prognostic factors for survival in previously treated patients with metastatic renal cell carcinoma. J Clin Oncol 22, 454–463, doi: 10.1200/JCO.2004.06.132 (2004). [DOI] [PubMed] [Google Scholar]
- 32.Snyder A. et al. Genetic basis for clinical response to CTLA-4 blockade in melanoma. N Engl J Med 371, 2189–2199, doi: 10.1056/NEJMoa1406498 (2014). [DOI] [PMC free article] [PubMed] [Google Scholar]
- 33.Van Allen EM et al. Genomic correlates of response to CTLA-4 blockade in metastatic melanoma. Science 350, 207–211, doi: 10.1126/science.aad0095 (2015). [DOI] [PMC free article] [PubMed] [Google Scholar]
- 34.Turajlic S. et al. Insertion-and-deletion-derived tumour-specific neoantigens and the immunogenic phenotype: a pan-cancer analysis. Lancet Oncol 18, 1009–1021, doi: 10.1016/S1470-2045(17)30516-8 (2017). [DOI] [PubMed] [Google Scholar]
- 35.Braun DA et al. Clinical Validation of PBRM1 Alterations as a Marker of Immune Checkpoint Inhibitor Response in Renal Cell Carcinoma. JAMA Oncol, doi: 10.1001/jamaoncol.2019.3158 (2019). [DOI] [PMC free article] [PubMed] [Google Scholar]
- 36.McDermott DF et al. Clinical activity and molecular correlates of response to atezolizumab alone or in combination with bevacizumab versus sunitinib in renal cell carcinoma. Nat Med 24, 749–757, doi: 10.1038/s41591-018-0053-3 (2018). [DOI] [PMC free article] [PubMed] [Google Scholar]
- 37.George S. et al. Loss of PTEN Is Associated with Resistance to Anti-PD-1 Checkpoint Blockade Therapy in Metastatic Uterine Leiomyosarcoma. Immunity 46, 197–204, doi: 10.1016/j.immuni.2017.02.001 (2017). [DOI] [PMC free article] [PubMed] [Google Scholar]
- 38.Peng W. et al. Loss of PTEN Promotes Resistance to T Cell-Mediated Immunotherapy. Cancer Discov 6, 202–216, doi: 10.1158/2159-8290.CD-15-0283 (2016). [DOI] [PMC free article] [PubMed] [Google Scholar]
- 39.Hanzelmann S, Castelo R. & Guinney J. GSVA: gene set variation analysis for microarray and RNA-seq data. BMC Bioinformatics 14, 7, doi: 10.1186/1471-2105-14-7 (2013). [DOI] [PMC free article] [PubMed] [Google Scholar]
- 40.Liberzon A. et al. The Molecular Signatures Database (MSigDB) hallmark gene set collection. Cell Syst 1, 417–425, doi: 10.1016/j.cels.2015.12.004 (2015). [DOI] [PMC free article] [PubMed] [Google Scholar]
- 41.Taylor MD et al. Mutations in SUFU predispose to medulloblastoma. Nat Genet 31, 306–310, doi: 10.1038/ng916 (2002). [DOI] [PubMed] [Google Scholar]
- 42.Rooney MS, Shukla SA, Wu CJ, Getz G. & Hacohen N. Molecular and genetic properties of tumors associated with local immune cytolytic activity. Cell 160, 48–61, doi: 10.1016/j.cell.2014.12.033 (2015). [DOI] [PMC free article] [PubMed] [Google Scholar]
- 43.Smith CC et al. Endogenous retroviral signatures predict immunotherapy response in clear cell renal cell carcinoma. J Clin Invest 128, 4804–4820, doi: 10.1172/JCI121476 (2018). [DOI] [PMC free article] [PubMed] [Google Scholar]
- 44.Panda A. et al. Endogenous retrovirus expression is associated with response to immune checkpoint blockade in clear cell renal cell carcinoma. JCI Insight 3, doi: 10.1172/jci.insight.121522 (2018). [DOI] [PMC free article] [PubMed] [Google Scholar]
- 45.Takahashi Y. et al. Regression of human kidney cancer following allogeneic stem cell transplantation is associated with recognition of an HERV-E antigen by T cells. J Clin Invest 118, 1099–1109, doi: 10.1172/JCI34409 (2008). [DOI] [PMC free article] [PubMed] [Google Scholar]
- 46.Newman AM et al. Determining cell type abundance and expression from bulk tissues with digital cytometry. Nat Biotechnol 37, 773–782, doi: 10.1038/s41587-019-0114-2 (2019). [DOI] [PMC free article] [PubMed] [Google Scholar]
- 47.Chevrier S. et al. An Immune Atlas of Clear Cell Renal Cell Carcinoma. Cell 169, 736–749 e718, doi: 10.1016/j.cell.2017.04.016 (2017). [DOI] [PMC free article] [PubMed] [Google Scholar]
- 48.Choueiri TK et al. Biomarker analyses from JAVELIN Renal 101: Avelumab + axitinib (A+Ax) versus sunitinib (S) in advanced renal cell carcinoma (aRCC). Journal of Clinical Oncology 37, 101–101, doi: 10.1200/JCO.2019.37.15_suppl.101 (2019). [DOI] [Google Scholar]
- 49.Danaher P. et al. Pan-cancer adaptive immune resistance as defined by the Tumor Inflammation Signature (TIS): results from The Cancer Genome Atlas (TCGA). J Immunother Cancer 6, 63, doi: 10.1186/s40425-018-0367-1 (2018). [DOI] [PMC free article] [PubMed] [Google Scholar]
- 50.Sato Y. et al. Integrated molecular analysis of clear-cell renal cell carcinoma. Nat Genet 45, 860–867, doi: 10.1038/ng.2699 (2013). [DOI] [PubMed] [Google Scholar]
- 51.Gerlinger M. et al. Genomic architecture and evolution of clear cell renal cell carcinomas defined by multiregion sequencing. Nat Genet 46, 225–233, doi: 10.1038/ng.2891 (2014). [DOI] [PMC free article] [PubMed] [Google Scholar]
- 52.Gerlinger M. et al. Intratumor heterogeneity and branched evolution revealed by multiregion sequencing. N Engl J Med 366, 883–892, doi: 10.1056/NEJMoa1113205 (2012). [DOI] [PMC free article] [PubMed] [Google Scholar]
- 53.Rosenthal R. et al. Neoantigen-directed immune escape in lung cancer evolution. Nature 567, 479–485, doi: 10.1038/s41586-019-1032-7 (2019). [DOI] [PMC free article] [PubMed] [Google Scholar]
- 54.Hakimi AA et al. Transcriptomic Profiling of the Tumor Microenvironment Reveals Distinct Subgroups of Clear Cell Renal Cell Cancer: Data from a Randomized Phase III Trial. Cancer Discov 9, 510–525, doi: 10.1158/2159-8290.CD-18-0957 (2019). [DOI] [PMC free article] [PubMed] [Google Scholar]
- 55.Nargund AM et al. The SWI/SNF Protein PBRM1 Restrains VHL-Loss-Driven Clear Cell Renal Cell Carcinoma. Cell Rep 18, 2893–2906, doi: 10.1016/j.celrep.2017.02.074 (2017). [DOI] [PMC free article] [PubMed] [Google Scholar]
- 56.Gao W, Li W, Xiao T, Liu XS & Kaelin WG Jr. Inactivation of the PBRM1 tumor suppressor gene amplifies the HIF-response in VHL−/− clear cell renal carcinoma. Proc Natl Acad Sci U S A 114, 1027–1032, doi: 10.1073/pnas.1619726114 (2017). [DOI] [PMC free article] [PubMed] [Google Scholar]
- 57.Palmer AC & Sorger PK Combination Cancer Therapy Can Confer Benefit via Patient-to-Patient Variability without Drug Additivity or Synergy. Cell 171, 1678–1691 e1613, doi: 10.1016/j.cell.2017.11.009 (2017). [DOI] [PMC free article] [PubMed] [Google Scholar]
METHODS REFERENCES:
- 58.Cibulskis K. et al. ContEst: estimating cross-contamination of human samples in next-generation sequencing data. Bioinformatics 27, 2601–2602, doi: 10.1093/bioinformatics/btr446 (2011). [DOI] [PMC free article] [PubMed] [Google Scholar]
- 59.Cibulskis K. et al. Sensitive detection of somatic point mutations in impure and heterogeneous cancer samples. Nat Biotechnol 31, 213–219, doi: 10.1038/nbt.2514 (2013). [DOI] [PMC free article] [PubMed] [Google Scholar]
- 60.Saunders CT et al. Strelka: accurate somatic small-variant calling from sequenced tumor-normal sample pairs. Bioinformatics 28, 1811–1817, doi: 10.1093/bioinformatics/bts271 (2012). [DOI] [PubMed] [Google Scholar]
- 61.Ramos AH et al. Oncotator: cancer variant annotation tool. Hum Mutat 36, E2423–2429, doi: 10.1002/humu.22771 (2015). [DOI] [PMC free article] [PubMed] [Google Scholar]
- 62.Costello M. et al. Discovery and characterization of artifactual mutations in deep coverage targeted capture sequencing data due to oxidative DNA damage during sample preparation. Nucleic Acids Res 41, e67, doi: 10.1093/nar/gks1443 (2013). [DOI] [PMC free article] [PubMed] [Google Scholar]
- 63.Robinson JT et al. Integrative genomics viewer. Nat Biotechnol 29, 24–26, doi: 10.1038/nbt.1754 (2011). [DOI] [PMC free article] [PubMed] [Google Scholar]
- 64.Carter SL et al. Absolute quantification of somatic DNA alterations in human cancer. Nat Biotechnol 30, 413–421, doi: 10.1038/nbt.2203 (2012). [DOI] [PMC free article] [PubMed] [Google Scholar]
- 65.Zack TI et al. Pan-cancer patterns of somatic copy number alteration. Nat Genet 45, 1134–1140, doi: 10.1038/ng.2760 (2013). [DOI] [PMC free article] [PubMed] [Google Scholar]
- 66.Shukla SA et al. Comprehensive analysis of cancer-associated somatic mutations in class I HLA genes. Nat Biotechnol 33, 1152–1158, doi: 10.1038/nbt.3344 (2015). [DOI] [PMC free article] [PubMed] [Google Scholar]
- 67.Jurtz V. et al. NetMHCpan-4.0: Improved Peptide-MHC Class I Interaction Predictions Integrating Eluted Ligand and Peptide Binding Affinity Data. J Immunol 199, 3360–3368, doi: 10.4049/jimmunol.1700893 (2017). [DOI] [PMC free article] [PubMed] [Google Scholar]
- 68.Dobin A. et al. STAR: ultrafast universal RNA-seq aligner. Bioinformatics 29, 15–21, doi: 10.1093/bioinformatics/bts635 (2013). [DOI] [PMC free article] [PubMed] [Google Scholar]
- 69.Li B. & Dewey CN RSEM: accurate transcript quantification from RNA-Seq data with or without a reference genome. BMC Bioinformatics 12, 323, doi: 10.1186/1471-2105-12-323 (2011). [DOI] [PMC free article] [PubMed] [Google Scholar]
- 70.DeLuca DS et al. RNA-SeQC: RNA-seq metrics for quality control and process optimization. Bioinformatics 28, 1530–1532, doi: 10.1093/bioinformatics/bts196 (2012). [DOI] [PMC free article] [PubMed] [Google Scholar]
- 71.Johnson WE, Li C. & Rabinovic A. Adjusting batch effects in microarray expression data using empirical Bayes methods. Biostatistics 8, 118–127, doi: 10.1093/biostatistics/kxj037 (2007). [DOI] [PubMed] [Google Scholar]
- 72.Vargiu L. et al. Classification and characterization of human endogenous retroviruses; mosaic forms are common. Retrovirology 13, 7, doi: 10.1186/s12977-015-0232-y (2016). [DOI] [PMC free article] [PubMed] [Google Scholar]
- 73.Anders S, Pyl PT & Huber W. HTSeq--a Python framework to work with high-throughput sequencing data. Bioinformatics 31, 166–169, doi: 10.1093/bioinformatics/btu638 (2015). [DOI] [PMC free article] [PubMed] [Google Scholar]
- 74.Love MI, Huber W. & Anders S. Moderated estimation of fold change and dispersion for RNA-seq data with DESeq2. Genome Biol 15, 550, doi: 10.1186/s13059-014-0550-8 (2014). [DOI] [PMC free article] [PubMed] [Google Scholar]
- 75.Specht K. et al. Quantitative gene expression analysis in microdissected archival formalin-fixed and paraffin-embedded tumor tissue. Am J Pathol 158, 419–429, doi: 10.1016/S0002-9440(10)63985-5 (2001). [DOI] [PMC free article] [PubMed] [Google Scholar]
- 76.Giraldo NA et al. Orchestration and Prognostic Significance of Immune Checkpoints in the Microenvironment of Primary and Metastatic Renal Cell Cancer. Clin Cancer Res 21, 3031–3040, doi: 10.1158/1078-0432.CCR-14-2926 (2015). [DOI] [PubMed] [Google Scholar]
- 77.Granier C. et al. Tim-3 Expression on Tumor-Infiltrating PD-1(+)CD8(+) T Cells Correlates with Poor Clinical Outcome in Renal Cell Carcinoma. Cancer Res 77, 1075–1082, doi: 10.1158/0008-5472.CAN-16-0274 (2017). [DOI] [PubMed] [Google Scholar]
Associated Data
This section collects any data citations, data availability statements, or supplementary materials included in this article.
Supplementary Materials
Data Availability Statement
All relevant data are available from the authors and/or are included with the manuscript. Clinical data about the patients and tumor immunophenotyping are listed in Supplementary Table 1. Somatic mutations are available in Supplementary Table 2. Significantly recurrent mutations (by MutSig2CV) and copy number alterations (by GISTIC2) are available in supplementary table 3. Normalized RNA-seq expression data, single sample gene set enrichment scores, immune deconvolution (by CIBERSORTx), and ERV expression (inferred from RNA-seq data) are available in Supplementary Table 4. WES data from patients who consented to deposition have been submitted to the European Genome-phenome Archive (Accession numbers EGAS00001004290, EGAS00001004291, EGAS00001004290).


