

Abstract
Background
Machine learning (ML) methods still have limited applicability in personalized oncology due to low numbers of available clinically annotated molecular profiles. This doesn’t allow sufficient training of ML classifiers that could be used for improving molecular diagnostics.
Methods
We reviewed published datasets of high throughput gene expression profiles corresponding to cancer patients with known responses on chemotherapy treatments. We browsed Gene Expression Omnibus (GEO), The Cancer Genome Atlas (TCGA) and Tumor Alterations Relevant for GEnomics-driven Therapy (TARGET) repositories.
Results
We identified data collections suitable to build ML models for predicting responses on certain chemotherapeutic schemes. We identified 26 datasets, ranging from 41 till 508 cases per dataset. All the datasets identified were checked for ML applicability and robustness with leave-one-out cross validation. Twenty-three datasets were found suitable for using ML that had balanced numbers of treatment responder and non-responder cases.
Conclusions
We collected a database of gene expression profiles associated with clinical responses on chemotherapy for 2786 individual cancer cases. Among them seven datasets included RNA sequencing data (for 645 cases) and the others – microarray expression profiles. The cases represented breast cancer, lung cancer, low-grade glioma, endothelial carcinoma, multiple myeloma, adult leukemia, pediatric leukemia and kidney tumors. Chemotherapeutics included taxanes, bortezomib, vincristine, trastuzumab, letrozole, tipifarnib, temozolomide, busulfan and cyclophosphamide.
Keywords: Machine learning, Transcriptomics, Gene expression, RNA sequencing, Microarrays, Molecular diagnostics, Biomarkers detection, Cancer, Clinical oncology, Personalized medicine, Chemotherapy
Background
Personalized approach provides important advantages in clinical oncology in terms of improved patient survival and lower drug toxicities [1, 2]. However, so far it can only cover a minor fraction of cancer patients [3, 4] due to lack of robust prognostic biomarkers for most of the treatments [5]. The proportion of patients eligible for personalized oncology slightly grows. For example, the percentage of US patients with cancer estimated to benefit from personalized prescriptions of targeted therapeutics was only 0.7% in 2006, and it had increased to ~ 5% in 2018 [4]. However, this progress could be more significant if more companion diagnostic tests would be available for the standardly used cancer drugs. In this regard, gene expression data, either obtained by RNA sequencing [1] or using microarrays [6], frequently provide an advantage over genomic tests. Several trials and clinical case reports were published recently evidencing high efficiency of gene expression-based prescriptions of cancer chemotherapeutics. Cancer gene expression data can be used per se or can be normalized on the available profiles of healthy human tissues [7].
Using transcriptomic data, bioinformatic models can be built for patient-oriented ranking of cancer drugs [8]. These models can be hypothesis-driven, e.g. based on the knowledge of the specific mechanisms of drugs anti-cancer activities [9–11]. Alternatively, hypothesis-free approaches like machine learning (ML) don’t need any theoretic background but instead strongly require sufficient training and validation datasets. Many ML methods may be used for such applications, e.g. decision trees [12, 13], random forests, RF [14, 15], linear [16], logistic [17], lasso [18, 19], ridge [15, 20] regressions, multi-layer perceptron, MLP [12, 15, 21, 22], support vectors machines [12, 13, 15, 23–25], adaptive boosting [26–28], as well as binomial naïve Bayesian [15] method.
High-quality training and validation datasets are required to run both types of the above models. Nowadays there is a shortage of clinically annotated molecular data that would help developing ML-assisted diagnostic tools. The datasets available are usually considered too small for applying ML [23, 25, 26, 29–33]. Indeed, the figure of dozens or hundreds of annotated biosamples is negligible in comparison with ~ 20,000 protein coding genes measured in transcriptomic assays. Intelligent data filtering is, therefore, needed to reduce dimensionality of data [8]. However, a recent approach using dynamic feature extraction, or flexible data trimming, can significantly improve performances of ML-based methods for the real-world datasets [15, 25].
This study was performed to review available clinically annotated datasets of cancer transcriptomic profiles that may be suitable for applications in ML models. To our knowledge, this is the largest published collection of processed gene expression data coupled with case history excerpts indicating positive or negative response to certain treatment protocols for cancer patients. This manually curated collection of molecular datasets will be helpful for those working with the ML or artificial intelligence applications in oncology, as well as for the fundamental research and development of cancer biomarkers.
Methods
We curated GEO [34], TARGET [35] and TCGA [36] repositories to extract cancer gene expression profiles associated with the clinical outcomes of chemotherapeutic treatments. We attempted to build a knowledgebase of molecular datasets suitable for building ML classifiers of clinical responses on chemotherapy treatments (Table 1, Additional file 1). Every included dataset met the following criteria:
at least 40 gene expression profiles present;
data obtained for the same cancer type and using the same experimental platform
every profile is linked with the case clinical history
all cancers treated with at least one common drug or chemotherapy regimen
treatment outcomes are available enabling to classify every case as either responder or non-responder.
Table 1.
Overview of selected transcriptomic datasets of responders/non-responders to cancer chemotherapy, responders (R) vs non-responders (NR)
| Reference | Dataset ID | Disease type | Therapy | Experimental platform | Number N of cases (R vs NR) | Number of core marker genes (S) |
| [37, 38] | GSE25066 | Breast cancer with different hormonal and HER2 status | Neoadjuvant taxane + anthracycline | Affymetrix Human Genome U133 Array |
508 (118 R: complete response + partial response; 389 NR: residual disease + progressive disease) |
20 |
| [39] | GSE41998 | Breast cancer with different hormonal and HER2 status | Neoadjuvant doxorubicin + cyclophosphamide, followed by paclitaxel | Affymetrix Human Genome U133 Array |
124 (90 R: complete response + partial response; 34 NR: residual disease + progressive disease) |
11 |
| [40] | GSE20271 | Breast cancer with different hormonal and HER2 status | Paclitaxel + fluorouracil + adriamycin + cyclophosphamide | Affymetrix Human Genome U133A Array |
85 (18 R: complete response + partial response; 66 NR: residual disease + progressive disease) |
11 |
| [41] | GSE50948 | Breast cancer with different hormonal and HER2 status |
Paclitaxel + doxorubincin followed by cyclophos-phamide + methotrexate/ fluorouracil followed by trastuzumab |
Affymetrix Human Genome U133 Plus 2.0 Array | 156 (53 R: complete response + partial response; 103 NR: residual disease + progressive disease) | 19 |
| [42] | GSE9782 | Multiple myeloma | Bortezomib monotherapy | Affymetrix Human Genome U133 Array |
169 (85 R: complete response + partial response; 84 NR: no change + progressive disease) |
18 |
| [43] | GSE39754 | Multiple myeloma | Vincristine + adriamycin + dexamethasone followed by autologous stem cell transplantation (ASCT) | Affymetrix Human Exon 1.0 ST Array | 136 (74 R: complete, near-complete and very good partial responders; 62 NR: partial, minor and worse) | 16 |
| [44] | GSE68871 | Multiple myeloma | Bortezomib-thalidomide-dexamethasone | Affymetrix Human Genome U133 Plus | 118 (69 R: complete, near-complete and very good partial responders; 49 NR: partial, minor and worse) | 12 |
| [45] | GSE55145 | Multiple myeloma | Bortezomib followed by ASCT | Affymetrix Human Exon 1.0 ST Array | 61 (33 R: complete, near-complete and very good partial responders; 28 R: partial, minor and worse) | 14 |
| [35, 46] | TARGET-50 | Childhood kidney Wilms tumor | Vincristine sulfate + cyclosporine, cytarabine, daunorubicin + conventional surgery + radiation therapy | Illumina HiSeq 2000 | 122 (36 R: complete, near-complete and very good partial responders; 86 NR: partial, minor and worse) | 14 |
| [35, 47] | TARGET-10 | Childhood B acute lymphoblastic leukemia |
Vincristine sulfate + carboplatin, cyclophosphamide, doxorubicin |
Illumina HiSeq 2000 | 98 (30 R, 68 NR: see Fig. 1) | 14 |
| [35] | TARGET-20 | Childhood acute myeloid leukemia | Non-target drugs (asparaginase, cyclosporine, cytarabine, daunorubicin, etoposide; methotrexate, mitoxantrone) including busulfan and cyclo-phosphamide | Illumina HiSeq 2000 | 54 (31 R, 23 NR: see Fig. 1) | 10 |
| [35] | TARGET-20 | Childhood acute myeloid leukemia | Same non-target drugs, but excluding busulfan and cyclo- phosphamide | Illumina HiSeq 2000 | 142 (62 R, 80 NR: see Fig. 1) | 16 |
| Reference | Dataset ID | Disease type | Therapy | Experimental platform | Number NC of cases (R vs NR) | Number of core marker genes (NS) |
| [48] | GSE18728 | Breast cancer | Docetaxel, capecitabine | Affymetrix Human Genome U133 Plus 2.0 Array | 61 (23R: complete response + partial response; 38 NR: residual disease + progressive disease) | 16 |
| [49] | GSE20181 | Breast cancer | Letrozole | Affymetrix Human Genome U133A Array | 52 (37 R: complete response + partial response; 15 NR: residual disease + progressive disease) | 11 |
| [50] | GSE20194 | Breast cancer | Paclitaxel; (tri) luoroacetyl chloride; 5-fluorouracil, epirubicin, cyclophosphamide | Affymetrix Human Genome U133A Array | 52 (11 R: complete response + partial response; 41 NR: residual disease + progressive disease) | 10 |
| [51] | GSE23988 | Breast cancer | Docetaxel, capecitabine | Affymetrix Human Genome U133A Array | 61 (20 R: complete response + partial response; 41 NR: residual disease + progressive disease) | 18 |
| [52] | GSE22358 | Breast cancer | Docetaxel, capecitabine | Agilent UNC Perou Lab Homo sapiens 1X44K Custom Array | 122 (116 R: complete response + partial response; 6 NR: residual disease + progressive disease) | 2 |
| [53] | GSE32646 | Breast cancer | Paclitaxel, 5-fluorouracil, epirubicin, cyclophosphamide | Affymetrix Human Genome U133 Plus 2.0 Array | 115 (27 R: complete response + partial response; 88 NR: residual disease + progressive disease) | 17 |
| [54] | GSE37946 | Breast cancer | Trastuzumab | Affymetrix Human Genome U133A Array | 50 (27 R: complete response + partial response; 23 NR: residual disease + progressive disease) | 14 |
| [55] | GSE42822 | Breast cancer |
Docetaxel, 5-fluorouracil, epirubicin, cyclophosphamide, capecitabine |
Affymetrix Human Genome U133A Array | 91 (38 R: complete response + partial response; 53 NR: residual disease + progressive disease) | 13 |
| [56] | GSE5122 | Acute myeloid leukemia | Tipifarnib | Affymetrix Human Genome U133A Array | 57 (13 R: complete response + partial response + stable disease; 44 R: progressive disease) | 10 |
| [57] | GSE59515 | Breast cancer | Letrozole | Illumina HumanHT-12 V4.0 expression beadchip | 75 (51 R: complete response + partial response; 24 NR: residual disease + progressive disease) | 15 |
| [58] | GSE76360 | Breast cancer | Trastuzumab | Illumina HumanHT-12 V3.0 expression beadchip |
48 (42 R: complete response + partial response; 6 NR: residual disease + progressive disease) |
3 |
| [36] | TCGA-LGG | Low-grade glioma | Temozolomide + (optionally) mibefradil | Illumina HiSeq 2000 | 131 (100 R: complete response + partial response + stable disease; 31 NR: progressive disease) | 9 |
| [36] | TCGA-LC | Lung cancer all types |
Paclitaxel + (optionally), cisplatin/carboplatin, reolysin |
Illumina HiSeq 2000 | 41 (24 R: complete response + partial response + stable disease; 17 NR: progressive disease) | 7 |
| [36] | TCGA-UC | Uterine corpus endothelial carcinoma | Paclitaxel + (optionally) carboplatin, cisplatin, doxorubicin | Illumina HiSeq 2000 | 57 (57 R: complete response + partial response + stable disease; 7 NR: progressive disease) | 2 |
We used different approaches to discriminate between the treatment responders and non-responders. Where available, e.g. for the datasets extracted from the GEO repository, we used the responder/non-responder marks assigned by the authors of the original communications publishing these data. In many instances, the number of response groups was more than two and included groups like “partial responders”. However, most frequently binary ML-assisted drug response classifiers are needed that classify patients in only two classes: either responders or non-responders [8, 23, 25, 29, 30].
If a binary classifier is needed, then the number of clinical response groups in the training/validation datasets must be also condensed to two, i.e. responders and non-responders. In such case, the groups identified by the authors as partial responders probably can be combined with the responders. This is the case for all current breast cancer datasets, namely GSE25066 [37, 38], GSE41998 [39], GSE20271 [40], GSE50948 [41], GSE18728 [48], GSE20181 [49, 59], GSE20194 [50], GSE23988 [51], GSE22358 [52], GSE32646 [53], GSE37946 [54], GSE42822 [55], GSE59515 [57] and GSE76360 [58].
For the TCGA profiles, namely for the low-grade glioma (TCGA-LGG), lung cancer (TCGA-LC), and uterine corpus endothelial carcinoma (TCGA-UEC) datasets, and for the acute myeloid leukemia dataset GSE5122 [56], stable disease cases can be most probably classified as the responders whereas progressive disease cases – as the non-responders. For the multiple myeloma dataset GSE9782 [42], the classification can be used as defined by the authors, where patents with complete and partial response were annotated as the responders, and with no change and progressive disease – as the non-responders. For three other multiple myeloma datasets, namely GSE39753 [43], GSE68871 [44], and GSE55145 [45], complete, near-complete and very good partial response groups can be most likely considered as the responders, whereas partial, minor and worse response groups – as the non-responders.
Classification of the TARGET repository profiles was more sophisticated as no responder classification was given by the authors. This was the case for the datasets of pediatric Wilms kidney tumor (TARGET-50), acute myeloid leukemia (TARGET-20) and acute lymphoblastic leukemia (TARGET-10) extracted from the gene expression repository of National Cancer Institute [35]. However, these latter clinical cases were annotated by the time of event-free survival. Distributions of the event-free survival time enabled us to identify for every dataset two different modes of survival with different slopes (Fig. 1), that can be recognized as either responders or non-responders.
Fig. 1.
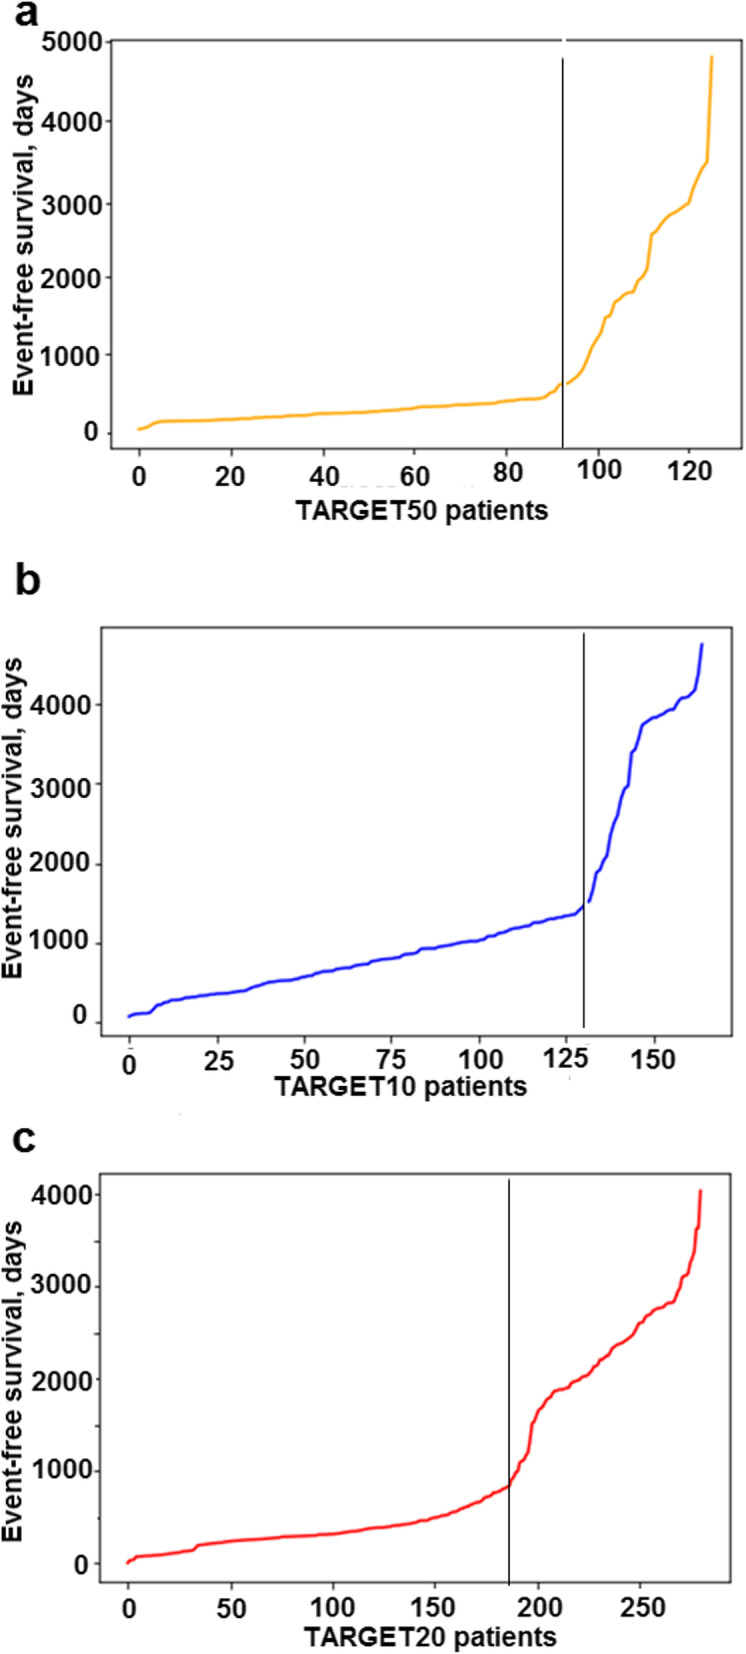
Distribution of event-free survival time for the patients with (a) childhood kidney Wilms tumor from TARGET-50 dataset, (b) childhood ALL from TARGET-10 dataset and (c) childhood AML from TARGET-20 dataset [35]. Patients on the left from vertical threshold can be considered as the non-responders, and on the right – as the responders to the treatment
Results
For raw gene expression data, the number of features i.e. interrogated genes, usually exceeds the number of tumor cases by roughly two orders of magnitude. Therefore, for robust application of ML the dimensionality of data must be reduced to make the number of selected features lower than the number of tumor cases or at least comparable to it (Fig. 2a). To reduce dimensionality, the gene expression data can be aggregated into the higher-order molecular markers like activation profiles of molecular pathways [23, 29, 30, 60, 61]. Alternatively, the most informative fraction of the initial data can be selected that can distinguish between the responder and non-responder classes. For selection of such marker features, several approaches have been proposed, e.g. Pearson chi-squared test [62], correlation test [27, 62], variance thresholding, genetic algorithms [63], univariate feature selection, recursive feature elimination, principal component analysis [27], CUR matrix [64], decomposition [65] and covariate regression [66].
Fig. 2.

Possible scenarios of using ML to build classifiers based on gene expression datasets. a Methods data dimensionality reduction; b approaches to merging and enlarging of gene expression datasets for ML application; c general workflow for a core marker set determination
In the current research, we applied the following leave-one-out-based method for finding robust marker features [25] (Fig. 2c). Imagine that we have a gene expression dataset that embraces N clinical cases, each with corresponding expression profile. For each clinical case i = 1, … N, we determine the top Q marker genes that distinguish responding and non-responding cases in a sub-dataset that contains all samples but i. In other words, for all N sub-datasets each having N-1 cases, we interrogate each gene taken one by one and retrieve the top Q set of genes that showed the highest ROC AUC values for the difference between responder and non-responder profiles. The quality metric area under the ROC curve (AUC) is the universal metric of a biomarker robustness that depends on its sensitivity and specificity [67]. It positively correlates with the quality of a biomarker and varies from 0.5 till 1. The standard discrimination threshold is 0.7 and the entries with higher AUC are considered high-quality biomarkers, and vice versa [68]. AUC is broadly used for detection of biomarkers in oncology [69–73].
To provide trobust feature selection, the number Q shouldn’t exceed the number of cases N. In the current application, we took Q equal to 30 because all tdatasets under consideration had more than 40 cases. The final list of core marker genes was obtained by intersecting top Q gene sets for all N sub-datasets.
We applied this procedure to all the clinically annotated cancer transcriptomic datasets under consideration and identified for them core marker genes (Table 1). Twenty-three out of 26 datasets investigated provided 7–20 core marker gene features for further ML applications (Table 1).
The remaining three datasets, namely GSE22358 [52], GSE76360 [58] and TCGA-UEC [36], were poorly balanced because the numbers of responders greatly exceeded the respective numbers of non-responders, or vice versa. For these three instances we were unable to generate robust core marker gene sets for ML applications because the number of such genes was too low (two-three per dataset, Table 1).
Discussion
By the current moment, ML hasn’t made a revolution in biomedicine [12]. This may be partly connected with the relatively recent emergence of experimental methods generating big amounts of biomedical data combined with the developed IT infrastructure. Among these game-changing methods the major role was played by the next-generation sequencing (NGS) and novel mass-spectrometry approaches which made whole genome-, transcriptome-, proteome- and metabolome analyses relatively fast and cheap [74–76].
Yet further development of ML methods in personalized oncology is still strongly limited by the low number of clinically annotated cancer patient molecular datasets. A dataset suitable for ML should have all together enough number of high-throughput molecular profiles and also the associated clinical case history records featuring success of the therapeutic regimen used.
In this paper we reviewed three major repositories of omics data for the available responder/non-responder datasets including more the 40 cancer cases treated with the same chemotherapeutics. We identified 26 datasets with totally 2786 cases, ranging from 41 till 508 cases per dataset (Table 1). We checked the robustness of these datasets and their suitability for ML applications using our previous method of core maker feature determination [25]. According to this test, 23/26 datasets were suitable for ML, each having 7–20 core marker genes/features for further ML applications. Contrarily, the remaining three datasets produced only two or three features, which may seem insufficient for the ML. Poor performance of these three datasets was most likely due to unbalanced numbers of clinical responder/non-responder cases included.
To increase the number of cases (Fig. 2b), the datasets for the same disease or drug treatment conditions can be merged using cross-dataset harmonization. Different methods can be used to harmonize data obtained using the same [77, 78] or two different experimental platforms [79, 80], or even using multiple platforms [81] (Fig. 2b).
In addition, when the cases are deficient, transfer learning methods may be used for a certain disease or drug condition. Using this approach, the ML training process may be preformed on the multiple available molecular profiles corresponding to cell culture treated with certain drugs [82], whereas the ML classifier validation may be done on more rare patient cancer cases [23, 29, 30].
Conclusions
We identified 26 clinically annotated gene expression datasets ranging from 41 till 508 cases per dataset (Table 1). Collectively, they covered 2786 individual cancer cases. Among them seven datasets included RNA sequencing data (for 645 cases) and the others – microarray expression profiles. The datasets represented breast cancer, lung cancer, low-grade glioma, endothelial carcinoma, multiple myeloma, adult leukemia, pediatric leukemia and kidney tumors. Chemotherapeutics used included taxanes, bortezomib, vincristine, trastuzumab, letrozole, tipifarnib, temozolomide, busulfan and cyclophosphamide.
We hope that presented collection of clinically annotated transcriptomic profiles will be useful to those working with data analysis in oncology, as well as for the fundamental research and development of next-generation cancer biomarkers.
Supplementary information
Additional file 1. Clinically annotated datasets and samples they contain.
Acknowledgements
Not applicable.
About this supplement
This article has been published as part of BMC Medical Genomics Volume 13 Supplement 8, 2020: Selected Topics in “Systems Biology and Bioinformatics” - 2019: medical genomics. The full contents of the supplement are available online at https://bmcmedgenomics.biomedcentral.com/articles/supplements/volume-13-supplement-8.
Abbreviations
- ALL
Acute lymphoblastic leukemia
- AML
Acute myelogenous leukemia
- ASCT
Autologous stem cell transplantation
- GEO
Gene expression omnibus
- GSE
GEO series
- LOO
Leave-one-out
- ML
Machine learning
- MLP
Multi-layer perceptron
- PM
Personalized medicine
- RF
Random forest
- ROC
Receiver operating characteristic
- SVM
Support vector machines
- TARGET
Tumor Alterations Relevant for GEnomics-driven Therapy
- TCGA
The Cancer Genome Atlas
Authors’ contributions
NB, MS and AB contributed conception and design of the study. NB, MS, VT and AG analyzed the data. NB and AB wrote the manuscript. All authors read and approved the final manuscript.
Funding
The work was funded by the Russian Science Foundation grant no. 18-15-00061.
Publication costs have been funded by the Russian Science Foundation grant no. 18-15-00061.
The funding body played no role in the design of the study and collection, analysis, and interpretation of data and in writing of the manuscript.
Availability of data and materials
All the data, including IDs of expression profiles, treatment methods and clinical response assessment, both done by the teams, who had worked with them, and our binary (“P-vs-N”) response classifications, are provided in Additional file 1.
Ethics approval and consent to participate
Current research did not involve any new human material. All the gene expression data that were used for research were taken from publicly available repositories GEO, TARGET and TCGA and had been previously anonymized by the teams, who had worked with them.
Consent for publication
Not applicable.
Competing interests
NB, MS, VT, AG and AB have a financial relationship with Omicsway Corp.
Footnotes
Publisher’s Note
Springer Nature remains neutral with regard to jurisdictional claims in published maps and institutional affiliations.
Supplementary information
Supplementary information accompanies this paper at 10.1186/s12920-020-00759-0.
References
- 1.Buzdin A, Sorokin M, Garazha A, Glusker A, Aleshin A, Poddubskaya E, et al. RNA sequencing for research and diagnostics in clinical oncology. Semin Cancer Biol. 2020;60:311–23. [DOI] [PubMed]
- 2.Zhukov NV, Tjulandin SA. Targeted therapy in the treatment of solid tumors: practice contradicts theory. Biochem Biokhimiia. 2008;73:605–18. [DOI] [PubMed]
- 3.Katz SJ, Ward KC, Hamilton AS, Mcleod MC, Wallner LP, Morrow M, et al. Gaps in receipt of clinically indicated genetic counseling after diagnosis of breast cancer. J Clin Oncol. 2018;36:1218–1224. doi: 10.1200/JCO.2017.76.2369. [DOI] [PMC free article] [PubMed] [Google Scholar]
- 4.Marquart J, Chen EY, Prasad V. Estimation of the percentage of US patients with cancer who benefit from genome-driven oncology. JAMA Oncol. 2018;4:1093–1098. doi: 10.1001/jamaoncol.2018.1660. [DOI] [PMC free article] [PubMed] [Google Scholar]
- 5.Buzdin A, Sorokin M, Garazha A, Sekacheva M, Kim E, Zhukov N, et al. Molecular pathway activation - new type of biomarkers for tumor morphology and personalized selection of target drugs. Semin Cancer Biol. 2018;53:110–124. doi: 10.1016/j.semcancer.2018.06.003. [DOI] [PubMed] [Google Scholar]
- 6.Rodon J, Soria J-C, Berger R, Miller WH, Rubin E, Kugel A, et al. Genomic and transcriptomic profiling expands precision cancer medicine: the WINTHER trial. Nat Med. 2019;25:751–758. doi: 10.1038/s41591-019-0424-4. [DOI] [PMC free article] [PubMed] [Google Scholar]
- 7.Devizorova Z, Mironov S, Buzdin A. Theory of magnetic domain phases in ferromagnetic superconductors. Phys Rev Lett. 2019;122:117002. doi: 10.1103/PhysRevLett.122.117002. [DOI] [PubMed] [Google Scholar]
- 8.Borisov N, Buzdin A. New paradigm of machine learning (ML) in personalized oncology: data trimming for squeezing more biomarkers from clinical datasets. Front Oncol. 2019;9:658. doi: 10.3389/fonc.2019.00658. [DOI] [PMC free article] [PubMed] [Google Scholar]
- 9.Artemov A, Aliper A, Korzinkin M, Lezhnina K, Jellen L, Zhukov N, et al. A method for predicting target drug efficiency in cancer based on the analysis of signaling pathway activation. Oncotarget. 2015;6:29347–29356. doi: 10.18632/oncotarget.5119. [DOI] [PMC free article] [PubMed] [Google Scholar]
- 10.Shepelin D, Korzinkin M, Vanyushina A, Aliper A, Borisov N, Vasilov R, et al. Molecular pathway activation features linked with transition from normal skin to primary and metastatic melanomas in human. Oncotarget. 2016;7:656–670. doi: 10.18632/oncotarget.6394. [DOI] [PMC free article] [PubMed] [Google Scholar]
- 11.Zolotovskaia MA, Sorokin MI, Emelianova AA, Borisov NM, Kuzmin DV, Borger P, et al. Pathway based analysis of mutation data is efficient for scoring target cancer drugs. Front Pharmacol. 2019;10. 10.3389/fphar.2019.00001. [DOI] [PMC free article] [PubMed]
- 12.Robin X, Turck N, Hainard A, Lisacek F, Sanchez J-C, Müller M. Bioinformatics for protein biomarker panel classification: what is needed to bring biomarker panels into in vitro diagnostics? Expert Rev Proteomics. 2009;6:675–689. doi: 10.1586/epr.09.83. [DOI] [PubMed] [Google Scholar]
- 13.Bartlett P, Shawe-Taylor J. Generalization performance of support vector machines and other pattern classifiers. In: Advances in Kernel Methods: Support Vector Learning. Cambridge: MIT Press; 1999. p. 43–54. ISBN 0262194163.
- 14.Toloşi L, Lengauer T. Classification with correlated features: unreliability of feature ranking and solutions. Bioinformatics. 2011;27:1986–1994. doi: 10.1093/bioinformatics/btr300. [DOI] [PubMed] [Google Scholar]
- 15.Tkachev V, Sorokin M, Borisov C, Garazha A, Buzdin A, Borisov N. Flexible data trimming improves performance of global machine learning methods in omics-based personalized oncology. Int J Mol Sci. 2020;21:713. doi: 10.3390/ijms21030713. [DOI] [PMC free article] [PubMed] [Google Scholar]
- 16.Stigler SM. The history of statistics: the measurement of uncertainty before 1900. Cambridge: Belknap Press of Harvard University Press; 1986. [Google Scholar]
- 17.Cramer JS. The origins of logistic regression. SSRN Electron J. 2003. 10.2139/ssrn.360300.
- 18.Santosa F, Symes WW. Linear inversion of band-limited reflection seismograms. SIAM J Sci Stat Comput. 1986;7:1307–1330. [Google Scholar]
- 19.Tibshirani R. The lasso method for variable selection in the Cox model. Stat Med. 1997;16:385–395. doi: 10.1002/(sici)1097-0258(19970228)16:4<385::aid-sim380>3.0.co;2-3. [DOI] [PubMed] [Google Scholar]
- 20.Tikhonov AN, Arsenin VI. Solutions of ill-posed problems. Washington, New York, Winston: distributed solely by Halsted Press; 1977. [Google Scholar]
- 21.Minsky ML, Papert SA. Perceptrons - expanded edition: an introduction to computational geometry. Boston: MIT Press; 1987. [Google Scholar]
- 22.Prados J, Kalousis A, Sanchez J-C, Allard L, Carrette O, Hilario M. Mining mass spectra for diagnosis and biomarker discovery of cerebral accidents. Proteomics. 2004;4:2320–2332. doi: 10.1002/pmic.200400857. [DOI] [PubMed] [Google Scholar]
- 23.Borisov N, Tkachev V, Suntsova M, Kovalchuk O, Zhavoronkov A, Muchnik I, et al. A method of gene expression data transfer from cell lines to cancer patients for machine-learning prediction of drug efficiency. Cell Cycle. 2018;17:486–491. doi: 10.1080/15384101.2017.1417706. [DOI] [PMC free article] [PubMed] [Google Scholar]
- 24.Osuna E, Freund R, Girosi F. An improved training algorithm for support vector machines: IEEE; 1997. p. 276–85. 10.1109/NNSP.1997.622408.
- 25.Tkachev V, Sorokin M, Mescheryakov A, Simonov A, Garazha A, Buzdin A, et al. FLOating-window projective separator (FloWPS): a data trimming tool for support vector machines (SVM) to improve robustness of the classifier. Front Genet. 2019;9:717. doi: 10.3389/fgene.2018.00717. [DOI] [PMC free article] [PubMed] [Google Scholar]
- 26.Turki T, Wang JTL. Clinical intelligence: new machine learning techniques for predicting clinical drug response. Comput Biol Med. 2019;107:302–322. doi: 10.1016/j.compbiomed.2018.12.017. [DOI] [PubMed] [Google Scholar]
- 27.Wang Z, Yang H, Wu Z, Wang T, Li W, Tang Y, et al. In silico prediction of blood-brain barrier permeability of compounds by machine learning and resampling methods. ChemMedChem. 2018;13:2189–2201. doi: 10.1002/cmdc.201800533. [DOI] [PubMed] [Google Scholar]
- 28.Yosipof A, Guedes RC, García-Sosa AT. Data mining and machine learning models for predicting drug likeness and their disease or organ category. Front Chem. 2018;6. 10.3389/fchem.2018.00162. [DOI] [PMC free article] [PubMed]
- 29.Borisov N, Tkachev V, Muchnik I, Buzdin A. Individual drug treatment prediction in oncology based on machine learning using cell culture gene expression data: ACM Press; 2017. p. 1–6. 10.1145/3155077.3155078.
- 30.Borisov N, Tkachev V, Buzdin A, Muchnik I. Prediction of drug efficiency by transferring gene expression data from cell lines to cancer patients. In: Rozonoer L, Mirkin B, Muchnik I, editors. Braverman readings in machine learning. Key ideas from inception to current state. Cham: Springer International Publishing; 2018. pp. 201–212. [Google Scholar]
- 31.Turki T, Wei Z. A link prediction approach to cancer drug sensitivity prediction. BMC Syst Biol. 2017;11. 10.1186/s12918-017-0463-8. [DOI] [PMC free article] [PubMed]
- 32.Turki T, Wei Z, Wang JTL. Transfer learning approaches to improve drug sensitivity prediction in multiple myeloma patients. IEEE Access. 2017;5:7381–7393. [Google Scholar]
- 33.Turki T, Wei Z, Wang JTL. A transfer learning approach via procrustes analysis and mean shift for cancer drug sensitivity prediction. J Bioinforma Comput Biol. 2018;16:1840014. doi: 10.1142/S0219720018400140. [DOI] [PubMed] [Google Scholar]
- 34.Edgar R, Domrachev M, Lash AE. Gene expression omnibus: NCBI gene expression and hybridization array data repository. Nucleic Acids Res. 2002;30:207–210. doi: 10.1093/nar/30.1.207. [DOI] [PMC free article] [PubMed] [Google Scholar]
- 35.Goldman M, Craft B, Swatloski T, Cline M, Morozova O, Diekhans M, et al. The UCSC cancer genomics browser: update 2015. Nucleic Acids Res. 2015;43:D812–D817. doi: 10.1093/nar/gku1073. [DOI] [PMC free article] [PubMed] [Google Scholar]
- 36.Tomczak K, Czerwińska P, Wiznerowicz M. The Cancer Genome Atlas (TCGA): an immeasurable source of knowledge. Contemp Oncol Poznan Pol. 2015;19:A68–A77. doi: 10.5114/wo.2014.47136. [DOI] [PMC free article] [PubMed] [Google Scholar]
- 37.Hatzis C, Pusztai L, Valero V, Booser DJ, Esserman L, Lluch A, et al. A genomic predictor of response and survival following taxane-anthracycline chemotherapy for invasive breast cancer. JAMA. 2011;305:1873–1881. doi: 10.1001/jama.2011.593. [DOI] [PMC free article] [PubMed] [Google Scholar]
- 38.Itoh M, Iwamoto T, Matsuoka J, Nogami T, Motoki T, Shien T, et al. Estrogen receptor (ER) mRNA expression and molecular subtype distribution in ER-negative/progesterone receptor-positive breast cancers. Breast Cancer Res Treat. 2014;143:403–409. doi: 10.1007/s10549-013-2763-z. [DOI] [PubMed] [Google Scholar]
- 39.Horak CE, Pusztai L, Xing G, Trifan OC, Saura C, Tseng L-M, et al. Biomarker analysis of neoadjuvant doxorubicin/cyclophosphamide followed by ixabepilone or paclitaxel in early-stage breast cancer. Clin Cancer Res Off J Am Assoc Cancer Res. 2013;19:1587–1595. doi: 10.1158/1078-0432.CCR-12-1359. [DOI] [PubMed] [Google Scholar]
- 40.Tabchy A, Valero V, Vidaurre T, Lluch A, Gomez H, Martin M, et al. Evaluation of a 30-gene paclitaxel, fluorouracil, doxorubicin, and cyclophosphamide chemotherapy response predictor in a multicenter randomized trial in breast cancer. Clin Cancer Res Off J Am Assoc Cancer Res. 2010;16:5351–5361. doi: 10.1158/1078-0432.CCR-10-1265. [DOI] [PMC free article] [PubMed] [Google Scholar]
- 41.Prat A, Bianchini G, Thomas M, Belousov A, Cheang MCU, Koehler A, et al. Research-based PAM50 subtype predictor identifies higher responses and improved survival outcomes in HER2-positive breast cancer in the NOAH study. Clin Cancer Res Off J Am Assoc Cancer Res. 2014;20:511–521. doi: 10.1158/1078-0432.CCR-13-0239. [DOI] [PubMed] [Google Scholar]
- 42.Mulligan G, Mitsiades C, Bryant B, Zhan F, Chng WJ, Roels S, et al. Gene expression profiling and correlation with outcome in clinical trials of the proteasome inhibitor bortezomib. Blood. 2007;109:3177–3188. doi: 10.1182/blood-2006-09-044974. [DOI] [PubMed] [Google Scholar]
- 43.Chauhan D, Tian Z, Nicholson B, Kumar KGS, Zhou B, Carrasco R, et al. A small molecule inhibitor of ubiquitin-specific protease-7 induces apoptosis in multiple myeloma cells and overcomes bortezomib resistance. Cancer Cell. 2012;22:345–358. doi: 10.1016/j.ccr.2012.08.007. [DOI] [PMC free article] [PubMed] [Google Scholar]
- 44.Terragna C, Remondini D, Martello M, Zamagni E, Pantani L, Patriarca F, et al. The genetic and genomic background of multiple myeloma patients achieving complete response after induction therapy with bortezomib, thalidomide and dexamethasone (VTD) Oncotarget. 2016;7:9666–9679. doi: 10.18632/oncotarget.5718. [DOI] [PMC free article] [PubMed] [Google Scholar]
- 45.Amin SB, Yip W-K, Minvielle S, Broyl A, Li Y, Hanlon B, et al. Gene expression profile alone is inadequate in predicting complete response in multiple myeloma. Leukemia. 2014;28:2229–2234. doi: 10.1038/leu.2014.140. [DOI] [PMC free article] [PubMed] [Google Scholar]
- 46.Walz AL, Ooms A, Gadd S, Gerhard DS, Smith MA, Guidry Auvil JM, et al. Recurrent DGCR8, DROSHA, and SIX Homeodomain mutations in favorable histology Wilms tumors. Cancer Cell. 2015;27:286–297. doi: 10.1016/j.ccell.2015.01.003. [DOI] [PMC free article] [PubMed] [Google Scholar]
- 47.Tricoli JV, Blair DG, Anders CK, Bleyer WA, Boardman LA, Khan J, et al. Biologic and clinical characteristics of adolescent and young adult cancers: acute lymphoblastic leukemia, colorectal cancer, breast cancer, melanoma, and sarcoma: biology of AYA cancers. Cancer. 2016;122:1017–1028. doi: 10.1002/cncr.29871. [DOI] [PMC free article] [PubMed] [Google Scholar]
- 48.Korde LA, Lusa L, McShane L, Lebowitz PF, Lukes L, Camphausen K, et al. Gene expression pathway analysis to predict response to neoadjuvant docetaxel and capecitabine for breast cancer. Breast Cancer Res Treat. 2010;119:685–699. doi: 10.1007/s10549-009-0651-3. [DOI] [PMC free article] [PubMed] [Google Scholar]
- 49.Miller WR, Larionov A. Changes in expression of oestrogen regulated and proliferation genes with neoadjuvant treatment highlight heterogeneity of clinical resistance to the aromatase inhibitor, letrozole. Breast Cancer Res. 2010;12:R52. doi: 10.1186/bcr2611. [DOI] [PMC free article] [PubMed] [Google Scholar]
- 50.Popovici V, Chen W, Gallas BG, Hatzis C, Shi W, Samuelson FW, et al. Effect of training-sample size and classification difficulty on the accuracy of genomic predictors. Breast Cancer Res. 2010;12:R5. doi: 10.1186/bcr2468. [DOI] [PMC free article] [PubMed] [Google Scholar]
- 51.Iwamoto T, Bianchini G, Booser D, Qi Y, Coutant C, Shiang CY-H, et al. Gene pathways associated with prognosis and chemotherapy sensitivity in molecular subtypes of breast cancer. J Natl Cancer Inst. 2011;103:264–272. doi: 10.1093/jnci/djq524. [DOI] [PubMed] [Google Scholar]
- 52.Glück S, Ross JS, Royce M, McKenna EF, Perou CM, Avisar E, et al. TP53 genomics predict higher clinical and pathologic tumor response in operable early-stage breast cancer treated with docetaxel-capecitabine ± trastuzumab. Breast Cancer Res Treat. 2012;132:781–791. doi: 10.1007/s10549-011-1412-7. [DOI] [PubMed] [Google Scholar]
- 53.Miyake T, Nakayama T, Naoi Y, Yamamoto N, Otani Y, Kim SJ, et al. GSTP1 expression predicts poor pathological complete response to neoadjuvant chemotherapy in ER-negative breast cancer. Cancer Sci. 2012;103:913–920. doi: 10.1111/j.1349-7006.2012.02231.x. [DOI] [PMC free article] [PubMed] [Google Scholar]
- 54.Liu JC, Voisin V, Bader GD, Deng T, Pusztai L, Symmans WF, et al. Seventeen-gene signature from enriched Her2/Neu mammary tumor-initiating cells predicts clinical outcome for human HER2+:ERα- breast cancer. Proc Natl Acad Sci U S A. 2012;109:5832–5837. doi: 10.1073/pnas.1201105109. [DOI] [PMC free article] [PubMed] [Google Scholar]
- 55.Shen K, Qi Y, Song N, Tian C, Rice SD, Gabrin MJ, et al. Cell line derived multi-gene predictor of pathologic response to neoadjuvant chemotherapy in breast cancer: a validation study on US oncology 02-103 clinical trial. BMC Med Genet. 2012;5:51. doi: 10.1186/1755-8794-5-51. [DOI] [PMC free article] [PubMed] [Google Scholar]
- 56.Raponi M, Harousseau J-L, Lancet JE, Löwenberg B, Stone R, Zhang Y, et al. Identification of molecular predictors of response in a study of tipifarnib treatment in relapsed and refractory acute myelogenous leukemia. Clin Cancer Res Off J Am Assoc Cancer Res. 2007;13:2254–2260. doi: 10.1158/1078-0432.CCR-06-2609. [DOI] [PubMed] [Google Scholar]
- 57.Turnbull AK, Arthur LM, Renshaw L, Larionov AA, Kay C, Dunbier AK, et al. Accurate prediction and validation of response to endocrine therapy in breast cancer. J Clin Oncol Off J Am Soc Clin Oncol. 2015;33:2270–2278. doi: 10.1200/JCO.2014.57.8963. [DOI] [PubMed] [Google Scholar]
- 58.Varadan V, Gilmore H, Miskimen KLS, Tuck D, Parsai S, Awadallah A, et al. Immune signatures following single dose Trastuzumab predict pathologic response to PreoperativeTrastuzumab and chemotherapy in HER2-positive early breast cancer. Clin Cancer Res Off J Am Assoc Cancer Res. 2016;22:3249–3259. doi: 10.1158/1078-0432.CCR-15-2021. [DOI] [PMC free article] [PubMed] [Google Scholar]
- 59.Miller WR, Larionov A, Anderson TJ, Evans DB, Dixon JM. Sequential changes in gene expression profiles in breast cancers during treatment with the aromatase inhibitor, letrozole. Pharmacogenomics J. 2012;12:10–21. doi: 10.1038/tpj.2010.67. [DOI] [PubMed] [Google Scholar]
- 60.Ozerov IV, Lezhnina KV, Izumchenko E, Artemov AV, Medintsev S, Vanhaelen Q, et al. In silico pathway activation network decomposition analysis (iPANDA) as a method for biomarker development. Nat Commun. 2016;7:13427. doi: 10.1038/ncomms13427. [DOI] [PMC free article] [PubMed] [Google Scholar]
- 61.Tarca AL, Draghici S, Khatri P, Hassan SS, Mittal P, Kim J-S, et al. A novel signaling pathway impact analysis. Bioinforma Oxf Engl. 2009;25:75–82. doi: 10.1093/bioinformatics/btn577. [DOI] [PMC free article] [PubMed] [Google Scholar]
- 62.Cho H-J, Lee S, Ji YG, Lee DH. Association of specific gene mutations derived from machine learning with survival in lung adenocarcinoma. PLoS One. 2018;13:e0207204. doi: 10.1371/journal.pone.0207204. [DOI] [PMC free article] [PubMed] [Google Scholar]
- 63.Soufan O, Kleftogiannis D, Kalnis P, Bajic VB. DWFS: a wrapper feature selection tool based on a parallel genetic algorithm. PLoS One. 2015;10:e0117988. doi: 10.1371/journal.pone.0117988. [DOI] [PMC free article] [PubMed] [Google Scholar]
- 64.Mahoney MW, Drineas P. CUR matrix decompositions for improved data analysis. Proc Natl Acad Sci. 2009;106:697–702. doi: 10.1073/pnas.0803205106. [DOI] [PMC free article] [PubMed] [Google Scholar]
- 65.Turki T, Wei Z. 2016 38th annual international conference of the IEEE engineering in medicine and biology society (EMBC) Orlando: IEEE; 2016. Learning approaches to improve prediction of drug sensitivity in breast cancer patients; pp. 3314–3320. [DOI] [PubMed] [Google Scholar]
- 66.Menden MP, Casale FP, Stephan J, Bignell GR, Iorio F, McDermott U, et al. The germline genetic component of drug sensitivity in cancer cell lines. Nat Commun. 2018;9. 10.1038/s41467-018-05811-3. [DOI] [PMC free article] [PubMed]
- 67.Green DM, Swets JA. Signal detection theory and psychophysics. Repr. ed. Los Altos Hills: Peninsula Publ; 2000. [Google Scholar]
- 68.Boyd JC. Mathematical tools for demonstrating the clinical usefulness of biochemical markers. Scand J Clin Lab Investig Suppl. 1997;227:46–63. [PubMed] [Google Scholar]
- 69.Borisov NM, Terekhanova NV, Aliper AM, Venkova LS, Smirnov PY, Roumiantsev S, et al. Signaling pathways activation profiles make better markers of cancer than expression of individual genes. Oncotarget. 2014;5:10198–10205. doi: 10.18632/oncotarget.2548. [DOI] [PMC free article] [PubMed] [Google Scholar]
- 70.Chen L, Zhou Y, Tang X, Yang C, Tian Y, Xie R, et al. EGFR mutation decreases FDG uptake in non-small cell lung cancer via the NOX4/ROS/GLUT1 axis. Int J Oncol. 2018. 10.3892/ijo.2018.4626. [DOI] [PubMed]
- 71.Liu T, Cheng G, Kang X, Xi Y, Zhu Y, Wang K, et al. Noninvasively evaluating the grading and IDH1 mutation status of diffuse gliomas by three-dimensional pseudo-continuous arterial spin labeling and diffusion-weighted imaging. Neuroradiology. 2018;60:693–702. doi: 10.1007/s00234-018-2021-5. [DOI] [PubMed] [Google Scholar]
- 72.Tanioka M, Fan C, Parker JS, Hoadley KA, Hu Z, Li Y, et al. Integrated analysis of RNA and DNA from the phase III trial CALGB 40601 identifies predictors of response to trastuzumab-based neoadjuvant chemotherapy in HER2-positive breast cancer. Clin Cancer Res. 2018;24:5292–5304. doi: 10.1158/1078-0432.CCR-17-3431. [DOI] [PMC free article] [PubMed] [Google Scholar]
- 73.Zolotovskaia MA, Sorokin MI, Roumiantsev SA, Borisov NM, Buzdin AA. Pathway instability is an effective new mutation-based type of cancer biomarkers. Front Oncol. 2019;8. 10.3389/fonc.2018.00658. [DOI] [PMC free article] [PubMed]
- 74.Chu Y, Corey DR. RNA sequencing: platform selection, experimental design, and data interpretation. Nucleic Acid Ther. 2012;22:271–274. doi: 10.1089/nat.2012.0367. [DOI] [PMC free article] [PubMed] [Google Scholar]
- 75.Cox J, Mann M. Quantitative, high-resolution proteomics for data-driven systems biology. Annu Rev Biochem. 2011;80:273–299. doi: 10.1146/annurev-biochem-061308-093216. [DOI] [PubMed] [Google Scholar]
- 76.Pettersson E, Lundeberg J, Ahmadian A. Generations of sequencing technologies. Genomics. 2009;93:105–111. doi: 10.1016/j.ygeno.2008.10.003. [DOI] [PubMed] [Google Scholar]
- 77.Love MI, Huber W, Anders S. Moderated estimation of fold change and dispersion for RNA-seq data with DESeq2. Genome Biol. 2014;15:550. doi: 10.1186/s13059-014-0550-8. [DOI] [PMC free article] [PubMed] [Google Scholar]
- 78.Bolstad BM, Irizarry RA, Astrand M, Speed TP. A comparison of normalization methods for high density oligonucleotide array data based on variance and bias. Bioinforma Oxf Engl. 2003;19:185–193. doi: 10.1093/bioinformatics/19.2.185. [DOI] [PubMed] [Google Scholar]
- 79.Huang H, Lu X, Liu Y, Haaland P, Marron JS. R/DWD: distance-weighted discrimination for classification, visualization and batch adjustment. Bioinformatics. 2012;28:1182–1183. doi: 10.1093/bioinformatics/bts096. [DOI] [PMC free article] [PubMed] [Google Scholar]
- 80.Shabalin AA, Tjelmeland H, Fan C, Perou CM, Nobel AB. Merging two gene-expression studies via cross-platform normalization. Bioinformatics. 2008;24:1154–1160. doi: 10.1093/bioinformatics/btn083. [DOI] [PubMed] [Google Scholar]
- 81.Borisov N, Shabalina I, Tkachev V, Sorokin M, Garazha A, Pulin A, et al. Shambhala: a platform-agnostic data harmonizer for gene expression data. BMC Bioinformatics. 2019;20:66. doi: 10.1186/s12859-019-2641-8. [DOI] [PMC free article] [PubMed] [Google Scholar]
- 82.Yang W, Soares J, Greninger P, Edelman EJ, Lightfoot H, Forbes S, et al. Genomics of drug sensitivity in cancer (GDSC): a resource for therapeutic biomarker discovery in cancer cells. Nucleic Acids Res. 2013;41(Database issue):D955–D961. doi: 10.1093/nar/gks1111. [DOI] [PMC free article] [PubMed] [Google Scholar]
Associated Data
This section collects any data citations, data availability statements, or supplementary materials included in this article.
Supplementary Materials
Additional file 1. Clinically annotated datasets and samples they contain.
Data Availability Statement
All the data, including IDs of expression profiles, treatment methods and clinical response assessment, both done by the teams, who had worked with them, and our binary (“P-vs-N”) response classifications, are provided in Additional file 1.