

Abstract
Survival relies on the ability to flexibly choose between different actions according to varying environmental circumstances. Many lines of evidence indicate that action selection involves signaling in corticostriatal circuits, including the orbitofrontal cortex (OFC) and dorsomedial striatum (DMS). While choice-specific responses have been found in individual neurons from both areas, it is unclear whether populations of OFC or DMS neurons are better at encoding an animal’s choice. To address this, we trained head-fixed mice to perform an auditory guided two-alternative choice task, which required moving a joystick forward or backward. We then used silicon microprobes to simultaneously measure the spiking activity of OFC and DMS ensembles, allowing us to directly compare population dynamics between these areas within the same animals. Consistent with previous literature, both areas contained neurons that were selective for specific stimulus-action associations. However, analysis of concurrently recorded ensemble activity revealed that the animal’s trial-by-trial behavior could be decoded more accurately from DMS dynamics. These results reveal substantial regional differences in encoding action selection, suggesting that DMS neural dynamics are more specialized than OFC at representing an animal’s choice of action.
NEW & NOTEWORTHY While previous literature shows that both orbitofrontal cortex (OFC) and dorsomedial striatum (DMS) represent information relevant to selecting specific actions, few studies have directly compared neural signals between these areas. Here we compared OFC and DMS dynamics in mice performing a two-alternative choice task. We found that the animal’s choice could be decoded more accurately from DMS population activity. This work provides among the first evidence that OFC and DMS differentially represent information about an animal’s selected action.
Keywords: action selection, orbitofrontal cortex, population decoding, single-unit recordings, striatum
INTRODUCTION
Solving the problem of which action to choose is a critical and incompletely understood aspect of brain function. Previous work has revealed this process relies strongly on the basal ganglia and their interactions with cortical networks (Alexander et al. 1986; Frank 2011; Humphries et al. 2006; Mink 1996). Corticostriatal circuits play a prominent role in enabling animals to choose favorable actions (Hwang et al. 2019; Pennartz et al. 2009; Rothwell et al. 2015; Sharpe et al. 2019; Znamenskiy and Zador 2013). Among these circuits are the orbitofrontal cortex (OFC) and dorsomedial striatum (DMS), which have both been shown to influence action selection (Balleine et al. 2007; Bradfield et al. 2015; Murray and Izquierdo 2007; Ostlund and Balleine 2007; Tai et al. 2012; Yin et al. 2005). Altered function of projections from OFC to DMS, or neighboring corticostriatal pathways, has been implicated in maladaptive action selection processes found in obsessive compulsive disorder (Ahmari et al. 2013; Burguière et al. 2013; Corbit et al. 2019). A separate line of evidence relying on recordings of neural activity has shown that both areas encode information that is relevant for action selection (Feierstein et al. 2006; Gremel and Costa 2013; Guo et al. 2019; Ito and Doya 2015; Kimchi and Laubach 2009; Moorman and Aston-Jones 2014; Nonomura et al. 2018; Schultz and Romo 1992; Seo et al. 2012; Shin et al. 2018; Stalnaker et al. 2012). However, information processing in these areas is diverse and not exclusively linked to action selection (Padoa-Schioppa and Assad 2006; Samejima et al. 2005; Wang et al. 2013; Wilson et al. 2014). Therefore, while behavioral studies have established a role for OFC and DMS in action selection, the extent to which encoding of an animal’s choice of action differs or agrees between these areas is less clear (Seo et al. 2012; Sharpe et al. 2019). Since the striatum integrates excitatory input from multiple sources (Friedman et al. 2015; Guo et al. 2019; Lee et al. 2019; Reig and Silberberg 2014; Sippy et al. 2015), DMS dynamics may diverge significantly from those in OFC. However, until now there has not been a systematic effort to compare concurrently measured neural activity in these areas.
Here we compared simultaneously recorded dynamics in OFC and DMS using a high-throughput electrode measurement technique, which gave access to the spiking activity of dozens of neurons in each area. Recordings were carried out in head-fixed mice performing an auditory guided two-alternative choice task. Using population decoding methods, we found that DMS activity performed better than OFC at representing an animal’s choice of action. These regional differences were absent in data from another group of animals which were trained on a one-alternative choice task, confirming that the differential effects reflect action- rather than auditory tone-specific activity. Moreover, the results of population decoding analysis were more consistent than those from analyzing the selectivity of individual neurons, suggesting that monitoring dynamics of neural ensembles provides an effective way to compare computational properties across brain areas (Bakhurin et al. 2017). This work represents among the first efforts to directly compare information processing in frontal cortical and striatal areas during an action selection task. Taken together, the results suggest that although an animal’s choice of action is encoded in both OFC and DMS dynamics, this neural representation is more refined in DMS ensembles.
MATERIALS AND METHODS
Animals.
All animal procedures were approved by the University of California, Los Angeles Chancellor’s Animal Research Committee. Experiments involved male wild-type (C57BL/6J) mice, 8–12 wk old at the time of the first surgery (stock no. 000664, Jackson Laboratory).
Surgery.
Surgical procedures were performed under aseptic conditions and isoflurane anesthesia on a stereotaxic apparatus (model 1900, Kopf Instruments). In the first surgery, a pair of stainless steel head fixation bars was attached to each side of the skull with dental cement (Metabond, Parkell). In the second surgery, performed on the day before electrophysiological recording, we drilled a small rectangular craniotomy over OFC, DMS, and cerebellum for the electrical reference wire.
Two-alternative choice task.
After a 7-day recovery period from the first surgery, mice (n = 6) were food restricted to maintain their weight at around 90% of their baseline level, and given water ad libitum. Behavior was monitored and controlled online with custom LabVIEW programs (National Instruments). All behavior-related signals were simultaneously recorded by another data acquisition system (C3100, Intan Technologies) for offline data analysis (sampling rate: 25 kHz). During training (one session per day), mice rested their hindlimbs and right forelimb on an acrylic body tube (44 mm inner diameter, part number 8585K26, McMaster-Carr). First, over a 3- to 4-day period, animals were habituated to the head fixation apparatus and to consume unconditional rewards (7.7 μl, 10% sweetened condensed milk). Second, they were given access to a joystick (part number 679-2501-ND, Digikey), whose centering spring was modified to reduce the operating force (~0.1 N). The joystick lever was made of a 2-mm-diameter stick (part number 23-400-112, Fisher Scientific) covered with surgical tape and placed below the left forelimb. The lever was constrained to move forward and backward. Animals were initially rewarded for making arbitrary joystick movements (1–3 days). In the next session, animals had first to release or hold the joystick in the central position for at least 0.1 s (defined as ±0.05 arbitrary units in Fig. 1), then push or pull the lever past the threshold position to obtain reward (threshold for forward: 0.25; backward: −0.25). The session was ended after obtaining over 200 rewards from either forward or backward movements. Third, on subsequent sessions we trained mice on the two-alternative choice task with auditory cues. Animals initiated each trial by releasing or holding the joystick in the central position for a predefined time (release period). Moving the joystick out of the central position during the release period resulted in resetting the timer. The release period was initially set to 0.1 s but increased by 0.01 s after each rewarded trial. Conversely, if animals did not receive any reward for 40 s the release period was reduced by 0.01 s. The final release period was 1 s. The release period was followed by the cue period, in which a pure auditory tone was presented for 100 ms (cue 1: 3 kHz; cue 2: 16 kHz, pseudorandom order; the same cue was never presented more than twice in a row). In the ensuing movement period, moving the joystick forward in response to cue 1 beyond a preset threshold position (0.16), or backward in response to cue 2 (−0.14), resulted in immediate reward delivery. Animals were not prohibited from initiating their joystick response during the cue period, but correct choices were only rewarded after cue offset. Failure to respond or make a correct choice in the movement period transitioned the task to the intertrial interval (ITI). The movement period was initially set to 10 s and reduced to a final value of 3 s in steps of 0.07 s after each rewarded trial. The ITI was initially set to 1.5 s and increased to 8 s in steps of 0.065 s after each rewarded trial. On the final stage of training (13–44 days), the duration of the release and movement period was fixed to its final value, and the ITI was drawn from a uniform distribution between 5.5 and 10.5 s. Electrophysiological recordings were carried out at the end of the final stage. Including all stages of training, animals belonging to the two-alternative choice task group were trained for 18–49 days including the recording session.
Fig. 1.

A two-alternative and one-alternative choice task for head-fixed mice. A: illustration of the two-alternative choice task paradigm. Head-fixed mice had to first release or hold in the joystick in the central position for 1 s for the trial to begin. They received reward for moving a joystick forward in response to a low frequency tone (cue 1, 3 kHz, 100 ms), or backward in response to a high-frequency tone (cue 2, 16 kHz, 100 ms). B: joystick position signal in response to the two cues on hit trials, aligned to cue onset. Data represent the mean of one well-trained animal from the two-alternative choice task group on the recording day. Shaded areas represent standard error of the mean (SE). C: same as B but aligned to the time of joystick movement threshold. D: there was no significant difference (ns) in hit rate across all animals tested on the two-alternative choice task (n = 6 mice, paired t test, t5 = 0.92, P = 0.4). Red lines represent the mean values. E: there was no significant difference in error rate across all animals tested on the two-alternative choice task (n = 6 mice, paired t test, t5 = 0.54, P = 0.61). F: distribution of the lever press times on cue 1 (blue) and cue 2 (green) hit trials, for the same animal as B and C. G: there was no significant difference in mean lever press time across all animals tested on the two-alternative choice task (n = 6 mice, paired t test, t5 = 2.34, P = 0.066). H: illustration of the one-alternative choice task paradigm, used to characterize cue-selective neural responses in the absence of action selectivity. This task is similar to the two-alternative choice task, except both cues are associated with forward joystick movement. I: joystick position signal in response to the two cues on hit trials, aligned to cue onset. Data represent the mean of one well-trained animal from the one-alternative choice task group on the recording day. J: same as I but aligned to the time of joystick movement threshold. K: there was no significant difference in hit rate across all animals tested on the one-alternative choice task (n = 6 mice, paired t test, t5 = 2.29, P = 0.07). L: there was no significant difference in error rate across all animals tested on the one-alternative choice task (n = 6 mice, paired t test, t5 = 1.55, P = 0.18). M: distribution of the lever press times on cue 1 (blue) and cue 2 (green) hit trials, for the same animal as I and J. N: there was no significant difference in mean lever press time across all animals tested on the one-alternative choice task (n = 6 mice, paired t test, t5 = 2.32, P = 0.068). ns, P > 0.05.
One-alternative choice task.
A separate group of mice (n = 6) was trained on a task identical to the two-alternative choice task, except the rewarded response to both auditory cues was movement of the joystick lever in the same direction (forward). The final stage of training had a duration of 3–13 days. Including all stages of training, animals belonging to the one-alternative choice task group were trained for 9–17 days including the recording session.
Offline behavioral data analysis.
The joystick voltage signal was downsampled to 1 kHz for offline analysis. The baseline position was calculated from the mean joystick position in the 1-s release period. There were three types of behavioral responses to each cue: hit (moving the joystick past the threshold position in the correct direction, resulting in reward); nonresponsive (joystick movement failing to cross the threshold position); and error (moving the joystick in the incorrect direction). The hit and error rates were defined as:
where Nhit, NNR, and Nerror represent the number of hit, nonresponsive, and error trials, respectively.
Electrophysiology.
Silicon microprobes containing a total of 256 electrodes (Yang et al. 2020) were used to simultaneously record from ventral and lateral orbital subregions of OFC, as well as DMS (128 electrodes per area; probe model 128K in OFC and 128DN in DMS). To confirm the probe location, the silicon shafts were coated with a fluorescent dye (DiD, Thermo Fisher Scientific) before insertion. The target insertion coordinates relative to bregma were 2.6 mm anterior, 0.8–1.4 mm lateral, 2.7 mm ventral in OFC, and 1.0 mm anterior, 1.1–1.55 mm lateral, 3.5 mm ventral in DMS. Recordings were in the right hemisphere, contralateral to the joystick manipulation arm. Data were acquired at a sampling rate of 25 kHz, bandpass filtered from 300 to 7,000 Hz, and spike sorted with Kilosort (Pachitariu et al. 2016). Analysis of neural activity only included putative single-unit clusters and did not further classify units into different subpopulations such as medium spiny projection neurons or fast spiking interneurons. There was only one recording session per animal.
Single-neuron response selectivity analysis.
Analysis of single-neuron responses only used hit trials, separated into two trial types corresponding to cues 1 and 2. Spike trains were aligned to either the time of cue onset or movement threshold, binned in 1-ms steps, and smoothed with a Gaussian kernel (15-ms standard deviation). Each neuron’s selectivity for one of the two trial types was assessed with a receiver operating characteristic (ROC) analysis (Feierstein et al. 2006), which was applied on activity 0–100 ms of cue onset (for cue-aligned data) or 0–100 ms before movement threshold (for movement-aligned data). The selectivity index, with a range of ±1, was calculated from the area under the ROC curve (auROC) as follows:
where positive and negative values corresponded to higher responsiveness for cue 2 and cue 1 trials, respectively. The significance of neural selectivity was assessed with bootstrapping 100 times, using a threshold probability value of 0.05.
Population decoding analysis.
All decoding analysis was performed on concurrently recorded ensembles. The goal of the decoding analysis was to train a classifier that could distinguish between cue 1 and cue 2 hit trials at different times relative to cue onset or movement threshold. Decoding was based on a linear support vector machine (SVM) learning algorithm (Chang and Lin 2011), with 80% of trials used for training and the remaining 20% for testing the accuracy (half of the test trials were from cue 1, the other half from cue 2). Within each animal, the number of cue 1 and cue 2 trials used in the decoder was matched (range: 98–344 for decoding on hit trials and 30–211 for decoding on nonresponsive trials). To enable a pairwise comparison between simultaneously recorded data in OFC and DMS, within each animal we also matched the number of OFC and DMS neurons (range: 15–83). This process was repeated 1,000 times with different random sampling of trials and neurons. The mean decoding accuracy per animal was calculated from the average performance over the 1,000 iterations. We separately trained a decoder on data in which the test trial labels were randomly shuffled. Decoding analysis was performed on 100-ms segments of unsmoothed spiking data, and repeated in 10-ms time steps. The decoding latency was defined as the time step in which the mean accuracy crossed the 95% confidence interval (CI) calculated from 1,000 iterations of the shuffled data. The results note that, in some animals, the accuracy in OFC or DMS never crossed the 95% CI and thus could not be included in the analysis of decoding latency. To examine the effect of population size on decoding accuracy, we separately trained and tested an SVM decoder with a population of 5, 10, 15, 20, 30, or 40 randomly chosen neurons and calculated the average accuracy across 1,000 random drawings.
Experimental design and statistical analyses.
Statistical analysis was carried out with standard functions in MATLAB (MathWorks) and Prism (GraphPad Software). Data collection and analysis were not performed with blinding to the conditions of the experiments. No statistical methods were used to predetermine sample size, but our sample sizes are similar to those reported in previous publications. The sample size, type of test, and probability values are indicated in the figure legends. Data distribution was assumed to be normal, but this was not formally tested; t tests were always two sided. In all figures, the convention is *P < 0.05, **P < 0.01, ***P < 0.001, and not significant (ns) P > 0.05.
Data and code accessibility.
Data sets and code used in this study are available from the corresponding author upon request.
RESULTS
Action selection task for head-fixed mice.
We developed an auditory guided two-alternative choice task involving forelimb manipulation of a joystick. Head-fixed mice were trained to move a joystick lever forward in response to a low frequency tone, and backward in response to a high frequency tone (n = 6 mice, Fig. 1, A–C). A sweetened milk reward was delivered immediately after making the correct choice, with both cues associated with the same volume of liquid. After training, mice made a statistically similar proportion of correct (hit trial) and incorrect (error trial) choices after each type of cue (Fig. 1, D and E). The hit rate on cue 1 trials was uncorrelated with the hit rate on cue 2 trials (Pearson correlation, r = 0.34, P = 0.51). Additionally, there was no significant difference in lever press time relative to cue onset (Fig. 1, F and G). This appears to show that there was no bias in the animal’s perceived value of performing forward or backward joystick movements. Nevertheless, a potential concern with this task is that if OFC or DMS activity discriminates between different auditory tone frequencies (Guo et al. 2018), this would interfere with the interpretation of action selectivity. To account for potential auditory coding differences in the absence of action selection, we introduced a one-alternative choice task in a separate group of mice. Here, both cues were associated with joystick movement in the same direction (forward), and equal reward volume (n = 6 mice, Fig. 1, H–J). Again, the response rate was similar between the two cue types (Fig. 1, K and L), and there was no significant difference in lever press time (Fig. 1, M and N). We therefore reasoned that any differences found between OFC and DMS neural activity in the two-alternative, but not the one-alternative choice task, would provide strong evidence for differential encoding of action selection in these brain areas.
Higher proportion of cue-selective neurons in DMS.
To examine activity in OFC and DMS during task performance in well-trained mice, we used silicon microprobes to record from dozens of neurons in these areas in parallel (Fig. 2). We first assessed the cue-aligned response of individual neurons recorded from the two-alternative choice task group (Fig. 3A). We used ROC analysis to calculate their selectivity during the cue period. We found neurons in both areas that showed selectivity for one of the trial types (Fig. 3B), but the proportion of cue-selective neurons was significantly higher in DMS (Fig. 3C). A sizable fraction of neurons recorded from the one-alternative choice task group were also selective for one of the auditory tones (Fig. 3, D and E), and again DMS contained a greater proportion of cue-selective neurons than OFC (Fig. 3F). The proportion of total selective cells pooled from all animals was also found to be similar between the two task groups (OFC: 124/415 of cells in the two-alternative versus 109/380 in the one-alternative choice task, chi-square test, P = 0.71; DMS: 256/379 in the two-alternative versus 325/457 in the one-alternative choice task, chi-square test, P = 0.26). Therefore, the regional differences in cue period selectivity found in the two-alternative choice task group appear to be at least partly driven by stronger auditory tone discrimination in DMS, in the absence of overt action selection processes. Next, to examine neural activity during the movement period, which is less likely to be biased by auditory tone discrimination, we performed ROC analysis on data aligned to the time of movement threshold (Fig. 4A). For recordings made from the two-alternative choice task group, a subset of neurons showed selectivity for one of the trial types (Fig. 4B), and the proportion of selective neurons was statistically similar in the two brain areas (Fig. 4C). Data from the one-alternative choice task group also did not show a significant difference in the fraction of selective neurons between OFC and DMS during the movement period (Fig. 4, D–F). On the other hand, the proportion of total selective cells pooled from all animals was significantly higher for the two-alternative choice task group (OFC: 146/415 of cells in the two-alternative versus 38/380 in the one-alternative choice task, chi-square test, P < 0.0001; DMS: 164/379 in the two-alternative versus 81/457 in the one-alternative choice task, chi-square test, P < 0.0001). Thus, while recordings from both types of tasks contained neurons with selective responses in the movement period, the number of these selective cells was enriched in the task with two instead of one possible actions. These results suggest that neural selectivity in the movement period was largely due to encoding of the animal’s choice of action, rather than persistent effects of auditory tone discrimination. However, significant regional differences in the selectivity index were only observed for cue- but not movement-aligned data, which raises potential ambiguities in interpreting the findings in the context of action selection.
Fig. 2.
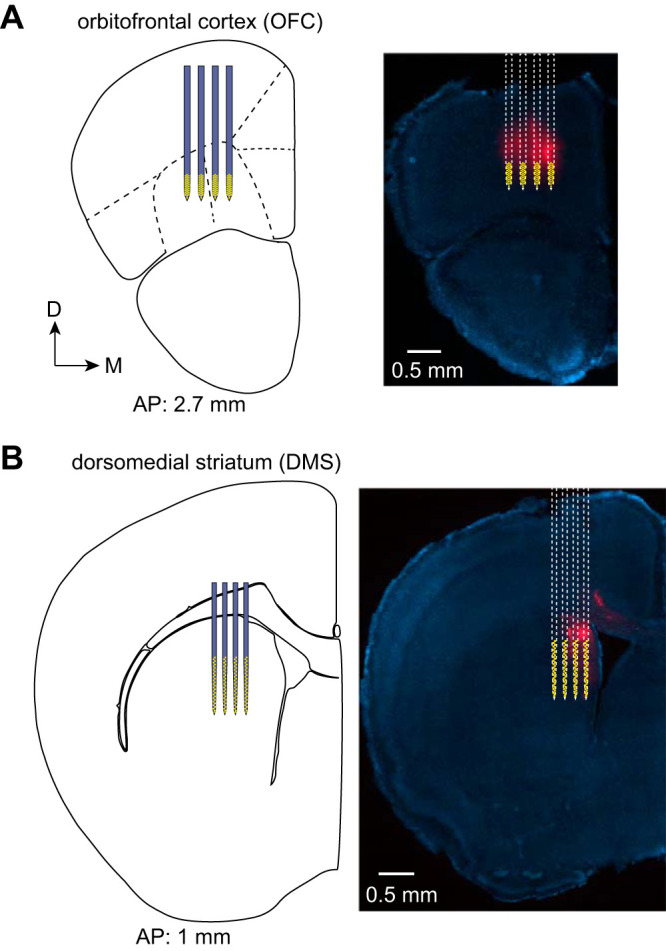
Simultaneous electrophysiological recordings in orbitofrontal cortex (OFC) and dorsomedial striatum (DMS). A, left: a 128 electrode silicon microprobe with four shafts targeted the ventral and lateral orbital subregions of OFC. Yellow markings indicate the location of the electrode recording sites. The anterior-posterior (AP) position from bregma is indicated at the bottom. Right: fluorescence image of a brain slice showing the track made by the DiD dye coated on the probe (red), with a superimposed drawing of the silicon microprobe. Slices were stained with DAPI (blue). D and M represent dorsal and medial directions, respectively. B: same as A, but for a separate 128 electrode silicon microprobe targeting DMS in the same animal.
Fig. 3.

Higher proportion of selective neurons in dorsomedial striatum (DMS) in the cue period. A: mean firing rate versus time of one orbitofrontal cortex (OFC; left) and DMS (right) neuron, with data aligned to cue onset. Data in A–C are from animals in the two-alternative choice task group. Blue and green lines represent cue 1 (low-frequency) and cue 2 (high-frequency) hit trials, respectively. The dashed vertical lines demarcate the time interval used to calculate the selectivity index in the cue period. Shaded areas represent SE. B: selectivity index distribution of OFC (top) and DMS (bottom) neurons in the cue period. Positive (negative) values reflect stronger responses to cue 2 (cue 1). Gray bars represent all cells, and black bars represent significantly selective cells. Neurons are pooled across all six animals in the two-alternative choice task group (n = 124 out of 415 cells in OFC, and 256 out of 379 cells in DMS were selective). C: the fraction of neurons per animal that were selective in the cue period was significantly higher in DMS compared with OFC (n = 6 mice, paired t test, t5 = 4.1, P = 0.0096). Red lines represent the mean values. D: mean firing rate versus time of one OFC (left) and DMS (right) neuron, with data aligned to cue onset. Data in panels D–F are from animals in the one-alternative choice task group. E: selectivity index distribution of OFC (top) and DMS (bottom) neurons in the cue period. Neurons are pooled across all six animals in the one-alternative choice task group (n = 109 out of 380 cells in OFC, and 325 out of 457 cells in DMS were selective). F: the fraction of neurons per animal that were selective in the cue period was significantly higher in DMS compared with OFC (n = 6 mice, paired t test, t5 = 3, P = 0.03). *P < 0.05, **P < 0.01.
Fig. 4.

Similar proportion of selective neurons between orbitofrontal cortex (OFC) and dorsomedial striatum (DMS) in the movement period. A: mean firing rate versus time of one (left) and DMS (right) neuron, with data aligned to movement threshold. Data in A–C are from animals in the two-alternative choice task group. Blue and green lines represent cue 1 (low frequency) and cue 2 (high frequency) hit trials, respectively. The dashed vertical lines demarcate the time interval used to calculate the selectivity index in the movement period. Shaded areas represent SE B: selectivity index distribution of OFC (top) and DMS (bottom) neurons in the movement period. Positive (negative) values reflect stronger responses to cue 2 (cue 1). Gray bars represent all cells, and black bars represent significantly selective cells. Neurons are pooled across all 6 animals in the two-alternative choice task group (n = 146 out of 415 cells in OFC, and 164 out of 379 cells in DMS were selective). C: the fraction of neurons per animal that were selective in the movement period was not significantly different between OFC and DMS (n = 6 mice, paired t test, t5 = 2.3, P = 0.07). Red lines represent the mean values. D: mean firing rate versus time of one OFC (left) and DMS (right) neuron, with data aligned to movement threshold. Data in D–F are from animals in the one-alternative choice task group. E: selectivity index distribution of OFC (top) and DMS (bottom) neurons in the movement period. Neurons are pooled across all six animals in the one-alternative choice task group (n = 38 out of 380 cells in OFC, and 81 out of 457 cells in DMS were selective). F: the fraction of neurons per animal that were selective in the movement period was not significantly different between OFC and DMS (n = 6 mice, paired t test, t5 = 0.9, P = 0.43). ns, P > 0.05.
More accurate decoding of selected action from DMS population dynamics.
Similar to previous electrophysiological studies using two-alternative choice tasks, our data showed substantial heterogeneity in the response properties of individual neurons (Feierstein et al. 2006; Guo et al. 2019). Thus, determining the proportion of selective neurons may not be a reliable way to compare information processing across brain areas. Since our recording approach provided simultaneous access to multiple neurons from OFC and DMS, we were able to explore this issue by applying decoding methods to compare trial-by-trial population dynamics. SVM decoders were trained to distinguish between cue 1 and cue 2 hit trials based on the activity of simultaneously measured ensembles.
Decoder performance in each area was quantified in terms of two parameters: accuracy in assigning test trials to the correct cue type, and latency to reach a statistically significant accuracy level (95% CI). In the two-alternative choice task group, decoding accuracy in both areas increased rapidly after cue onset (Fig. 5A). However, on average, DMS population activity had both a significantly higher accuracy and lower latency of decoding than OFC (Fig. 5, B and C). In contrast, in the one-alternative task group, neither the accuracy nor latency was statistically distinguishable between the two brain areas (Fig. 5, D–F). These results were qualitatively different from the single-neuron selectivity index analysis in the same data set (Fig. 3F).
Fig. 5.

More accurate and rapid decoding from dorsomedial striatum (DMS) population activity in the cue period for the two- but not one-alternative choice task. A: mean decoding accuracy versus time in orbitofrontal cortex (OFC; top, black) and DMS (bottom, red) of one animal with data aligned to cue onset. Data in A–C are from animals in the two-alternative choice task group. The decoder was trained to distinguish cue 1 from cue 2 hit trials. The dashed and solid blue lines represent the mean and 95% confidence interval (CI) of the decoder performance tested on shuffled data. Decoding was performed on 100-ms segments of data and repeated in 10-ms steps. The arrows indicate the decoding latency, corresponding to the time step in which the mean decoding accuracy crossed the 95% CI. B: mean decoding accuracy versus time of all animals (n = 6 mice). The dashed vertical lines demarcate the 100 ms cue period used to calculate the decoding accuracy in C. Shaded areas represent SE. C, left: the mean decoding accuracy in the cue period was significantly higher in DMS relative to OFC (n = 6 mice, paired t test, t5 = 4.4, P = 0.007). Right: the mean decoding latency was significantly smaller in DMS relative to OFC (n = 6 mice, paired t test, t5 = 2.7, P = 0.04). Red lines represent the mean values. The average decoding latency was 120 ± 33 ms in OFC, 33 ± 3 ms in DMS, (mean ± SE relative to cue onset). On average the decoding latency was 87 ms lower in DMS relative to OFC (representing the difference between the values at the red lines). D: mean decoding accuracy versus time in OFC (top, black) and DMS (bottom, red) of one animal with data aligned to cue onset. Data in D–F are from animals in the one-alternative choice task group. E: mean decoding accuracy versus time of all animals (n = 6 mice). The dashed vertical lines demarcate the 100-ms cue period used to calculate the decoding accuracy in F. F, left: the mean decoding accuracy in the cue period was not significantly different between OFC and DMS (n = 6 mice, paired t test, t5 = 0.9, P = 0.39). Right, the mean decoding latency was not significantly different between OFC and DMS (n = 4 mice, paired t test, t3 = 1, P = 0.39). Note that decoders trained on data from two animals failed to cross the 95% CI level, thus those animals could not be included in the decoding latency analysis. The average decoding latency was 50 ± 20 ms in OFC, 30 ± 4 ms in DMS, (mean ± SE relative to cue onset). *P < 0.05, **P < 0.01, and not significant (ns) P > 0.05.
To determine how decoding accuracy depended on the population size, we compared the accuracy of SVM decoders that were tested on different numbers of neurons. The accuracy improved with greater population size, but only the two-alternative choice task group showed significant differences between OFC and DMS (Fig. 6, A and B), consistent with the finding that DMS contains a better population code for action selection.
Fig. 6.
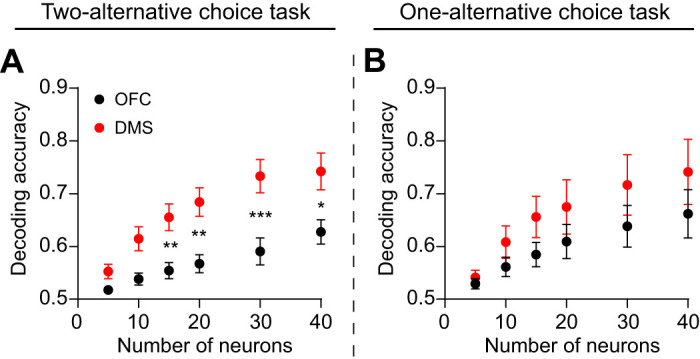
Decoding accuracy improves with population size. A: decoding accuracy in the cue period as a function of number of neurons in orbitofrontal cortex (OFC) and dorsomedial striatum (DMS) for hit trials on the two-alternative choice task group. Due to differences in the number of simultaneously recorded neurons across animals, the number of animals is not equal for all data points (n = 6 mice for a size of 5, 10, 15, 20 neurons, n = 5 mice for a size of 30 neurons, and n = 4 mice for a size of 40 neurons). A two-way ANOVA revealed a significant effect of the number of neurons (F5,54 = 12.1, P < 0.0001). Post hoc Sidak’s test between OFC and DMS: 5 neurons, P = 0.804; 10 neurons, P = 0.068; 15 neurons, P = 0.007; 20 neurons, P = 0.001, 30 neurons, P = 0.0003; 40 neurons, P = 0.014. B: decoding accuracy in the cue period as a function of number of neurons in OFC and DMS for hit trials on the one-alternative choice task group. Due to differences in the number of simultaneously recorded neurons across animals, the number of animals is not equal for all data points (n = 6 mice for a size of 5, 10, 15 neurons, and n = 5 mice for a size of 20, 30, 40 neurons). A two-way ANOVA revealed a significant effect of the number of neurons (F5,54 = 5.6, P = 0.0003). Post hoc Sidak’s test between OFC and DMS: 5 neurons, P > 0.99 10 neurons, P = 0.924; 15 neurons, P = 0.637; 20 neurons, P = 0.793, 30 neurons, P = 0.638; 40 neurons, P = 0.622. *P < 0.05, **P < 0.01, ***P < 0.001.
To confirm that the higher accuracy in DMS in the two-alternative choice task reflects more accurate encoding of action, rather than auditory tone selectivity, we also applied the SVM decoder on a different subset of trials (nonresponsive), in which animals failed to move the lever to the threshold position (Fig. 7A). There was no significant bias in decoding accuracy between OFC and DMS on nonresponsive trials, although the difference was close to being significant (P = 0.056, Fig. 7B). On average a small amount of lever movement was observed even on nonresponsive trials, and thus accurate decoding on these trials is likely to reflect action selectivity to a smaller extent than on hit trials.
Fig. 7.
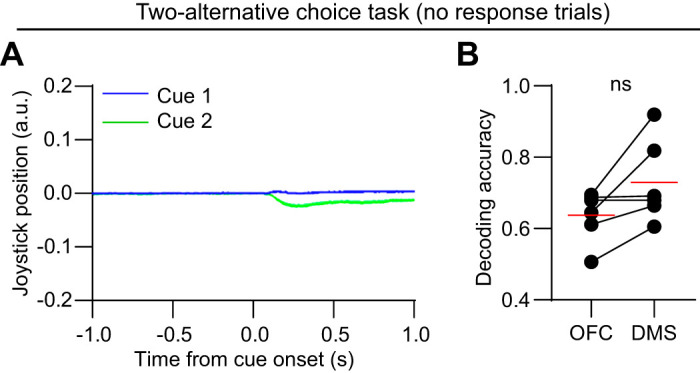
Decoding accuracy is not significantly different on nonresponsive trials. A: joystick position signal in response to the two cues on nonresponsive trials, aligned to cue onset. Data represent the mean of one well-trained animal from the two-alternative choice task group on the recording day (same animal as that shown in Fig. 1B). Shaded areas represent standard error of the mean (SE). B: the mean decoding accuracy in the cue period was not significantly different between orbitofrontal cortex (OFC) and dorsomedial striatum (DMS) on nonresponsive trials (n = 6 mice, paired t test, t5 = 2.5, P = 0.056). a.u., Arbitrary units; ns, P > 0.05.
In the two-alternative choice task group, decoding accuracy, but not latency, remained significantly better in DMS for movement-aligned data on hit trials (Fig. 8, A–C), again in marked contrast to the results of analysis of single-neuron selectivity (Fig. 4C). However, decoding accuracy in the movement period was not statistically distinguishable between the two areas in data from the one-alternative choice task group (Fig. 8, D–F).
Fig. 8.

More accurate decoding from dorsomedial striatum (DMS) population activity in the movement period for the two- but not one-alternative choice task. A: mean decoding accuracy versus time in orbitofrontal cortex (OFC; top, black) and DMS (bottom, red) of one animal with data aligned to movement threshold. Data in A–C are from animals in the two-alternative choice task group. The dashed and solid blue lines represent the mean and 95% confidence interval (CI) of the decoder performance tested on shuffled data. The arrows indicate the decoding latency. B: mean decoding accuracy versus time of all animals (n = 6 mice). The dashed vertical lines demarcate the 100 ms movement period used to calculate the decoding accuracy in C. Shaded areas represent SE. C, left: the mean decoding accuracy in the movement period was significantly higher in DMS relative to OFC (n = 6 mice, paired t test, t5 = 2.8, P = 0.04). Right, the mean decoding latency was not significantly different between OFC and DMS (n = 6 mice, paired t test, t5 = 2, P = 0.1). The average decoding latency was −238 ± 37 ms in OFC, −408 ± 113 ms in DMS (mean ± SE relative to movement threshold). D: mean decoding accuracy versus time in OFC (top, black) and DMS (bottom, red) of one animal with data aligned to movement threshold. Data in D–F are from animals in the one-alternative choice task group. E: mean decoding accuracy versus time of all animals (n = 6 mice). The dashed vertical lines demarcate the 100 ms movement period used to calculate the decoding accuracy in F. F: the mean decoding accuracy in the movement period was not significantly different between OFC and DMS (n = 6 mice, paired t test, t5 = 0.5, P = 0.64). Note that for all animals, decoders trained on data from OFC or DMS failed to cross the 95% CI level, and thus decoding latency analysis could not be performed. *P < 0.05; ns, P > 0.05.
DISCUSSION
Taken together, the decoding results suggest that DMS neural populations are significantly better at representing an animal’s selected action than an equivalent number of concurrently recorded cells in OFC. These regional differences were apparent both for the cue and movement period. Importantly, significant differences in decoding accuracy were only observed in data from the two-alternative but not the one-alternative choice task group, suggesting that these effects reflect action rather than auditory tone selectivity. Moreover, more accurate decoding in DMS was only observed on hit trials, but not on nonresponsive trials (Fig. 7), providing further evidence that these results are unlikely to reflect regional variations in auditory tone selectivity. Finally, the results obtained with population decoding methods were qualitatively different from those obtained with analysis of single-neuron selectivity, which yielded less consistent findings between the cue and movement period.
This work used joystick-based action selection tasks specifically developed for experiments in head-fixed mice (Nonomura et al. 2018). In combination with silicon microprobe recording tools targeting OFC and DMS in parallel, this approach enabled a regional comparison of neural dynamics within the same animal and behavioral session. Selectivity of dynamics to specific trial types was assessed both at the level of individual cells using ROC analysis and at the level of neural populations using SVM decoding methods. There were some important qualitative differences between these modes of analysis. Overall, individual neuron ROC analysis gave internally inconsistent results, showing regional differences in the proportion of selective cells for cue- but not movement-aligned data (Figs. 3C and 4C). Furthermore, since the trends were similar for data from the two-alternative and one-alternative choice tasks, it was unclear whether selectivity reflected action or auditory tone discrimination. By comparison, population decoding methods were internally consistent, showing regional differences in decoding accuracy for both cue- and movement-aligned data (Figs. 5C and 8C). The most parsimonious explanation for the discrepancy between the two methods used to analyze neural selectivity is that population decoding methods revealed aspects of computation in OFC or DMS that were less apparent or accessible from ROC analysis of individual neuron firing.
Our findings appear to disagree with a study in nonhuman primates, which concluded that lateral prefrontal cortex contains a better representation of action selection than dorsal striatum (Seo et al. 2012). This discrepancy may arise from differences in which two functionally distinct subregions of frontal cortex and striatum were compared (Ito and Doya 2015; Izquierdo 2017), the methods used to assess neural selectivity, or the details of the behavioral task. On the other hand, other studies have challenged the view that OFC strongly influences an animal’s current choice of action (Gardner et al. 2017) but suggest instead that this area participates in learning or updating choices on future trials (Constantinople et al. 2019; Miller et al. 2018). More generally, numerous lines of evidence suggest that OFC represents information that is not exclusively related to, and may even be distinct from, action selection, including spatial goals (Feierstein et al. 2006), value (Padoa-Schioppa and Assad 2006), action value (Simon et al. 2015), and complex cognitive maps representing the relationship between multiple facets of an animal’s environmental and behavioral state (Wilson et al. 2014). Furthermore, since the approaches in this work are correlative, we cannot conclude that DMS serves a more critical behavioral role in action selection than OFC. Rather, populations of DMS neurons appear to more accurately encode information about an animal’s choice of action compared with OFC, at least under the conditions used here.
Some studies have suggested that behavior shifts from DMS to dorsolateral striatum dependent during the transition from goal-directed to habitual responses (Gremel and Costa 2013; Thorn et al. 2010; Yin et al. 2009). This could potentially influence the interpretation of our findings; however, based on the robust encoding of action selection in DMS, we speculate there was insufficient training to make responding habitual. Alternatively, the types of tasks employed here may not support habit formation.
A potential caveat of this work is that OFC and DMS may use distinct strategies to encode information in the tasks with one and two alternative choices. In particular, the one-alternative choice task requires animals to respond to a cue without needing to select between different possible actions. Additionally, despite more protracted training, behavioral performance was worse in animals belonging to the two-alternative choice task group. For these reasons, there may be limitations in comparing results across the two task conditions. Nevertheless, the results suggest differences in how populations of OFC and DMS neurons represent information in the two-alternative choice task. Since that task requires correct action selection, the observed encoding differences are unlikely to be exclusively due to differences in auditory cue encoding.
There are a number of potential mechanisms for the observed difference in OFC and DMS population dynamics. One possibility is that other sources of input may convey complementary signals to DMS (Ponvert and Jaramillo 2019). Another study found that medial prefrontal cortex (mPFC), which also projects to DMS, contains a greater proportion of action-selective units than OFC (Simon et al. 2015), suggesting that mPFC exhibits more accurate encoding of action selection than OFC. There is also some indirect support from our observation that decoding not only was more accurate but reached a significant level of performance on average 87 ms earlier in DMS than OFC (Fig. 5C). This temporal lag even raises the possibility that action selection signals propagate from DMS to OFC through basal ganglia-cortical feedback loops (Oldenburg and Sabatini 2015). Since corticostriatal projections are a major source of excitatory drive in the striatum (Emmons et al. 2017; Shepherd 2013), another possibility is that striatal microcircuits amplify or refine incoming cortical signals to improve information processing (Bakhurin et al. 2017). This could occur via gain modulation effects at corticostriatal synapses (Lee et al. 2019) or contributions from local interneurons that may modify striatal output (Gittis et al. 2010).
GRANTS
SCM was supported by NIH grants NS100050, NS096994, DA042739, DA005010, and NSF NeuroNex Award 1707408.
DISCLOSURES
No conflicts of interest, financial or otherwise, are declared by the authors.
AUTHOR CONTRIBUTIONS
L.Y. and S.C.M. conceived and designed research; L.Y. performed experiments; L.Y. analyzed data; L.Y. and S.C.M. interpreted results of experiments; L.Y. prepared figures; L.Y. drafted manuscript; L.Y. and S.C.M. edited and revised manuscript; L.Y. and S.C.M. approved final version of manuscript.
REFERENCES
- Ahmari SE, Spellman T, Douglass NL, Kheirbek MA, Simpson HB, Deisseroth K, Gordon JA, Hen R. Repeated cortico-striatal stimulation generates persistent OCD-like behavior. Science 340: 1234–1239, 2013. doi: 10.1126/science.1234733. [DOI] [PMC free article] [PubMed] [Google Scholar]
- Alexander GE, DeLong MR, Strick PL. Parallel organization of functionally segregated circuits linking basal ganglia and cortex. Annu Rev Neurosci 9: 357–381, 1986. doi: 10.1146/annurev.ne.09.030186.002041. [DOI] [PubMed] [Google Scholar]
- Bakhurin KI, Goudar V, Shobe JL, Claar LD, Buonomano DV, Masmanidis SC. Differential encoding of time by prefrontal and striatal network dynamics. J Neurosci 37: 854–870, 2017. doi: 10.1523/JNEUROSCI.1789-16.2016. [DOI] [PMC free article] [PubMed] [Google Scholar]
- Balleine BW, Delgado MR, Hikosaka O. The role of the dorsal striatum in reward and decision-making. J Neurosci 27: 8161–8165, 2007. doi: 10.1523/JNEUROSCI.1554-07.2007. [DOI] [PMC free article] [PubMed] [Google Scholar]
- Bradfield LA, Dezfouli A, van Holstein M, Chieng B, Balleine BW. Medial orbitofrontal cortex mediates outcome retrieval in partially observable task situations. Neuron 88: 1268–1280, 2015. doi: 10.1016/j.neuron.2015.10.044. [DOI] [PubMed] [Google Scholar]
- Burguière E, Monteiro P, Feng G, Graybiel AM. Optogenetic stimulation of lateral orbitofronto-striatal pathway suppresses compulsive behaviors. Science 340: 1243–1246, 2013. doi: 10.1126/science.1232380. [DOI] [PMC free article] [PubMed] [Google Scholar]
- Chang CC, Lin CJ. LIBSVM: a library for support vector machines. Acm Trans Intel Syst Tech 2: 27, 2011. doi: 10.1145/1961189.1961199. [DOI] [Google Scholar]
- Constantinople CM, Piet AT, Bibawi P, Akrami A, Kopec C, Brody CD. Lateral orbitofrontal cortex promotes trial-by-trial learning of risky, but not spatial, biases. eLife 8: 49744, 2019. doi: 10.7554/eLife.49744. [DOI] [PMC free article] [PubMed] [Google Scholar]
- Corbit VL, Manning EE, Gittis AH, Ahmari SE. Strengthened inputs from secondary motor cortex to striatum in a mouse model of compulsive behavior. J Neurosci 39: 2965–2975, 2019. doi: 10.1523/JNEUROSCI.1728-18.2018. [DOI] [PMC free article] [PubMed] [Google Scholar]
- Emmons EB, De Corte BJ, Kim Y, Parker KL, Matell MS, Narayanan NS. Rodent medial frontal control of temporal processing in the dorsomedial striatum. J Neurosci 37: 8718–8733, 2017. doi: 10.1523/JNEUROSCI.1376-17.2017. [DOI] [PMC free article] [PubMed] [Google Scholar]
- Feierstein CE, Quirk MC, Uchida N, Sosulski DL, Mainen ZF. Representation of spatial goals in rat orbitofrontal cortex. Neuron 51: 495–507, 2006. doi: 10.1016/j.neuron.2006.06.032. [DOI] [PubMed] [Google Scholar]
- Frank MJ. Computational models of motivated action selection in corticostriatal circuits. Curr Opin Neurobiol 21: 381–386, 2011. doi: 10.1016/j.conb.2011.02.013. [DOI] [PubMed] [Google Scholar]
- Friedman A, Homma D, Gibb LG, Amemori K, Rubin SJ, Hood AS, Riad MH, Graybiel AM. A corticostriatal path targeting striosomes controls decision-making under conflict. Cell 161: 1320–1333, 2015. doi: 10.1016/j.cell.2015.04.049. [DOI] [PMC free article] [PubMed] [Google Scholar]
- Gardner MPH, Conroy JS, Shaham MH, Styer CV, Schoenbaum G. Lateral orbitofrontal inactivation dissociates devaluation-sensitive behavior and economic choice. Neuron 96: 1192–1203.e4, 2017. doi: 10.1016/j.neuron.2017.10.026. [DOI] [PMC free article] [PubMed] [Google Scholar]
- Gittis AH, Nelson AB, Thwin MT, Palop JJ, Kreitzer AC. Distinct roles of GABAergic interneurons in the regulation of striatal output pathways. J Neurosci 30: 2223–2234, 2010. doi: 10.1523/JNEUROSCI.4870-09.2010. [DOI] [PMC free article] [PubMed] [Google Scholar]
- Gremel CM, Costa RM. Orbitofrontal and striatal circuits dynamically encode the shift between goal-directed and habitual actions. Nat Commun 4: 2264, 2013. doi: 10.1038/ncomms3264. [DOI] [PMC free article] [PubMed] [Google Scholar]
- Guo L, Walker WI, Ponvert ND, Penix PL, Jaramillo S. Stable representation of sounds in the posterior striatum during flexible auditory decisions. Nat Commun 9: 1534, 2018. doi: 10.1038/s41467-018-03994-3. [DOI] [PMC free article] [PubMed] [Google Scholar]
- Guo L, Weems JT, Walker WI, Levichev A, Jaramillo S. Choice-selective neurons in the auditory cortex and in its striatal target encode reward expectation. J Neurosci 39: 3687–3697, 2019. doi: 10.1523/JNEUROSCI.2585-18.2019. [DOI] [PMC free article] [PubMed] [Google Scholar]
- Humphries MD, Stewart RD, Gurney KN. A physiologically plausible model of action selection and oscillatory activity in the basal ganglia. J Neurosci 26: 12921–12942, 2006. doi: 10.1523/JNEUROSCI.3486-06.2006. [DOI] [PMC free article] [PubMed] [Google Scholar]
- Hwang EJ, Link TD, Hu YY, Lu S, Wang EH, Lilascharoen V, Aronson S, O’Neil K, Lim BK, Komiyama T. Corticostriatal flow of action selection bias. Neuron 104: 1126–1140.e6, 2019. doi: 10.1016/j.neuron.2019.09.028. [DOI] [PMC free article] [PubMed] [Google Scholar]
- Ito M, Doya K. Distinct neural representation in the dorsolateral, dorsomedial, and ventral parts of the striatum during fixed- and free-choice tasks. J Neurosci 35: 3499–3514, 2015. doi: 10.1523/JNEUROSCI.1962-14.2015. [DOI] [PMC free article] [PubMed] [Google Scholar]
- Izquierdo A. Functional heterogeneity within rat orbitofrontal cortex in reward learning and decision making. J Neurosci 37: 10529–10540, 2017. doi: 10.1523/JNEUROSCI.1678-17.2017. [DOI] [PMC free article] [PubMed] [Google Scholar]
- Kimchi EY, Laubach M. Dynamic encoding of action selection by the medial striatum. J Neurosci 29: 3148–3159, 2009. doi: 10.1523/JNEUROSCI.5206-08.2009. [DOI] [PMC free article] [PubMed] [Google Scholar]
- Lee K, Bakhurin KI, Claar LD, Holley SM, Chong NC, Cepeda C, Levine MS, Masmanidis SC. Gain modulation by corticostriatal and thalamostriatal input signals during reward-conditioned behavior. Cell Reports 29: 2438–2449.e4, 2019. doi: 10.1016/j.celrep.2019.10.060. [DOI] [PMC free article] [PubMed] [Google Scholar]
- Miller KJ, Botvinick MM, Brody CD. Value representations in the orbitofrontal cortex drive learning, not choice (Preprint). bioRxiv 245720, 2018. doi: 10.1101/245720 [DOI] [PMC free article] [PubMed]
- Mink JW. The basal ganglia: focused selection and inhibition of competing motor programs. Prog Neurobiol 50: 381–425, 1996. doi: 10.1016/S0301-0082(96)00042-1. [DOI] [PubMed] [Google Scholar]
- Moorman DE, Aston-Jones G. Orbitofrontal cortical neurons encode expectation-driven initiation of reward-seeking. J Neurosci 34: 10234–10246, 2014. doi: 10.1523/JNEUROSCI.3216-13.2014. [DOI] [PMC free article] [PubMed] [Google Scholar]
- Murray EA, Izquierdo A. Orbitofrontal cortex and amygdala contributions to affect and action in primates. Ann N Y Acad Sci 1121: 273–296, 2007. doi: 10.1196/annals.1401.021. [DOI] [PubMed] [Google Scholar]
- Nonomura S, Nishizawa K, Sakai Y, Kawaguchi Y, Kato S, Uchigashima M, Watanabe M, Yamanaka K, Enomoto K, Chiken S, Sano H, Soma S, Yoshida J, Samejima K, Ogawa M, Kobayashi K, Nambu A, Isomura Y, Kimura M. Monitoring and updating of action selection for goal-directed behavior through the striatal direct and indirect pathways. Neuron 99: 1302–1314.e5, 2018. doi: 10.1016/j.neuron.2018.08.002. [DOI] [PubMed] [Google Scholar]
- Oldenburg IA, Sabatini BL. Antagonistic but not symmetric regulation of primary motor cortex by basal ganglia direct and indirect pathways. Neuron 86: 1174–1181, 2015. [Erratum in Neuron 87: P244, 2015]. doi: 10.1016/j.neuron.2015.05.008. [DOI] [PMC free article] [PubMed] [Google Scholar]
- Ostlund SB, Balleine BW. The contribution of orbitofrontal cortex to action selection. Ann N Y Acad Sci 1121: 174–192, 2007. doi: 10.1196/annals.1401.033. [DOI] [PubMed] [Google Scholar]
- Pachitariu M, Steinmetz N, Kadir S, Carandini M, Harris KD. Kilosort: realtime spike-sorting for extracellular electrophysiology with hundreds of channels (Preprint). bioRxiv 061481, 2016. doi: 10.1101/061481 [DOI]
- Padoa-Schioppa C, Assad JA. Neurons in the orbitofrontal cortex encode economic value. Nature 441: 223–226, 2006. doi: 10.1038/nature04676. [DOI] [PMC free article] [PubMed] [Google Scholar]
- Pennartz CM, Berke JD, Graybiel AM, Ito R, Lansink CS, van der Meer M, Redish AD, Smith KS, Voorn P. Corticostriatal interactions during learning, memory processing, and decision making. J Neurosci 29: 12831–12838, 2009. doi: 10.1523/JNEUROSCI.3177-09.2009. [DOI] [PMC free article] [PubMed] [Google Scholar]
- Ponvert ND, Jaramillo S. Auditory thalamostriatal and corticostriatal pathways convey complementary information about sound features. J Neurosci 39: 271–280, 2019. doi: 10.1523/JNEUROSCI.1188-18.2018. [DOI] [PMC free article] [PubMed] [Google Scholar]
- Reig R, Silberberg G. Multisensory integration in the mouse striatum. Neuron 83: 1200–1212, 2014. doi: 10.1016/j.neuron.2014.07.033. [DOI] [PMC free article] [PubMed] [Google Scholar]
- Rothwell PE, Hayton SJ, Sun GL, Fuccillo MV, Lim BK, Malenka RC. Input- and output-specific regulation of serial order performance by corticostriatal circuits. Neuron 88: 345–356, 2015. doi: 10.1016/j.neuron.2015.09.035. [DOI] [PMC free article] [PubMed] [Google Scholar]
- Samejima K, Ueda Y, Doya K, Kimura M. Representation of action-specific reward values in the striatum. Science 310: 1337–1340, 2005. doi: 10.1126/science.1115270. [DOI] [PubMed] [Google Scholar]
- Schultz W, Romo R. Role of primate basal ganglia and frontal cortex in the internal generation of movements. I. Preparatory activity in the anterior striatum. Exp Brain Res 91: 363–384, 1992. doi: 10.1007/BF00227834. [DOI] [PubMed] [Google Scholar]
- Seo M, Lee E, Averbeck BB. Action selection and action value in frontal-striatal circuits. Neuron 74: 947–960, 2012. doi: 10.1016/j.neuron.2012.03.037. [DOI] [PMC free article] [PubMed] [Google Scholar]
- Sharpe MJ, Stalnaker T, Schuck NW, Killcross S, Schoenbaum G, Niv Y. An integrated model of action selection: distinct modes of cortical control of striatal decision making. Annu Rev Psychol 70: 53–76, 2019. doi: 10.1146/annurev-psych-010418-102824. [DOI] [PMC free article] [PubMed] [Google Scholar]
- Shepherd GM. Corticostriatal connectivity and its role in disease. Nat Rev Neurosci 14: 278–291, 2013. doi: 10.1038/nrn3469. [DOI] [PMC free article] [PubMed] [Google Scholar]
- Shin JH, Kim D, Jung MW. Differential coding of reward and movement information in the dorsomedial striatal direct and indirect pathways. Nat Commun 9: 404, 2018. doi: 10.1038/s41467-017-02817-1. [DOI] [PMC free article] [PubMed] [Google Scholar]
- Simon NW, Wood J, Moghaddam B. Action-outcome relationships are represented differently by medial prefrontal and orbitofrontal cortex neurons during action execution. J Neurophysiol 114: 3374–3385, 2015. doi: 10.1152/jn.00884.2015. [DOI] [PMC free article] [PubMed] [Google Scholar]
- Sippy T, Lapray D, Crochet S, Petersen CC. Cell-type-specific sensorimotor processing in striatal projection neurons during goal-directed behavior. Neuron 88: 298–305, 2015. doi: 10.1016/j.neuron.2015.08.039. [DOI] [PMC free article] [PubMed] [Google Scholar]
- Stalnaker TA, Calhoon GG, Ogawa M, Roesch MR, Schoenbaum G. Reward prediction error signaling in posterior dorsomedial striatum is action specific. J Neurosci 32: 10296–10305, 2012. doi: 10.1523/JNEUROSCI.0832-12.2012. [DOI] [PMC free article] [PubMed] [Google Scholar]
- Tai LH, Lee AM, Benavidez N, Bonci A, Wilbrecht L. Transient stimulation of distinct subpopulations of striatal neurons mimics changes in action value. Nat Neurosci 15: 1281–1289, 2012. doi: 10.1038/nn.3188. [DOI] [PMC free article] [PubMed] [Google Scholar]
- Thorn CA, Atallah H, Howe M, Graybiel AM. Differential dynamics of activity changes in dorsolateral and dorsomedial striatal loops during learning. Neuron 66: 781–795, 2010. doi: 10.1016/j.neuron.2010.04.036. [DOI] [PMC free article] [PubMed] [Google Scholar]
- Wang AY, Miura K, Uchida N. The dorsomedial striatum encodes net expected return, critical for energizing performance vigor. Nat Neurosci 16: 639–647, 2013. doi: 10.1038/nn.3377. [DOI] [PMC free article] [PubMed] [Google Scholar]
- Wilson RC, Takahashi YK, Schoenbaum G, Niv Y. Orbitofrontal cortex as a cognitive map of task space. Neuron 81: 267–279, 2014. doi: 10.1016/j.neuron.2013.11.005. [DOI] [PMC free article] [PubMed] [Google Scholar]
- Yang L, Lee K, Villagracia J, Masmanidis SC. Open source silicon microprobes for high throughput neural recording. J Neural Eng 17: 016036, 2020. doi: 10.1088/1741-2552/ab581a. [DOI] [PMC free article] [PubMed] [Google Scholar]
- Yin HH, Knowlton BJ, Balleine BW. Blockade of NMDA receptors in the dorsomedial striatum prevents action-outcome learning in instrumental conditioning. Eur J Neurosci 22: 505–512, 2005. doi: 10.1111/j.1460-9568.2005.04219.x. [DOI] [PubMed] [Google Scholar]
- Yin HH, Mulcare SP, Hilário MR, Clouse E, Holloway T, Davis MI, Hansson AC, Lovinger DM, Costa RM. Dynamic reorganization of striatal circuits during the acquisition and consolidation of a skill. Nat Neurosci 12: 333–341, 2009. doi: 10.1038/nn.2261. [DOI] [PMC free article] [PubMed] [Google Scholar]
- Znamenskiy P, Zador AM. Corticostriatal neurons in auditory cortex drive decisions during auditory discrimination. Nature 497: 482–485, 2013. doi: 10.1038/nature12077. [DOI] [PMC free article] [PubMed] [Google Scholar]