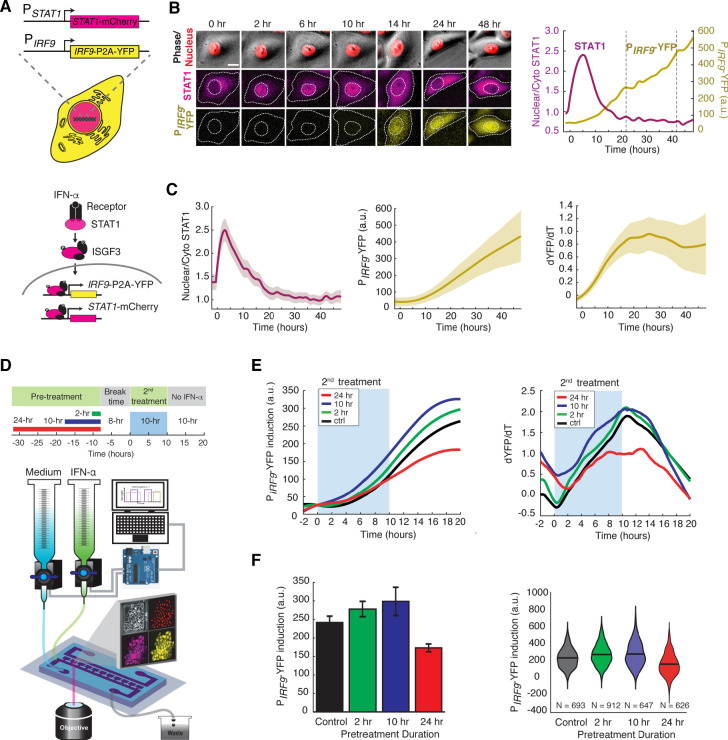
Figure 1. IFN-α pretreatments with different durations lead to opposite effects to the second stimulation.
(A) Schematic of HeLa reporter cell line engineered using CRISPR/Cas9 (top). STAT1 was tagged with mCherry at C-terminus to monitor the translocation and expression. The coding sequence for P2A-YFP was inserted at the C-terminus of IRF9 coding sequence to generate a transcription reporter (PIRF9). A simplified diagram of the IFN-α pathway components that can be monitored using the reporter cell line (bottom). (B) Time lapse images of a representative cell treated with 100 ng/ml IFN-α for 48 hrs. Scale bar: 20 μm. The time traces of nuclear/cytoplasmic STAT1-mCherry and PIRF9-YFP signals of the cell are shown on the right. Vertical dashed lines represent cell divisions. (C) Averaged time traces of nuclear/cytoplasmic STAT1-mCherry, PIRF9-YFP, and the time derivative of PIRF9-YFP (dYFP/dt) (n = 257 cells). Data are represented as the mean (solid lines) and + standard deviation (SD) (shaded areas). (D) Schematic of IFN-α pretreatment experiments (top). Cells were pretreated with 100 ng/ml IFN-α for 0, 2, 10 and 24 hrs followed by 8 hrs of break time and re-stimulated with 100 ng/ml IFN-α for an additional 10 hrs. Bottom: A diagram of the microfluidic set-up. Two syringes filled with culture medium with or without IFN-α were connected to programmable Arduino-controlled valves that control the duration of IFN-α treatments. Images were captured every 5 min throughout the entire experiment that lasted for a total of 52 hr. (E) Averaged time traces of PIRF9-driven YFP induction (left) and the rate of induction (dYFP/dt, right) in response to the second IFN-α treatment under different pretreatment conditions. For PIRF9-YFP induction, the baselines at the beginning of the second stimulation were normalized to the same level for the comparison of induction levels under different pretreatment conditions. Results were from at least three independent experiments. (F) Amounts of PIRF9-YFP induction by the second IFN-α stimulation under different pretreatment conditions were shown in bar graph (left) and violin plot (right). The bar showed the averages from three independent experiments, represented as mean + standard error of the mean (SEM). The differences between the pretreatment conditions and the control are all statistically significant (p<0.001). The violin plots showed the distributions of single-cell responses under different pretreatment conditions. The violin plots cover single-cell data from three independent experiments.
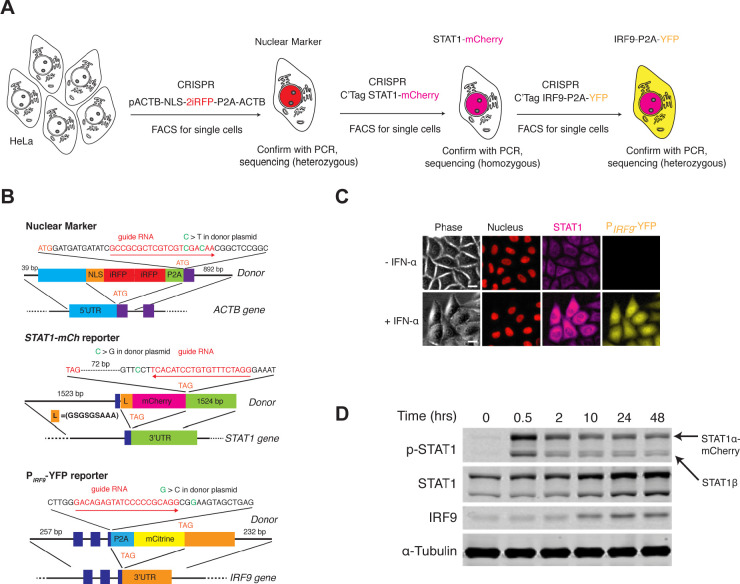
Figure 1—figure supplement 1. Cell line construction and validation.
Figure 1—figure supplement 2. Dose-dependent responses to IFN-α treatment.
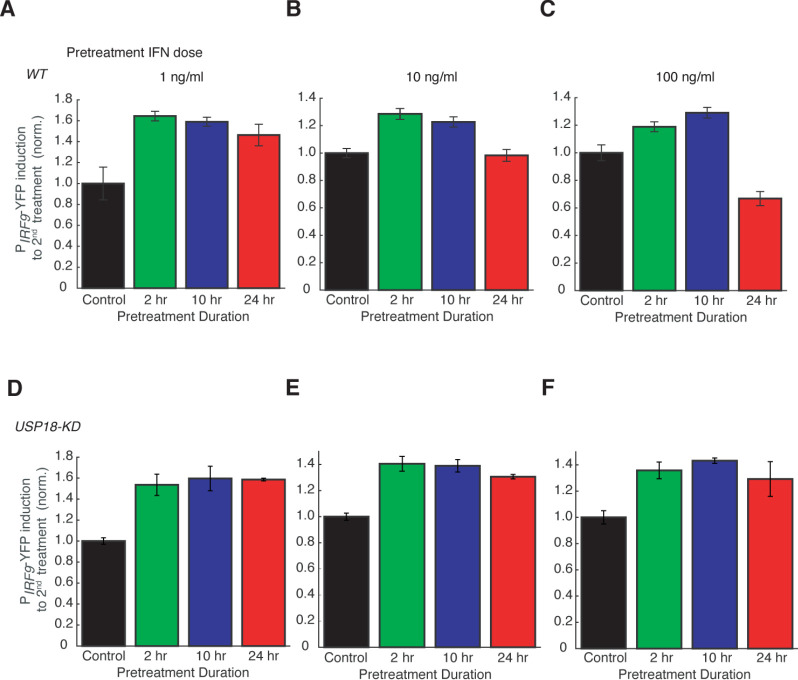
Figure 1—figure supplement 3. Dose dependence of desensitization to IFN-α treatment.
Figure 1—figure supplement 4. Dependence of desensitization effects on the break time.


