

Abstract
Background:
The combination of abiraterone acetate and prednisone (AA/P) is used to treat metastatic prostate cancer, but molecular predictors of treatment response are not well elucidated. We evaluated plasma circulating tumor DNA– (ctDNA-) based copy number alterations (CNAs) to determine treatment-related predictive and prognostic biomarkers for metastatic castration-resistant prostate cancer (mCRPC).
Methods:
Serial plasma specimens were prospectively collected from 88 chemotherapy-naive mCRPC patients before and after 12 weeks of AA/P treatment. Sequencing-based CNA analyses were performed on 174 specimens. We evaluated CNA-associated 12-week responses for primary resistance, time to treatment change (TTTC) for secondary resistance, and overall survival for prognosis (P < .05). Associations with primary resistance were analyzed using the Fisher exact test. Kaplan–Meier survival curves and Cox regression analyses were used to determine the associations of CNAs with acquired resistance and overall survival.
Results:
ctDNA reduced by 3.89% in responders and increased by 0.94% in nonresponders (P = .0043). Thirty-one prostate cancer–related genes from whole genome CNAs were tested. AR and AR enhancer amplification were associated with primary resistance (P = .0039) and shorter TTTC (P = .0003). ZFHX3 deletion and PIK3CA amplification were associated with primary resistance (P = .026 and P = .017, respectively), shorter TTTC (P = .0008 and P= .0016, respectively), and poor survival (P = .0025 and P = .0022, respectively). CNA-based risk scores combining selected significant associations (AR, NKX3.1, and PIK3CA) at the univariate level with TTTC were predictive of secondary resistance (P = .0002). and established prognoses for survival based on CNAs in ZFHX3, RB1, PIK3CA, and OPHN1 (P = .002). Multigene risk scores were more predictive than individual genes or clinical risk factors (P < .05).
Conclusion:
Plasma ctDNA CNAs and risk scores can predict mCRPC-state treatment and survival outcomes.
Keywords: Metastatic castration-resistant prostate cancer, cell-free DNA, low-pass whole genome sequencing, copy number alterations, abiraterone acetate and prednisone, overall survival, primary resistance, acquired resistance
Introduction
Prostate cancer is the most prevalent nonskin cancer and the second leading cause of cancer-related deaths among men in the US.1 Despite initial treatment with androgen deprivation therapy (ADT), patients with advanced hormone-sensitive prostate cancer inevitably progress to a state of metastatic castration-resistant prostate cancer (mCRPC).2 The combination of abiraterone acetate and prednisone (AA/P) is used to treat metastatic prostate cancer. AA/P decreases androgen synthesis by blocking CYP17, a critical enzyme in testosterone synthesis.3 Despite the efficacy of AA/P treatment for mCRPC, many patients do not respond, and most patients develop acquired resistance, with a median time period of radiographic progression-free survival of 16.5 months.4 Molecular biomarkers predictive of primary and secondary resistance among mCRPC patients are critically needed to improve clinical decision-making and develop personalized precision drug therapies.
Targeted and whole genome sequencing (WGS) has been used in previous studies on biomarkers. These studies have identified recurrent somatic mutations, copy number alterations (CNAs), oncogenic structural DNA rearrangements,5–9 and alterations in AR and the androgen signaling pathways that may be associated with clinical outcomes.10 Several of these studies were conducted using metastatic tissue biopsies, which is clinically impractical, given the invasive nature of the biopsies and the difficulty in obtaining sufficient metastatic tissue for genomic analyses.11 At present, circulating tumor cell (CTC) counts is the only blood-based biomarker to receive FDA clearence for mCRPC prognosis.12 However, recent studies have ideintified predictive biomarkers of androgen receptor pathway inhibitors by probing circulating tumor DNA (ctDNA) in plasma cell-free DNA (cfDNA) for somatic alterations in AR and other candidate genes in mCRPC patients.13–23 To determine ctDNA-based predictive factors, these studies have generally used single sampling before initiating therapies for CRPC patients who received single or multiple CRPC-state drug treatments.18,21–23
We conducted low-pass WGS and subsequent copy number analyses of ctDNA in a prospective cohort study (NCT # 01953640) at the time of ADT failure and before the initiation of any CRPC drug therapy. This was performed to identify candidate ctDNA-based biomarkers and develop multigene-based predictive and prognostic plasma ctDNA-based signatures for treatment response and survival, respectively. Serial sampling of ctDNA after 12 weeks of AA/P treatment was performed to identify markers of primary resistance to AA/P. Patients were followed until progression and/or death to identify ctDNA-based somatic CNAs predictive of acquired AA/P resistance and prognostic of the mCRPC state.
Patients and methods
Study cohorts
Plasma samples from 88 chemotherapy-naive mCRPC patients who progressed on ADT were collected at 2 time points (May 2013 - August 2015; followed until December 2018). A baseline collection during visit 1 (pretreatment) was performed before initiating AA/P treatment, and a second serial sample was collected during visit 2 (posttreatment) after 12 weeks. CTC counts were obtained during both visits. The correlative biospecimen study was approved by the Institutional Review Boards at Mayo Clinic, Rochester, and the Medical College of Wisconsin, at which site an additional 16 plasma specimens from healthy donors were collected as normal controls. All patients and donors provided written informed consent. All patients in the study were followed until death. Clinical outcomes included failure to respond to AA/P therapy after 12 weeks (primary resistance), time to treatment change (TTTC) (acquired resistance), and time to death (overall survival [OS]). To determine primary AA/P resistance, all patients who were alive after 12 weeks of treatment were uniformly evaluated for response to therapy.
Whole genome sequencing
WGS-based CNA analyses were performed on 174 specimens. Sample collection and processing and WGS methods are detailed in Supplementary Methods. Briefly, QIAmp DNA Blood Mini Kits (Qiagen, Hilden, Germany) were used to extract cfDNA, as previously reported.17 DNA libraries were prepared using a ThruPlex DNA-Seq Kit (Rubicon Genomics, Ann Arbor, MI, USA). Sequencing was performed using HiSeq2500 Sequencing System (Illumina, San Diego, CA, USA), and the Veridex automated CellSearch platform (Janssen Diagnostics, LLC, Raritan, NJ) was used for CTC counts.
CNA analysis
CNA analyses (log2 ratio based) were performed as previously described.24,25 In brief, low coverage (0.1~0.2X) WGS reads (FASTQ files) were aligned with the human reference genome (hg19/GRCh37) using DNASTAR (Madison, WI, USA). The mapped reads were then binned into either 1 Mb (for gene-specific CNA analyses) or 60 Kb (for fine-mapping analyses of AR locus at Xq12) bins. The read count ratio in each genomic bin was calculated by dividing the cfDNA read count with the mean read count of 16 unrelated healthy male donors. The resulting ratios were further transformed with log2 and corrected for guanine-cytosine content.24 After removing centromeres and other repeat-rich regions, the fully normalized log2 ratios in 2 848 bins (1 Mb) were subjected to segmentation using the copy number analysis method algorithm (Golden Helix, Bozeman, MT, USA). Statistical analyses of gene-specific CNAs were performed using the log2 ratio of the 1 Mb bin covering the target gene. ctDNA content (ctDNA fraction of total cfDNA) was estimated by using the log2 ratio of the most significantly deleted fragment (>20 Mb) across all segments in the genome (refer to Supplementary Methods and Results). The ctDNA content calculation was further validated by using the ichorCNA program.19,26
Statistical methods and analyses
In this study, we performed radiological and prostate-specific antigen (PSA) measurements for all enrolled patients who were alive 12 weeks after AA/P treatment initiation. To determine CNAs associated with primary resistance, we defined patients without PSA progression, absence of new bone lesions in a bone scan, and no evidence of radiological (RECIST 1.0) progression of nodal or soft tissue metastases after 12 weeks of treatment as responders. The definition of PSA response was based on PSA Working Group criteria.27 Patients who did not meet these criteria after 12 weeks of treatment were defined as nonresponders with primary resistance. Patients who died because of disease progression before the 12-week assessment were also deemed nonresponders.9 Fisher exact tests were performed to identify CNAs associated with a nonresponse status after 12 weeks of treatment for primary resistance, and statistical significance was set at a P value cutoff and a false discovery rate (FDR) ≤ .05. A primary resistance risk score was calculated by combining statistically significant CNAs, weighted by their estimated regression coefficients, at the univariate level. This calculation was used to build multiple CNA-based risk scores. A receiver operator curve (ROC) and the area under the ROC (AUC) were employed to evaluate the predictive accuracy of CNAs of primary treatment resistance.
Kaplan–Meier survival curves and Cox regression analyses were used to determine the associations of CNAs with acquired resistance and OS. TTTC was used as the clinical endpoint to determine acquired resistance and was calculated from the date of enrollment until the date of treatment change. OS was measured from the date of study enrollment until the date of death. Patients who were alive at the time of the last study follow-up were censored.
A Cox regression analysis was then performed to identify gene-specific CNAs at the univariate level and CNAs associated with TTTC and survival (FDR ≤ 0.05). Details for multiple CNA-based risk score calculations are provided in Supplementary Methods.
The cutoff date for all analyses was December 18, 2018.
Results
Clinical characteristics of patient samples
Ninety-two patients with mCRPC were enrolled (May 2013 - August 2015). Plasma samples from 88 patients were processed before initiating AA/P treatment (visit 1) and from 86 patients after 12 weeks of treatment (visit 2; Table 1). Four samples (P40, P61, P109, P165) were removed from the visit 1 samples because of poor-quality sequencing data. Among the remaining 84 patients, 36 had progressed by week 12 (nonresponders with primary resistance). Eighty-one of the 88 patients had died during follow-up. The median survival was 28.2 (range, 2.6 - 59.9) months. Among 84 patients, 73 had CTC data available, and 23 patients showed CTC numbers ≥ 5 before treatment. The overall experiment design is shown in Supplementary Figure S1.
Table 1.
Clinical characteristics of the mCRPC cohort.
| Clinical Variables | Total (N = 86) |
|---|---|
| Race (n = 85), no (%) | |
| White | 82 (97) |
| Black or African American | 1 (1) |
| Asian | 1 (1) |
| American Indian or Alaskan Native | 1 (1) |
| Age, y | |
| Median | 72 |
| Range | 39–92 |
| Gleason score at initial diagnosis, no (%) | |
| 2–6 | 14 (16) |
| 7 | 24 (28) |
| 8–10 | 48 (56) |
| Primary radiation therapy at initial diagnosis, no (%) | |
| Yes | 55 (64) |
| No | 31 (36) |
| Primary radical prostatectomy at initial diagnosis, no (%) | |
| Yes | 42 (49) |
| No | 44 (51) |
| Volume of metastatic disease*, no (%) | |
| Low | 36 (42) |
| High | 50 (58) |
| Time from starting ADT to CRPC, y | |
| Median | 2.6 |
| IQR | 1.3–4.6 |
| Metastatic biopsy site at study enrollment, no (%) | |
| Bone | 62 (72) |
| Lymph nodes | 15 (17) |
| Liver/lung | 3 (4) |
| Others | 2 (2) |
| Metastatic biopsy site after 12 weeks, no (%) | |
| Bone | 65 (76) |
| Lymph nodes | 10 (12) |
| Liver/lung | 3 (4) |
| Others | 2 (2) |
| Unable to biopsy | 6 (7) |
| Median | 14.6 |
| Serum Chromogranin levels at study enrollment (n = 84), ng/ml | |
| Median | 92.5 |
| IQR | 56.5–245.5 |
| Testosterone at study enrollment (n = 84), ng/ml | |
| Median | 7 |
| IQR | 6.9–10.0 |
| Study follow-up, days | |
| Median days of follow-up (IQR) | 806 (531.995) |
| Number of patients who progressed after 12 weeks (n = 84) (%) | 35 (42) |
| Median time to progression on abiraterone acetate/prednisone (IQR) | 230 (96–654) |
| Median Survival, mo. (range) | 28.2 (2.6–59.9) |
| 12-week responders** (n = 45) | 33.6 (11.4–59.9) |
| 12-week nonresponders** (n = 36) | 22.3 (2.6–55.7) |
| Number of events | 81 |
Definition of low vs high metastatic volume disease used: low volume represents ≤ 3 total metastatic skeletal or lymph nodal sites with no visceral metastasis; high volume represents ≥ 4 metastatic skeletal sites with one being outside the axial skeleton or any visceral metastasis.
Responders/nonresponders: Defined at 12 weeks
Abbreviations: ADT, androgen deprivation therapy; IQR, interquartile range; mCRPC, metastatic castration-resistant prostate cancer; CRPC, castration-resistant prostate cancer.
Extensive Somatic CNAs in Plasma cfDNA
The somatic CNAs observed in our cohort had patterns of alterations similar to those previously reported for mCRPC tissue-based genomes with conspicuous chromosomal instability and widespread copy number aberrations [6, 9]. These CNAs included chromosomal gain of 1q, 3q, 8q, and Xq and loss of 1p, 8p, 10q, and 13q (Figure 1A, 1B; Supplementary Figure S2) [6, 7]. Other CNAs included gain of 3p, 5p, 7p, and 7q and loss of 5q11.2-q13.3, 6q15-q16.1, 16q, 17p, and 18q.
Figure 1. Landscape of copy number alterations in plasma cell-free DNA of metastatic castration-resistant prostate cancer patients.
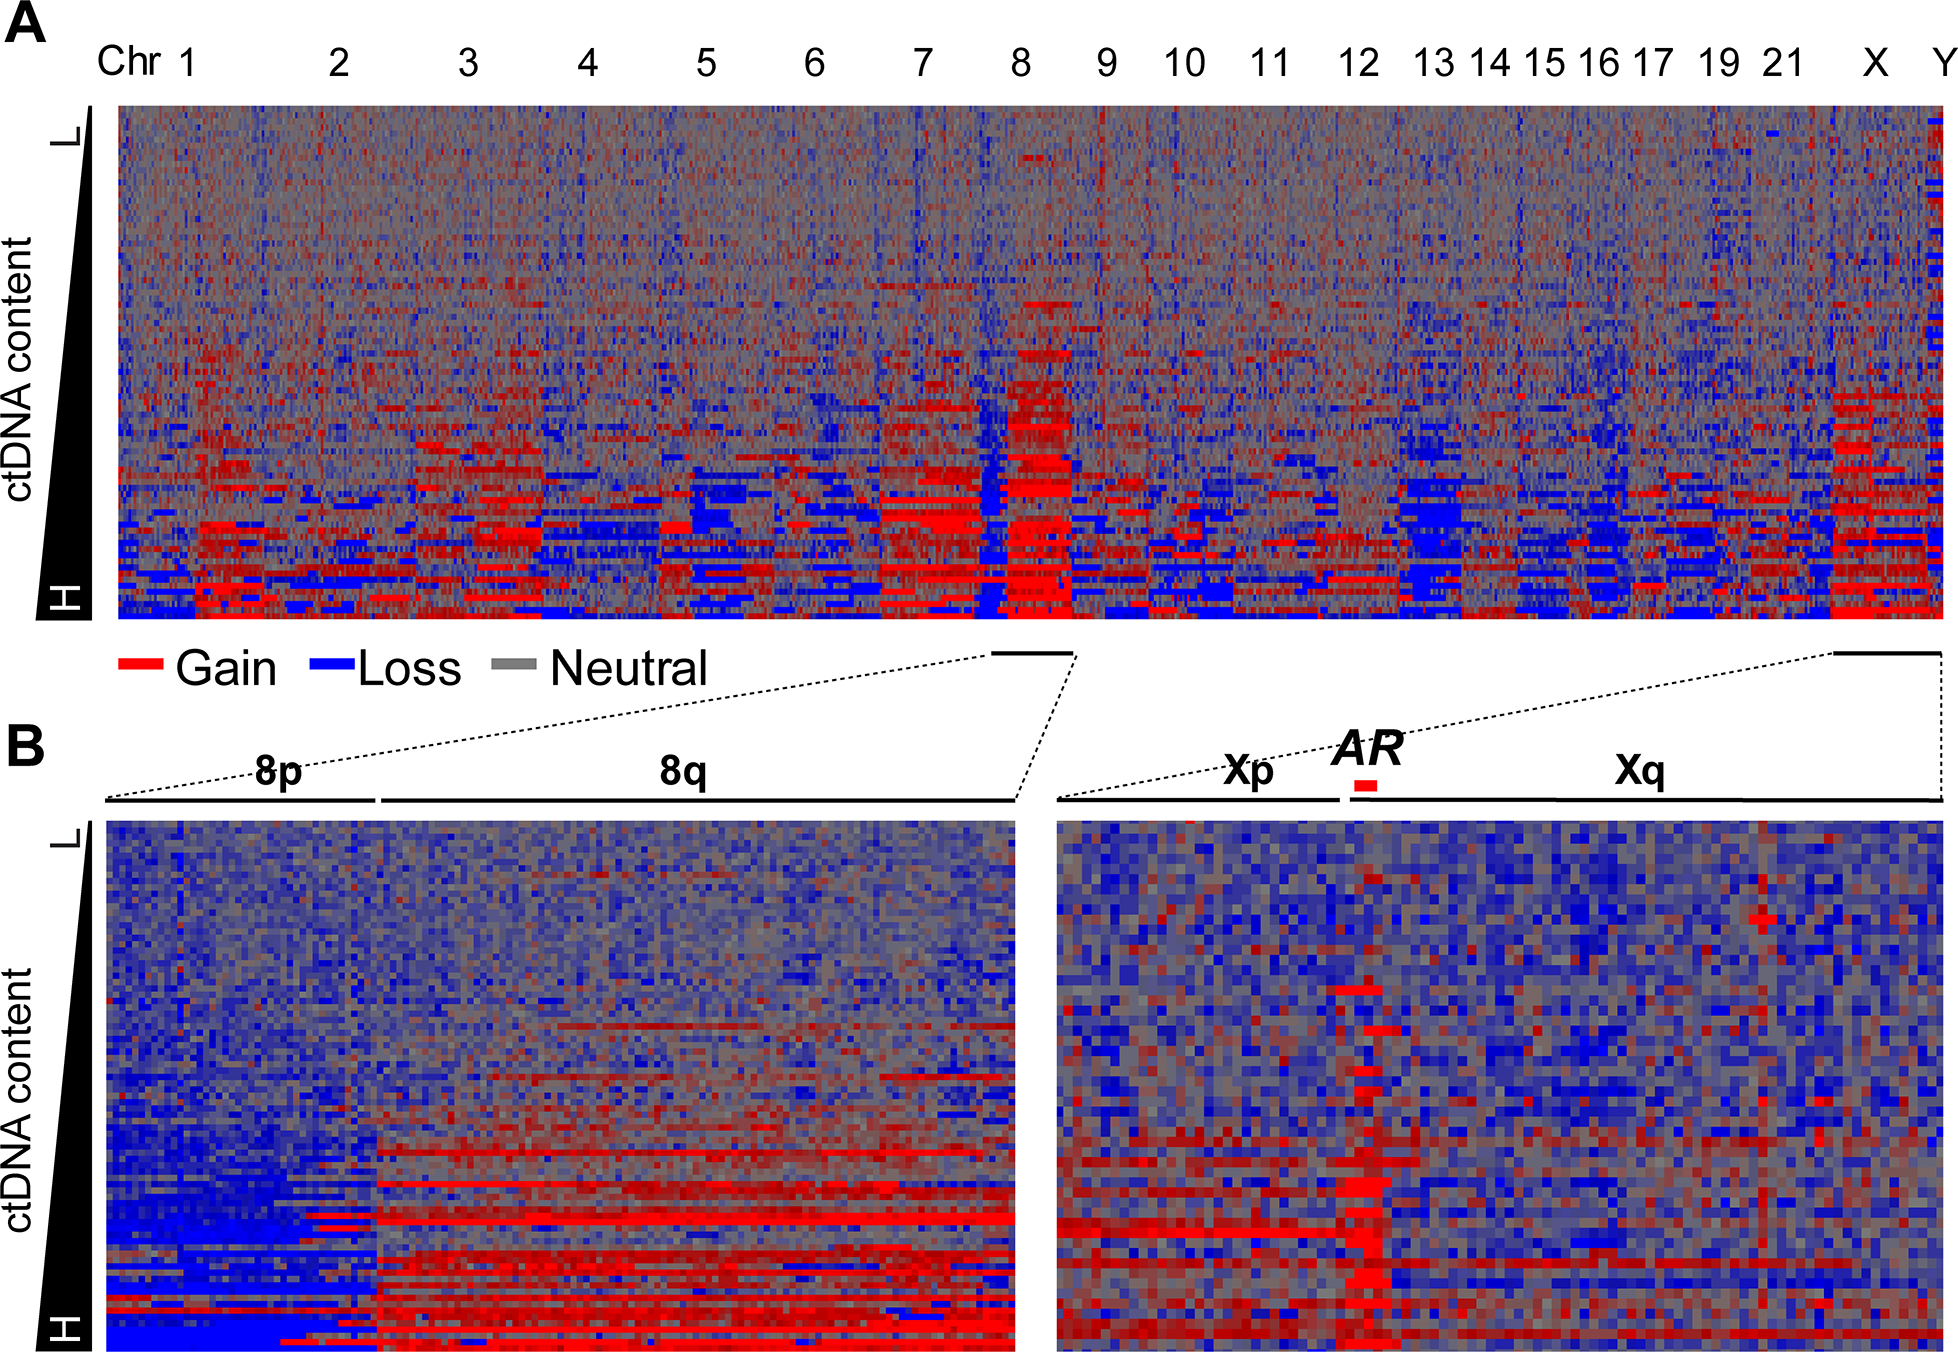
a Heatmap of genome-level copy number alterations (CNAs) in 84 baseline mCRPC plasma samples. Rows represent plasma samples ordered by circulating tumor DNA content. Columns represent chromosomal- or subchromosomal-level CNAs, ordered by chromosome number. Log2 ratio for 1 Mb bins is shown by the density of the color. Red and blue represent genomic gain and loss, respectively. b Heatmap of CNAs on chr8 and chrX in the 84 baseline plasma samples. Typical 8p loss (blue) and 8q gain (red) are clearly shown. AR amplification on chrX is also clearly shown.
Dynamic ctDNA content changes associated with primary resistance
We compared ctDNA-based changes and the percentage of ctDNA content changes with AA/P treatment response in responders (n = 48) and nonresponders (n = 36) after 12-weeks of treatment.9 We estimated the percentage of ctDNA content in cfDNA and observed a median ctDNA content of 3.94% (range, 0.70 - 33.91%) in visit 1 samples and 2.28% (range, 0.62 - 33.55%) in visit 2 samples (Supplementary Table S1). Methods for ctDNA calculation and dynamic CNA changes between visits are detailed in Supplementary Methods and Supplementary Results (Supplementary Figures S3). In pretreatment and posttreatment plasma samples, the amount of ctDNA was significantly reduced (3.89%) in responders but was slightly increased (0.94%) in nonresponders (P = .0043). In 82 paired plasma samples (pre- and posttreatment), 25.6% (n = 21/82) showed a significantly reduced ctDNA content (Visit 2 vs Visit 1 [≤ −3%]), and 12.2% (n = 10/82) showed an increased ctDNA content (Visit 2 vs Visit 1 [>3%]). Interestingly, 90% (n = 9/10) of patients with increased ctDNA content were nonresponders, whereas only 38.1% (n = 8) of patients with reduced ctDNA contents were nonresponders (P = .009) (Figure 2A–B; Supplementary Table S1). Details of CNA changes in each of the 1 Mb bins across the genome are provided in Supplementary Results.
Figure 2. Dynamic circulating tumor DNA content changes during abiraterone acetate and prednisone treatment.
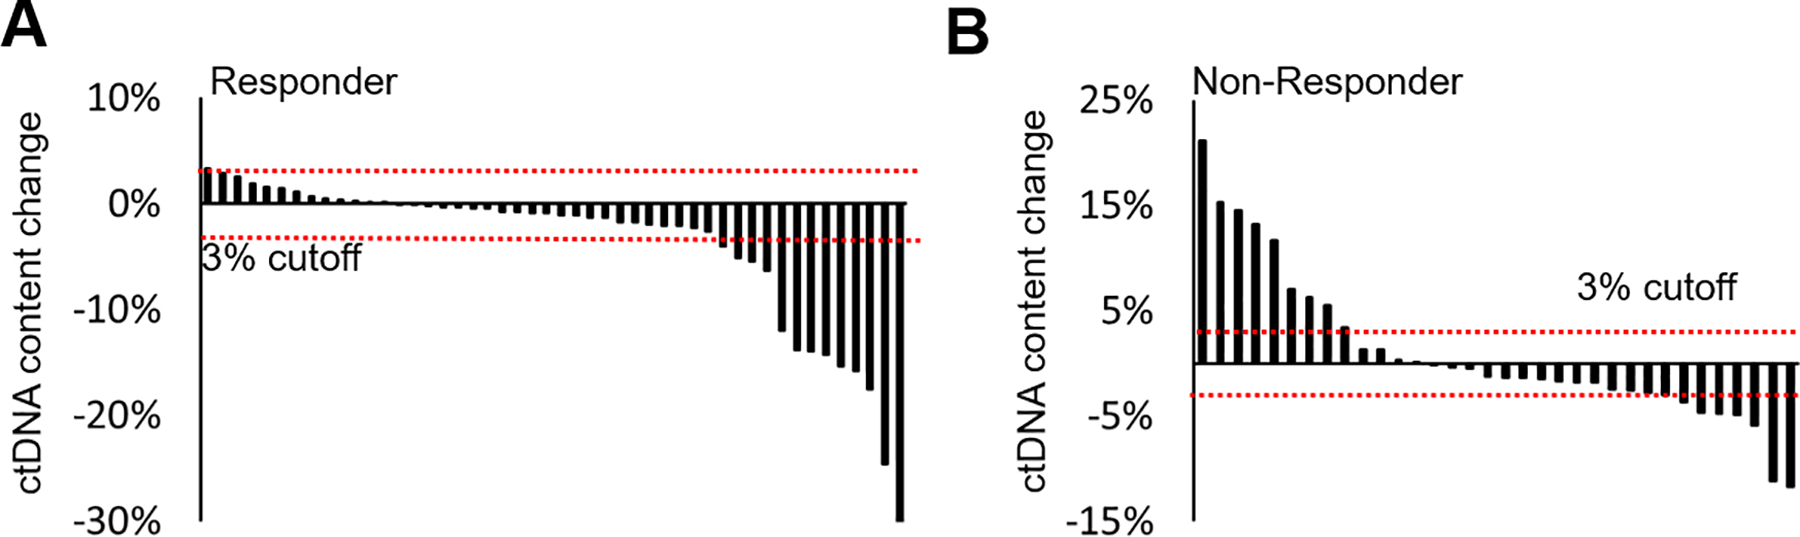
A-bWaterfall plots of circulating tumor DNA content serial changes in responders (a) and nonresponders (b). Black vertical bars represent level and direction of ctDNA content changes after 12 weeks of treatment. Horizontal red dot lines represent cutoff (± 3%) for significant ctDNA content change.
Gene-specific CNAs predictive of primary resistance
We focused on genomic bins covering 31 biologically relevant mCRPC driver genes5–9 to evaluate candidate gene-specific CNAs. These gene loci were selected from published reports based on tumor tissue studies (Figure 3).6,7,28,30 Pretreatment plasma samples were evaluated to identify candidate gene-specific CNAs associated with primary resistance (Figure 3). We then compared detectable CNAs at each gene locus between responders and nonresponders. Amplification of AR, OPHN1, PIK3CA and deletion of ZFHX3 copy numbers were significantly associated with primary resistance (both the P value and FDR ≤ 0.05, Figure 3; Supplementary Table S2). To determine primary resistance, the combined CNA-based risk score for each patient was calculated at the univariate level with these 4 significant genes. ROC analyses demonstrated that the multigene CNA risk score was predictive of primary resistance, with an AUC of 0.73 (P < .0001). ROC analyses using AR found that CNA alone had an AUC of 0.67 (P = .009).
Figure 3. Circulating tumor DNA-based copy number alterations of biologically relevant driver genes and abiraterone acetate and prednisone resistance in baseline plasma samples.
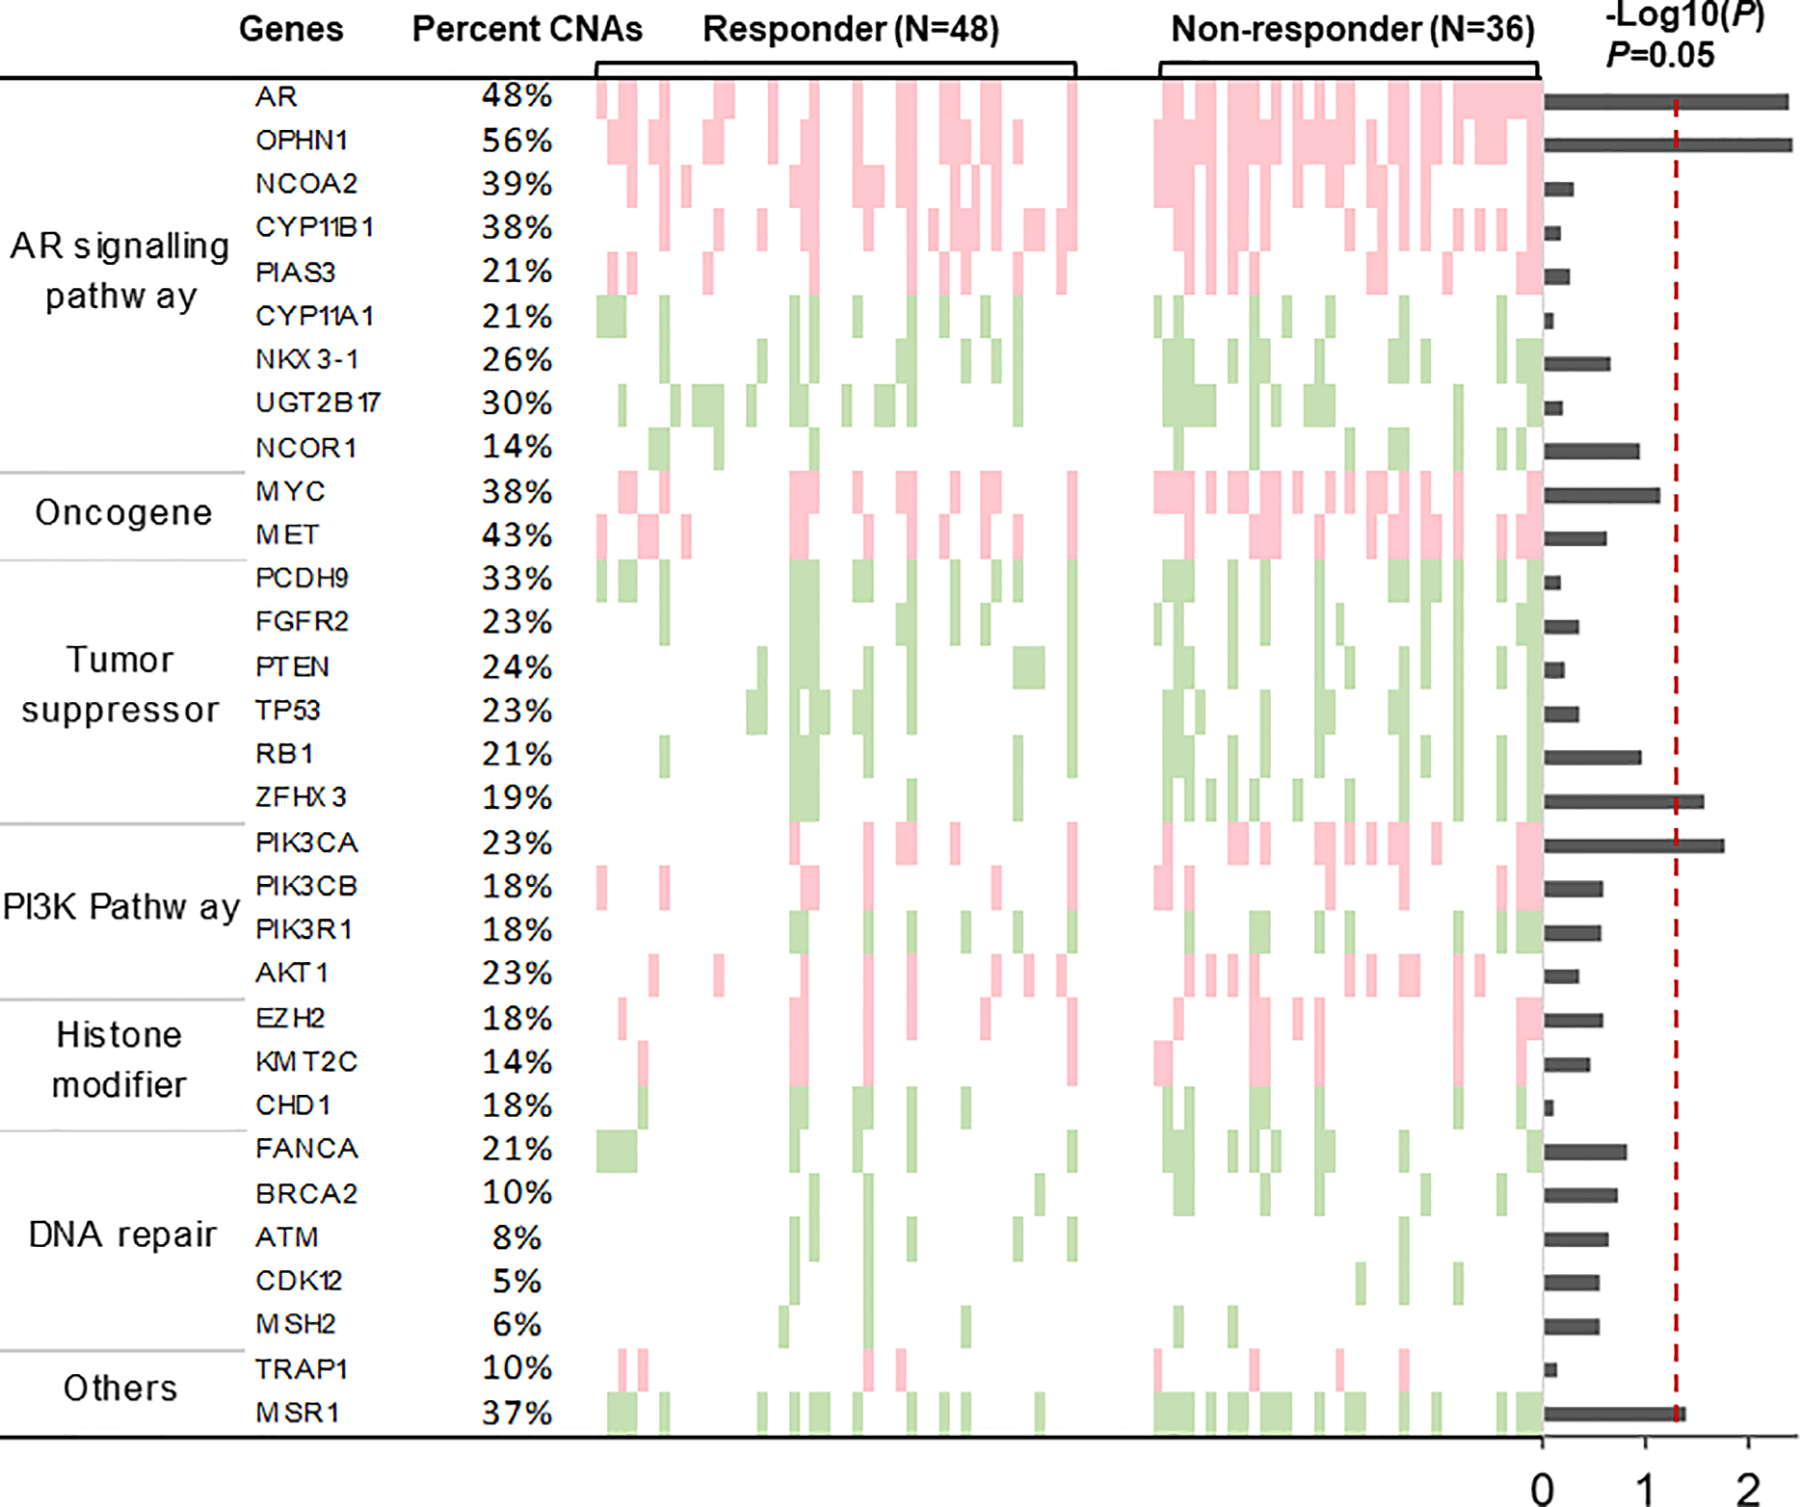
Light red and green represent copy number gain and loss, respectively; white represents copy number neutral. Columns indicate patients grouped by responders and nonresponders. Rows represent genes of interest and are grouped in pathways. The proportion of patients with copy number alterations (CNAs) at specific genes is indicated on the left. The –log10 (P value) of Fisher’s exact test on CNAs between responders and nonresponders are reported by barplot on the right. Red vertical dot line (P = .05) shows the threshold of statistical significance.
Gene-specific CNAs for acquired resistance associations
To identify gene-specific CNAs predictive of acquired resistance, we performed Cox regression analyses using pretreatment plasma samples (84; median TTTC = 10.43 months; interquartile range = 18.53 months). Significant associations with TTTC were observed in 35.5% (n = 11/31) of selected gene loci, including AR, OPHN1, ZFHX3, NKX3–1, and PIK3CA (Supplementary Tables S3; Supplementary Figure S4). AR amplification was associated with shorter TTTC (P = .0003; HR = 3.27; 95% CI [1.78–6.84]). Median TTTC was 8.67 months with AR amplification and more than 43 months without AR amplification (Figure 4A). Amplification at the OPHN1 locus was also associated with shorter TTTC (P = .0002; HR = 3.70; 95% CI [1.08–7.00]) (Figure 4B). Both AR and OPHN1 were coamplified at Xq12, with correlation coefficient r = 0.95. In the 84-baseline samples, detectable amplification was 48% for AR and 56% for OPHN1 (Figure 4C). Further results of gene-specific CNAs are detailed in Supplementary Results.
Figure 4. Association of locus-specific copy number alterations with clinical outcomes at baseline plasma samples.
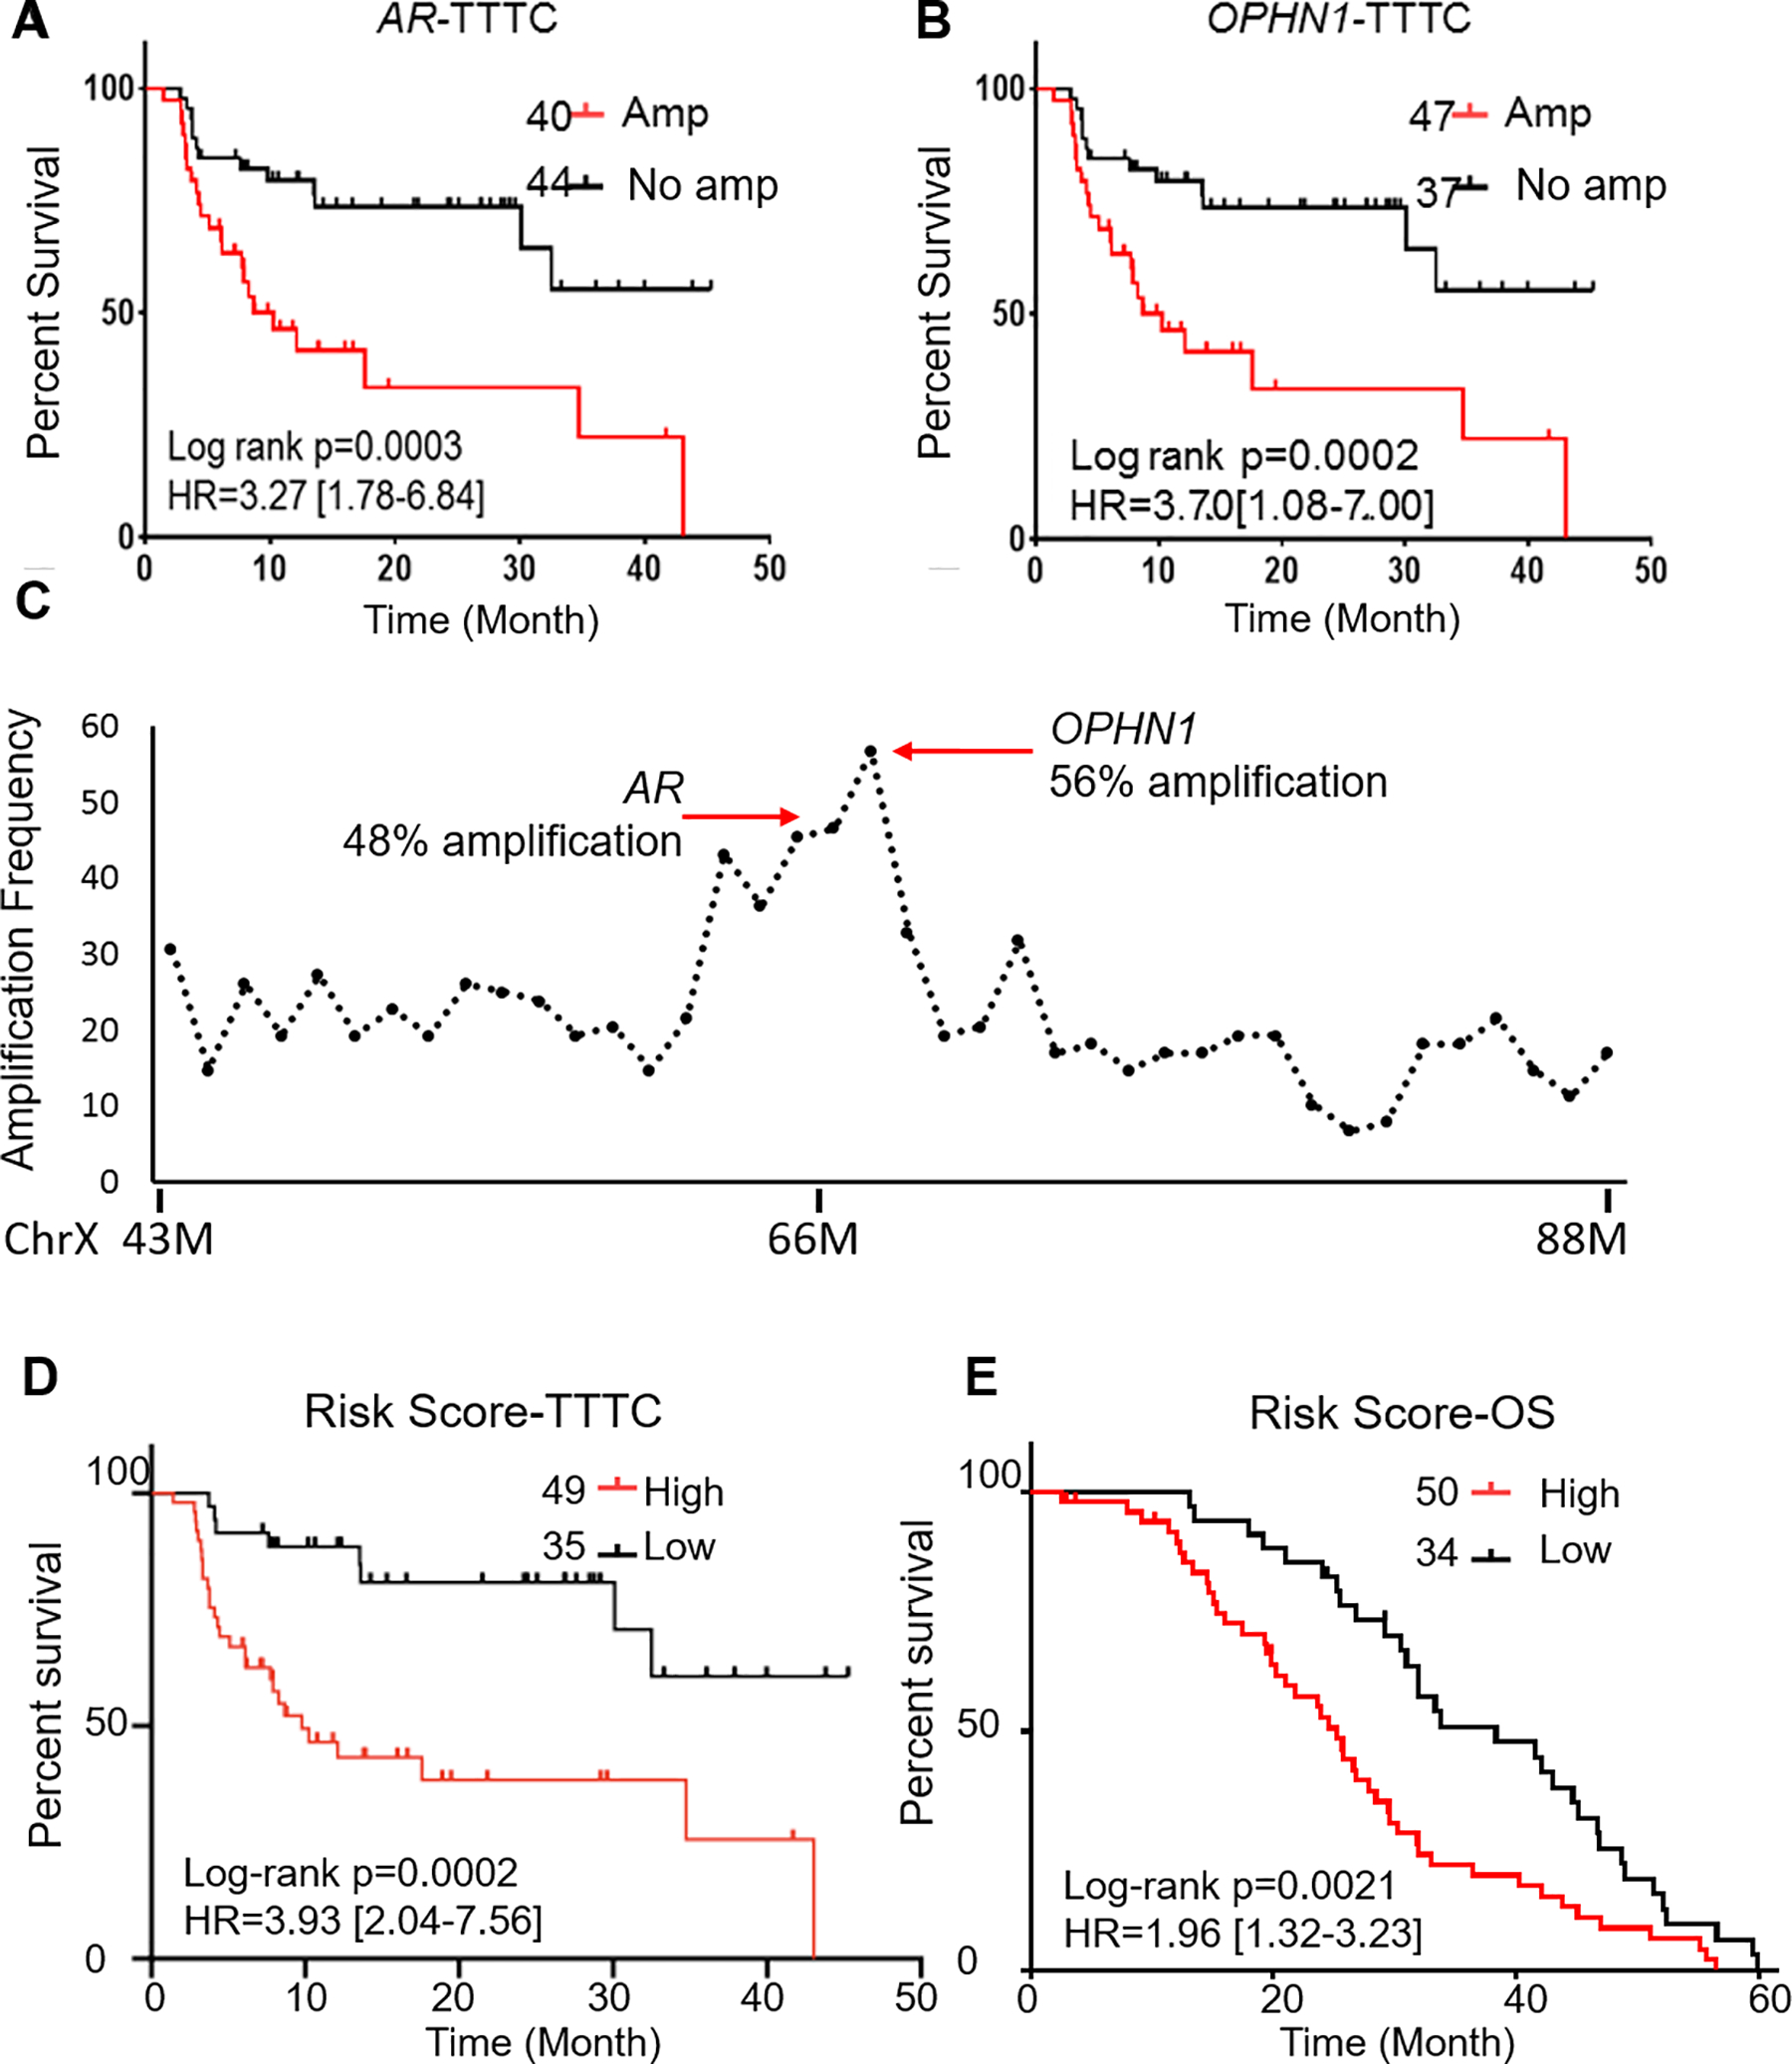
a-b Kaplan–Meier plots show that amplifications at AR (a) and OPHN1 (b) loci are associated with shorter time to treatment change (TTTC). c Distribution of amplification frequency in 20 Mb region flanking AR gene. Detectable amplifications are significantly increased at the AR and OPHN1 loci. d Higher risk scores (based on copy number alterations [CNAs] at 3 gene loci including AR, NKX3.1, and PIK3CA) are associated with shorter TTTC. e Higher risk scores (based on CNAs at 3 gene loci including ZFHX3, RB1, PIK3CA, and OPHN1 are associated with poor survival rates.
To address genetic heterogeneity, we designed multivariate risk models on the basis of multiple somatic CNAs and clinical factors associated with acquired resistance. Stepwise regression was applied to the 11 gene loci that showed significant associations with TTTC at the univariate level (Supplementary Table S3).31 This analysis generated a CNA-based predictive risk score that included genes AR, NKX3.1, and PIK3CA. This risk score was significantly associated with TTTC (P = .0002; HR = 3.93; 95% CI [2.04–7.56]) (Figure 4D) and remained significant after adjusting for CTC, ctDNA content, and clinical factors (age, baseline PSA level, and volume of metastasis) (Supplementary Table S4).
Gene-specific CNAs prognostic for survival
The prognostic value of the CNAs was evaluated using the 31 selected genes. Cox regression analyses with pretreatment plasma samples showed a significant association with OS in 35.5% (n = 11/31) of selected gene loci, including RB1, NKX3–1, PIK3CA, ZFHX3, and OPHN1 (Supplementary Table S3; Supplementary Figure S5). To build a multivariate prognostic model, our stepwise selection identified 4 genes (ZFHX3, RB1, PIK3CA, and OPHN1) among the 11 significant genes at the univariate level. The risk score based on these 4 genes was prognostic of survival (P = .002; HR = 1.96; 95% CI [1.32–3.23]) (Figure 4E) and remained significant after adjusting for CTC, ctDNA content, and clinical factors (age, baseline PSA level, and volume of metastasis) (P < .05) (Supplementary Table S4).
Discussion
Several associations with clinical outcomes of interest were observed in our ctDNA-based genome-wide copy number analyses. We identified multiple gene-specific CNAs associated with primary and acquired resistance to AA/P and OS. Multigene CNA-based risk scores identified to compensate for genomic heterogeneity demonstrated high predictive and prognostic accuracy. The multivariate risk scores were independently predictive of treatment response and survival after adjusting for CTC counts, ctDNA content, and other clinical factors.
Plasma ctDNA content was a critical factor in treatment response and survival. Dynamic ctDNA content changes during treatment indicated a response if reduction of ctDNA content was observed; an increase of ctDNA after 12 weeks of treatment was indicative of primary resistance. In a recent study that examined plasma collections from 140 mCRPC patients, ctDNA content decline was evaluated as a potential biomarker for initial therapeutic response.19 We similarly observed that ctDNA changes in accordance with treatment responses, as it reflects overall tumor burden.
AR amplification has been reported in many mCRPC patients6,32 and has been shown in several studies to be a predictor of abiraterone and enzalutamide resistance in tissue and plasma.13,16–18 In the current study, similar results with AR amplification were observed after adjusting for clinical factors; AR amplification was predictive of primary resistance to AA/P and prognostic of poor survival in chemotherapy-naive mCRPC patients. We made a novel observation that ctDNA-based AR enhancer amplification is predictive of short-term AA/P response. Interestingly, recent reports have indicated that the AR enhancer is frequently amplified in mCRPC,33–35 and increases of AR enhancer copy numbers may drive mCRPC progression. Our focused analysis of the genomic region flanking AR revealed frequent amplification of OPHN1, which was indicative of shorter disease progression and survival. In prostate cancer, OPHN1 is upregulated and is associated with cell adhesion and migration.36 However, it is unclear whether amplifications of either the AR enhancer or OPHN1 are functional consequences or coincidental bystander events related to AR amplification.
Our study shows strong evidence that CNAs at other gene loci, including ZFHX3, PIK3CA, NKX3.1, and RB1, have predictive and prognostic value in mCRPC. Deletion of ZFHX3, a tumor suppressor located at 16q22.3, had a significant impact on clinical outcomes. ZFHX3 codes for a transcription factor with multiple homeodomains and zinc finger motifs that regulate myogenic and neuronal differentiation.37 ZFHX3 deletion was observed in mCRPC;38 it was also associated with reduced cancer-specific survival rates among patients with urothelial carcinoma of the bladder.39 PIK3CA, an important gene in the PI3K signaling pathway, has been widely reported to be a key oncogenic driver of multiple cancer types, including prostate cancer.40 Mutation and amplification of PIK3CA have been recently reported to correlate with poor survival of prostate cancer patients.41 NKX3.1 is a prostate-specific tumor suppressor, and its loss represents a pivotal initiating event in prostate cancer.42,43 High prevalence of RB1 genomic aberrations in the mCRPC state has been reported;44 RB1 loss is associated with reduced progression-free survival rates.13 Because several genomic events may be drivers of resistance and survival in this advanced state, we designed CNA-based risk scores for better predictive performance.
Although promising, this plasma ctDNA-based analysis has its limitations. Low-pass WGS could lead to read count bias when smaller genomic bins are used. Sufficient read counts are particularly important for gene-based CNA analyses when genes of interest cover smaller genomic regions. Additionally, due to low yield of cfDNA and limited availability of genome copies, mutational analysis may not capture rare variants. Therefore, in the current study, we did not perform mutation detection. Another limitation is the selection of cutoff values to define amplification and deletion. In this study, a group of healthy individuals were used as controls to define thresholds for CNAs as genomic gain/loss, using 97.5 percentile of log2 values across all genomic bins. These predefined thresholds could lead to false-positive and false-negative results. Our statistical method used the log2 value of the most significantly deleted fragment (> 20 Mb), which may miss more significant deletions with smaller sizes. Therefore, ctDNA content calculation could underestimate tumor percentage in plasma cfDNA.
Conclusions
We identified multiple novel loci, including ZFHX3, AR enhancer and OPHN1, as candidate biomarkers for response to AA/P. Multigene risk scores for predicting resistance to AA/P treatment, disease progression, and survival were also identified. Independent and prospective validation of these biomarkers is needed to guide clinical practice in advanced prostate cancer.
Supplementary Material
Acknowledgements
We thank the HMGC Sequencing Core at Medical College of Wisconsin for providing DNA sequencing service. We thank Paul Fletcher and Daley Drucker (H. Lee Moffitt Cancer Center and Research Center) for editorial assistance. They were not compensated beyond their regular salaries.
Funding
This study was supported by the National Institute of Health (CA212097; to LW and MK)
Footnotes
Conflict of interest
The authors declare that they have no competing interests.
References
- 1.Siegel RL, Miller KD, Jemal A. Cancer statistics, 2016. CA Cancer J Clin 2016; 66(1): 7–30. [DOI] [PubMed] [Google Scholar]
- 2.Sridhar SS, Freedland SJ, Gleave ME, Higano C, Mulders P, Parker C et al. Castration-resistant prostate cancer: from new pathophysiology to new treatment. Eur Urol 2014; 65(2): 289–299. [DOI] [PubMed] [Google Scholar]
- 3.Gartrell BA, Saad F. Abiraterone in the management of castration-resistant prostate cancer prior to chemotherapy. Ther Adv Urol 2015; 7(4): 194–202. [DOI] [PMC free article] [PubMed] [Google Scholar]
- 4.Ryan CJ, Smith MR, de Bono JS, Molina A, Logothetis CJ, de Souza P et al. Abiraterone in metastatic prostate cancer without previous chemotherapy. N Engl J Med 2013; 368(2): 138–148. [DOI] [PMC free article] [PubMed] [Google Scholar]
- 5.Grasso CS, Wu YM, Robinson DR, Cao X, Dhanasekaran SM, Khan AP et al. The mutational landscape of lethal castration-resistant prostate cancer. Nature 2012; 487(7406): 239–243. [DOI] [PMC free article] [PubMed] [Google Scholar]
- 6.Robinson D, Van Allen EM, Wu YM, Schultz N, Lonigro RJ, Mosquera JM et al. Integrative clinical genomics of advanced prostate cancer. Cell 2015; 161(5): 1215–1228. [DOI] [PMC free article] [PubMed] [Google Scholar]
- 7.Kumar A, Coleman I, Morrissey C, Zhang X, True LD, Gulati R et al. Substantial interindividual and limited intraindividual genomic diversity among tumors from men with metastatic prostate cancer. Nat Med 2016; 22(4): 369–378. [DOI] [PMC free article] [PubMed] [Google Scholar]
- 8.Ren S, Wei GH, Liu D, Wang L, Hou Y, Zhu S et al. Whole-genome and Transcriptome Sequencing of Prostate Cancer Identify New Genetic Alterations Driving Disease Progression. Eur Urol 2017. [DOI] [PubMed] [Google Scholar]
- 9.Wang L, Dehm SM, Hillman DW, Sicotte H, Tan W, Gormley M et al. A prospective genome-wide study of prostate cancer metastases reveals association of wnt pathway activation and increased cell cycle proliferation with primary resistance to abiraterone acetate-prednisone. Ann Oncol 2018; 29(2): 352–360. [DOI] [PMC free article] [PubMed] [Google Scholar]
- 10.Watson PA, Arora VK, Sawyers CL. Emerging mechanisms of resistance to androgen receptor inhibitors in prostate cancer. Nat Rev Cancer 2015; 15(12): 701–711. [DOI] [PMC free article] [PubMed] [Google Scholar]
- 11.Jimenez RE, Atwell TD, Sicotte H, Eckloff B, Wang L, Barman P et al. A Prospective Correlation of Tissue Histopathology With Nucleic Acid Yield in Metastatic Castration-Resistant Prostate Cancer Biopsy Specimens. Mayo Clin Proc Innov Qual Outcomes 2019; 3(1): 14–22. [DOI] [PMC free article] [PubMed] [Google Scholar]
- 12.Danila DC, Heller G, Gignac GA, Gonzalez-Espinoza R, Anand A, Tanaka E et al. Circulating tumor cell number and prognosis in progressive castration-resistant prostate cancer. Clin Cancer Res 2007; 13(23): 7053–7058. [DOI] [PubMed] [Google Scholar]
- 13.Wyatt AW, Azad AA, Volik SV, Annala M, Beja K, McConeghy B et al. Genomic Alterations in Cell-Free DNA and Enzalutamide Resistance in Castration-Resistant Prostate Cancer. JAMA Oncol 2016; 2(12): 1598–1606. [DOI] [PMC free article] [PubMed] [Google Scholar]
- 14.Ulz P, Belic J, Graf R, Auer M, Lafer I, Fischereder K et al. Whole-genome plasma sequencing reveals focal amplifications as a driving force in metastatic prostate cancer. Nat Commun 2016; 7: 12008. [DOI] [PMC free article] [PubMed] [Google Scholar]
- 15.Hovelson DH, Liu CJ, Wang Y, Kang Q, Henderson J, Gursky A et al. Rapid, ultra low coverage copy number profiling of cell-free DNA as a precision oncology screening strategy. Oncotarget 2017; 8(52): 89848–89866. [DOI] [PMC free article] [PubMed] [Google Scholar]
- 16.Azad AA, Volik SV, Wyatt AW, Haegert A, Le Bihan S, Bell RH et al. Androgen Receptor Gene Aberrations in Circulating Cell-Free DNA: Biomarkers of Therapeutic Resistance in Castration-Resistant Prostate Cancer. Clin Cancer Res 2015; 21(10): 2315–2324. [DOI] [PubMed] [Google Scholar]
- 17.Kohli M, Li J, Du M, Hillman DW, Dehm SM, Tan W et al. Prognostic association of plasma cell-free DNA-based androgen receptor amplification and circulating tumor cells in pre-chemotherapy metastatic castration-resistant prostate cancer patients. Prostate Cancer Prostatic Dis 2018. [DOI] [PMC free article] [PubMed] [Google Scholar]
- 18.Romanel A, Gasi Tandefelt D, Conteduca V, Jayaram A, Casiraghi N, Wetterskog D et al. Plasma AR and abiraterone-resistant prostate cancer. Sci Transl Med 2015; 7(312): 312re310. [DOI] [PMC free article] [PubMed] [Google Scholar]
- 19.Choudhury AD, Werner L, Francini E, Wei XX, Ha G, Freeman SS et al. Tumor fraction in cell-free DNA as a biomarker in prostate cancer. JCI Insight 2018; 3(21). [DOI] [PMC free article] [PubMed] [Google Scholar]
- 20.Mayrhofer M, De Laere B, Whitington T, Van Oyen P, Ghysel C, Ampe J et al. Cell-free DNA profiling of metastatic prostate cancer reveals microsatellite instability, structural rearrangements and clonal hematopoiesis. Genome Med 2018; 10(1): 85. [DOI] [PMC free article] [PubMed] [Google Scholar]
- 21.Annala M, Vandekerkhove G, Khalaf D, Taavitsainen S, Beja K, Warner EW et al. Circulating Tumor DNA Genomics Correlate with Resistance to Abiraterone and Enzalutamide in Prostate Cancer. Cancer Discov 2018; 8(4): 444–457. [DOI] [PubMed] [Google Scholar]
- 22.De Laere B, Oeyen S, Mayrhofer M, Whitington T, van Dam PJ, Van Oyen P et al. TP53 Outperforms Other Androgen Receptor Biomarkers to Predict Abiraterone or Enzalutamide Outcome in Metastatic Castration-Resistant Prostate Cancer. Clin Cancer Res 2019; 25(6): 1766–1773. [DOI] [PMC free article] [PubMed] [Google Scholar]
- 23.Torquato S, Pallavajjala A, Goldstein A, Toro PV, Silberstein JL, Lee J et al. Genetic Alterations Detected in Cell-Free DNA Are Associated With Enzalutamide and Abiraterone Resistance in Castration-Resistant Prostate Cancer. JCO Precis Oncol 2019; 3. [DOI] [PMC free article] [PubMed] [Google Scholar]
- 24.Xia S, Kohli M, Du M, Dittmar RL, Lee A, Nandy D et al. Plasma genetic and genomic abnormalities predict treatment response and clinical outcome in advanced prostate cancer. Oncotarget 2015; 6(18): 16411–16421. [DOI] [PMC free article] [PubMed] [Google Scholar]
- 25.Li J, Dittmar RL, Xia S, Zhang H, Du M, Huang CC et al. Cell-free DNA copy number variations in plasma from colorectal cancer patients. Mol Oncol 2017; 11(8): 1099–1111. [DOI] [PMC free article] [PubMed] [Google Scholar]
- 26.Adalsteinsson VA, Ha G, Freeman SS, Choudhury AD, Stover DG, Parsons HA et al. Scalable whole-exome sequencing of cell-free DNA reveals high concordance with metastatic tumors. Nat Commun 2017; 8(1): 1324. [DOI] [PMC free article] [PubMed] [Google Scholar]
- 27.Scher HI, Halabi S, Tannock I, Morris M, Sternberg CN, Carducci MA et al. Design and end points of clinical trials for patients with progressive prostate cancer and castrate levels of testosterone: recommendations of the Prostate Cancer Clinical Trials Working Group. J Clin Oncol 2008; 26(7): 1148–1159. [DOI] [PMC free article] [PubMed] [Google Scholar]
- 28.Quigley DA, Dang HX, Zhao SG, Lloyd P, Aggarwal R, Alumkal JJ et al. Genomic Hallmarks and Structural Variation in Metastatic Prostate Cancer. Cell 2018; 174(3): 758–769 e759. [DOI] [PMC free article] [PubMed] [Google Scholar]
- 29.Luijten MNH, Lee JXT, Crasta KC. Mutational game changer: Chromothripsis and its emerging relevance to cancer. Mutat Res 2018; 777: 29–51. [DOI] [PubMed] [Google Scholar]
- 30.Wyatt AW, Annala M, Aggarwal R, Beja K, Feng F, Youngren J et al. Concordance of Circulating Tumor DNA and Matched Metastatic Tissue Biopsy in Prostate Cancer. J Natl Cancer Inst 2017; 109(12). [DOI] [PMC free article] [PubMed] [Google Scholar]
- 31.Newcombe PJ, Connolly S, Seaman S, Richardson S, Sharp SJ. A two-step method for variable selection in the analysis of a case-cohort study. Int J Epidemiol 2018; 47(2): 597–604. [DOI] [PMC free article] [PubMed] [Google Scholar]
- 32.Wang F, Koul HK. Androgen receptor (AR) cistrome in prostate differentiation and cancer progression. Am J Clin Exp Urol 2017; 5(3): 18–24. [PMC free article] [PubMed] [Google Scholar]
- 33.AR Enhancer Amplification Drives Castration-Resistant Prostate Cancer. Cancer Discov 2018; 8(8): OF17. [Google Scholar]
- 34.Takeda DY, Spisak S, Seo JH, Bell C, O’Connor E, Korthauer K et al. A Somatically Acquired Enhancer of the Androgen Receptor Is a Noncoding Driver in Advanced Prostate Cancer. Cell 2018; 174(2): 422–432 e413. [DOI] [PMC free article] [PubMed] [Google Scholar]
- 35.Viswanathan SR, Ha G, Hoff AM, Wala JA, Carrot-Zhang J, Whelan CW et al. Structural Alterations Driving Castration-Resistant Prostate Cancer Revealed by Linked-Read Genome Sequencing. Cell 2018; 174(2): 433–447 e419. [DOI] [PMC free article] [PubMed] [Google Scholar]
- 36.Goto K, Oue N, Hayashi T, Shinmei S, Sakamoto N, Sentani K et al. Oligophrenin-1 is associated with cell adhesion and migration in prostate cancer. Pathobiology 2014; 81(4): 190–198. [DOI] [PubMed] [Google Scholar]
- 37.Zhao D, Ma G, Zhang X, He Y, Li M, Han X et al. Zinc Finger Homeodomain Factor Zfhx3 Is Essential for Mammary Lactogenic Differentiation by Maintaining Prolactin Signaling Activity. J Biol Chem 2016; 291(24): 12809–12820. [DOI] [PMC free article] [PubMed] [Google Scholar]
- 38.Gupta S, Li J, Kemeny G, Bitting RL, Beaver J, Somarelli JA et al. Whole Genomic Copy Number Alterations in Circulating Tumor Cells from Men with Abiraterone or Enzalutamide-Resistant Metastatic Castration-Resistant Prostate Cancer. Clin Cancer Res 2017; 23(5): 1346–1357. [DOI] [PubMed] [Google Scholar]
- 39.Soave A, Chun FK, Hillebrand T, Rink M, Weisbach L, Steinbach B et al. Copy number variations of circulating, cell-free DNA in urothelial carcinoma of the bladder patients treated with radical cystectomy: a prospective study. Oncotarget 2017; 8(34): 56398–56407. [DOI] [PMC free article] [PubMed] [Google Scholar]
- 40.Arafeh R, Samuels Y. PIK3CA in cancer: The past 30 years. Semin Cancer Biol 2019. [DOI] [PubMed] [Google Scholar]
- 41.Pearson HB, Li J, Meniel VS, Fennell CM, Waring P, Montgomery KG et al. Identification of Pik3ca Mutation as a Genetic Driver of Prostate Cancer That Cooperates with Pten Loss to Accelerate Progression and Castration-Resistant Growth. Cancer Discov 2018; 8(6): 764–779. [DOI] [PubMed] [Google Scholar]
- 42.Cancer Genome Atlas Research N. The Molecular Taxonomy of Primary Prostate Cancer. Cell 2015; 163(4): 1011–1025. [DOI] [PMC free article] [PubMed] [Google Scholar]
- 43.Baca SC, Prandi D, Lawrence MS, Mosquera JM, Romanel A, Drier Y et al. Punctuated evolution of prostate cancer genomes. Cell 2013; 153(3): 666–677. [DOI] [PMC free article] [PubMed] [Google Scholar]
- 44.Nava Rodrigues D, Casiraghi N, Romanel A, Crespo M, Miranda S, Rescigno P et al. RB1 Heterogeneity in Advanced Metastatic Castration-Resistant Prostate Cancer. Clin Cancer Res 2019; 25(2): 687–697. [DOI] [PubMed] [Google Scholar]
Associated Data
This section collects any data citations, data availability statements, or supplementary materials included in this article.