

Abstract Summary
Based on the expanding set of applications for hyperpolarized carbon-13 (HP-13C) MRI, this work aims to communicate standardized methodology implemented at our institution (UCSF) as a primer for conducting reproducible metabolic imaging studies of the prostate and brain. Current state-of-the-art HP-13C acquisition, data processing/reconstruction, and kinetic modeling approaches utilized in patient studies are presented together with the rationale underpinning their usage. Organized around spectroscopic and imaging-based methods, this guide provides an extensible framework for handling a variety of HP-13C applications, which derives from two examples with dynamic acquisitions: 3D echo-planar spectroscopic imaging (EPSI) of the human prostate and frequency-specific 2D multi-slice echo-planar imaging (EPI) of the human brain. Details of sequence-specific parameters and processing techniques contained in these examples should enable investigators to effectively tailor studies around individual use cases. Given the importance of clinical integration in improving the utility of HP exams, practical aspects of standardizing data formats for reconstruction, analysis and visualization are also addressed alongside open-source software packages that enhance institutional interoperability and validation of methodology. To facilitate the adoption and further development of this methodology, example datasets and analysis pipelines have been made available via hyperlinks to the Supplementary Material.
Keywords: Hyperpolarized MRI, 13C, metabolic imaging, brain cancer, prostate cancer
Graphical Abstract
This work describes standardized hyperpolarized carbon-13 (HP-13C) MRI methodology implemented at UCSF for prostate and brain exams as a primer for conducting reproducible metabolic imaging studies of the prostate and brain. Data processing, reconstruction, and kinetic modeling approaches utilized in patient studies are presented together with the rationale underpinning their usage. Practical aspects of standardizing data formats for analysis and visualization are described and accompanied by supplementary material that includes open-source software packages, example datasets and analysis pipelines.
1. Introduction
Following the emergence of dissolution dynamic nuclear polarization (d-DNP)1, which significantly enhances carbon-13 signal in labeled compounds, and the subsequent demonstration of rapid non-invasive imaging of metabolic conversion via magnetic resonance2, there has been a substantial expansion of applications for this technology. In short order, the field has moved from animal studies into clinical trials investigating human prostate3, brain4,5,6, kidney7 and liver8 cancer and metastasis, along with deviations in cardiac metabolism9. Given the ongoing efforts toward leveraging hyperpolarized carbon-13 (HP-13C) MRI at more than 15 institutions worldwide, the importance of robust acquisition, processing and quantitation that provides reproducible findings is starting to be recognized. The current perspective aims to describe the approaches taken at UCSF for standardizing HP-13C methodology in order to maintain consistency across exams.
At UCSF, with the assistance of a National Institutes of Health (NIH) P41 center mechanism through the National Institute of Biomedical Imaging and Bioengineering (NIBIB), a Hyperpolarized MRI Technology Resource Center (HMTRC) was established in 2011 under the leadership of Dr. Daniel Vigneron with the goals of HP-13C MRI technology development, training of researchers from around the world, and disseminating methods and information about the technology. Since then, the Center has maintained a collection of resources for HP-13C probe preparation, hardware documentation, and a repository of software packages for RF pulses, pulse sequences, processing and visualization. In keeping with the collaborative spirit of the open-source community, a majority of the items discussed in this paper are readily available on the HMTRC website (https://radiology.ucsf.edu/research/labs/hyperpolarized-mri-tech/), including example datasets and corresponding analysis software and pipelines.
This paper will focus on our acquisition and processing approaches for investigating prostate and brain cancer in patients owing to the diverse range of size and spatial resolution represented in these applications, which can easily be adjusted for other organs. The practical outlining of methodological considerations for spectroscopic and imaging-based HP-13C acquisitions, together with step-wise detailing of associated processing routines, is intended to serve as a primer for conducting MRI studies at local institutions and in the context of multi-center trials.
2. Acquisition and Data Formats
Current acquisition strategies for HP-13C MRI can be classified into two categories with specific considerations and trade-offs in the type of data they produce: (1) spectroscopic imaging methods (CSI/MRSI) and (2) imaging-based methods (e.g. EPI). Below is a brief overview of these categories, followed by details of our specific implementations (table 1) for a spectroscopic imaging method used in the prostate and an imaging-based method used in the brain.
Table 1:
Key acquisition parameters for spectroscopic imaging of the prostate and metabolite-specific imaging of the brain at UCSF.
| Acquisition Method | Spectroscopic Imaging | Metabolite-specific Imaging |
|---|---|---|
| UCSF Application area | Prostate | Brain |
| k-space sampling | Blipped EPSI | Symmetric EPI28 |
| RF pulses | metabolite-specific, variable flip angles with multiband spectral-spatial pulses | metabolite-specific flip angles with singleband spectral-spatial pulses |
| Spatial Resolution (application-specific) | 8 × 8 × 8 mm | 15 × 15 × 15 mm |
| FOV (application-specific) | 9.6 × 9.6 × 12.8 cm (12 × 12 × 16) | 24 × 24 × 12 cm (16 × 16 × 8) |
| Temporal resolution | 2 s | 3 s |
| Reconstruction Methods | Compressed-sensing14,19,45,57,71 | Reference scan corrections 28,36 |
| Refpeak coil combination49,51 |
The other major design choice in the data acquisition is whether to acquire data dynamically or at a single time-point. We have chosen to acquire dynamic time-resolved data because it ensures capturing of the bolus in-flow and is robust to variations in bolus delivery, which can vary between patients due to the injection or physiology (e.g. cardiac function, vascular delivery). Single time-point data can be very sensitive to measurement timing relative to the bolus delivery, which so far has been observed to be variable across human subjects in multiple studies6,10,11,12.
Spectroscopic Imaging Methods
The CSI/MRSI-based strategies acquire data simultaneously from all metabolites and utilize spectrally-encoded readouts to resolve the HP substrate from its metabolic products for image synthesis. Some examples currently in use throughout the community include 2D phase-encoded CSI, 2D spiral CSI, 2D and 3D dynamic MRSI, and IDEAL CSI13, many of which were employed in early phase clinical studies. The 2D phase-encoded CSI and 2D/3D dynamic MRSI have been applied in prostate3,9, and brain cancer studies, and spiral-IDEAL CSI has been utilized to investigate brain and breast cancer15,16 in patients.
The EPSI-based acquisition strategies are faster than in conventional phase-encoded CSI as a result of the multi-echo readout gradient for spectral encoding. Design of an EPSI readout entails consideration of several key factors. While symmetric EPSI is more SNR-efficient17, flyback EPSI is compatible with random phase-encoding for 3D acceleration18,19. Other considerations of importance to EPSI are spectral-spatial (SPSP) resolution and spectral bandwidth. Currently our symmetric EPSI readout has a 543 Hz spectral bandwidth and a 10 Hz resolution, whereas flyback EPSI has a 581 Hz bandwidth and a 9.8 Hz resolution for 3T studies20. The approximately 10 Hz spectral resolution provides more than sufficient spectral separation at 3T where the majority of human studies were conducted to date, as HP-13C resonances are discrete, and retain their line profile for phase-sensitive peak quantification. These parameters were designed around [1-13C]pyruvate studies, where the EPSI bandwidth covers the range of frequencies from [1-13C]pyruvate to [1-13C]lactate (Figure 1), but allows aliasing of 13C-urea (from built-in calibration phantom) and 13C-bicarbonate at 3T. By carefully choosing the bandwidths, the aliased 13C-bicarbonate signal can be placed between [1-13C]pyruvate-hydrate and [1-13C]alanine resonances. This aliasing leads to blurring artifacts in the image and spectral domains, which can be removed by reconstructing after demodulating the raw data with a shifted frequency21.
Figure 1. Representative time-resolved brain spectrum.

Shows the substrate [1-13C]pyruvate and downstream products [1-13C]lactate and [13C]bicarbonateFigure reproduced with permission from Park I et al4.
UCSF Prostate Spectroscopic Imaging Strategy
Imaging of patients with prostate cancer at UCSF utilizes a 3D compressed sensing (CS)-EPSI acquisition14, which features highly undersampled acceleration techniques that provide coverage of the entire gland from base to apex. Given the relatively small FOV of the prostate, which exhibits good B0 and B1 homogeneity, this sequence can achieve suitable performance. Its full 3D encoding mitigates potential slice profile effects arising from 2D multi-slice acquisitions, thus improving metabolite quantification. The reduction in TE owing to the relatively short multiband SPSP excitation also enhances the SNR of metabolites with shorter T2* (e.g lactate)22,23,24, where SPSP minimized the chemical-shift slice offset and has been designed to provide different flip angles for each metabolite, improving SNR over a constant flip angle scheme25,26. Investigations into high- versus low-grade human and preclinical prostate cancer using the 3D CS-EPSI acquisition were shown to well characterize differences in pyruvate metabolism corresponding to upregulation of lactate dehydrogenase (LDH) activity. The mean pyruvate SNR ~45 and lactate ~10 observed in prostate (8mm isotropic resolution) was adequate for kinetic modeling. As an example of the dynamic 3D CS-EPSI implementation at UCSF, Figure 2 presents HP-13C spectral data from a patient with suspected prostate cancer. Sample 3D CS-EPSI data and reconstruction code are also included in the Supplementary Material (see Section 6).
Figure 2. Example 3D dynamic HP-13C CS-EPSI: prostate data.

Dynamic spectra from HP-13C CS-EPSI of a patient with prostate cancer are shown with reference to a spectral grid overlaid on T2-weighted prostate images.
Imaging-Based Methods
The non-recoverable magnetization of metabolically active HP substrates, such as [1-13C]pyruvate, necessitates imaging sequences that are RF efficient, can rapidly encode both spectral and spatial dimensions, and have a high temporal resolution. As an alternative to spectroscopic imaging, we have also employed a metabolite-specific imaging approach27,28 for many of our clinical imaging studies. While not discussed in detail here, it is important to note that there are alternative imaging-based strategies for hyperpolarized 13C MRI, including bSSFP29,30,31 and model-based approaches such as spiral-IDEAL32,33 or k-t spiral34. The metabolite-specific imaging approach used here is based on a sequence consisting of a single-band SPSP RF pulse that independently excites each metabolite, followed by a rapid, single-shot readout to encode the data within a single TR per metabolite/slice. HP 13C MR imaging offers an appealing alternative to EPSI, since it can provide higher temporal resolution, is more robust to motion, and can be scaled to large, clinically relevant FOVs without an increase in scan time. The main limitations in this scheme are that a minimum spectral separation is required between all metabolites to only excite a single metabolite with the SPSP RF pulse, and B0 inhomogeneity must be sufficiently small such that the actual metabolite frequency resides within the spectral passband of the pulse.
UCSF Brain Imaging Strategy
HP imaging of patients with brain cancer at UCSF utilizes a frequency-selective imaging approach with a single-shot symmetric echoplanar readout. This approach is well-suited for clinical imaging of [1-13C]pyruvate, where a small number of well-separated resonances are known a priori. Compared to the 3D EPSI sequence used for prostate imaging, an EPI approach is more robust to motion and can easily be scaled to larger FOVs without an increase in scan time by increasing the echo train length to maintain the desired spatial resolution. A broader PSF in the blip dimension may arise due to T2* decay, which can be partially mitigated through the use of ramp sampling, partial-Fourier acquisition, or acceleration with parallel imaging to reduce the echo-spacing and/or echo time. While the singleband SPSP RF pulses used for excitation are in principle sensitive to off-resonance, they were designed to maintain spectral selectivity and passband flip angle for B0 inhomogeneity within ±1 ppm (±30Hz for 13C at 3T), which we have achieved in our prostate and brain cancer studies. (For B0 inhomogeneity just outside of this range in the RF pulse transition region, the flip angles will be reduced, which should be accounted for (e.g. with a B0 map and RF pulse profiles) for accurate quantification. If the B0 inhomogeneity goes into the RF pulse stopband region, then no signal will be seen.) The B0 inhomogeneity can also lead to spatial distortions with the EPI readout. In our studies we chose to maintain a short echo spacing of 1.032 ms in the phase encoding direction, meaning ±1 ppm inhomogeneity would result in ±0.5 voxel shift for our 16×16 matrix. For regions with larger B0 inhomogeneities, EPI distortion correction methods can be applied35,36. Figure 3 depicts multi-resonance metabolite images acquired from a patient with brain cancer using dynamic HP-13C EPI with whole-brain coverage implemented at UCSF. Sample EPI data and reconstruction code are included in the Supplementary Material (see Section 6).
Figure 3. Example dynamic HP-13C EPI: brain data.

HP [1-13C]pyruvate, [1-13C]lactate, and [13C]bicarbonate area-under-the-curve (AUC) EPI images from eight slices covering the entire brain of a patient who has undergone treatment for brain cancerImages are devoid of Nyquist ghost artifacts or apparent geometric distortionFor anatomic reference, 1H FLAIR images are provided in the bottom row.
RF Excitation Strategies
The choice of flip angles is crucial in an HP experiment due to the unrecoverable hyperpolarized magnetization, and depends on the temporal resolution and total imaging time. Both spectroscopic imaging and imaging-based methods (e.g. EPI) can benefit from flip angle schemes that vary between metabolites (“multiband” methods) and over time (“variable flip angles”).
Multiband methods use a lower flip angle on the substrate compared to the metabolic products, thereby preserving substrate magnetization for future conversion to metabolic products. For the MRSI/CSI-based methods, we achieve this using multiband SPSP RF excitation pulses. To design these pulses, the metabolite of interest needs to be identified. For instance, brain imaging using [1-13C]pyruvate targets [1-13C]pyruvate, [1-13C]lactate and [13C]bicarbonate, whereas abdominal/liver imaging focuses on [1-13C]pyruvate, [1-13C]lactate and [1-13C]alanine. Assignment of “don’t care” resonances relaxes design parameters to allow reduced effective time-bandwidth and therefore shorter pulse duration. In imaging-based methods, multiband strategies are achieved by simply modulating the flip angles of the individual metabolite excitations.
Variable flip angle strategies can theoretically provide higher SNR and/or improved estimates of kPL37,38. However, these methods are more sensitive to B1 mis-calibration and inhomogeneity39. For our prostate studies, where the FOV is small and B1 inhomogeneity is minimized, a variable flip angle scheme was designed to minimize kPL sensitivity to B1 error40. In our brain studies, which required a larger FOV, a constant-through-time flip angle scheme was employed. In all cases, the flip angle strategy must also be incorporated into the analysis, as this can substantially affect the apparent metabolite kinetics.
Acquisition Parameters Required for Reconstruction and Analysis
Reconstruction of MRSI and MRI data requires knowledge of the k-space and time sampling, typically through characterization of the gradients. For example, in our EPSI studies, essential information entails the FOV/resolution, number of EPSI lobes, timing of gradient plateau and ramp, and timing offsets between gradients and data acquisition. For CS-EPSI, the pseudorandom undersampling pattern needs to be saved for k-space reordering. The TE and any other timing parameters (i.e. isodelay of RF pulses) are also important for phase correction in CSI/MRSI. For our EPI studies, this includes FOV, resolution, timing of gradient plateaus and ramp, and also phase correction factors from a reference scan28.
In analyzing the data, it is critical to know the acquisition timing (i.e. temporal resolution) and the usage of magnetization by RF pulses. This magnetization usage is determined by the expected flip angles for each HP resonance, the number of excitation pulses per frame, and, if available, a B1+ map to correct for inhomogeneity in the transmit field.
Acquiring time-resolved data ensures capturing of the bolus in-flow, which can vary between patients due to the injection or vascular delivery. An alternative would be to acquire single time-point data, but the resulting measurements of lactate and pyruvate are very sensitive to the timing of this single measurement. Time-resolved acquisitions are insensitive to timing differences so can provide more accurate assessments of metabolism.
HP Data Formats
Raw spectroscopic data from the research sequences described here are generally provided on the scanner in vendor specific raw data formats. As described in the previous section, the acquired data must include sufficient information about the acquisition in order to reconstruct the data for analysis. This is complicated by the lack of standardization for how this information is encoded among various vendor formats. Customizing software to read these formats and data ordering from constantly evolving pulse sequences can represent a significant effort. Moreover, the file formats that are employed to encode HP data determine which software packages can be used for analysis, visualization and communication of the data, and thereby impact software interoperability, methodology validation and integration of HP methods into clinical data delivery workflows. At UCSF the strategy to address these issues has been to a) standardize the parameterization of acquisitions and to encode this information in a consistent format called the Data Acquisition Descriptor (DAD) and b) to convert data encoded in vendor-specific formats to a standard DICOM format to improve interoperability with different software packages and data flows.
To standardize the encoding of HP acquisition parameters, we followed the approach taken by the ISMRMRD41, which provides a vendor-neutral raw imaging data format. We extended this approach to support spectroscopy-specific parameterization for common MRSI acquisition strategies including EPSI encoding, CS, and phase encoding. While the ISMRMRD format stores the entire data set, the current approach only addresses the meta-data parameters that would accompany vendor specific raw-data. These parameters are written into a data acquisition descriptor (DAD) file42 developed at UCSF, which encodes information in XML format and enables cross-vendor utilization for data analysis, as depicted by the schematic workflow in Figure 4. Custom UCSF pulse sequences were modified to write DAD files with their acquisition parameters, and each raw file produced has an associated DAD file containing every parameter relevant for processing. Figure 5 illustrates such intricate parameterization of an EPSI readout trajectory for analysis using a DAD file. The DAD xml format can be extended to support other acquisition schemes and supports parametrization of other complex k-space trajectories such as compressed sensing43. By using standardized parameterization of the data, we are able to develop vendor-agnostic software modules capable of processing different classes of acquired data, thus greatly reducing the software development burden for supporting HP data analysis across institutional platforms. For example, an EPSI sequence on a preclinical Bruker and a human GE scanner can use the same data reordering module to convert the raw data into a regular Cartesian grid of k-space spectra suitable for FFT reconstruction. The usage of the DAD file is also extensible in the sense that it can be tailored to define parameters for acquiring data in a consistent fashion across sites and time, and may accordingly serve as an explicit record of the acquisition. Open-source libraries for writing acquisition parameters to DAD files are available in C and C++ and could be leveraged on other vendor platforms to generate data sets compatible with the open-source analysis tools described here. The parameter sets will be presented to the ISMRMRD as possible extensions to support the present methods.
Figure 4. Vender neutral DAD file utilization.

Data Acquisition Descriptor (DAD) files contain a standard parameterization of an acquisition including the readout trajectoryThis enables a single set of data reordering software modules to be used to construct a vendor neutral analysis pipeline shown here for an EPSI CS acquisition.
Figure 5. DAD file parameterization of EPSI readout trajectory.

Data Acquisition Descriptor (DAD) files contain standard parameterization of acquisitionsHere the parameters required to define an EPSI readout trajectory are defined graphically on the left and the corresponding DAD XML elements are represented on the right.
Reconstructed MRSI data are written in DICOM MRS formats using UCSF software44 (see tutorials referenced in Section 6, Supplementary Material). Metabolite maps from single time-point or dynamic acquisitions are written as standard DICOM MR Images, or Enhanced MR Image storage objects, which enables interoperability with other DICOM-compliant software and integration into clinical information systems.
Reconstructed MRI data from EPI sequences are encoded in standard DICOM MR Image or Enhanced MR Image format for single time-points. Dynamic acquisitions comprising multiple 3D volumes for each frequency band are encoded as DICOM Enhanced MR Image Storage objects which have explicit fields that represent timepoint indexing of each 3D volume in the series.
3. Reconstruction Methods
EPSI Reconstruction
Our 3D CS-EPSI sequence uses a pseudorandom-undersampling encode pattern that travels in (kx,ky), to allow random sampling of data in (kx,ky,kf, dynamic) dimensions. The conditions of compressed sensing reconstruction are fulfilled by the intrinsic sparsity in human and preclinical HP-13C data, and the current pharmacy and hardware setups provide sufficient SNR for the L1+TV enforcing reconstruction algorithm. In the case of multichannel data, a singular-value-decomposition (SVD) algorithm is applied to simultaneously benefit from parallel imaging and CS. The L1, TV penalties in CS, and the singular value threshold in SVD can be chosen either empirically or by simulations based on the underlying SPSP correlation and complexity of the HP dataset for each imaging target19,45. Briefly, the full reconstruction workflow entails k-space reordering and CS reconstruction, followed by phase-sensitive peak quantification (see Figure 6). These steps are facilitated in a flexible way by using the acquisition parameters from the specific dataset, as recorded in the DAD file accompanying the raw data. To tackle multichannel data, noise decorrelation is applied to the raw data in the first step46, and WSVD is later utilized to estimate a complex coil sensitivity map and combine channels47. Example EPSI data and reconstruction code are provided in the Supplementary Material, as described in Section 6.
Figure 6. HP-13C EPSI Data Processing.

This schematic summarizes the dynamic HP-13C MRSI processing framework for the 3D CS-EPSI sequence, which is currently used in human prostate cancer studies.
EPI Reconstruction
Our metabolite-specific imaging sequence uses a symmetric echoplanar readout. A symmetric readout is used instead of a flyback readout because of its higher SNR efficiency, reduced echo-spacing, and shorter TE. However, despite these advantages, the symmetric readout results in Nyquist ghost artifacts which appear at ± FOV/2. Such artifacts can be readily corrected for by performing a reference scan using the 13C trajectory on the 1H channel28 or in post-processing through an exhaustive search of the phase coefficients36. For multichannel data, pre-whitening is also applied to the raw data to account for noise correlation between elements. The noise covariance matrix can be calculated from a separate, noise-only scan or from the final timepoint in the dynamic HP acquisition where no signal is present. An overview of the dynamic HP-13C EPI processing pipeline utilized for brain patient studies at UCSF is shown in Figure 7. Here we found independently phasing [13C]bicarbonate data was superior to using [1-13C]pyruvate as a phase reference, given the associated flow effects of blood. Example EPI data and reconstruction code are provided in the Supplementary Material, as detailed in Section 6. Misalignment from a bulk shift is accounted for using the measured pyruvate frequency from the 1D spectra acquired immediately after the acquisition. The echo spacing and readout duration are kept short as a tradeoff between SNR efficiency and sensitivity to distortion. For the brain studies the total readout duration is 16ms, equivalent to a 4ms readout on the 1H channel, where we have not observed misregistration between 1H and 13C images (see Figure 5)48.
Figure 7. HP-13C EPI Data Processing.
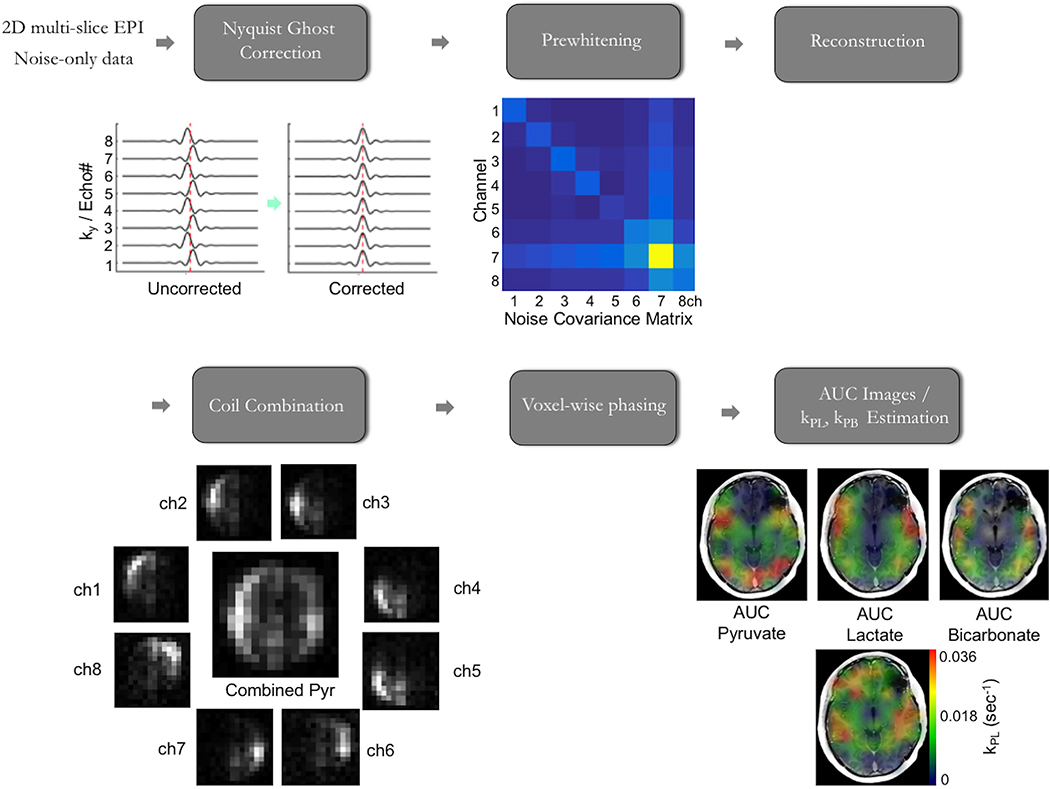
An overview of the processing of dynamic HP-13C EPI data acquired from patients with brain cancer is presented in this schematicBoth the HP patient data and noise-only data, which is captured in the same fashion prior to [1-13C]pyruvate injection, are utilized in processing, with the latter enabling robust SNR thresholdingMetabolite AUC maps and modeled rate constant (kpl, kpb) maps are the final output.
Coil combination
Multichannel arrays are used in 13C studies to improve SNR, increase volumetric coverage, and enable acceleration. However, many coil combination methods cannot be directly applied to HP-13C data. Sensitivity maps are difficult to acquire directly, as they would waste non-recoverable HP magnetization, and there is insufficient 13C in the body for direct acquisition on the basis of natural abundance. While a sum-of-squares approach can be used to combine the multichannel data, it cannot preserve the phase and equally weights each channel, resulting in magnitude images that are combined sub-optimally.
Alternatively, multi-channel data can be combined using sensitivity maps generated from the fully-sampled data itself49,50,51 and then combined in an SNR-optimal way. This has the advantage of preserving the HP magnetization for metabolic studies and has inherently co-registered sensitivity maps and image data, thus removing the potential for mis-registration between the sensitivity calibration scan and the imaging experiment. For imaging experiments, data are combined using complex sensitivity maps derived from the fully-sampled pyruvate data (RefPeak method):
In this nomenclature, fRef refers to the metabolite used to estimate the sensitivity map S for each coil ck. In principle, this can be estimated from any metabolite, but pyruvate is most commonly used because of its high SNR. Combining the data in this manner greatly improves image quality compared to sum-of-squares in low-SNR metabolites such as bicarbonate. Employing this strategy also assures zero-mean data noise, which increases the reliability of subsequent kinetic modeling. Coil combination code is available in the “hyperpolarized-mri-toolbox” (see section 6). In the context of this communication, coil combination was performed in multichannel arrays for brain, whereas prostate imaging used a single-element receiver.
4. Data post-processing and Quantification
SNR Thresholding
Prior to performing quantifications, we perform thresholding based on the [1-13C]pyruvate SNR. The noise itself can readily be estimated from noise-only dynamic datasets acquired with the same parameters as the patient data, but without HP-13C compounds onboard. The rationale for SNR thresholding is that ratiometric and kinetic modeling methods rely on the measurement of pyruvate to quantify metabolic conversion, and become unstable with low [1-13C]pyruvate signal11.
Noise Considerations
The noise characteristics of metabolite data must also be considered in all quantification. Whenever possible we avoid the use of magnitude data, as this can lead to bias at low SNR. In MRSI processing, we use phase-sensitive peak detection and integration, resulting in real-valued (i.e. can be negative) peak data. This provides Gaussian noise characteristics that allow for optimal fitting with least-squares minimization. For magnitude data, a Rician noise model should be employed to avoid bias arising from the Rician floor at low SNR values52.
Metabolite Extraction
Following data reconstruction, we perform several post-processing steps prior to quantification. For MRSI data, phasing the spectra allows for improved detection of low SNR peaks47. Because these data are contaminated by 1st order phase due to the gradient-echo acquisition, we independently phase the spectra from each metabolite on a voxel-wise basis, and assume that the phase remains constant through time. This is done by finding the phase offset that maximizes the real component of the complex spectra for the region around each metabolite, which are concatenated in time. Following phasing, the metabolite amplitudes are extracted as integrated peak areas. In the prostate MRSI paradigm, pyruvate SNR threshold of 210 was applied to quantify pyruvate-lactate data. Admittedly, the phasing error translates to a small positive bias ΔkPL<0.001(s−1), but it does not increase the standard error of kPL estimates5. Also, phase-mode error should be relatively benign compared to magnitude-mode peak quantification, as phasing error cancels out through time as opposed to constructive addition in magnitude in terms of kinetic modeling.
Quantification of Metabolic Conversion
There exist many promising approaches for quantification of metabolic conversion53. We primarily use area-under-(time)-curve ratiometric methods as well as an input-less kinetic modeling approach for human studies. The rationale for using these methods is that they have been shown to be robust to variations in polarization, SNR, and pyruvate delivery, which can be considerable among human subjects. These approaches and considerations for their implementation are presented in the following sections.
Ratiometric methods for quantifying metabolic conversion rates, based on the metabolite-to-pyruvate ratios, are simple and robust when certain assumptions are met. It has been shown that the ratio of the area-under-curve (AUC) between product (i.e. [1-13C]lactate) and substrate (i.e. [1-13C]pyruvate) is proportional to the conversion rate (i.e. kPL) when the following assumptions are fulfilled: product relaxation rate (i.e. T1L) does not change; dynamic measurements begin before metabolite signals appear; and, when variable flip angles are used, the substrate bolus characteristics (arrival time, bolus duration and shape) are fixed54.
Kinetic modeling is used to estimate apparent rate constants for conversion of pyruvate-to-lactate (kPL) and pyruvate-to-bicarbonate (kPB). It is important to note that these apparent rate constants are not conventional rate constants of chemical kinetics. They are based on a simplified first-order kinetic model of label exchange, and also may include contributions from other factors in vivo, such as perfusion and cellular transport.
Our current approach for kinetic modeling is to use an “input-less” strategy that shares many of the same assumptions as the AUC ratio method. This makes it robust to low SNR data and insensitive to variability in the bolus characteristics, while accounting for arbitrary flip angle strategies. We observed through Monte Carlo simulations that an input-less model provides more robust performance than ratiometric methods. This strategy also does not require fitting or knowledge of the pyruvate input function, which is required by other popular modeling strategies and can introduce additional error or uncertainty.
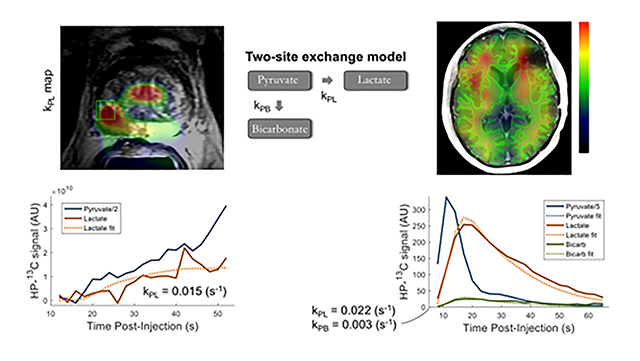
The input-less strategy assumes uni-directional 13C label exchange from pyruvate to the metabolic products (i.e. kLP = kBP = 0), and uses fixed relaxation rates (T1P, T1L, T1B), which are estimated from prior studies10,55. The inputs are the metabolite amplitudes, acquisition timings, and RF flip angles. As shown in Figure 8, the input-less model can readily be applied to fit dynamic data acquired by means of EPSI or EPI in human studies of prostate and brain cancer, to generate maps of kPL within regions of interest.
Figure 8. EPSI/EPI-derived kPL Maps.

Example kPL maps from human patient studies based on the fitting of dynamic HP [1-13C]lactate production using the input-less kinetic modelLeft: EPSI Kpl map overlaid on a T2-weighted image from a patient with prostate cancer, with dynamic metabolite traces shown for the voxel indicated in greenRight: EPI kPL map overlaid on a T1 post-contrast 1H image from a patient treated for malignant brain tumor, with both HP [1-13C]lactate and [13C]bicarbonate production depicted within the highlighted region of normal-appearing white matter.
There are also more detailed kinetic models, including additional factors of vascular components within a voxel as well as intra- and extra-cellular compartments. One promising approach we are investigating includes a vascular component within each voxel56, which may be important since there are likely substantial vascular metabolite fractions resulting from the short time between injection and acquisition. This approach was shown to be more appropriate in variety of animal models56. For these models, a vascular input function (VIF) was estimated from a vascular voxel that was identified on the 1H anatomical images. The assumptions of uni-directional conversion and fixed relaxation rates remain the same.
The input-less kinetic model, AUC ratio methods, and kinetic models with input functions are available within the “hyperpolarized-mri-toolbox”57 under the “kinetic_modeling/” directory.
5. Visualization and clinical integration
Visualization
Visualization software for HP experiments must support display of dimensions representing space, frequency, time, and receiver channel. The software must be capable of rendering 3D arrays of spectral voxels at the correct spatial location on standard anatomical images and for comparison with 1H spectra. It must also be able to display frequency resolved temporal changes (see Figure 9, top) as well as the temporal evolution of individual metabolites (see Figure 9, middle and bottom) for kinetic modeling. A receiver channel dimension is required for QC of analysis pipelines in order to visualize individual raw and processed data channels prior to combination. At UCSF, we developed a custom software package44,58 (SIVIC) to support these requirements. SIVIC reads MRI and MRSI DICOM images as well as multiple vendor specific raw data formats. The package runs on Windows, Linux and Mac and can be used for offline analyses, or run on a variety of scanner consoles (GE, Bruker, Agilent).
Figure 9. SIVIC Visualization.

Display modes for dynamic HP-13C datasets comprising a time series of spectroscopic images (top), time series of 3D metabolite maps (middle) and dynamic views showing the evolution of the HP signal from individual resonances through time (bottom).
Integration with Other Molecular Imaging Modalities
The initial application of HP [1-13C]pyruvate in cohorts of patients with primary or metastatic brain tumors demonstrated varied (similar, lower or increased) conversions to lactate and bicarbonate in the lesions compared to those in the normal brain4,58. This suggests that the combination of HP 13C metabolic imaging with other metabolic imaging models, such as PET tracers59 and steady state 1H magnetic resonance spectroscopic imaging (MRSI)61, could improve the understanding of the underlying biological processes in the abnormalities. At UCSF, we have established methods for acquiring and analyzing 1H MRSI for patients with brain tumors62,63. When integrating with HP 13C data, the 1H spectral data and maps can be affinely registered to the 13C data by applying the transformation matrix generated from the registration between the images acquired at two examinations, in order to enable voxel-by-voxel analysis. SIVIC can then be used to provide visual comparisons of 1H and 13C metabolic maps, as well as maps of standardized uptake values (SUVs)64 from PET.
Workflow and Data Delivery
As HP methods mature and become increasingly utilized in human subjects, data flow will require further consideration, given its importance to efficient data transfer and analysis. The use of DICOM as the standard output format from our HP packages permits us to send results freely between scanners and research and clinical PACS in our institution. Although DICOM MRSI data can be stored in many PACS, only 3D MRI images can be visualized on most PACS workstations. To address this, we have developed a plugin44 for OsiriX65 and HOROS66 that permits individual researchers to manage their imaging MRI and MRSI data in a PACS with visualization capabilities for both.
The ability to send HP MR spectra and quantitative maps in real-time from a scanner to clinical PACS for visualization and storage is a critical element of the data flow required for clinical integration of the HP modality. In order to send viewable results to PACS and the reading room, software packages running on the scanner console support creation of static DICOM Secondary Capture reports. While these reports can be sent to PACS for viewing, they cannot be manipulated or further processed in the reading room. The 3D quantitative metabolite maps or EPI images from HP acquisitions can be generated on the console and sent to PACS with standard anatomical images and spatially correlated with this data.
While 3D metabolite maps derived from the analysis of MRSI acquisitions can be viewed with or without 3D anatomical images, they do not capture spectral quality or content, and the ability to visualize spectroscopic data and correlate it with anatomical data directly in PACS would be highly advantageous. Such functional extension would require broader utilization of the DICOM MRS standard in order for PACS implementations to provide vendor neutral visualization tools. Several research and commercial MRS platforms already support the DICOM MRS standard, including TARQUIN67,68, SIVIC44,58, jMRUI69 and Philips70, enabling vendor-neutral visualization and data interoperability. SIVIC has plugins for OsiriX65 and Horos66 PACS, which demonstrate the feasibility and benefit of integrated anatomical and spectroscopic data visualization in a PACS; however, MRS visualization in enterprise PACS implementations remains an unmet need.
6. Supplementary Material
Example EPSI Data and Recon
An example EPSI dataset is available online, together with reconstruction code71, in the “Hyperpolarized MRI Toolbox”. This reconstruction routine accepts a reordered version of undersampled k-space data, along with a pseudorandom undersampling mask on which the data acquisition was based. L1 compressed-sensing is performed to interpolate the missing k-space data, and the reconstructed k-space is saved for further quantification or visualization in SIVIC.
Example EPI Data and Recon
An example EPI dataset, reconstruction code and Jupyter Notebook72,73 are also available online in the “Hyperpolarized MRI Toolbox”. This pseudo reconstruction starts after the raw data has been phase corrected and Fourier-transformed into image space. The example code pre-whitens the multichannel data and then generates coil-combined images using the pyruvate data to estimate the sensitivity map. More information on this ‘refpeak’ reconstruction can be found in Zhu et al.74. Using the coil combined data, AUC ratio maps, apparent rate constant maps, and mean arrival time maps are also generated.
Example Dynamic EPSI Data Analysis utilizing DAD File
This example with software and sample data demonstrates analysis and visualization of 2D dynamic HP 13C data of the human prostate acquired on a GE 3T scanner75,76. The analysis uses SIVIC for data reordering, reconstruction, and to generate DICOM metabolite maps for [1-13C]pyruvate and [1-13C]lactate at each timepoint. The end result is a set of DICOM metabolite maps of fitted kinetic parameters including kPL.
Hyperpolarized MRI Toolbox
We have created a “Hyperpolarized MRI Toolbox” to provide a set of research-level and prototyping software tools for HP MRI experiments57. It is primarily based on MATLAB code and includes code for simulating HP-13C MRI data, designing pulse sequences (RF pulses, readout gradients), data reconstruction, and data analysis. This resource is hosted and maintained via GitHub as an open-source, collaborative platform to facilitate engagement of the hyperpolarized MRI research community.
SIVIC Software, Tutorials and Sample Data
SIVIC development has largely been driven by the need to address requirements of the HP community. The current package is available for download in source format as well as binary distributions for Linux, OsX and Windows44,77. Since 2014, many detailed tutorials focusing on different aspects of HP 13C analysis with SIVIC have been developed for the HMTRC78 and presented to users at hands-on symposia aimed at facilitating the use of the SIVIC toolkit as a HP data analysis platform. All tutorials, together with sample data, are available online79. These tutorials provide detailed instructions for performing preprocessing, reconstruction, quantification and visualization, as well as data import and export using both the SIVIC GUI and command line tools. These tutorials are accompanied by sample data from GE, Varian and Agilent systems and represent EPSI, dual-band variable flip angle, EPI, and CSI acquisitions. The 2018 and 2019 tutorials also include software development tutorials to help users who are interested in using the SIVIC command line tools to construct analysis pipelines and develop new algorithms for the framework in an easy-to-use Docker80 development environment.
Other Software and Data Resources
Many other software packages are available either as freeware, or via licensed use agreements to address other aspects of data analysis and visualization, including: jMRUI69, TARQUIN68, and Horos66. Although the resources described in this section contain sample data, the community would benefit from the availability of a more comprehensive shared reference dataset for validating and comparing different algorithms and methodologies.
7. Final Thoughts
In the 15 years since the first demonstration of d-DNP, there has been extensive development of HP methodology for interrogating metabolism noninvasively, with future progress toward clinical translation relying upon the harmonization of techniques and finding of strategic consensus in this relatively young field. While numerous approaches exist for acquiring, reconstructing and analyzing data, it is vitally important that we leverage HP-13C MR technology through careful documentation and sharing of resources, which will facilitate investigative efforts by maintaining community engagement and focus. As part of that mission, this paper represents the experience gained from human studies conducted at UCSF, and its authors encourage further contribution from other institutions regarding methodologies of interest. The NIH-funded HMTRC will continue to lead the way in openly sharing and providing a forum for investigators to accelerate technical advancements that will impact future biological and clinical applications.
There is a range of promising directions for improvement in the acquisitions and analyses as well as workflow. Spin-echo or steady-state methods are promising for providing substantial improvements in SNR and resolution81,82. Autonomous scanning methods with integrated frequency, power and timing corrections83 have promise to provide more robust and reproducible results. There are promising new kinetic models that can remove confounding factors such as perfusion, and more robust analysis methods53. And there are unmet needs to integrate with these methods with MRI manufacturers and PACS systems that will facilitate clinical workflows.
Going forward, there must be increased consensus in the way HP-13C acquisitions, analyses, and workflows are performed, as this will be crucial for establishing standardized, comparable results and multi-center trials. This can be piloted first in small multi-center trials based on currently emerging clinical trial results, and then expanded on by consensus-building working groups.
Acknowledgements
This paper is dedicated to the memory of Sarah J. Nelson who passed away during the writing of this paper. She was a dedicated scientist and contributed greatly to the field of metabolic imaging. Her leadership and friendship will be greatly missed.
Sponsors: This work was supported by NIH Grants P41EB013598, R01CA183071, U01EB026412 and U01CA232320; and American Cancer Society Research Scholar Grant #131715-RSG-18-005-01-CCE.
Abbreviations
- AUC
area-under-curve
- CSI
chemical shift imaging
- CS
compressed sensing
- d-DNP
dissolution dynamic nuclear polarization
- EPSI
echo-planar spectroscopic imaging
- EPI
echo-planar-imaging
- HP
hyperpolarized
- MRSI
MR spectroscopic imaging
- SNR
signal-to-noise ratio
- SPSP
spectral-spatial
References
- 1.Ardenkjaer-Larsen JH, Fridlund B, Gram A, et al. Increase in signal-to-noise ratio of > 10,000 times in liquid-state NMR. Proc. Natl. Acad. Sci. 2003;100(18):10158–10163. [DOI] [PMC free article] [PubMed] [Google Scholar]
- 2.Golman K, in ‘t Zandt R, Thaning M. Real-time metabolic imaging. Proc. Natl. Acad. Sci. 2006;103(30):11270–11275. [DOI] [PMC free article] [PubMed] [Google Scholar]
- 3.Nelson SJ, Kurhanewicz J, Vigneron DB, et al. Metabolic Imaging of Patients with Prostate Cancer Using Hyperpolarized [1-C-13]Pyruvate. Sci. Transl. Med. 2013;5(198). [DOI] [PMC free article] [PubMed] [Google Scholar]
- 4.Park I, Larson PEZ, Gordon JW, et al. Development of methods and feasibility of using hyperpolarized carbon-13 imaging data for evaluating brain metabolism in patient studies. Magn. Reson. Med. 2018;80(3):864–873. [DOI] [PMC free article] [PubMed] [Google Scholar]
- 5.Mammoli D, Gordon J, Autry A, et al. Kinetic Modeling of Hyperpolarized Carbon-13 Pyruvate Metabolism in the Human Brain. IEEE Trans. Med. Imaging. 2019;0062(c):1–1. [DOI] [PMC free article] [PubMed] [Google Scholar]
- 6.Lee CY, Soliman H, Geraghty BJ, et al. Lactate topography of the human brain using hyperpolarized 13C-MRI. Neuroimage. 2019:116202. Available at: 10.1016/j.neuroimage.2019.116202. [DOI] [PubMed] [Google Scholar]
- 7.Tran M, Latifoltojar A, Neves JB, et al. First-in-human in vivo non-invasive assessment of intra-tumoral metabolic heterogeneity in renal cell carcinoma. BJR|case reports. 2019:20190003. Available at: 10.1259/bjrcr.20190003. [DOI] [PMC free article] [PubMed] [Google Scholar]
- 8.Agarwal S, Gordon J, Korn N, et al. Distinguishing metabolic signals of liver tumors from surrounding liver cells using hyperpolarized 13C MRI and Gadoxetate. In: Proceedings of the 27th Annual Meeting of the ISMRM. Montreal, Canada; 2019. [Google Scholar]
- 9.Cunningham CH, Lau JY, Chen AP, et al. Hyperpolarized 13C Metabolic MRI of the Human Heart: Initial Experience. Circ Res. 2016;119(11):1177–1182. Available at: http://www.ncbi.nlm.nih.gov/pubmed/27635086. [DOI] [PMC free article] [PubMed] [Google Scholar]
- 10.Nelson SJ, Kurhanewicz J, Vigneron DB, et al. Metabolic imaging of patients with prostate cancer using hyperpolarized [1–13C]pyruvate. Sci. Transl. Med. 2013;5(198):198ra108. Available at: http://www.pubmedcentral.nih.gov/articlerender.fcgi?artid=4201045&tool=pmcentrez&rendertype=abstract. [DOI] [PMC free article] [PubMed] [Google Scholar]
- 11.Larson PEZ, Chen H, Gordon JW, et al. Investigation of analysis methods for hyperpolarized 13C-pyruvate metabolic MRI in prostate cancer patients. 2018;(April):1–17. [DOI] [PMC free article] [PubMed] [Google Scholar]
- 12.Granlund KL, Tee S-S, Vargas HA, et al. Hyperpolarized MRI of Human Prostate Cancer Reveals Increased Lactate with Tumor Grade Driven by Monocarboxylate Transporter 1. Cell Metab. 2019. Available at: http://www.sciencedirect.com/science/article/pii/S155041311930498X. [DOI] [PMC free article] [PubMed]
- 13.Durst M, Koellisch U, Frank A, et al. Comparison of acquisition schemes for hyperpolarised 13 C imaging. 2015;(March):715–725. [DOI] [PubMed] [Google Scholar]
- 14.Chen HY, Larson PEZ, Gordon JW, et al. Technique development of 3D dynamic CS-EPSI for hyperpolarized C-13 pyruvate MR molecular imaging of human prostate cancer. Magn. Reson. Med. 2018;80(5):2062–2072. [DOI] [PMC free article] [PubMed] [Google Scholar]
- 15.Grist JT, McLean MA, Riemer F, et al. Quantifying normal human brain metabolism using hyperpolarized [1–13C] pyruvate and magnetic resonance imaging. Neuroimage. 2019. [DOI] [PMC free article] [PubMed] [Google Scholar]
- 16.McLean MA, Daniels CJ, Grist J, et al. Feasibility of metabolic imaging of hyperpolarized 13C-pyruvate in human breast cancer. 2018. [Google Scholar]
- 17.Yen YF, Kohler SJ, Chen AP, et al. Imaging Considerations for In Vivo C-13 Metabolic Mapping Using Hyperpolarized C-13-Pyruvate. Magn. Reson. Med. 2009;62(1):1–10. [DOI] [PMC free article] [PubMed] [Google Scholar]
- 18.Hu S, Lustig M, Chen AP, et al. Compressed sensing for resolution enhancement of hyperpolarized 13C flyback 3D-MRSI. J. Magn. Reson. 2008;192(2). [DOI] [PMC free article] [PubMed] [Google Scholar]
- 19.Larson PEZ, Hu S, Lustig M, et al. Fast dynamic 3D MR spectroscopic imaging with compressed sensing and multiband excitation pulses for hyperpolarized 13C studies. Magn. Reson. Med. 2011;65(3):610–619. [DOI] [PMC free article] [PubMed] [Google Scholar]
- 20.Chen HY, Larson PEZ, Bok RA, et al. Assessing Prostate Cancer Aggressiveness with Hyperpolarized Dual-Agent 3D Dynamic Imaging of Metabolism and Perfusion. Cancer Res. 2017;77(12):3207–3216. Available at: http://www.ncbi.nlm.nih.gov/pubmed/28428273. [DOI] [PMC free article] [PubMed] [Google Scholar]
- 21.Mayer D, Levin YS, Hurd RE, et al. Fast Metabolic Imaging of Systems With Sparse Spectra: Application for Hyperpolarized 13 C Imaging. 2006;937(November 2005):932–937. [DOI] [PubMed] [Google Scholar]
- 22.Chen HY, Gordon JW, Bok RA, et al. Pulse sequence considerations for quantification of pyruvate-to-lactate conversion k PL in hyperpolarized 13 C imaging. NMR Biomed. 2019;(April 2018):1–14. [DOI] [PMC free article] [PubMed] [Google Scholar]
- 23.Chen AP, Tropp J, Hurd RE, et al. In vivo hyperpolarized 13C MR spectroscopic imaging with 1H decoupling. J. Magn. Reson. 2009;197(1):100–106. Available at: 10.1016/j.jmr.2008.12.004. [DOI] [PMC free article] [PubMed] [Google Scholar]
- 24.Kohler SJ, Yen Y, Wolber J, et al. In vivo 13carbon metabolic imaging at 3T with hyperpolarized 13C-1-pyruvate. Magn. Reson. Med. 2007;58(1):65–69. [DOI] [PubMed] [Google Scholar]
- 25.Larson PE, Kerr AB, Chen AP, et al. Multiband excitation pulses for hyperpolarized 13C dynamic chemical-shift imaging. J Magn Reson. 2008;194(1):121–127. Available at: http://www.ncbi.nlm.nih.gov/pubmed/18619875. [DOI] [PMC free article] [PubMed] [Google Scholar]
- 26.Sigfridsson A, Weiss K, Wissmann L, et al. Hybrid multiband excitation multiecho acquisition for hyperpolarized 13C spectroscopic imaging. Magn. Reson. Med. 2015;73(5):1713–1717. [DOI] [PubMed] [Google Scholar]
- 27.Cunningham CH, Chen AP, Lustig M, et al. Pulse sequence for dynamic volumetric imaging of hyperpolarized metabolic products. J. Magn. Reson. 2008;193(1):139–146. [DOI] [PMC free article] [PubMed] [Google Scholar]
- 28.Gordon JW, Vigneron DB, Larson PEZ. Development of a symmetric echo planar imaging framework for clinical translation of rapid dynamic hyperpolarized 13C imaging. Magn. Reson. Med. 2017;77(2):826–832. [DOI] [PMC free article] [PubMed] [Google Scholar]
- 29.Leupold J, Månsson S, Petersson JS, et al. Fast multiecho balanced SSFP metabolite mapping of 1H and hyperpolarized 13C compounds. Magn Reson Mater Phy. 2009;22:251. [DOI] [PubMed] [Google Scholar]
- 30.Varma G, Wang X, Vinogradov E, et al. Selective spectroscopic imaging of hyperpolarized pyruvate and its metabolites using a single-echo variable phase advance method in balanced SSFP. Magn. Reson. Med. 2016;76(4):1102–1115. [DOI] [PMC free article] [PubMed] [Google Scholar]
- 31.Von Morze C, Larson PEZ, Hu S, et al. Investigating tumor perfusion and metabolism using multiple hyperpolarized 13C compounds: HP001, pyruvate and urea. Magn. Reson. Imaging. 2012;30(3):305–311. Available at: 10.1016/j.mri.2011.09.026. [DOI] [PMC free article] [PubMed] [Google Scholar]
- 32.Wiesinger F, Weidl E, Menzel MI, et al. IDEAL spiral CSI for dynamic metabolic MR imaging of hyperpolarized [1– 13C]pyruvate. Magn. Reson. Med. 2012;68(1):8–16. [DOI] [PubMed] [Google Scholar]
- 33.Lau AZ, Miller JJ, Robson MD, et al. Simultaneous assessment of cardiac metabolism and perfusion using copolarized [1–13C]pyruvate and 13C-urea. Magn. Reson. Med. 2017;77(1):151–158. [DOI] [PMC free article] [PubMed] [Google Scholar]
- 34.Gordon JW, Niles DJ, Fain SB, et al. Joint spatial-spectral reconstruction and k-t spirals for accelerated 2D spatial/1D spectral imaging of 13 C dynamics. Magn. Reson. Med. 2014;71(4):1435–1445. [DOI] [PMC free article] [PubMed] [Google Scholar]
- 35.Cunningham CH, Dominguez Viqueira W, Hurd RE, et al. Frequency correction method for improved spatial correlation of hyperpolarized 13C metabolites and anatomy. NMR Biomed. 2014;27(2):212–218. [DOI] [PubMed] [Google Scholar]
- 36.Wang J, Wright AJ, Hesketh RL, et al. A referenceless Nyquist ghost correction workflow for echo planar imaging of hyperpolarized [1–13C]pyruvate and [1–13C]lactate. NMR Biomed. 2018;31(2):e3866. [DOI] [PMC free article] [PubMed] [Google Scholar]
- 37.Xing Y, Reed GD, Pauly JM, et al. Optimal variable flip angle schemes for dynamic acquisition of exchanging hyperpolarized substrates. J. Magn. Reson. 2013;234:75–81. Available at: 10.1016/j.jmr.2013.06.003. [DOI] [PMC free article] [PubMed] [Google Scholar]
- 38.Maidens J, Larson PEZ, Arcak M. Optimal Experiment Design for Physiological Parameter Estimation Using Hyperpolarized Carbon-13 Magnetic Resonance Imaging. Proc. Am. Control Conf. Chicago, IL, 2015. FrC11.1. [Google Scholar]
- 39.Walker CM, Fuentes D, Larson PEZ, et al. Effects of excitation angle strategy on quantitative analysis of hyperpolarized pyruvate. Magn. Reson. Med. 2019;81(6):3754–3762. [DOI] [PMC free article] [PubMed] [Google Scholar]
- 40.Chen H-Y, Larson P, Gordon JW, et al. Phase II Clinical Hyperpolarized 13C 3D-Dynamic Metabolic Imaging of Prostate Cancer Using a B1-Insensitive Variable Flip Angle Design. Proc. 25th Annu. Meet. ISMRM, Honolulu, Hawaii, 2017. Abstr. 0725. [Google Scholar]
- 41.Inati SJ, Naegele JD, Zwart NR, et al. ISMRM Raw data format: A proposed standard for MRI raw datasets. Magn. Reson. Med. 2017;77(1):411–421. [DOI] [PMC free article] [PubMed] [Google Scholar]
- 42.Olson MP, Crane JC, Larson P, et al. A Vendor-Agnostic MRSI Acquisition and Reconstruction XML Descriptor Format. In: ISMRM 25th annual meeting.; 2017. Available at: http://dev.ismrm.org/2017/5533.html. [Google Scholar]
- 43.Crane JC, Olson MP, Li Y, et al. Standardized Parameterization of Echo-Planar Compressed Sensing MRSI Acquisition and Reconstruction. In: Proc. Intl. Soc. Mag. Reson. Med; 2018. [Google Scholar]
- 44.SIVIC. SIVIC Web Portal. Available at: https://sourceforge.net/projects/sivic/. Accessed August 29, 2018.
- 45.Jin KH, Lee D, Ye JC. A General Framework for Compressed Sensing and Parallel MRI Using Annihilating Filter Based Low-Rank Hankel Matrix. Ieee Trans. Comput. Imaging. 2016;2(4):480–495. [Google Scholar]
- 46.Hansen MS, Kellman P. Image reconstruction: an overview for clinicians. J Magn Reson Imaging. 2015;41(3):573–585. Available at: http://www.ncbi.nlm.nih.gov/pubmed/24962650. [DOI] [PMC free article] [PubMed] [Google Scholar]
- 47.Vareth M, Lupo J, Larson P, et al. A comparison of coil combination strategies in 3D multi-channel MRSI reconstruction for patients with brain tumors. NMR Biomed. 2018;31(11):e3929. Available at: http://www.ncbi.nlm.nih.gov/pubmed/30168205. [DOI] [PMC free article] [PubMed] [Google Scholar]
- 48.Gordon JW, Chen HY, Autry A, et al. Translation of Carbon-13 EPI for hyperpolarized MR molecular imaging of prostate and brain cancer patients. Magn. Reson. Med. 2019;81(4):2702–2709. [DOI] [PMC free article] [PubMed] [Google Scholar]
- 49.Zhu Z, Zhu X, Ohliger MA, et al. Coil combination methods for multi-channel hyperpolarized 13C imaging data from human studies. J. Magn. Reson. 2019;301:73–79. Available at: https://www.sciencedirect.com/science/article/abs/pii/S1090780719300217. Accessed January 15, 2020. [DOI] [PMC free article] [PubMed] [Google Scholar]
- 50.Zhu Z, Zhu X, Ohliger M, et al. Coil Combination Methods for 16-channel Hyperpolarized 13C Spectroscopic Imaging Studies of Liver Metastases Patients. Proc. 27th Annu. Meet. ISMRM, Paris, Fr. 2018. Abstr. 3881. [Google Scholar]
- 51.McKenzie CA, Yeh EN, Ohliger MA, et al. Self-calibrating parallel imaging with automatic coil sensitivity extraction. Magn. Reson. Med. 2002;47(3):529–538. [DOI] [PubMed] [Google Scholar]
- 52.Maidens J, Gordon JW, Arcak M, et al. Optimizing Flip Angles for Metabolic Rate Estimation in Hyperpolarized Carbon-13 MRI. IEEE Trans Med Imaging. 2016;35(11):2403–2412. Available at: http://www.ncbi.nlm.nih.gov/pubmed/27249825. [DOI] [PMC free article] [PubMed] [Google Scholar]
- 53.Daniels CJ, Mclean MA, Schulte RF, et al. A comparison of quantitative methods for clinical imaging with hyperpolarized 13C-pyruvate. NMR Biomed. 2016;29(4):387–399. [DOI] [PMC free article] [PubMed] [Google Scholar]
- 54.Hill DK, Orton MR, Mariotti E, et al. Model Free Approach to Kinetic Analysis of Real-Time Hyperpolarized 13C Magnetic Resonance Spectroscopy Data. PLoS One. 2013;8(9):1–9. [DOI] [PMC free article] [PubMed] [Google Scholar]
- 55.Kazan SM, Reynolds S, Kennerley A, et al. Kinetic Modeling of Hyperpolarized 13 C Pyruvate Metabolism in Tumors Using a Measured Arterial Input Function. 2013;953:943–953. [DOI] [PubMed] [Google Scholar]
- 56.Bankson JA, Walker CM, Ramirez MS, et al. Kinetic Modeling and Constrained Reconstruction of Hyperpolarized [ 1– 13 C ] -Pyruvate Offers Improved Metabolic Imaging of Tumors. 2015;75(4):4708–4718. [DOI] [PMC free article] [PubMed] [Google Scholar]
- 57.Larson P Hyperpolarized-MRI-Toolbox. Available at: http://github.com/LarsonLab/Hyperpolarized-MRI-Toolbox. Accessed September 20, 2005.
- 58.Crane JC, Olson MP, Nelson SJ. SIVIC: Open-Source, Standards-Based Software for DICOM MR Spectroscopy Workflows. Int. J. Biomed. Imaging. 2013;2013:169526. Available at: http://www.pubmedcentral.nih.gov/articlerender.fcgi?artid=3732592&tool=pmcentrez&rendertype=abstract. [DOI] [PMC free article] [PubMed]
- 59.Miloushev VZ, Granlund KL, Boltyanskiy R, et al. Metabolic Imaging of the Human Brain with Hyperpolarized (13)C Pyruvate Demonstrates (13)C Lactate Production in Brain Tumor Patients. Cancer Res. 2018;78(14):3755–3760. Available at: http://www.ncbi.nlm.nih.gov/pubmed/29769199. [DOI] [PMC free article] [PubMed] [Google Scholar]
- 60.Park I, Larson PEZ, Gordon JW, et al. Development of methods and feasibility of using hyperpolarized carbon-13 imaging data for evaluating brain metabolism in patient studies. Magn. Reson. Med. 2018;00(November 2017). [DOI] [PMC free article] [PubMed] [Google Scholar]
- 61.Li Y, Autry A, Gordon J, et al. Evaluating patients with Glioma using Multi-modal hyperpolarized C-13 and H-1 Metabolic Imaging Yan Li, Adam Autry, Jeremy Gordon, Ilwoo Park, Dan Vigneron, Susan Chang and Sarah Nelson. 6:1–5. [Google Scholar]
- 62.Crane JC, Li Y, Bs MPO, et al. Automated Prescription and Reconstruction of Brain MR Spectroscopy Data for Rapid Integration into the Clinical Workflow. Neurol. Disord. Epilepsy. 2017. [Google Scholar]
- 63.Nelson SJ, Kadambi AK, Park I, et al. Association of early changes in 1 H MRSI parameters with survival for patients with newly diagnosed glioblastoma receiving a multimodality treatment regimen. Neuro. Oncol. 2016;(February):now159. Available at: http://neuro-oncology.oxfordjournals.org/lookup/doi/10.1093/neuonc/now159. [DOI] [PMC free article] [PubMed] [Google Scholar]
- 64.Behr SC, Villanueva-Meyer JE, Li Y, et al. Targeting iron metabolism in high-grade glioma with 68Ga-citrate PET/MR. JCI Insight. 2018;3(21). Available at: https://www.ncbi.nlm.nih.gov/pubmed/30385712. [DOI] [PMC free article] [PubMed] [Google Scholar]
- 65.OsiriX. OsiriX Available at: https://www.osirix-viewer.com/. Accessed August 29, 2018.
- 66.HOROS. HOROS Available at: https://horosproject.org/. Accessed August 29, 2018.
- 67.Wilson M, Reynolds G, Kauppinen R a, et al. A constrained least-squares approach to the automated quantitation of in vivo 1H magnetic resonance spectroscopy data. Magn. Reson. Med. 2011;65(1):1–12. Available at: http://www.ncbi.nlm.nih.gov/pubmed/20878762. Accessed March 14, 2013. [DOI] [PubMed] [Google Scholar]
- 68.TARQUIN. TARQUIN. 2018. Available at: http://tarquin.sourceforge.net/. Accessed August 29, 2018.
- 69.JMRUI. jMRUI Available at: http://www.jmrui.eu/welcome-to-the-new-mrui-website/. Accessed August 29, 2018.
- 70.Philips. DICOM Conformance Statement Available at: http://incenter.medical.philips.com/doclib/enc/fetch/2000/4504/577242/577256/588723/5144873/5144488/5144982/DICOM_Conformance_Statement_MR_Release_5_Systems.pdf%3Fnodeid%3D10638405%26vernum%3D-2. Accessed August 29, 2018.
- 71.Larson PEZ. Hyperplarized-MRI-Toolbox Prostate EPSI Demo. Available at: https://github.com/LarsonLab/hyperpolarized-mri-toolbox/tree/master/recon/prostatedemo. Accessed September 20, 2006.
- 72.Larson PEZ. Hyperpolarized-MRI-Toolbox EPI Demo. 2019. Available at: https://github.com/LarsonLab/hyperpolarized-mri-toolbox/tree/master/recon/EPIdemo. Accessed September 20, 2006. [Google Scholar]
- 73.Larson P EPI Recon Notebook. 2019. [Google Scholar]
- 74.Zhu Z, Zhu X, Ohliger MA, et al. Coil combination methods for multi-channel hyperpolarized 13 C imaging data from human studies. J. Magn. Reson. 2019;301:73–79. Available at: 10.1016/j.jmr.2019.01.015. [DOI] [PMC free article] [PubMed] [Google Scholar]
- 75.SIVIC. HMTRC 2019 Symposium SIVIC tutorial. 2019.
- 76.HMTRC. 2019 HMTRC 13C Workshop SIVIC Analysis Tutorial Sample Data. Available at: https://sourceforge.net/projects/sivic/files/sample_data/HMTRC_2018/hmtrc_2018.zip/download. Accessed September 20, 2006.
- 77.SIVIC. SIVIC source code Available at: https://github.com/SIVICLab/sivic. Accessed January 1, 2017.
- 78.HMTRC. Hyperpolarized MRI Technology Resource Center Available at: https://radiology.ucsf.edu/research/labs/hyperpolarized-mri-tech. Accessed September 20, 2005.
- 79.Crane JC, Olson MP, Nelson SJ. SIVIC Tutorials. Available at: https://sourceforge.net/p/sivic/sivicwiki/Tutorials/. Accessed September 20, 2005.
- 80.Docker. Docker. [Google Scholar]
- 81.Wang J, Hesketh RL, Wright AJ, et al. Hyperpolarized 13 C spectroscopic imaging using single-shot 3D sequences with unpaired adiabatic refocusing pulses. NMR Biomed. 2018;31(11):1–12. [DOI] [PMC free article] [PubMed] [Google Scholar]
- 82.Milshteyn E, von Morze C, Gordon JW, et al. High spatiotemporal resolution bSSFP imaging of hyperpolarized [1–13C]pyruvate and [1–13C]lactate with spectral suppression of alanine and pyruvate-hydrate. Magn. Reson. Med. 2018;80(3):1048–1060. [DOI] [PMC free article] [PubMed] [Google Scholar]
- 83.Tang S, Milshteyn E, Reed G, et al. A regional bolus tracking and real-time B1 calibration method for hyperpolarized 13C MRI. Magn. Reson. Med. 2019;81(2):839–851. [DOI] [PMC free article] [PubMed] [Google Scholar]