

Abstract
Purpose:
One of the challenges of adoptive T cell therapy is the development of immune mediated toxicities including cytokine release syndrome (CRS) and neurotoxicity (NT). We aimed to identify factors that place patients at high risk of severe toxicity or treatment related death in a cohort of 75 patients with large B cell lymphoma treated with a standard of care CD19 targeted CAR T cell product (axicabtagene ciloleucel).
Experimental Design:
Serum cytokine and catecholamine levels were measured prior to lymphodepleting chemotherapy, on the day of CAR T infusion and daily thereafter while patients remained hospitalized. Tumor biopsies were taken within one month prior to CAR T infusion for evaluation of gene expression.
Results:
We identified an association between pre-treatment levels of interleukin 6 and life-threatening CRS and NT. Since the risk of toxicity was related to pre-treatment factors, we hypothesized that the tumor microenvironment (TME) may influence CAR T cell toxicity. In pre-treatment patient tumor biopsies, gene expression of myeloid markers was associated with higher toxicity.
Conclusions:
These results suggest that a pro-inflammatory state and an unfavorable TME pre-emptively put patients at risk for toxicity after CAR T cell therapy. Tailoring toxicity management strategies to patient risk may reduce morbidity and mortality.
Keywords: Cytokine release syndrome, neurotoxicity, cytokines, Chimeric Antigen Receptor Therapy, Diffuse Large B Cell Lymphoma
Introduction
Two anti-CD19 CAR T cell products, axicabtagene ciloleucel (axi-cel) and tisangenlecleucel are approved by the Food and Drug Administration (FDA) on the basis of clinical trials that report durable remissions in approximately 40% of patients with relapsed or refractory large B cell lymphoma (R/R LBCL) (1,2). Despite clinical activity in a poor prognosis LBCL population, the wide spread utilization of these products is limited by unique toxicities caused by the en-masse activation of tumor-reactive T cells inducing a large release of cytokines causing cardiovascular, pulmonary, and neurologic toxicities (1,3–7). These toxicities, termed cytokine release syndrome (CRS) and/or neurotoxicity (NT), are a major source of morbidity and, in some patients, mortality (1–3).
To date, animal models have demonstrated that the severity of immune toxicities is associated with interleukin 6 (IL6), IL1, and nitric oxide produced by macrophages (8–11). However, there remains a need to validate these observations and use accessible laboratory tests to diagnose, monitor, and/or prognosticate toxicities. We and others have identified the utility of laboratory measurements of C reactive protein (CRP) and ferritin in the diagnosing and/or monitoring of CRS (12–16). Furthermore, several cytokines have been associated with severe CRS and/or NT, including IL1β, IL6, IL15, angiopoietin 1&2, and granulocyte monocyte-colony stimulating factor (GM-CSF) supporting the development of targeted therapies to mitigate these toxicities (1,12,13,17,18).
Here, we report findings of serum and tumor analysis of 75 patients with aggressive R/R LBCL treated at our institution with axi-cel. We correlated cytokines and other serum markers with the development of toxicities. We found that clinical outcomes, including objective responses and toxicity, are similar to the ZUMA-1 registrational trial even though the majority of the patients we treated would not have been eligible (1,5). Further, we identified several cytokines and laboratory markers which correlate with severe immune mediated toxicities as previously reported in patients treated under the pivotal clinical trials (1,3,15,16,19). We observed that a subset of patients with elevated IL6 levels prior to lymphodepleting chemotherapy are at high-risk for death from CRS. These patients experienced significant toxicities despite management with standard early cytokine-blockade and/or steroids as per guidelines (4,6). By performing gene expression studies on baseline tumor tissue samples, we describe immune pathways that correlate with toxicities. Our work suggests that recognition of an unfavorable tumor microenvironment and baseline pro-inflammatory state can identify patients who are at highest risk of developing severe toxicity after CAR T cell therapy.
Materials and Methods
Specimen collection protocol
This is a sample study to evaluate factors associated with the development of immune mediated toxicities in patients treated with axi-cel at H. Lee Moffitt Cancer Center. The study is open for all patients treated with commercial axi-cel at our institution. The institutional review board reviewed and approved the protocol. All clinical investigation was conducted according to the Declaration of Helsinki principles. All patients provided written informed consent. A total of 75 patients were enrolled and underwent leukapheresis and are included in this study. Patients were lymphodepleted with fludarabine 30 mg/m2/d x 3 days and cyclophosphamide 500 mg/m2/d x 3 days (1,5). Patients received bridging treatment between the time of leukapheresis and lymphodepleting chemotherapy at the discretion of the treating physician (1,5).
All patients had histologically confirmed Large B Cell Lymphoma (LBCL) or transformed indolent lymphoma. Seventy patients had R/R disease following two lines of systemic therapy and met the FDA label for the administration of commercial axi-cel. Five patients also met eligibility criteria having failed two or more lines of systemic therapy and were enrolled in ZUMA-9 which is an expanded access study for patients who did not meet commercial release specifications (NCT03153462).
Toxicity grading and management
CRS was defined and graded using the ASTCT consensus grading guidelines (4). While some patients included in this cohort were enrolled prior to the publication of the ASTCT consensus grading guidelines (4), medical records were reviewed and patients were graded retrospectively. Severe CRS was defined as grade ≥ 3 toxicity. The institutional management guidelines were adapted from the CAR-T-cell-therapy-associated TOXicity (CARTOX) Working Group guidelines and are included in Figure S1.
During the sample collection study, guidelines for the terminology and grading of neurologic toxicity changed from Common Terminology Criteria for Adverse Events (CTCAE) v4.03 to CAR T cell encephalopathy syndrome (CRES) and most recently to immune effector cell-associated neurotoxicity syndrome (ICANS).To simply the terminology, we used the general term neurologic toxicity to encompass all neurologic toxicity related to the administration of axi-cel. For the majority of patients (n=49), neurologic toxicity was graded using the CARTOX guidelines (6). The remainder of patients had a daily ICANS assessment while hospitalized (n=25) and were graded using the ASTCT guidelines (4). One patient was graded according to CTCAE v4.03. Severe toxicity was defined as grade ≥ 3 NT. Management NT was per institutional guidelines, which were adapted from the CARTOX working group and are included in Figure S2 (6).
Clinical response
Patients underwent response assessment using standard of care positron emission tomography (PET) and/or computed tomography (CT) scans at baseline prior to lymphodepleting chemotherapy. To evaluate for response, repeat scans were completed at approximately 4 weeks, 3 months, 6 months and 12 months following axi-cel infusion and as clinically indicated thereafter. Tumor response was determined by the treating physician per Lugano 2014 classification (20). The objective response rate at day 90 was defined as either complete remission (CR) or partial remission (PR) by Lugano classification and does not reflect ongoing best response. Progression and/or relapse were determined by the treating physician according to radiographic or clinical criteria and confirmed by biopsy when feasible.
Serum studies
Serum samples were collected at baseline (within 30 days of lymphodepleting chemotherapy), and then daily starting the day of axi-cel infusion until discharge or up to day 60, whichever occurred first. Fifty-two patients had samples available for baseline analysis. For the majority of patients (n=38), baseline samples were collected within one week of lymphodepleting chemotherapy. The remainder of baseline samples (n=14) were collected at the time of apheresis. Peak levels were determined as the highest levels starting at day one post infusion until last day of hospitalization. Cytokines analyzed include GM-CSF, IL1β, IL2, IL6, IL15, IFNγ, TNFα, and Angiopoietin 1&2. Serum was analyzed using the Ella automated simple plex immunoassay system (ProteinSimple). GM-CSF samples were not available for baseline analysis. A two-fold dilution of serum sample was loaded at 50μl per well of a Simple Plex cartridge testing four analytes at a time. Each cytokine was tested in triplicate with average values reported in pg/mL. Using patient serum samples that were previously analyzed with the Luminex and reported by Park et al, we confirmed the reliability of cytokine analysis by the Ella (19). We demonstrated that cytokine values(IFNγ, TNFα, IL6) measured on the Ella correlated strongly with cytokine values measured on the Luminex (Figure S3A–D). The Department of Pathology and Laboratory Medicine at H. Lee Moffitt Cancer Center used standard clinical tests to measure serum CRP and ferritin levels at baseline, on the day of CAR T infusion and daily while patients were hospitalized. Serum samples for catecholamine analysis were collected at baseline and then daily starting the day of axi-cel infusion in thirty patients. Catecholamine measurements were completed as described by Staedtke et al (21).
Genomics
Tumor biopsies were taken within 1 month prior to axi-cel infusion and reviewed by a hematopathologist for tumor content. RNA was extracted from retrospective formalin-fixed paraffin-embedded material (n=4) or prospectively frozen material (n=32). To increase sample size, seven patient tumor samples were collected outside of the 75-patient cohort. All patients signed informed written consent. RNA expression was measured by the Nanostring IO360 panel consisting of 770 genes found in the TME in cancer or RNAseq as indicated at a minimum depth of 80M reads per sample. Nanostring analysis used nSolver to identify cell types, pathway scores and differential gene expression between groups. All Nanostring and RNA-Seq data has been deposited to the Gene Expression Omnibus data repository (GSE153439).
Nucleic acid-sequencing libraries were prepared using the NuGen FFPE RNA-Seq Multiplex System (Tecan US, Inc., Morrisville, NC). Briefly, 50 ng of DNase treated RNA was used to generate cDNA and a strand-specific library following the manufacturer’s protocol. Library molecules containing ribosomal RNA sequences were depleted using the NuGen AnyDeplete probe-based enzymatic process. The final libraries were assessed for quality on the Agilent TapeStation (Agilent Technologies, Inc., Wilmington DE), and quantitative RT-PCR for library quantification was performed using the Kapa Library Quantification Kit (Roche Sequencing, Pleasanton, CA). The libraries were sequenced on the Illumina NextSeq 500 sequencer with a 75-base paired-end run in order to generate 80-100 million read pairs per sample.
Read adapters were detected using BBMerge (v37.88) (22) and subsequently removed with cutadapt (v1.8.1) (23). Processed raw reads were then aligned to human genome HG19 using STAR (v2.5.3a) (24). Gene expression was evaluated as read count at gene level with HTSeq (v0.6.1) and Gencode gene model (25). Gene express data were then normalized and differential expression between experimental groups were evaluated using DEseq2 (26). Gene set enrichment analysis (GESA) for RNA-seq expression profiles was performed using the Broad GSEA software version 3.0 (http://software.broadinstitute.org/gsea) with default settings and the phenotype label as the permutation type. The Molecular Signatures Database (MSigDB) version 6.2 gene set collections were evaluated in the GSEA.
Statistical analysis
Comparisons of cytokine levels (log2 transformed) between different NT and CRS patient groups were performed using univariable logistic regression as well as two-tailed Wilcoxon rank sum test. Potential confounders were adjusted using multivariable logistic regression analysis. Cumulative incidences curves stratified by cytokine levels were estimated using the ‘cmprsk’ package in R. Spearman’s rank order correlation was used to measure the strength of the association between two variables. P values ≤0.05 were considered significant, unless otherwise indicated. Statistical analyses were carried out in R and Prism.
Results
Patient Characteristics
Seventy-five patients with LBCL who received lymphodepleting chemotherapy followed by infusion of axi-cel are included in this study. Baseline patient characteristics are summarized in Table 1 (1,5). The median follow up time was 11 months at the time of data cut off, September 30th 2019. Median age was 63 years (range 23-79 years). They received a median of three prior lines of therapy (range 2-8), and a subset had relapsed or progressed after autologous stem cell transplant (n=11). Forty-eight patients (64%) required bridging therapy between the time of leukapheresis and lymphodepleting chemotherapy. The majority of patients (n=26) received bridging chemotherapy. Ten patients received radiation as part of bridging therapy. Eleven patients received high dose steroids alone. Thirty-six patients (48%) would not have been eligible for enrollment in the ZUMA-1 trial based upon disease or co-morbidity factors at the time of apheresis. Factors that excluded patients from ZUMA-1 include renal insufficiency, decreased ejection fraction ≤ 50%, platelet count ≤75,000 cells/microL, symptomatic pleural effusions, chronic hepatitis B or C, prior history of CNS disease, prior allogeneic transplant and venous thromboembolism within 6 months.
Table 1:
Patient Characteristics
| Patient Characteristics | N=75 |
|---|---|
| Age - Median (Range) years | 63 (23-79) |
| Male Sex – no. (%) | 50 (67) |
| Histology – no. (%) de Novo DLBCL Transformed Indolent lymphoma |
50 (67) 25 (33) |
| Bulky Disease ≥10cm – no. (%) | 12 (16) |
| Ann Arbor Stage III/IV – no. (%) | 62 (83) |
| IPI ≥ 3 at apheresis – no. (%) | 51 (69) |
| Lines of therapy ≥ 3 — no. (%) | 46 (61) |
| Bridging therapy – no. (%) Chemotherapy Radiation +/− chemotherapy Steroids only Other |
48 (64) 26 (54) 10 (21) 11 (23) 6 (12.5) |
| Prior autologous HSCT– no. (%) | 11 (19) |
| Not eligible for ZUMA-1– no. (%) Renal insufficiency VTE within 6 months Thrombocytopenia Symptomatic effusion Other |
36 (48) 6 (17) 5 (14) 5 (14) 3 (8) 17 (47) |
DLBCL- Diffuse Large B Cell lymphoma; HSCT- Hematopoietic Stem Cell Transplantation ; IPI- International Prognostic Index; VTE- Venous Thromboembolism.
Clinical characteristics, response and toxicity assessment
Univariate (Table S1) logistic regression was conducted to test the association between baseline characteristics and severe CRS and NT. None of the baseline factors analyzed were significantly associated with either severe CRS or NT. In a multivariable logistic regression model (Table S2), no baseline patient or tumor factors including age, ECOG at apheresis, stage, nor bridging chemotherapy were associated with severe CRS or NT.
Sixty-eight patients were evaluated for response at day 90. The overall ongoing response rate at day 90 after CAR T cell infusion was 53%, with 29 (42.6%) patients in CR at day 90 (Table 2). Most patients developed CRS (n=72) with 16% developing severe (grade >3) CRS. Of those who had CRS, thirty-one patients (43%) had a fever within 24 hours of axi-cel infusion. Fifty patients (67%) developed NT with an incidence of severe NT of 31%. The median time to maximum toxicities was 4 and 6 days respectively for CRS and NT. Forty-three patients (57%) were treated with tocilizumab and forty-one (55%) required steroids for the management of toxicities. Four patients (5%) died directly as a result of, or in part attributable to, severe CAR T mediated toxicities. No patients died as a result of severe NT. Nine patients (12%) died within 90 days as a result of disease progression.
Table 2:
Clinical Endpoints
| N=75 | |
|---|---|
|
CRS Median time to CRS Median time to max CRS CRS all grades – no. (%) Grade ≥ 3 CRS – no. (%) Grade 5 CRS—no. (%) Use of tocilizumab – no. (%) Use of steroids – no. (%) |
2 days 4 days 72 (96) 12 (16) 3 (4) 43 (57) 41 (55) |
|
Neurotoxicity Median time to NT Median time to max NT NT all grades– no. (%) Grade ≥3 NT– no. (%) |
5 days 6 days 50 (67) 23 (31) |
|
D90 Response (N=68) CR + PR –no. (%) Complete Response – no. (%) NRM – no. (%) Disease related mortality– no. (%) |
36 (53) 29 (43) 4 (6) 9 (13) |
Cytokine Release Syndrome (CRS) and Neurotoxicity (NT) were graded prospectively. CRS was defined and graded using the ASTCT grading guidelines(4). Neurologic toxicity was graded using the CAR T cell therapy associated (CARTOX) working group guidelines.(6) Tumor response was determined by the treating physician per Lugano 2014 classification(20). CR- Complete Response; PR- Partial Response; NRM- non-relapse mortality.
Laboratory measurements associated with toxicity in patients treated with axi-cel
Univariate logistic regression was used to test the association of each cytokine to toxicity for baseline, day zero, and peak. Baseline levels of IL6 (p=0.013), ANG2/ANG1(p=0.0056), ANG2 (p=0.0190), and ferritin (p=0.0491) were associated with severe NT (Figure 1A–D). Day 0 levels of IL15 (p=0.0407) and ANG2/ANG1 (p=0.0248) were also associated with severe NT. Peak levels of IL6 (0.0128), ANG2/ANG1 (p=0.0016), IFNγ (p=0.0064),and IL15 (0.0006) were associated with severe NT (Figure 1E–H). Lower peak levels of ANG1 were associated with severe NT (Figure 1I) (p=0.028). While it did not meet statistical significance, there was a trend towards significant of peak levels of GM-CSF and severe NT as shown in Figure 1J (p=0.051). In a multivariate analysis (Table S2), ANG2/ANG1 was the only baseline factor or cytokine significant for severe NT (p=0.0154).
Fig. 1. Serum markers associated with severe NT.
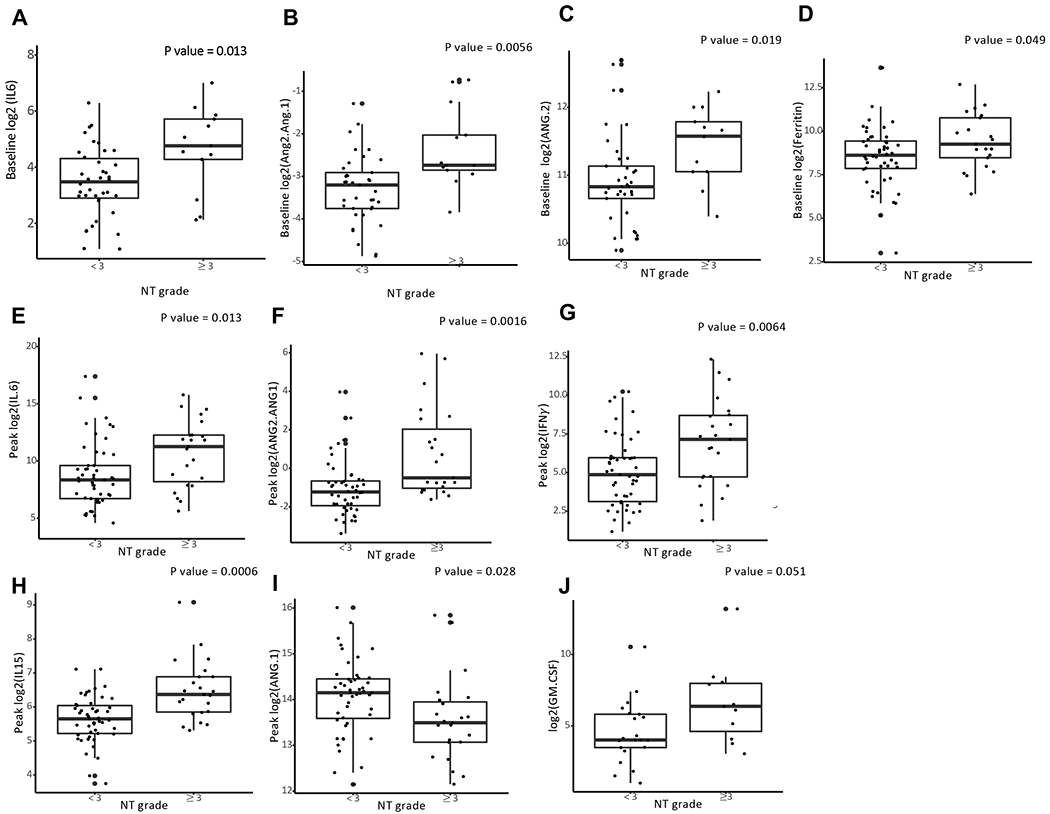
Patients receiving standard of care CD19 CAR T cell therapy (axicabtagene ciloleucel) for large B cell lymphoma had prospective collection of serum for measurement of cytokine levels using a point-of-care device (Ella Simple Plex - Protein Simple). A. Baseline (n=52) levels of IL6 indicates samples drawn prior the start of lymphodepleting chemotherapy. B-C. Baseline (n=51) levels of ANG1 and ANG2/ANG1 drawn prior the start of lymphodepleting chemotherapy. Cytokines were measuring using Ella Simple Plex - Protein Simple as described in the methods D. Baseline levels of ferritin (n=69) collected prior to start of lymphodepleting chemotherapy. Ferritin(ng/dL) measuring using standard lab equipment (Roche Cobas). E-I Max (n=75)indicates the highest level of the cytokine measured during daily sampling in the first 30 days after CAR T therapy fusion. P value calculated using univariate logistic regression. Logarithm transformation is used (A-J) to allow visualization of data points on the graphs.
Levels of IL6 (p=0.046) were the only baseline value associated with severe CRS ( Figure 2A). Serum peak levels of IL15 (p=0.0285), ANG2/ANG1 (p=0.0003), IFNγ (p=0.0011), IL6 (p=0.0003), TNFα(p=0.0082), and GM-CSF (0.0172) were higher in patients who had, or went on to develop, severe CRS (Figure 2B–G). Using spearman’s correlation coefficient, baseline IL6 levels correlated strongly with day 0 IL6 levels (Figure 4SA) (r=0.71) and less so with peak IL6 levels (Figure 4SB) ( r=0.46). We recently identified a role for catecholamine secretion by CAR T cells and myeloid cells in animal models of CRS and wanted to determine if serum catecholamine levels were higher in patients with severe toxicity (21). Using univariate logistic regression, higher peak levels of noradrenaline (NAD) were associated with grade ≥3 CRS (p= 0.0234), but not with severe NT (Figure 2H). Using patient case examples of grades 0, 1, 2, and 4 CRS, we observe NAD levels increasing in patients with more severe toxicity (Figure S5A–D).
Fig. 2. Serum markers associated with severe CRS.
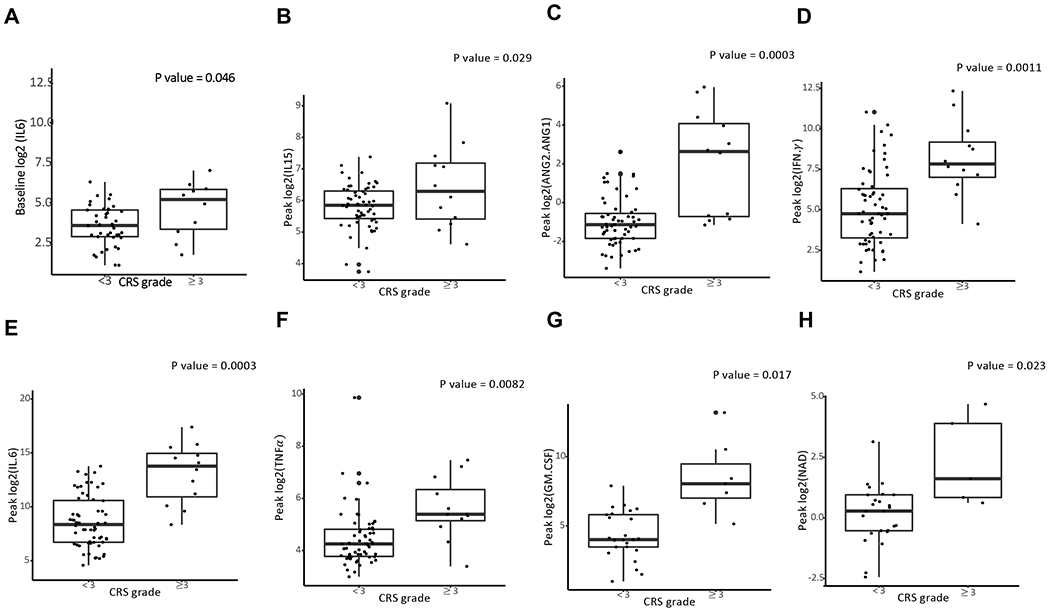
A. Baseline levels of IL6 (n=52) associate with severe CRS. B-G Max (n=75) indicates the highest level of the cytokine measured during daily sampling in the first 30 days after CAR T therapy fusion. P value calculated using univariate logistic regression. H. Samples (n=30) were analyzed for catecholamine levels (noradrenaline, NAD) as described (Staedtke et al. Nature 2018). Logarithm transformation is used (A-H) to allow visualization of data points on the graphs.
Baseline elevated levels of IL6 correlate with severe CRS and NT
While levels of IL6 following CAR T cell infusion have been consistently associated with CRS and/or NT, there is limited data on the association between baseline IL6 and toxicity (1,3,10,27,28). The association between IL6 and severe immune mediated toxicity may be mediated by myeloid cells (29,30). In a multivariable model (Table S2), IL6 was the only baseline value that was associated with severe CRS (p=0.03898). Patient characteristics comparing the subset of patients with baseline elevated IL6 demonstrates that these patients all had stage III/IV disease and required bridging chemotherapy, which was not allowed in ZUMA-1 (Table S3) (1,5). These patients appeared to have particularly aggressive lymphoma. Median onset to CRS and NT was earlier than for the overall cohort at one and four days, respectively. We observed 89% of patients who had IL6 levels ≥40pg/mL died within 90 days of CAR-T infusion with 56% developing grade 3 or higher CRS (Table S4). Figure 3 demonstrates a cumulative incidence of death in patients with baseline IL6 levels ≥40pg/mL vs. those with baseline levels IL6 levels <40pg/mL
Fig. 3. Cumulative incidence of events stratified by IL6 levels.
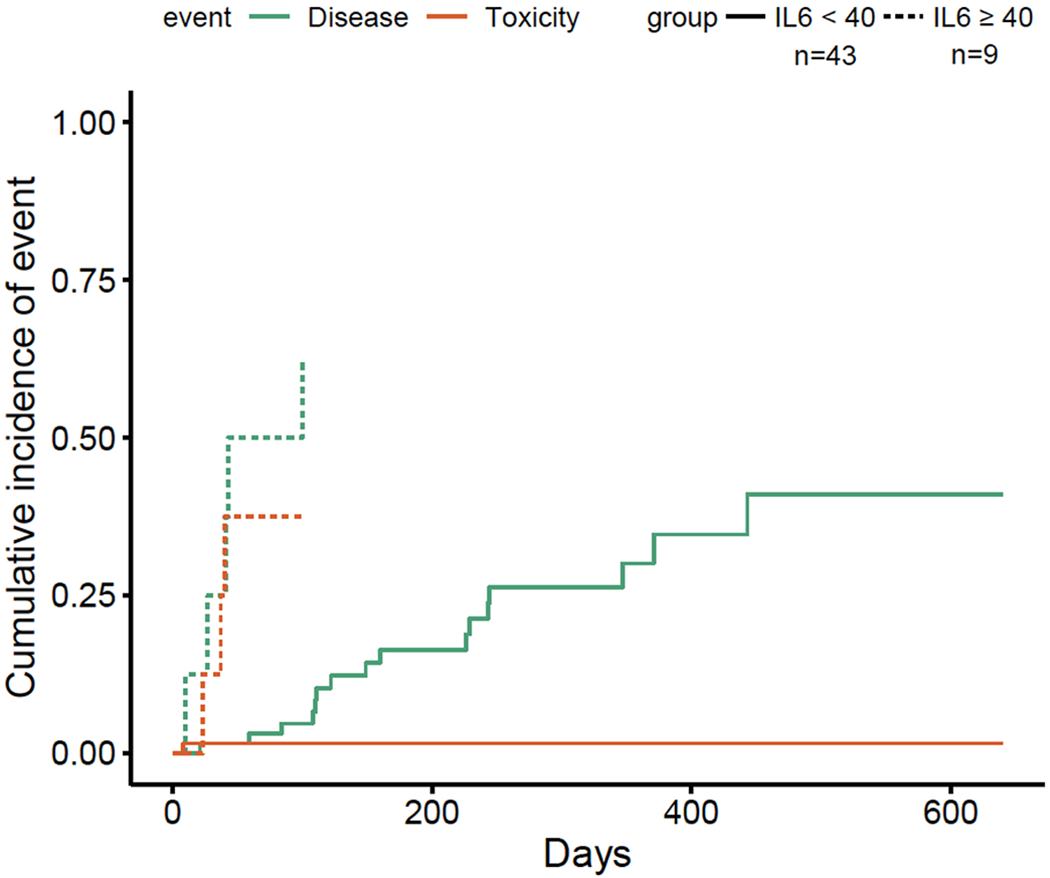
Events were defined as death from progressive disease or death from toxicity and/or infection after infusion of axi-cel. Patient samples were collected prior to lymphodepleting chemotherapy and stratified by baseline IL6 level ≥ 40pg/mL or <40pg/mL.
Gene expression of lymphoma tissue correlated with toxicities in patients treated with axi-cel
For the purpose of correlating toxicity with tumor intrinsic features, we evaluated gene expression profiles of baseline tumor tissue collected within one month of axi-cel infusion. Thirty-six patients had a limited set gene expression profiling (Nanostring) panel of 770 genes. We correlated severity of NT and CRS to lymphoma gene expression to determine what tumor cellular pathways may impact outcomes. To determine the association between the tumor microenvironment (TME) and toxicities, cell type scores were calculated for T cell and macrophages Patients who experienced severe NT had lower T cell type score (p<0.001) and higher macrophage score (p<0.01) (Figure 4A). Furthermore, those with severe NT had less expression of the regulatory T (Treg) marker Foxp3 (p=0.00001) (Figure 4B). We found that patients with severe NT (n=10) had a different gene expression profile than patients with less severe NT (n=26) (Figure 4C). An overlapping set of baseline biopsies had RNA-SEQ done and were also analyzed for correlation to toxicity. A volcano plot (Figure 4D) demonstrates the differentially expressed genes in the cohort who developed grade ≥3 NT (n=11) vs. those who had grade 0-2 toxicities (n=14). GSEA plots (Figure 4E) are positively correlated with genes differentially expressed between conventional and regulatory T cells in patients with severe NT. Severe NT also positively correlated with classically activated macrophages (M1) and alternatively activated macrophages (M2) (Figure 4F). Although the number of severe CRS cases was smaller than NT, there were still differences in gene expression in the subset of patients with severe ≥ 3 CRS (n=5) (Figure S6).
Fig. 4. Gene expression of lymphoma tissue correlated with toxicities in patient treated with axi-cel.
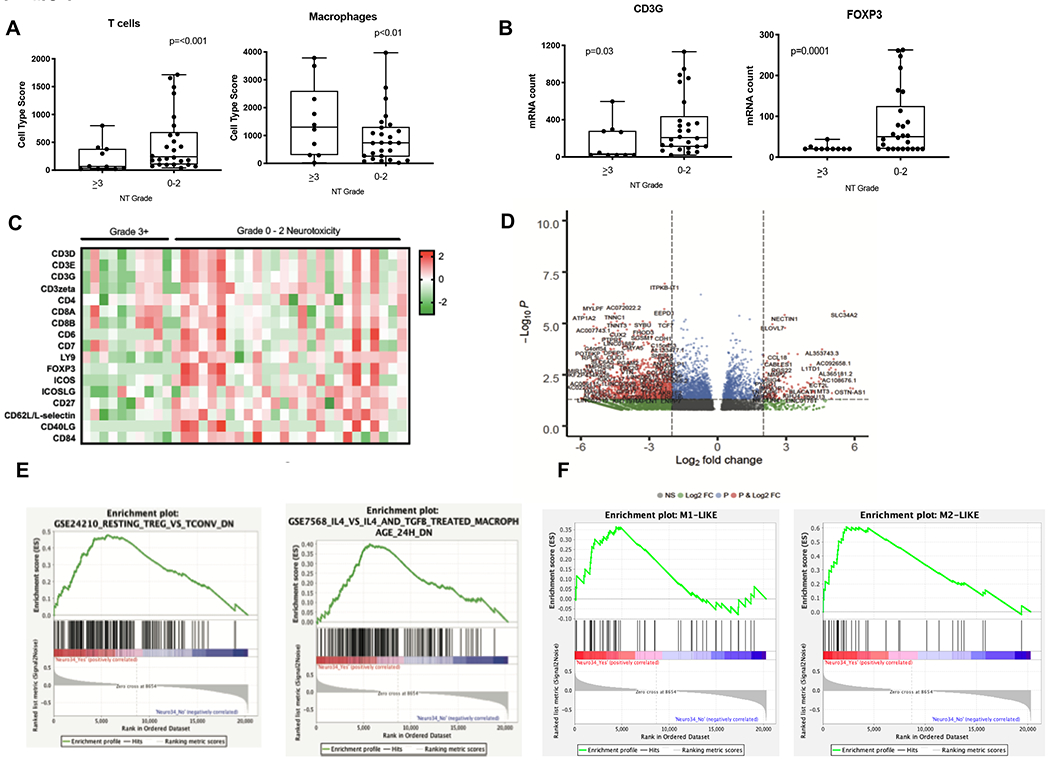
A-C. Baseline tumor biopsies were taken within 1 month prior to axi-cel infusion (n=36). 10 patients experienced severe grade 3–4 NT and 26 patients experienced non-severe NT.A. Cell type score for T cells and macrophages. B. Example genes include CD3γ (T cell marker) and FOXP3 (Treg marker). C. Gene expression was measured with the Nanostring IO360 panel, which include 770 genes, and was analyzed by nSolver. Heat map of T cell genes. Each column represents a patient sample and genes as shown as Z transformed expression D. RNAseq was performed on an overlapping set of baseline biopsies that was prospectively snap frozen (n=11 gr.3–4, n=14 gr.0–2). Volcano plot for differentially expressed genes based on NT severity. E-F. Enrichment plots of genes analyzed for immunologic GSEA signatures including resting Tregs, macrophages, M1 and M2 macrophages respectively.
Elevated Baseline IL6 in a Patient
We describe the management of the only patient in our cohort with a baseline IL6 level ≥40pg/mL who remained alive at time of data cut off. This patient had a history of double hit DLBCL with primary refractory disease following three lines of therapy. Prior to axi-cel infusion, he required bridging chemotherapy due to symptomatic bulky disease (Figure S7A). On the day following infusion of axi-cel, he developed grade 2 CRS with fevers and hypotension requiring tocilizumab. In addition to tocilizumab, he was treated with one dose of dexamethasone due to concern for severe toxicities based on bulky disease. Despite improvement on day two with resolution of fevers, he had recurrence of symptoms by the third day. Considering the patient had high risk features of toxicity including bulky disease, elevated baseline level of IL6 as well as resistance to tocilizumab and dexamethasone, he was treated with high dose methylprednisolone despite being classified as Grade 2 CRS per ASTCT guidelines.
Per institutional and CARTOX working group guidelines, high dose methylprednisolone is indicated for patients with grade 4 CRS (6). However, in this case, early and aggressive management of CRS likely contributed to resolution of CRS to grade 0 without impacting efficacy as patient had partial response on day 30 scans (Figure S7B). Real time cytokine data was not available for the remainder of patients included in this study and therefore did not impact the diagnosis or management of immune mediated toxicities. While this is a single case, it demonstrates that real time cytokine monitoring can be a helpful tool along with clinical and standard laboratory data in guiding management.
Discussion
We report the role of cytokine analysis in identifying patients with aggressive B cell lymphoma who are at risk of developing severe immune mediated toxicity after treatment with standard of care axi-cel. Using gene expression of the lymphoma TME, we identified immune cells that correlate with severe toxicity. We observed that both myeloid cells and regulatory T cells correlated with severity of CRS and NT. Further, we report on the role of catecholamines in mediating CAR T cell therapy related toxicities (21). It is important to note that many patients included in this study would not have been eligible for treatment in the pivotal ZUMA-1 study and reflect a real-world population. Despite patients having more aggressive disease, the rates of severe grade ≥3 CRS and NT were comparable to those reported in ZUMA-1, as has been reported elsewhere (1,5).
Several biomarkers have been associated with CRS and/or NT and most recently reported to impact efficacy (1,12,13,17). While cytokines are elevated after infusion of CAR T cells, there is no validated cut off of a single biomarker that is predictive of severe toxicities. The utility of cytokines and lab values such as CRP vary depending on several factors including which CAR T product was used and underlying disease (10,13). Comparing toxicities across the pivotal CAR T trials is challenging as there is variability in the studies among the CRS grading systems. In this report, the majority of toxicities were graded according to the most recent ASTCT consensus grading to provide uniform grading that allows for easier comparisons of toxicities across various CAR T constructs and clinical trials (4).
Consistent with prior published reports, we demonstrate that biomarkers of endothelial activation, ANG1 & and ANG2, play a role in the development of severe CRS and NT (13,15). ANG1 and ANG2, are ligands which have opposing functions on endothelial activation with ANG2 promoting capillary leak and ANG1 promoting endothelial stability (31). Levels of ANG2 and ANG 2/ANG1 ratio were higher even prior to the start of lymphodepleting chemotherapy in patients who subsequently developed grade ≥3 NT. Furthermore, we observe that peak levels of cytokines which activate endothelial cells including IL6, IFNγ,TNFα in addition to ANG2/ANG1 are elevated in patients who develop severe grade ≥ 3 NT. These findings support a model proposed by Gust and colleagues whereby CAR T cells initiate a cascade of proinflammatory and endothelial activating cytokines in patients with baseline tumor endothelial dysfunction leading to a forward loop of further endothelial activation and subsequent severe NT (12,13). While CRS and NT are overlapping syndromes, they have distinct features and therefore do not respond to the same clinical management schemas. Since prophylactic IL6 receptor blockade has not been shown to be effective in ameliorating neurotoxicity, clinical trials aimed at modulating endothelial activation to prevent severe NT are warranted(1,5,32,33).
We report that recipient myeloid cells and Tregs may play an important role in the pathogenesis of severe NT and CRS, and propose a model in which severity of CAR T toxicity is driven by the interaction between infused CAR T cells and these recipient cells (8,9). The role of recipient Tregs and immune mediated toxicities and clinical response in patients with LBCL treated with CAR T is not yet well defined. Reducing systemic inflammation and polarizing the TME towards a T cell infiltration phenotype are potential strategies to lower toxicity. However, the impact of Tregs in the tumor microenvironment on efficacy is not yet fully elucidated and requires further evaluation.
We describe a novel observation between peak levels of NAD and severe CRS. In pre-clinical models, we previously reported that T cell activated macrophages secrete high levels of catecholamines that enhance the inflammatory response through a positive feedback loop (21). Metyrosine, a tyrosine hydroxylase inhibitor, is a catecholamine inhibitor which is used to treat patients with pheochromocytoma. Pre-treatment of mice with Metyrosine reduced the production of catecholamines by macrophages (21). Cosentino and colleagues have shown that catecholamine synthesis is effectively induced through a protein kinase C dependent mechanism that triggers the de novo expression of tyrosine hydroxylase and subsequent activation in T and B lymphocytes (34). Furthermore, catecholamines surges can be seen in patients who develop immune mediated toxicities resulting in a hyperactivated immune system. Our study is limited by the small sample size of patients who had serum available for catecholamine analysis (n=30) and therefore warrants validation of these observations in larger studies.
While we and others have described the role of cytokines in association with CRS and NT, there is no defined cytokine level that can predict which patients are at highest risk of developing severe toxicity. During the course of the pivotal axi-cel trials, there was a change in management from delaying intervention until toxicities became severe (grade ≥3) to earlier intervention aimed at preventing toxicities from becoming severe by providing early cytokine blockade therapy (1,5). Despite this change to earlier intervention, some patients reported in this cohort still died of or with severe CRS suggesting that there may be disease factors in these patients that promote severe toxicity. We identified elevated IL6 levels (≥ 40pg/mL) to be associated with severe toxicity and death in patients treated with axi-cel therapy. The majority of patients (n=5) died of disease related factors suggesting that elevated IL6 may be an indicator of refractory disease. However, three patients died of treatment related mortality suggesting a different mechanism for the source of inflammation. Future studies evaluating the role of IL6 and baseline myeloid infiltration in the TME in a larger patient cohort are planned. Cytokines were evaluated in a research lab with the Ella automated simple plex assay (ProteinSimple) as described in the methods. Future studies using cytokine cut off values to guide clinical management would require Clinical Laboratory Improvement Amendments (CLIA) laboratory validation. While these findings were observed in a small number of patients and will need to be validated in a larger cohort, they provide the rationale for designing risk-adapted clinical trials to mitigate toxicity with prophylactic agents. An analysis is planned to create and prospectively validate a predictive model to risk stratify patients and guide management of severe toxicities. Furthermore, due to the financial toxicity of CAR T, future predictive models incorporating baseline cytokines will inform which patients can be safely treated in the outpatient setting.
Due to the retrospective nature of this study, we are limited to describing observations of significant associations of baseline tumor and patient factors with toxicity. Our observations suggest that the incidence of severe life-threatening CRS following CD19 CAR T cell therapy is influenced by baseline tumor characteristics that are present prior to the infusion of CAR T cells. Based on these findings we propose a model in which inflammation characterized by elevated cytokine levels, specifically IL6, primes myeloid cells that are further activated upon CAR T cell infusion to release toxic amounts of cytokines and catecholamines leading to severe toxicity. We could not find a significant correlation between baseline IL6 and myeloid gene expression, however only ten patients had baseline serum cytokines in addition to tissue biopsy samples limiting this analysis. Cytokines and other potential predictive markers of toxicity will need to be evaluated in a larger prospective cohort.
Our understanding of the impact of myeloid cells, a pro inflammatory tumor microenvironment and endothelial dysfunction on mediating toxicities and outcomes is evolving and warrants further investigation in a clinical trial setting. The identification of mechanisms of immune mediated toxicity and recognition of early predictive markers of safety are important for our understanding of these toxicities and recognition of CRS and NT as separate entities. We have confirmed that patients’ cytokine profile at baseline as related to the tumor microenvironment plays a key role in toxicity and provides insight into a novel mechanism of toxicity involving myeloid cells and catecholamines. Emerging biologic data such as reported here is vital for designing clinical trials aimed at further reducing the rates of severe toxicities in high risk patients.
Supplementary Material
Statement of Translational Relevance.
Patient and disease factors present prior to chimeric antigen receptor T (CAR T) cell infusion influence the development of immune mediated toxicities. We identify an association between a pro-inflammatory tumor microenvironment and severe cytokine release syndrome (CRS) and neurotoxicity in patients with large B cell lymphoma treated with a standard of care CAR T product. We report a novel finding of elevated peak noradrenaline levels in patients with severe CRS. Further, we describe the role of myeloid cells and regulatory T cells in the lymphoma tumor microenvironment of patients with severe toxicities. Our understanding of the impact of myeloid cells and the tumor microenvironment on mediating toxicities is evolving and warrants further investigation in a clinical trial setting.
Acknowledgements
This work has been supported in part by the Molecular Genomics and Biostatistics Core Facilities at the H. Lee Moffitt Cancer Center & Research Institute, an NCI designated Comprehensive Cancer Center (P30-CA076292).” A patent application on CRS prevention listing VS and RYB as co-inventors has been provisionally filed by Johns Hopkins University. The terms of these arrangements are managed by Johns Hopkins University in accordance with its conflict of interest policies.
We are grateful to the contributions from the clinical staff and clinical research staff, as well as the patients and their families for participating in this clinical study.
Conflict of Interest Statement:
MJ: Consultancy/Advisory: Kite/Gilead, Novartis. VS**: Research funding in support of this project by NCI 5K08CA230179 and the Emerson Collective. RYB**: Research funding by the Emerson Collective. JP: Consultancy for Takeda, Abbvie, Janssen, Novartis, Kite/Gilead and Teva. BS: Consultancy for Celgene/Juno/BMS, Adaptive, Kite/Gilead, Spectrum/Acroteca. Research funding from Kite/Gilead and Jazz. JC: Advisory for Kite/Gilead, Novartis, Bayer and Genetech. Speakers Bureau for Genetech. JM: Research funding from Iovance Biotherapeutics. CAB: Advisory for Kite/Gilead, Legend. Speaker Bureau for Novartis. FLL: Research funding from Kite/Gilead. Consultant for Cellular Biomedicine Group, Inc., Scientific advisor for Kite/Gilead, Novartis, Cellgene/BMS, Allogene, Wugen, Caliber, GammaDelta Therapeutics. Patents held by Moffitt Cancer Center related to Survivin Dendtritic Cell Vaccine and improvement of CAR T therapy. MLD: Research funding from Atara. Scientific advisor for Kite/Gilead, Novartis, Celyad, PACT Pharma. Speakers Bureau for Novartis. Stock options in Adaptive Biotechnologies, ITUS, Precision Biosciences
Footnotes
All other listed authors declare no potential conflicts of interest.
References
- 1.Neelapu SS, Locke FL, Bartlett NL, Lekakis LJ, Miklos DB, Jacobson CA, et al. Axicabtagene Ciloleucel CAR T-Cell Therapy in Refractory Large B-Cell Lymphoma. N Engl J Med 2017;377(26):2531–44 doi 10.1056/NEJMoa1707447. [DOI] [PMC free article] [PubMed] [Google Scholar]
- 2.Schuster SJ, Bishop MR, Tam CS, Waller EK, Borchmann P, McGuirk JP, et al. Tisagenlecleucel in Adult Relapsed or Refractory Diffuse Large B-Cell Lymphoma. N Engl J Med 2018. doi 10.1056/NEJMoa1804980. [DOI] [PubMed] [Google Scholar]
- 3.Davila ML, Riviere I, Wang X, Bartido S, Park J, Curran K, et al. Efficacy and toxicity management of 19–28z CAR T cell therapy in B cell acute lymphoblastic leukemia. Sci Transl Med 2014;6(224):224ra25 doi 10.1126/scitranslmed.3008226. [DOI] [PMC free article] [PubMed] [Google Scholar]
- 4.Lee DW, Santomasso BD, Locke FL, Ghobadi A, Turtle CJ, Brudno JN, et al. ASBMT Consensus Grading for Cytokine Release Syndrome and Neurologic Toxicity Associated with Immune Effector Cells. Biol Blood Marrow Transplant 2018. doi 10.1016/j.bbmt.2018.12.758. [DOI] [PMC free article] [PubMed] [Google Scholar]
- 5.Locke FL, Ghobadi A, Jacobson CA, Miklos DB, Lekakis LJ, Oluwole OO, et al. Long-term safety and activity of axicabtagene ciloleucel in refractory large B-cell lymphoma (ZUMA-1): a single-arm, multicentre, phase 1–2 trial. Lancet Oncol 2018. doi 10.1016/S1470-2045(18)30864-7. [DOI] [PMC free article] [PubMed] [Google Scholar]
- 6.Neelapu SS, Tummala S, Kebriaei P, Wierda W, Gutierrez C, Locke FL, et al. Chimeric antigen receptor T-cell therapy - assessment and management of toxicities. Nat Rev Clin Oncol 2018;15(1):47–62 doi 10.1038/nrclinonc.2017.148. [DOI] [PMC free article] [PubMed] [Google Scholar]
- 7.Alvi RM, Frigault MJ, Fradley MG, Jain MD, Mahmood SS, Awadalla M, et al. Cardiovascular Events Among Adults Treated With Chimeric Antigen Receptor T-Cells (CAR-T). J Am Coll Cardiol 2019;74(25):3099–108 doi 10.1016/j.jacc.2019.10.038. [DOI] [PMC free article] [PubMed] [Google Scholar]
- 8.Giavridis T, van der Stegen SJC, Eyquem J, Hamieh M, Piersigilli A, Sadelain M. CAR T cell-induced cytokine release syndrome is mediated by macrophages and abated by IL-1 blockade. Nat Med 2018;24(6):731–8 doi 10.1038/s41591-018-0041-7. [DOI] [PMC free article] [PubMed] [Google Scholar]
- 9.Norelli M, Camisa B, Barbiera G, Falcone L, Purevdorj A, Genua M, et al. Monocyte-derived IL-1 and IL-6 are differentially required for cytokine-release syndrome and neurotoxicity due to CAR T cells. Nat Med 2018;24(6):739–48 doi 10.1038/s41591-018-0036-4. [DOI] [PubMed] [Google Scholar]
- 10.Teachey DT, Lacey SF, Shaw PA, Melenhorst JJ, Maude SL, Frey N, et al. Identification of Predictive Biomarkers for Cytokine Release Syndrome after Chimeric Antigen Receptor T-cell Therapy for Acute Lymphoblastic Leukemia. Cancer Discov 2016;6(6):664–79 doi 10.1158/2159-8290.CD-16-0040. [DOI] [PMC free article] [PubMed] [Google Scholar]
- 11.Pennell CA, Barnum JL, McDonald-Hyman CS, Panoskaltsis-Mortari A, Riddle MJ, Xiong Z, et al. Human CD19-Targeted Mouse T Cells Induce B Cell Aplasia and Toxicity in Human CD19 Transgenic Mice. Mol Ther 2018;26(6):1423–34 doi 10.1016/j.ymthe.2018.04.006. [DOI] [PMC free article] [PubMed] [Google Scholar]
- 12.Gust J, Hay KA, Hanafi LA, Li D, Myerson D, Gonzalez-Cuyar LF, et al. Endothelial Activation and Blood-Brain Barrier Disruption in Neurotoxicity after Adoptive Immunotherapy with CD19 CAR-T Cells. Cancer Discov 2017;7(12):1404–19 doi 10.1158/2159-8290.CD-17-0698. [DOI] [PMC free article] [PubMed] [Google Scholar]
- 13.Hay KA, Hanafi LA, Li D, Gust J, Liles WC, Wurfel MM, et al. Kinetics and biomarkers of severe cytokine release syndrome after CD19 chimeric antigen receptor-modified T-cell therapy. Blood 2017;130(21):2295–306 doi 10.1182/blood-2017-06-793141. [DOI] [PMC free article] [PubMed] [Google Scholar]
- 14.Hirayama AV, Gauthier J, Hay KA, Voutsinas JM, Wu Q, Gooley T, et al. The response to lymphodepletion impacts PFS in patients with aggressive non-Hodgkin lymphoma treated with CD19 CAR T cells. Blood 2019;133(17):1876–87 doi 10.1182/blood-2018-11-887067. [DOI] [PMC free article] [PubMed] [Google Scholar]
- 15.Santomasso BD, Park JH, Salloum D, Rivière I, Flynn J, Mead E, et al. Clinical and Biologic Correlates of Neurotoxicity Associated with CAR T Cell Therapy in Patients with B-cell Acute Lymphoblastic Leukemia (B-ALL). Cancer Discov 2018. doi 10.1158/2159-8290.CD-17-1319. [DOI] [PMC free article] [PubMed] [Google Scholar]
- 16.Locke FL, Neelapu SS, Bartlett NL, Siddiqi T, Chavez JC, Hosing CM, et al. Phase 1 Results of ZUMA-1: A Multicenter Study of KTE-C19 Anti-CD19 CAR T Cell Therapy in Refractory Aggressive Lymphoma. Mol Ther 2017;25(1):285–95 doi 10.1016/j.ymthe.2016.10.020. [DOI] [PMC free article] [PubMed] [Google Scholar]
- 17.Kochenderfer JN, Somerville RPT, Lu T, Shi V, Bot A, Rossi J, et al. Lymphoma Remissions Caused by Anti-CD19 Chimeric Antigen Receptor T Cells Are Associated With High Serum Interleukin-15 Levels. J Clin Oncol 2017;35(16):1803–13 doi 10.1200/JCO.2016.71.3024. [DOI] [PMC free article] [PubMed] [Google Scholar]
- 18.Sterner RM, Sakemura R, Cox MJ, Yang N, Khadka RH, Forsman CL, et al. GM-CSF inhibition reduces cytokine release syndrome and neuroinflammation but enhances CAR-T cell function in xenografts. Blood 2019;133(7):697–709 doi 10.1182/blood-2018-10-881722. [DOI] [PMC free article] [PubMed] [Google Scholar]
- 19.Park JH, Rivière I, Gonen M, Wang X, Sénéchal B, Curran KJ, et al. Long-Term Follow-up of CD19 CAR Therapy in Acute Lymphoblastic Leukemia. N Engl J Med 2018;378(5):449–59 doi 10.1056/NEJMoa1709919. [DOI] [PMC free article] [PubMed] [Google Scholar]
- 20.Cheson BD, Fisher RI, Barrington SF, Cavalli F, Schwartz LH, Zucca E, et al. Recommendations for initial evaluation, staging, and response assessment of Hodgkin and non-Hodgkin lymphoma: the Lugano classification. J Clin Oncol 2014;32(27):3059–68 doi 10.1200/JCO.2013.54.8800. [DOI] [PMC free article] [PubMed] [Google Scholar]
- 21.Staedtke V, Bai RY, Kim K, Darvas M, Davila ML, Riggins GJ, et al. Disruption of a self-amplifying catecholamine loop reduces cytokine release syndrome. Nature 2018;564(7735):273–7 doi 10.1038/s41586-018-0774-y. [DOI] [PMC free article] [PubMed] [Google Scholar]
- 22.Bushnell B, Rood J, Singer E. BBMerge - Accurate paired shotgun read merging via overlap. PLoS One 2017;12(10):e0185056 doi 10.1371/journal.pone.0185056. [DOI] [PMC free article] [PubMed] [Google Scholar]
- 23.Martin M Cutadapt removes adapter sequences from high-throughput sequencing reads. 2011 2011;17(1):3 doi 10.14806/ej.17.1.200. [DOI] [Google Scholar]
- 24.Dobin A, Davis CA, Schlesinger F, Drenkow J, Zaleski C, Jha S, et al. STAR: ultrafast universal RNA-seq aligner. Bioinformatics 2013;29(1):15–21 doi 10.1093/bioinformatics/bts635. [DOI] [PMC free article] [PubMed] [Google Scholar]
- 25.Anders S, Pyl PT, Huber W. HTSeq--a Python framework to work with high-throughput sequencing data. Bioinformatics 2015;31(2):166–9 doi 10.1093/bioinformatics/btu638. [DOI] [PMC free article] [PubMed] [Google Scholar]
- 26.Love MI, Huber W, Anders S. Moderated estimation of fold change and dispersion for RNA-seq data with DESeq2. Genome Biol 2014;15(12):550 doi 10.1186/s13059-014-0550-8. [DOI] [PMC free article] [PubMed] [Google Scholar]
- 27.Brentjens RJ, Davila ML, Riviere I, Park J, Wang X, Cowell LG, et al. CD19-targeted T cells rapidly induce molecular remissions in adults with chemotherapy-refractory acute lymphoblastic leukemia. Sci Transl Med 2013;5(177):177ra38 doi 10.1126/scitranslmed.3005930. [DOI] [PMC free article] [PubMed] [Google Scholar]
- 28.Porter DL, Levine BL, Kalos M, Bagg A, June CH. Chimeric antigen receptor-modified T cells in chronic lymphoid leukemia. N Engl J Med 2011;365(8):725–33 doi 10.1056/NEJMoa1103849. [DOI] [PMC free article] [PubMed] [Google Scholar]
- 29.Azzaoui I, Uhel F, Rossille D, Pangault C, Dulong J, Le Priol J, et al. T-cell defect in diffuse large B-cell lymphomas involves expansion of myeloid-derived suppressor cells. Blood 2016;128(8):1081–92 doi 10.1182/blood-2015-08-662783. [DOI] [PubMed] [Google Scholar]
- 30.De Vlaeminck Y, González-Rascón A, Goyvaerts C, Breckpot K. Cancer-Associated Myeloid Regulatory Cells. Front Immunol 2016;7:113 doi 10.3389/fimmu.2016.00113. [DOI] [PMC free article] [PubMed] [Google Scholar]
- 31.Fiedler U, Scharpfenecker M, Koidl S, Hegen A, Grunow V, Schmidt JM, et al. The Tie-2 ligand angiopoietin-2 is stored in and rapidly released upon stimulation from endothelial cell Weibel-Palade bodies. Blood 2004;103(11):4150–6 doi 10.1182/blood-2003-10-3685. [DOI] [PubMed] [Google Scholar]
- 32.Locke FL, Neelapu SS, Bartlett NL, Lekakis LJ, Jacobson CA, Braunschweig I, et al. Preliminary results of prophylactic tocilizumab after axicabtageneciloleucel (axi-cel; KTE-C19) treatment for patients with refractory, aggressive non-Hodgkin lymphoma (NHL). Blood 2017;130(Supplement 1):1547-. [Google Scholar]
- 33.Topp M, Van Meerten T, Houot R, Minnema MC, Milpied N, Lugtenburg PJ, et al. Earlier Steroid Use with Axicabtagene Ciloleucel (Axi-Cel) in Patients with Relapsed/Refractory Large B Cell Lymphoma. American Society of Hematology; Washington, DC; 2019. [Google Scholar]
- 34.Cosentino M, Fietta AM, Ferrari M, Rasini E, Bombelli R, Carcano E, et al. Human CD4+CD25+ regulatory T cells selectively express tyrosine hydroxylase and contain endogenous catecholamines subserving an autocrine/paracrine inhibitory functional loop. Blood 2007;109(2):632–42 doi 10.1182/blood-2006-01-028423. [DOI] [PubMed] [Google Scholar]
Associated Data
This section collects any data citations, data availability statements, or supplementary materials included in this article.