

Abstract
Canonical correlation analysis (CCA) method and its extended methods have been widely and successfully applied to the frequency recognition in SSVEP-based BCI systems. As a state-of-the-art extended method, filter bank canonical correlation analysis has higher accuracy and information transmission rate (ITR) than CCA. However, in the CCA method, the temporally local structure of samples has not been well considered. In this correspondence, we proposed termed temporally local canonical correlation analysis (TCCA). In this new method, the original covariance matrix was replaced by the temporally local covariance matrix. Furthermore, we proposed an improved frequency identification method of filter bank based on TCCA, named filter bank temporally local canonical correlation analysis (FBTCCA). In the offline environment, we used a leave-one-subject-out validation strategy on datasets of ten testees to optimize the parameters of TCCA and FBTCCA and evaluate the two algorithms. The experimental results affirm that TCCA markedly outperformed CCA, and FBTCCA obtained the highest accuracy among the four methods. This study corroborates that TCCA-based approaches have great potential for implementing short time window SSVEP-based BCI systems.
Keywords: Brain–computer interface (BCI), Steady-state visual evoked potential (SSVEP), Canonical correlation analysis (CCA), Temporally local information
Introduction
Brain–computer interface (BCI) is an emerging method that could provide a new communication channel between a human and an external environment (Lance et al. 2012; Chaudhary et al. 2016). In a BCI system, noninvasive EEG has been valued by researchers because of its safety and low-cost devices (Lay-Ekuakille et al. 2013; Dai et al. 2015; Chen et al. 2016; Wang et al. 2016). There are several brain control signals commonly used in BCI systems, such as event-related potential (ERP) (Cheng et al. 2002; Gao et al. 2014; Miao et al. 2020), sensorimotor rhythm (SMR) (He et al. 2015; Zhang et al. 2017; Feng et al. 2018), auditory steady-state response (ASSR) (Hwang et al. 2017),steady-state visual evoked potential (SSVEP) (Yin et al. 2014; Chen et al. 2015b; Zhang et al. 2015; Chang et al. 2016; Jiao et al. 2018), etc. The SSVEP-based BCI is one of the core areas of research in the field of BCI, and studies indicated that it has the preponderance of high information transmission rate and less user training (Cheng et al. 2002; Wang et al. 2008; Bakardjian et al. 2010; Gao et al. 2014).
SSVEPs are generated by the users staring at the visual flickers and include the same frequency, harmonic, and subharmonic brain responses as the stimulus (Herrmann 2001). The development directions of SSVEPs detection method are shorter the time window, higher the accuracy, and ITR. Various advanced signal processing methods have been proposed to detect SSVEPs, the power spectrum density analysis (PSDA) (Hwang et al. 2012), canonical correlation analysis (CCA) (Lin et al. 2006), likelihood ratio test (LRT) (Zhang et al. 2014a), multivariate synchronization index (MSI) (Zhang et al. 2014b) and correlated component analysis (CORRCA) (Zhang et al. 2018) are the mainstream algorithms. Among various methods, the CCA method proposed by Lin plays a compelling role in the detection of SSVEPs due to its high efficiency and robustness (Lin et al. 2006). In order to improve the performance of CCA, many extended methods are proposed (Zhang et al. 2013b; Poryzala and Materka 2014; Zhang et al. 2014c; Chen et al. 2015a; Nakanishi et al. 2015), such as the L1-regularized multiway CCA (L1-MCCA) (Zhang et al. 2013b), cluster analysis of CCA coefficient (CACC) (Poryzala and Materka 2014), multiset CCA (MsetCCA) (Zhang et al. 2014c), filter bank CCA (FBCCA) (Chen et al. 2015a), a combination method of CCA and IT-CCA (Nakanishi et al. 2015). The FBCCA method takes into account the information contained in harmonics, which significantly improves the performance of BCI based on SSVEP. Under 40 target frequencies, the average ITR of the online spelling system based on FBCCA was 151.18 bits (Chen et al. 2015a).
Owing to the EEG signal is non-stationary, it will change slowly with time (Muller et al. 2003), and temporally local variances may provide more information (Wang and Xu 2012). Previous researches have proved the positive effect of temporally local information, such as TMSI (Zhang et al. 2016), TLMSFA (Wang 2010), LTCSP (Zhang et al. 2013a). Mathematically, the calculation of CCA depends on the covariance matrix, and the CCA-based methods ignored the temporal information of signals.
In this study, temporally local information was considered in the CCA algorithm for the first time, and a new method called TCCA was proposed. On this basis, we combined the two techniques of TCCA and FBCCA and recommended the FBTCCA method. The datasets of ten subjects were used for a leave-one-subject-out validation strategy. The parameters of TCCA and FBTCCA were optimized on the training set. The target recognition accuracy of CCA, TCCA, FBCCA, and FBTCCA was compared on the test set. Finally, the results proved that the optimized TCCA is significantly better than the CCA, and FBTCCA has the best performance among the four algorithms. The TCCA-based algorithm has excellent potential in SSVEP frequency identification, especially in a BCI system with a short time window.
Materials and methods
Standard CCA
CCA is a tool to measure the similarity between two multivariate variables, which is widely used in SSVEPs detection. Given two sets of variables and . CCA seeks two corresponding weight vectors and to maximize the correlation coefficient of X and Y:
| 1 |
is the maximum correlation coefficient between linear combination and . and respectively represent multi-channel SSVEPs and reference signals. M is the number of signal channels, N denotes the number of harmonics and K denotes the number of time samples. The reference signal is manually constructed as:
| 2 |
where is the nth stimulus frequency, each stimulus frequency corresponds to the commensurable reference signal. When the number of stimulation frequencies is S, the corresponding stimulation frequency can be estimated from the maximum value of the correlation coefficient between each reference signal and the test sample:
| 3 |
Temporally local CCA
It has been proved that considering the time structure information of EEG can remove the artifacts and improve the accuracy of the signal processing algorithm. We define an adjacency matrix based on the number of samples:
| 4 |
And the value of W is determined by Tukey’s tricube weighting function:
| 5 |
Multiple signals can also be written . The formula of temporally local covariance matrix is as follows:
| 6 |
Formulas (6) can be converted to:
| 7 |
D is a diagonal matrix, and for , is Laplacian matrix. In this paper, L is used to reconstruct the formula for calculating the maximum correlation coefficient, The new maximum correlation coefficient is:
| 8 |
If ,,, the optimization objective is:
| 9 |
This question is translated into:
| 10 |
SVD can solve the optimization objective,let
| 11 |
By introducing this expression into (10), we get:
| 12 |
| 13 |
Both and are unit orthogonal basis, they are regarded as left and right singular vectors corresponding to a singular value of matrix .Using singular value decomposition, .
The formula (14) is maximized to obtain the maximum singular value and the left and right singular vectors corresponding to the maximum singular value. and can be obtained by (10).
| 14 |
The above formula (8) is the core idea of temporally local CCA. Temporally local CCA looks for , to make reach the maximum value. Then we can use formula (3) to find the target stimulation frequency.
FBTCCA
The FBCCA method has been successfully applied to a high-speed BCI Speller. By designing filter banks, FBCCA perfectly utilizes the information contained in harmonics, and its performance is far superior to that of standard CCA. Based on TCCA, we considered the effect of harmonic components and proposed a new method called FBTCCA. The flowchart is shown in Fig. 1.
Fig. 1.

Flowchart of the FBTCCA method
First of all, the original EEG signal is decomposed into subbands with different frequencies through the filter bank. The frequency ranges of subbands are 8–88 Hz, 16–88 Hz,, 8–88 Hz. Then, correlation analysis is carried out for each subband and reference signal, SB1 is analyzed by TCCA, and other subbands are analyzed by CCA. The weighted square sum of the correlation coefficients of each subband is obtained, as shown in the formula (15):
| 15 |
where q(l) is the weight of the lth subband component, expressed as:
| 16 |
Finally, we use formula (3) to identify the target frequency.
Datasets acquisition
The EEG data in this paper were from the published database (Yuan et al. 2015). We used the SSVEPs dataset of 10 healthy subjects (3 females, aged from 18 to 31 years, all right-handed) participating in the offline experiment. There are 40 different frequency stimuli on the LCD screen (frequency range is 8–15.8 Hz, the interval is 0.2 Hz). For each visual stimulus, subjects watched for five seconds, and this test needs to be repeated six times. Subjects’ eyes were 70 cm from the screen, and they would rest for a few minutes between the two trials to prevent visual fatigue.
The EEG signals of subjects were recorded by a Synamps2 system (Neuroscan, Inc.) system at a sampling rate of 1000 Hz. The preprocessing of EEG includes a 0.15–200 Hz bandpass filter and a notch filter at 50 Hz. The arrangement of electrodes follows the international 10–20 system. We recorded the EEG signals of PZ, PO5, PO3, POZ, PO4, PO6, O1, Oz and O2 channels, all nine channels are located in the occipital region. The researcher placed the reference electrode at CZ and kept the electrode impedance below 10 K. Finally, all the recorded SSVEPs were down-sampled to 250 Hz.
Parameter optimization and performance evaluation
A leave-one-subject-out validation strategy is used to optimize the algorithm parameters and evaluate the algorithm. From 10 subjects, we extract the data set of each subject in turn as the test set, and the data set of the other nine subjects as the training set. We optimized the parameters of the new algorithms on the training set and evaluated the accuracy on the test set.
In this paper, we fixed the filter number to 5 and set the weight parameters a and B in FBCCA to 1.25, 0.25. Under this condition, FBCCA achieves the highest performance. Therefore, the parameters to be optimized are in TCCA, , a, b in FBCCA. We used the grid search method to determine the above parameters. The ratio of the correct number of targets to the total number of targets (i.e., 40) can be regarded as the classification accuracy. After parameter optimization, we divided the four algorithms into two groups for accuracy evaluation. The first group is TCCA and CCA, and the second group is FBTCCA and FBCCA. The time windows are set to 0.5s, 0.6s, 0.7s, 0.8s, 0.9s, 1.0s, 1.2s and 1.5s respectively. The average accuracy of each algorithm under different time windows was compared, and the difference of results was observed by the paired-sample t-test. The efficacy of the proposed algorithm is verified by comparing the r-square value of correlation coefficient for the target frequency versus the remaining frequencies. These four algorithms are all run by MATLAB 2014b on a 2.9 GHz CPU (16G RAM) desktop computer. Statistical analysis between different methods was performed by a paired-sample T-test using the SPSS software package.
Results
The researchers have proved that the choice of the value of the harmonic number N in the reference signal has a considerable influence on the classification accuracy.In this study, N was set to 5 (Chen et al. 2015a). For TCCA, it is necessary to fix a parameter , which is determined by a grid search method. started at 2 and ended at 30 with an interval of 2, and the time window was 0.8s. In Fig. 2, When was in the range of [2 30], the accuracy of TCCA was higher than CCA. When , efficiency reached the highest point, this setting was applied to the comparison between TCCA and CCA. As Fig. 3 shows, the accuracy of TCCA is higher than that of CCA in every time window. In addition, a paired-sample t-test was applied to observe significance. The outcomes indicated that there were significant differences between CCA and TCCA (). A segment of SSVEP with a visual stimulation frequency of 12.2 Hz was selected. The R-square between SSVEP and 40 frequency reference signals are calculated by CCA and TCCA, respectively. The results are shown in the Fig. 4. When the reference signal is 10.6 Hz, the R-square value of CCA exceeds the R-square value of the target frequency, resulting in a frequency identification error. In the TCCA method, the R-square value of the target frequency reaches the highest.
Fig. 2.

Classification accuracy of TCCA using different temporally local range with the time window being 0.8s
Fig. 3.

Accuracy comparison of TCCA and CCA at different time windows. SE in the form of error bars
Fig. 4.

Visual stimulation frequency = 12.2 Hz. The effect of different stimulation frequency in the reference signal on R-square value in CCA and TCCA
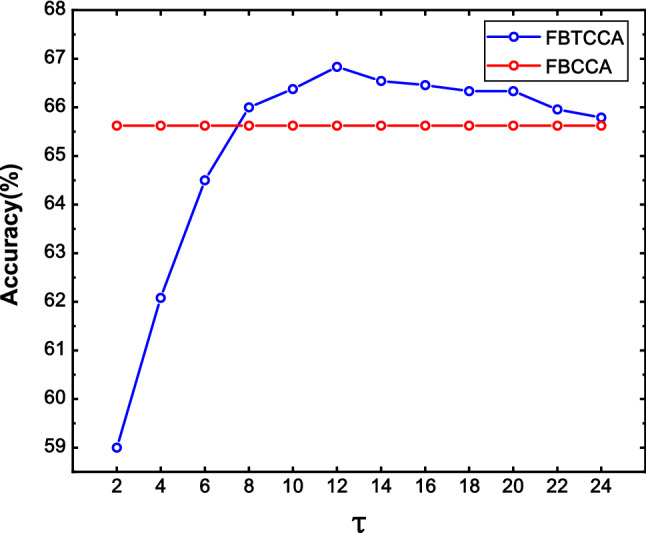
For FBTCCA, three parameters need to be determined, which were time local region , a and b in the weight formula (16). Two grid search methods are used to search for weight parameters and . In this paper, , a, b were respectively limited to [2:2:24], [0.25:0.25:2.5], [0:0.25:1]. Figure 5 shows the classification accuracy of FBTCCA at different , the time window was 0.8s, and the values of a and b were temporarily set as 1.25 and 0.25. In this case, FBCCA has optimized performance (Chen et al. 2015a). When was in the range [8 24], the accuracy of FBTCCA exceeded that of FBCCA.
Fig. 5.
Classification accuracy of FBTCCA using different temporally local range with the time window being 0.8s
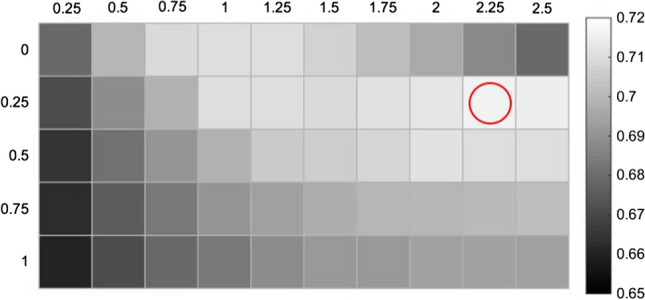
Because the processing method of the first subband in the FBTCCA method is TCCA, we need to determine a and b to make FBTCCA have the best performance, The results in Fig. 6 show that FBTCCA performs best when a = 2.25, B = 0.25. Then the optimized FBTCCA was compared with FBCCA. It was evident from Fig. 7 that when the time window is less than 1s, the classification accuracy of FBTCCA is significantly better than that of FBCCA (). A segment of SSVEP with a visual stimulation frequency of 9.8 Hz was selected. The sum of R-square between SSVEP and 40 frequency reference signals are calculated by FBCCA and FBTCCA, respectively. The results are shown in the Fig. 8. When the reference signal is 8.2 Hz, the sum of R-square value of FBCCA exceeds the sum of R-square value of the target frequency, resulting in a frequency identification error. In the FBTCCA method, the sum of R-square value of the target frequency reaches the highest.
Fig. 6.
Grid search for optimizing the parameters a, b
Fig. 7.

Accuracy comparison of FBTCCA and TCCA at different time windows. The asterisks symbolize the significant difference between the two methods (one asterisk: , two asterisks: , three asterisks: ).SE in the form of error bars
Fig. 8.

Visual stimulation frequency = 9.8 Hz. The effect of different stimulation frequency in the reference signal on the sum of R-square value in FBCCA and FBTCCA
Discussion and conclusion
The short time window can reduce the fatigue of subjects and improve the computing speed for the BCI system based on SSVEP. CCA and its extended algorithm are the mainstream algorithms of frequency recognition in SSVEP, among which FBCCA has excellent performance and still has high accuracy and ITR under 40 targets. However, CCA needs to consider the time information of the signal. TMSI TMSFA and others have proved that finding the time in formation in the signal can improve the performance of the algorithm. To our knowledge, no one has ever thought over the time information in the CCA, to reduce the artifacts and to raise the accuracy of the algorithm under the short time window. For the first time, we took the time information on the CCA method into account. Figure 3 and Table 1 show that the accuracy of TCCA is higher than that of CCA when the temporally local parameters are appropriate. On this basis, we proposed the FBTCCA algorithm by combining the filter bank with TCCA. For FBTCCA, we used the grid search method to determine three parameters. Namely, , a, b, established the relationship between two data points in the adjacency time range in TCCA, and a, b determined the influence weight of the obtained by each sub-band after passing through the filter bank. These three parameters affect the performance of FBTCCA. In this paper, we consider three parameters, respectively, and hope to find parameters at the same time in future research. Besides, there may be a better way to build a formula (16). Figures 4 and 8 show the efficacy of TCCA and FBTCCA from the perspective of R-square. In terms of time consumption, the calculation speed of the four algorithms on the same computer is as shown in Table 2:
Table 1.
Classification accuracy (%) of four methods at different time windows
| TW | Method | |||
|---|---|---|---|---|
| CCA | TCCA | FBCCA | FBTCCA | |
| 0.5s | ||||
| 0.6s | ||||
| 0.7s | ||||
| 0.8s | ||||
| 0.9s | ||||
| 1.0s | ||||
| 1.2s | ||||
| 1.5s | ||||
Table 2.
Computational time(s) of four methods at different time windows
| TW | Method | |||
|---|---|---|---|---|
| CCA | TCCA | FBCCA | FBTCCA | |
| 0.5s | 0.0065 | 0.0681 | 0.0435 | 0.105 |
| 0.6s | 0.0066 | 0.0827 | 0.0437 | 0.1206 |
| 0.7s | 0.0081 | 0.1007 | 0.0518 | 0.1417 |
| 0.8s | 0.0078 | 0.1201 | 0.0510 | 0.1563 |
| 0.9s | 0.0083 | 0.1407 | 0.0543 | 0.1807 |
| 1.0s | 0.0084 | 0.1597 | 0.0519 | 0.2043 |
| 1.2s | 0.0107 | 0.1986 | 0.0667 | 0.2700 |
| 1.5s | 0.0120 | 0.3507 | 0.0749 | 0.4064 |
If TCCA is applied to all subbands decomposed by filter banks, more computation time is needed. The duration of TCCA processing only for SB1 is completely acceptable.
Table 1 shows the average classification accuracy of 9 testees at different time windows of the four methods. Plainly, FBTCCA has the highest classification accuracy among the four algorithms. Compared with the FBCCA, the accuracy of the FBTCCA is remarkably improved in the short time window. FBTCCA has the highest classification accuracy among the four algorithms. Even when the time window is 1s, and the stimulus target is 40, the FBTCCA algorithm has high accuracy. And because FBTCCA has not low computing speed, it can be inferred that FBTCCA in an online system will also have excellent performance. However, the difference between FBCCA and FBTCCA is very small when the data length over 1s, this is related to the high accuracy of FBCCA itself when the data length is long, and the next work is to improve the performance of FBTCCA in a long time window.
To sum up, we put forward TCCA and FBTCCA methods, combined with the filter bank and time information. The experimental results show that for the accuracy of target classification in a BCI system based on SSVEP, especially in the short time window, The performance of TCCA and FBTCCA is better than that of CCA and FBCCA, respectively. In a BCI system with a short time window, TCCA and FBTCCA have great potential.
Acknowledgements
Thanks for the support of science and Technology Department of Shandong Province (2017GGX30103).
Footnotes
Publisher's Note
Springer Nature remains neutral with regard to jurisdictional claims in published maps and institutional affiliations.
Contributor Information
Xinghan Shao, Email: 15064159109@163.com.
Mingxing Lin, Email: mxlin2000@163.com.
References
- Bakardjian H, Tanaka T, Cichocki A. Optimization of SSVEP brain responses with application to eight-command brain–computer interface. Neurosci Lett. 2010;469:34–38. doi: 10.1016/j.neulet.2009.11.039. [DOI] [PubMed] [Google Scholar]
- Chang MH, Lee JS, Heo J, Park KS. Eliciting dual-frequency ssvep using a hybrid ssvep-p300 bci. J Neurosci Methods. 2016;258:104–113. doi: 10.1016/j.jneumeth.2015.11.001. [DOI] [PubMed] [Google Scholar]
- Chaudhary U, Birbaumer N, Ramos-Murguialday A. Brain–computer interfaces for communication and rehabilitation. Nat Rev Neurol. 2016;12:513. doi: 10.1038/nrneurol.2016.113. [DOI] [PubMed] [Google Scholar]
- Chen X, Wang Y, Gao S, Jung TP, Gao X. Filter bank canonical correlation analysis for implementing a high-speed SSVEP-based brain–computer interface. J Neural Eng. 2015;12:046008. doi: 10.1088/1741-2560/12/4/046008. [DOI] [PubMed] [Google Scholar]
- Chen X, Wang Y, Nakanishi M, Gao X, Jung TP, Gao S. High-speed spelling with a noninvasive brain–computer interface. Proc Nat Acad Sci. 2015;112:E6058–E6067. doi: 10.1073/pnas.1508080112. [DOI] [PMC free article] [PubMed] [Google Scholar]
- Chen X, Wang ZJ, McKeown M. Joint blind source separation for neurophysiological data analysis: multiset and multimodal methods. IEEE Signal Process Mag. 2016;33:86–107. doi: 10.1109/MSP.2016.2521870. [DOI] [Google Scholar]
- Cheng M, Gao X, Gao S, Xu D. Design and implementation of a brain–computer interface with high transfer rates. IEEE Trans Biomed Eng. 2002;49:1181–1186. doi: 10.1109/TBME.2002.803536. [DOI] [PubMed] [Google Scholar]
- Dai Y, Wang X, Li X, Tan Y. Sparse EEG compressive sensing for web-enabled person identification. Measurement. 2015;74:11–20. doi: 10.1016/j.measurement.2015.07.008. [DOI] [Google Scholar]
- Feng J, Yin E, Jin J, Saab R, Daly I, Wang X, Hu D, Cichocki A. Towards correlation-based time window selection method for motor imagery BCIS. Neural Netw. 2018;102:87–95. doi: 10.1016/j.neunet.2018.02.011. [DOI] [PubMed] [Google Scholar]
- Gao S, Wang Y, Gao X, Hong B. Visual and auditory brain–computer interfaces. IEEE Trans Biomed Eng. 2014;61:1436–1447. doi: 10.1109/TBME.2014.2321007. [DOI] [PubMed] [Google Scholar]
- He B, Baxter B, Edelman BJ, Cline CC, Wenjing WY. Noninvasive brain–computer interfaces based on sensorimotor rhythms. Proc IEEE. 2015;103:907–925. doi: 10.1109/JPROC.2015.2407272. [DOI] [PMC free article] [PubMed] [Google Scholar]
- Herrmann CS. Human eeg responses to 1–100 hz flicker: resonance phenomena in visual cortex and their potential correlation to cognitive phenomena. Exp Brain Res. 2001;137:346–353. doi: 10.1007/s002210100682. [DOI] [PubMed] [Google Scholar]
- Hwang HJ, Lim JH, Jung YJ, Choi H, Lee SW, Im CH. Development of an SSVEP-based BCI spelling system adopting a qwerty-style led keyboard. J Neurosci Methods. 2012;208:59–65. doi: 10.1016/j.jneumeth.2012.04.011. [DOI] [PubMed] [Google Scholar]
- Hwang J, Nam K, Jang D, Kim I. Effects of spectral smearing of stimuli on the performance of auditory steady-state response-based brain–computer interface. Cogn Neurodyn. 2017;11(6):515–527. doi: 10.1007/s11571-017-9448-y. [DOI] [PMC free article] [PubMed] [Google Scholar]
- Jiao Y, Zhang Y, Wang Y, Wang B, Jin J, Wang X. A novel multilayer correlation maximization model for improving CCA-based frequency recognition in SSVEP brain–computer interface. Int J Neural Syst. 2018;28:1750039. doi: 10.1142/S0129065717500393. [DOI] [PubMed] [Google Scholar]
- Lance BJ, Kerick SE, Ries AJ, Oie KS, McDowell K. Brain–computer interface technologies in the coming decades. Proc IEEE. 2012;100:1585–1599. doi: 10.1109/JPROC.2012.2184830. [DOI] [Google Scholar]
- Lay-Ekuakille A, Vergallo P, Griffo G, Conversano F, Casciaro S, Urooj S, Bhateja V, Trabacca A. Entropy index in quantitative EEG measurement for diagnosis accuracy. IEEE Trans Instrum Meas. 2013;63:1440–1450. doi: 10.1109/TIM.2013.2287803. [DOI] [Google Scholar]
- Lin Z, Zhang C, Wu W, Gao X. Frequency recognition based on canonical correlation analysis for SSVEP-based bcis. IEEE Trans Biomed Eng. 2006;53:2610–2614. doi: 10.1109/TBME.2006.886577. [DOI] [PubMed] [Google Scholar]
- Miao Y, Yin E, Allison BZ, Zhang Y, Chen Y, Dong Y, Wang X, Hu D, Chchocki A, Jin J. An ERP-based BCI with peripheral stimuli: validation with ALS patients. Cogn Neurodyn. 2020;14(1):21–33. doi: 10.1007/s11571-019-09541-0. [DOI] [PMC free article] [PubMed] [Google Scholar]
- Muller KR, Anderson CW, Birch GE. Linear and nonlinear methods for brain–computer interfaces. IEEE Trans Neural Syst Rehabil Eng. 2003;11:165–169. doi: 10.1109/TNSRE.2003.814484. [DOI] [PubMed] [Google Scholar]
- Nakanishi M, Wang Y, Wang YT, Jung TP. A comparison study of canonical correlation analysis based methods for detecting steady-state visual evoked potentials. PLoS ONE. 2015;10:e0140703. doi: 10.1371/journal.pone.0140703. [DOI] [PMC free article] [PubMed] [Google Scholar]
- Poryzala P, Materka A. Cluster analysis of CCA coefficients for robust detection of the asynchronous SSVEPS in brain–computer interfaces. Biomed Signal Process Control. 2014;10:201–208. doi: 10.1016/j.bspc.2013.11.003. [DOI] [Google Scholar]
- Wang H. Temporally local maximum signal fraction analysis for artifact removal from biomedical signals. IEEE Trans Signal Process. 2010;58:4919–4925. doi: 10.1109/TSP.2010.2052047. [DOI] [Google Scholar]
- Wang H, Xu D. Comprehensive common spatial patterns with temporal structure information of EEG data: minimizing nontask related EEG component. IEEE Trans Biomed Eng. 2012;59:2496–2505. doi: 10.1109/TBME.2012.2205383. [DOI] [PubMed] [Google Scholar]
- Wang H, Zhang Y, et al. Detection of motor imagery EEG signals employing naïve bayes based learning process. Measurement. 2016;86:148–158. doi: 10.1016/j.measurement.2016.02.059. [DOI] [Google Scholar]
- Wang Y, Gao X, Hong B, Jia C, Gao S. Brain–computer interfaces based on visual evoked potentials. IEEE Eng Med Biol Mag. 2008;27:64–71. doi: 10.1109/MEMB.2008.923958. [DOI] [PubMed] [Google Scholar]
- Yin E, Zhou Z, Jiang J, Yu Y, Hu D. A dynamically optimized SSVEP brain–computer interface (BCI) speller. IEEE Trans Biomed Eng. 2014;62:1447–1456. doi: 10.1109/TBME.2014.2320948. [DOI] [PubMed] [Google Scholar]
- Yuan P, Chen X, Wang Y, Gao X, Gao S. Enhancing performances of SSVEP-based brain–computer interfaces via exploiting inter-subject information. J Neural Eng. 2015;12:046006. doi: 10.1088/1741-2560/12/4/046006. [DOI] [PubMed] [Google Scholar]
- Zhang R, Xu P, Liu T, Zhang Y, Guo L, Li P, Yao D. Local temporal correlation common spatial patterns for single trial EEG classification during motor imagery. Comput Math Methods Med. 2013;2013:591216. doi: 10.1155/2013/591216. [DOI] [PMC free article] [PubMed] [Google Scholar]
- Zhang Y, Zhou G, Jin J, Wang M, Wang X, Cichocki A. L1-regularized multiway canonical correlation analysis for SSVEP-based BCI. IEEE Trans Neural Syst Rehabil Eng. 2013;21:887–896. doi: 10.1109/TNSRE.2013.2279680. [DOI] [PubMed] [Google Scholar]
- Zhang Y, Dong L, Zhang R, Yao D, Zhang Y, Xu P. An efficient frequency recognition method based on likelihood ratio test for SSVEP-based BCI. Comput Math Methods Med. 2014;2014:908719. doi: 10.1155/2014/908719. [DOI] [PMC free article] [PubMed] [Google Scholar]
- Zhang Y, Xu P, Cheng K, Yao D. Multivariate synchronization index for frequency recognition of SSVEP-based brain–computer interface. J Neurosci Methods. 2014;221:32–40. doi: 10.1016/j.jneumeth.2013.07.018. [DOI] [PubMed] [Google Scholar]
- Zhang Y, Zhou G, Jin J, Wang X, Cichocki A. Frequency recognition in SSVEP-based BCI using multiset canonical correlation analysis. Int J Neural Syst. 2014;24:1450013. doi: 10.1142/S0129065714500130. [DOI] [PubMed] [Google Scholar]
- Zhang Y, Zhou G, Jin J, Wang X, Cichocki A. Ssvep recognition using common feature analysis in brain–computer interface. J Neurosci Methods. 2015;244:8–15. doi: 10.1016/j.jneumeth.2014.03.012. [DOI] [PubMed] [Google Scholar]
- Zhang Y, Guo D, Xu P, Zhang Y, Yao D. Robust frequency recognition for SSVEP-based BCI with temporally local multivariate synchronization index. Cogn Neurodyn. 2016;10:505–511. doi: 10.1007/s11571-016-9398-9. [DOI] [PMC free article] [PubMed] [Google Scholar]
- Zhang Y, Wang Y, Jin J, Wang X. Sparse bayesian learning for obtaining sparsity of EEG frequency bands based feature vectors in motor imagery classification. Int J Neural Syst. 2017;27:1650032. doi: 10.1142/S0129065716500325. [DOI] [PubMed] [Google Scholar]
- Zhang Y, Yin E, Li F, Zhang Y, Tanaka T, Zhao Q, Cui Y, Xu P, Yao D, Guo D. Two-stage frequency recognition method based on correlated component analysis for SSVEP-based BCI. IEEE Trans Neural Syst Rehabil Eng. 2018;26:1314–1323. doi: 10.1109/TNSRE.2018.2848222. [DOI] [PubMed] [Google Scholar]