

Abstract
Current prostheses are limited in their ability to provide direct sensory feedback to users with missing limb. Several efforts have been made to restore tactile sensation to amputees but the somatotopic tactile feedback often results in unnatural sensations, and it is yet unclear how and what information the somatosensory system receives during voluntary movement. The present study proposes an efficient model of stacked sparse autoencoder and back propagation neural network for detecting sensory events from a highly flexible electrocorticography (ECoG) electrode. During the mechanical stimulation with Von Frey (VF) filament on the plantar surface of rats’ foot, simultaneous recordings of tactile afferent signals were obtained from primary somatosensory cortex (S1) in the brain. In order to achieve a model with optimal performance, Particle Swarm Optimization and Adaptive Moment Estimation (Adam) were adopted to select the appropriate number of neurons, hidden layers and learning rate of each sparse auto-encoder. We evaluated the stimulus-evoked sensation by using an automated up-down (UD) method otherwise called UDReader. The assessment of tactile thresholds with VF shows that the right side of the hind-paw was significantly more sensitive at the tibia-(p = 6.50 × 10⁻⁴), followed by the saphenous-(p = 7.84 × 10⁻⁴), and sural-(p = 8.24 × 10⁻⁴). We then validated our proposed model by comparing with the state-of-the-art methods, and recorded accuracy of 98.8%, sensitivity of 96.8%, and specificity of 99.1%. Hence, we demonstrated the effectiveness of our algorithms in detecting sensory events through flexible ECoG recordings which could be a viable option in restoring somatosensory feedback.
Keywords: Sensory discrimination, Sensory feedback, Deep neural network model, Neural interface model, ECoG recordings
Introduction
Prostheses are indispensable for amputees in restoring their lost motion functions. In addition, the sense of touch is essential for realizing dexterous manipulation of objects, transfer of emotions, and providing of responses to amputees (Antfolk et al. 2013). However, lack of sensory feedback function is a major drawback with the current prosthesis system which often limits their acceptance by amputees (Cordella et al. 2016). Several efforts have been made to realize possible sensory feedback with prostheses for limb amputation by electrically stimulating either invasively the somatosensory cortex (Flesher et al. 2016) or peripheral nerves (Schiefer et al. 2016), and non-invasively the skin surface of the residual limb (Stephens-Fripp et al. 2018). Nevertheless, it’s yet unclear how and what information the somatosensory system receives during voluntary movement from invasive or non-invasive system.
Previous studies on metastability of brain-state reveals that human cognition is responsible for brain dynamics (Mora-Sánchez et al. 2019; Roberts et al. 2019), and such aspect of the brain function can be understood by the use of temporal dynamics (Rao 2018). To address this gap, Rao et al. (2018) proposed a computational model for integrating multiple sensory information which involves real temporal dynamics. He demonstrated how multisensory learning improves the system performance when measured separately. In our earlier work (Fang et al. 2015), we aimed at developing a multifunctional prostheses to aid in restoring limb abilities by formulating two control strategies to integrate electromyogram (EMG) signals recorded from residual muscles, and speech signals. Our experimental results suggested that the performance of prosthetic control could be improved by combining multiple signals. Meanwhile, the use of EMG in the control of upper limb prosthesis requires that the amputees possess adequate myoelectric signals from their residual limb. To buttress this point, previous work has shown that higher-level amputation do not usually have enough residual limb muscles to generate sufficient EMG signals for limb movement (Li et al. 2019). Hence, the use of brain signals have been proposed and successfully applied to facilitate the control of prosthesis (Samuel et al. 2017). To further investigate how the brain detects useful information for feedback purpose, it is critical to examine the quality of neural signals recorded from the brain, and how well they are being processed (Waldert 2016). It is in this line of thought we conducted the current study.
Primarily, the invasive sensory feedback system involves a direct interface with the nerves, whereas the mechanoreceptors in the non-invasive system are responsible for transforming touch stimuli at the surface of the skin into electrical impulses (Randall 1996). Ultimately, both the invasive and non-invasive methods are required to build a neural interface for transmitting neural feedback signals into the brain for the purpose of realizing intuitive sensory perception which guides the prosthetic hand movement in the manipulation process resulting in a closed-loop system (Svensson et al. 2017). Recently, different neural interface systems have been developed to connect the brain and the external world such as brain computer interface (BCI) or brain machine interface (BMI) to assist people with motor impairment or amputees (Hatsopoulos and Donoghue 2009; Choi et al. 2017). And a variety of neural activities such as; electroencephalography (EEG) for recording electrical activity of the brain through a small electrode attached to the scalp (Samuel et al. 2017), Micro-electrode arrays (MEAs) for recording neural signals by direct interface with neurons in the brain to produce spiking activity of the individual neurons such as the extracellular action potentials (EAPs) and the local field potentials (LFPs) (Kim et al. 2018; Thakor 2013; Obien et al. 2015), and the recording of electrical activity from the brain cortex using electrocorticography (ECoG) have also been investigated in the context of closed-loop system and applications (Hill et al. 2012; Caldwell David et al. 2019). For example, Wang et al. (2015) demonstrated that EEG signals could be used to discriminate the location of tactile stimulus by event-related brain potential of the evoked responses. As a result of the low amplitude of EEG signals, a preprocessing technique was applied in removing artifacts from the raw signals in order to boost the signal level before extracting the relevant features. EEG signal has also played an important role in evaluating hearing aid features. Bernarding et al. (2017) investigated the effects of using different hearing aid settings on listening efforts. The settings were a combination of directional microphone with noise reduction algorithm tested in a medium and strong surrounding. Their findings revealed that EEG estimate of listening effort was able to map the exerted effort of the participants. Besides, most of the proposed feature extraction methods for EEG features were handcrafted techniques such as the standard deviation (SD), Fast Fourier transform (FFT) (Chen 2014; Ravish et al. 2013), Principal component analysis (PCA), discrete wavelet transform (DWT) (Sharmila and Mahalakshmi 2017; Wang et al. 2010), and power spectral density (PSD) (Wang et al. 2015). Although they all achieved relatively good performance (Rahman et al. 2012; Azlan and Low 2014), but their lack of robustness and complex approach which require a special skill to perform necessitate the need for better approach. Alternatively, a higher frequency spike signal or LFP was explored to discriminate the different sensory events by the use of single channel (Raspopovic et al. 2010), and multichannel MEAs (Lefebvre et al. 2016). However, one major challenge in extracting useful information from microelectrode recordings is the Spike-sorting. Therefore, different strategies and algorithms have been proposed to improve the performance of spike-sorting technique (Rey et al. 2015; Caro-Martín et al. 2018). On the contrary, the acquisition of spike signals through the penetration of electrode into the brain is likely to damage the brain tissue after a period of time. To circumvent this difficulty, a less-invasive method of using ECoG which is also able to provide a higher spatial resolution as well as higher signal-to-noise ratio than the EEG counterpart is a viable option (Kaiju et al. 2017).
In recent times, ECoG has offered clinical applications in the treatment of brain related diseases such as epilepsy and Parkinson’s disease (Caldwell et al. 2019). And different algorithms have been proposed for the detection of induced seizures. For instance, Niknazar et al. (2013) proposed a unified approach consisting of thresholding, and classification with several features for the detection of seizures in the epileptic rats. Furthermore, Mohammadpoor et al. (2019) suggested an approach for transforming time series into complex networks based on visible graph for the detection of epileptic seizures in rats. In previous studies, manual feature extraction was employed to extract features from brain activity before classification. It is impractical to perform real time classification with this technique considering the non-stationary nature and huge amount of EEG data. To address this limitation, Mohammadpoor et al. applied artificial neural network in his work (Mohammadpoory et al. 2019) for automatic detection of seizures from the ECoG signals. However, the traditional neural network is faced with the difficulty of weights initialization. Such that small weights initialization may lead to weight diffusion, and large weights initialization may lead to poor local minima (Hinton and Salakhutdinov 2006). Therefore, the recent development in deep learning has presented a feasible approach of extracting features automatically through the hidden layer. Deep neural networks are efficient tool for feature learning with the ability to represent high-level abstractions in complex data (Roy et al. 2019). Unlike the conventional machine learning method of handcrafted feature extraction which mainly depends on priori knowledge of designers, and is quite impossible to take the advantage of complex data. Deep learning has shown remarkable success in extracting features that enhances state-of-the-art performance for dealing with BCI or BMI tasks such as prediction of epileptic seizures (Daoud and Bayoumi 2019; Meisel and Bailey 2019), prediction of movement intentions in amputees (Idowu et al. 2018), and control of prosthetic arm (Volkova et al. 2019). Considering the multiple advantages of ECoG signal, including stability of recordings, and lower risk. These features make ECoG more attractive for sensory feedback applications by directly stimulating the somatosensory cortex (Cronin et al. 2016; Hiremath et al. 2017; Umeda et al. 2019). However, this method does not yet reveal how information was received from the somatosensory system during voluntary movement. In order to achieve this gap, the current study investigates the process of tactile discrimination using von Frey (VF) filaments to examine the sensory thresholds of peripheral nerve movement in rats. Simultaneously, the ECoG recordings of sensory events were collected from the somatosensory cortex using a highly flexible ECoG electrode.
Generally, VF filament is a reliable clinical tool for evaluating sensory feedback in rodents (Nedic et al. 2013), and because of its different grades of filaments (Lambert et al. 2009), it has been used to measure the level of evoked sensitivity at regions of the dermal layers. Usually, a series of weighted tips (0.4-15 g) are manually applied to test the stimulus response, and various methods for using these tips to assay mechanical sensitivity exists for many years. Among these methods, the up-down approach which was first proposed by Dixon (1980), and later modified by Chaplan et al. (1994) for application in rat model remains the most commonly used method. This method proved to be accurate when calculating the 50% thresholds from raw data, but require a complex and time-consuming steps. Hence, a computer program called Up–Down Reader (UDReader) was developed to streamline the calculation by translating the VF assessments in the form of portable document file (PDF) format into 50% thresholds based on the up-down approach (González-Cano et al. 2018). This is an open source program which has been tested and validated as efficient method of processing 50% VF thresholds, and can be used to reduce the processing time. While the nerve functions are being examined, a highly stretchable ECoG electrode was used to collect neural activity from the brain of five rats as shown in Fig. 1a. After conducting series of experimental trials on five rats, neural signals acquired by mechanically stimulating the plantar surface of the hind paw was extracted using the deep learning technique. A stacked sparse auto-encoder (SSAE) model was used to learn the inherent features from the stimulus responses in an unsupervised manner after pre-training. Furthermore, the learned features were used to train a back propagation neural network (BPNN) in order to automatically detect the sensory events from the different nerve locations (saphenous, tibia, and sural). To determine the appropriate number of neurons, the hidden layer, and the learning rate of each auto-encoders (AEs) which are the key factors that determines the performance of the neural network design, a Particle Swarm Optimization (PSO) and Adaptive Moment Estimation (Adam) were adopted respectively to optimize the parameters of the SSAE and the entire network model. We demonstrated that combining PSO and Adam algorithms hold great potential for optimizing parameter settings in the AE network, and thus saves valuable computational resources during the pre-training and fine-tuning process of SSAE and BPNN model.
Fig. 1.

Experimental process of tactile feedback and sensory event detection, a ECoG display before covering of the brain opening, b after covering of the flexible ECoG electrode in the brain. When the VF filament is applied on the rat’s plantar surface, signals are amplified and transmitted wirelessly, a wireless receiver collected the signal and then displayed it through a PC. Finally, the signals were processed to detect the sensory events, and c The corresponding paw withdrawal reflex actions as observed from the ECoG signal recordings
The rest of this manuscript is organized as follows. Section II describes the experimental procedure of how the fabricated flexible ECoG was used to obtain tactile signals from the evoked responses. In Section III, the basic principle of BPNN and the training process of the proposed SSAE_BPNN model are briefly reviewed. The impact of PSO and Adam optimization technique in the training model are presented. In Section IV and V, the paw withdrawal threshold (PWT) assessment results are shown and discussed, likewise the detection model results are evaluated and compared with the component model and the state-of-the-art model. Finally, we draw the conclusion in Section VI.
Materials and methods
Highly flexible ECoG electrodes
For the purpose of this study, the neural interface device used for recording the ECoG signals was fabricated. The fabrication process is illustrated in (Zhao et al. 2018). At first, a silicon wafer (clean) was evaporated with 1H, 1H, 2H, 2H-perfluoro-octyl-trichlorosilane (PFOTS) monolayer in order to extract the polydimethylsiloxane (PDMS) membrane after the fabrication is done. We further combined the PDMS (Sylgard 184) pre-polymer and cross-linker in weight ratio 10:1, and then spun onto a silicon wafer at 600 RPM for 60 s to obtain the target thickness of 100 µm, and afterwards the PDMS was cured for 3 h at 80 °C. In addition, we performed surface treatment of the plasma with 30 W, 30 s on the PDMS, and later used a magnetic sputtering of JS4S-75G to deposit an adhesion layer (chromium) of 3 nm thickness and a gold film of 25 nm thickness through a masked stainless steel. And lastly, we obtained the flexible gold film electrodes by removing the masked steel after the sputtering process was completed. The preliminary work has been reported (Idowu et al. 2018), and achieved better ECoG recordings with high spatial resolution when implanted in rat’s brain cortex.
Experimental procedure and system setup
In this study, we implanted the flexible ECoG electrode in the same manner (Idowu et al. 2018) on the surface of rat’s brain cortex. The experiment was performed on a mixture of three male and two female Sprague–Dawley rats in the laboratory. Each rat weighing ~ 350 g, and was kept under controlled conditions with ad libitum access to food and water. Prior the exploratory, all experimental and surgical procedures were approved by the committee on use and care of Animals at the Shenzhen Institutes of Advanced Technology, Chinese Academy of Sciences. At the commencement of the experiment, the rats were first anaesthetized for 10 min and subsequently the surgery was performed one at a time. Figure 1a shows the ECoG recordings after the experimental procedure of removing the outer layer of the skull has been performed. The highly flexible ECoG electrode was attached to the stereotaxic stand, and gradually released unto the surface of the brain called the primary somatosensory cortex (S1). The electrode was properly positioned to the recording area, after which the opening was covered. To implant the electrode, the stereotaxic stand was placed over the rats, while the flexible ECoG electrode was firmly fixed across the arm of the stereotaxic stand, and then gradually released until the electrode made firm contact with the surface of the brain cortex.
Furthermore, the ground wire was wrapped around the ground screws, and the flexible ECoG electrode was covered with gelfoam soaked in saline. A UV-curable dental acrylic was applied to the gelfoam covering the electrode to establish a stable head stage. After the head stage was successfully formed, the ECoG acquisition system (NCC medical Co., electro-neurophysiology device) was configured as shown in Fig. 1b. From the system setup, the rat’s head cap was connected to a digital head stage attached to an amplifier with an inbuilt wireless transmitter. The amplified and the digitized signals were sent to the wireless receiver which is directly connected to the PC where the ECoG signals were recorded. And lastly, the signals were processed to detect the sensory events.
Mechanical stimulation with VF filament
Tactile sensation was evaluated by mechanical stimulation through the commonly used VF filament (North Coast Medical Inc., Morgan Hill, USA) of weighted tips and calibrated bending force of 5 g. The stimulation was achieved randomly on both the right and the left side of the hind-paw across the five rats. The rats were placed in acrylic glass cage set on a mesh floor stand, through which the hind paws of each rat can easily be accessed. Only two investigators were present during the stimulation, one was operating the VF apparatus while the other was recording the withdrawal threshold value. The rats were allowed 15 min to acclimatize with their new environment before the commencement of stimulation process. Measurements were performed at three different locations of the plantar surface of the hind-paw bilaterally: on the sural nerve (right-left), saphenous nerve (right-left), and the tibia nerve (right-left). The right side was always tested first, and then followed by the left. Each locations was tested twenty times; hairs were applied perpendicular to the plantar surface in up-down manner. The corresponding paw withdrawal reflex actions were observed from the ECoG signal recordings as shown in Fig. 1c.
They were applied in order of increasing VF hairs (or tips) starting from the mid-range filament, until a positive threshold was reached and recorded as ‘X’. One filament strength is tested in each row until either all five rows were filled out, or there is no further filament strength to test. Once the rat could at least positively feel the hair eighteen times out of twenty, then a positive threshold is said to be detected, and if otherwise a negative threshold was recorded as ‘O’. A template sheet comprising of tables was designed by Gonzalez-Cano et al. (2018), for recording the allowable forces ranging from 0.6 to 15 g which corresponds to 5.88–147 mN in rats. After the assessment of five rats, and the sheet was completely filled (40 individual tables per template sheet), the sheet was then scanned as single page PDF document, and finally loaded into the UDReader program which automatically calculate each table’s 50% threshold.
Unlike the classical method of calculating 50% threshold which is based on the look-up table (Chaplan et al. 1994), and the simplified approach (Bonin et al. 2014), the proposed method is faster and automatically generates 50% threshold without needing to add adjustment factor (±) to the final filament value. Figure 2 illustrates an automated tactile assessment process flow which begins with the middle VF filament, followed by the application of up-down method in four additional trials, and finally the use of UDReader to calculate PWT.
Fig. 2.

An automated tactile assessment process flow
Statistical analysis
All statistical analysis were performed using R studio programming language for Windows (version 3.5.2). After obtaining the assessment results with UDReader, the PWT distribution were analyzed with the aid of normal probability Q–Q (quantile–quantile) plots before and after log transformation was applied. Further analysis of PWT distribution were carried out using box plots before and after log transformation to illustrate the effects of outliers. The transformation of PWT (non-linear) distribution to log PWT (very close to normal curve) were performed using Blom’s formula. In our analysis, we compared log PWT across trials between the right and the left side of the hind-paw using paired t test, repeated measured analysis of variance (ANOVA) to analyze the mean difference between testing locations (sensitivity to VF filament across saphenous, tibia and sural), and post hoc comparisons (paired t-tests with Bonferroni correction) of three testing locations based on either left or right side, and their sensitivity to VF filament. The statistical significance value was set at .
ECoG data collection and preprocessing
During the mechanical stimulation, sensory stimuli were relayed to the brain through the afferent pathway by tactile afferent signals (TAS). The elicited paw withdrawal response was detected from the brain activity and simultaneous recordings was made directly from the S1 by the use of a highly flexible ECoG electrode with 8 channels. After the first trial, we saw that the recorded ECoG signals from each of the 8 channels of electrode were okay before proceeding with the rest of the experiment. At every 2 s intervals and a rest of 2 s, the ECoG data corresponding to the evoked responses were recorded at a sampling rate of 32 kHz. Furthermore, the recorded signals were stored for an offline preprocessing and analysis for the detection of sensory events.
The acquired ECoG signals were preprocessed with a band bass filter between 300 Hz and 7000 Hz by the use of MATLAB (R2018b), because series of trials performed within the frequency range showed some accurate measure of task-related activity. We then applied a notch filter of 50 Hz to remove the power line noise as well as similar interferences from the signal waveform. Thereafter, the preprocessed signals were segmented into a series of 200 ms analysis window with an increment of 100 ms.
Proposed SSAE and BPNN model
The proposed SSAE was used to extract relevant features in an unsupervised manner before the features are being fed into BPNN for pre-training to obtain a more suitable initial weights and subsequently the fine-tuning process. Generally, an AE consists of one input layer, one hidden layer and one output layer fully connected together. A multi-layer neural network is then realized by stacking multiple AEs together to form a Stacked Auto-Encoder (SAE). Because the minimization of the loss function is likely to train the SAE as identity function when the number of neurons in the hidden layer is larger than that of the input layer, a sparsity constraint is therefore imposed by the SAE on the hidden layers to estimate the input data structure. Hence, the entire structure of SSAE is proposed in this study. In addition to pre-training and fine-tuning process, the BPNN model was used to update the weights and biases in the direction of the negative gradient of the performance function. Meanwhile, the PSO and Adam are used to optimize the network structure by influencing the number of neurons and hidden layer, as well as reducing the training time respectively to further improve the detection accuracy in the following ways;
The principle of BPNN
To better understand the operation of BPNN, the diagram of BPNN shown in Fig. 3 illustrates the back propagation algorithm. This comprises of input layer with input nodes , and a number of hidden layers. The weights of network are regulated by the error feedback. Such that the difference between the computed output data and the desired output data of the neural network is known as the error function. The biases are set to +1, and the activation unit of the ith neuron of the kth layer is . The outputs are controlled by applying weights and which connects the jth neuron and the ith neuron in each kth layers together. Thus, the weighted sum of the inputs to neuron i in the layer k is computed in formula (1).
| 1 |
Fig. 3.

Proposed SSAE_BPNN model
The activation unit of the kth layer is given as; and the sigmoid function of the hidden layers is computed in formula (2).
| 2 |
BPNN adopts the “error” learning principle. An error signal is propagated from the output to the input layer in a typical multilayer neural network and the parameters of the decoder and the encoder is adjusted, the error between the output data and the original data are minimized by pre-training. The error function between the desired output and the computed output of the neural network with respect to the input uses the mean squared error as shown in formula (3).
| 3 |
Since the goal of BPNN is to minimize the error function with respect to weight of the neural network. We compute the value of for each weight using formula (4).
| 4 |
Considering that the error function is decomposed into individual error terms. Which implies that each individual error terms can be calculated separately and then combined at the end. Thus, the derived error function term is computed in formula (5).
| 5 |
Beginning from the output layer, backpropagation tries to define error associated with the output layer by expressing the error function in terms of activation value as shown in formula (6).
| 6 |
Therefore, by adopting the chain rule and applying partial derivative the error of the output layer is given as;
| 7 |
Meanwhile other layers; are computed as;
| 8 |
To adjust the connection weights and the biases, the partial derivatives is expressed in formula (9) and (10).
| 9 |
| 10 |
The training process of SSAE_BPNN model
We adopt the pre-training and fine-tuning process for our proposed model. The pre-training is used to train the SSAE, while the BPNN is used in the fine-tuning process. Three hidden layers and a three-stage process are considered in this structure. In the first stage, the encoder transforms the input into a low or high dimensional feature, while the decoder reconstruct the original data. The backpropagation was used to minimize the reconstruction error to obtain an optimal reconstruction. A set of parameters such as the biases of the encoder and decoder, as well as the weight matrices of the encoder and decoder were obtained through back propagation at this stage. In the second stage, a new hidden layer and output layer are stacked into the existing AE, and further combined with the existing hidden layer as the input to form a new AE. A set of parameters were equally obtained through backpropagation by the second AE. Repeating the same process can produce many autoencoders. But for the sake of this study, three AEs are stacked together so as to reduce computational complexity. The pre-training process is referred to the first and the second stages which builds three stacked AEs comprising of three hidden layers and equally trains the initial weights of the network. In the third stage, a SSAE_BPNN was formed by including the output layer, and initializing a set of parameters between the last hidden layer and the output layer. At this stage, the BPNN model was used to train all the weights and biases through the process of fine-tuning. Due to the problem associated with AE not been able to extract meaningful features from the input data, although the original input data are completely recovered from the output layer. A sparsity constraint was imposed on the hidden layers by SAE to obtain a more efficient low-dimensional features that better characterize the input data. As a result, only few hidden neurons are activated in the entire network. Usually, a neuron is either treated as active or inactive when its output is close to 1 or 0 respectively. By setting , as the mean activation of the hidden neuron j, where the activation of the network is given a specific input x. The parameter ρ, whose value approaches a zero was used to impose sparsity on the network to the point when . Therefore, the Kullback–Leibler (KL) divergence computed in formula (11) is applied to calculate the difference between the actual and the observed probability distribution. It is referred to penalty term because it penalizes for deviating from ρ.
| 11 |
At that point, the error function of the sparse AE is composed of two parts namely: the mean square error and the regularization term as shown in formula (12)
| 12 |
where m is the number of hidden units and is the weighting factor that controls the sparsity penalty term. In addition, the weight attenuation items is added to the error function in order to prevent overfitting as shown in formula (13). Where λ is the attenuation coefficient of the weight.
| 13 |
During the learning process, the error function of the sparse AE is eventually minimized by updating W and b. Before each iteration, the hidden layers and the output layer components in the error function should be known. Also, it is mandatory to compute the partial derivatives of the error function with respect to W and b. In this regard, a relatively low memory requirement Adam optimization algorithm would be an appropriate method for updating W and b in the backpropagation process which we also adopt in this paper.
Proposed optimization model
Adaptive moment estimation (Adam) optimization
The commonly used gradient descent optimization method such as the stochastic gradient descent and the mini-batch gradient descent adopts a fixed learning rate for all parameters, and thus leads to either slow convergence when the rate is small or fail to converge when the rate is enormously large. In this paper, we adopt the Adam algorithm which is considered an adaptive learning rate method of evaluating individual learning rates for different parameters. It was proposed by Kingma and Ba (2014) to realize a dynamic adaptive adjustment of different parameters by combining gradient descent with momentum and Root Mean Square Propagation (RMSprop) in order to train a better SSAE network. It performs its operation by first estimating an exponentially weighted average of past gradients, and then storing it in variables before bias correction ( and ) and with bias correction ( and ). It further calculates an exponentially weighted average of the squares of the past gradients, and stores it in variables before bias correction ( and ) and with bias correction ( and ). And finally, the parameters W and b were updated using formula (22) and (23).
We first initialize ,, and to zero. In each iteration, the derivatives dw and db are computed on a current mini-batch. And then and are updated like momentum as shown in formula (14) and (15).
| 14 |
| 15 |
Likewise, and are updated like RMSprop as shown below.
| 16 |
| 17 |
Therefore, the bias correction are implemented as follows in Adam optimization.
| 18 |
| 19 |
| 20 |
| 21 |
The updated W: and b: are computed below;
| 22 |
| 23 |
where the hyper-parameters and that controls the two exponentially weighted averages are set at default value; = 0.9 and = 0.999. Alpha is the learning rate with a range of values (0.001 to 0.01). And epsilon serves as a negligible constant of that prevented the denominator from reaching zero.
Particle swarm optimization (PSO)
In the global optimization phase, PSO was used to find the optimal initial weights and thresholds value of the neural network in the global search space, that is, the connection weight of the network input layer to the hidden layer, the hidden layer threshold, the connection weight from the hidden layer to the output layer, and the output layer threshold. Unlike the traditional empirical method of manual parameter settings (trial and error method) and grid search approach of determining the number of hidden layers and the number of nodes in a deep learning network which are error-prone and time-consuming, the PSO is an intelligent evolutionary technique that optimizes a problem by iterative method to improve a candidate solutions with respect to a given measure of quality. Each particle is regarded as a possible solution to the optimization problem, and comprises of position, speed and a fitness value which is determined by an optimization function. Thus, the application of PSO algorithm in this study helps to remove complexity and also enhance the convergence speed (Shi 2001).
In our implementation of PSO, we first defined the parameters (such as population size, speed and position of particles, and iterations). During the training of BPNN, the PSO is used to search for better values by each position particle expressed as;, where R is the position vector which maps the weights and threshold values as;. And R, and N are the number of nodes in the input layer, hidden layer and output layer of the BPNN respectively. To calculate fitness value of each particle, the fitness function is defined as the error sum of squares of the BPNN expressed as;. Search for the personal best (Pbest) for each particles and the global best (Gbest) for the population. The speed and position of particles are updated constantly using formulas (24) and (25) shown below:
| 24 |
| 25 |
where is the inertia weight; t is the number of iterations; is the speed of particle , and are acceleration factor which are 1.5 and 2 respectively; and and are arbitrary numbers between 0 and 1.
Finally, the iteration judgement determines whether to end the optimization if the evaluation function converges (fitness variance of the particle is smaller than the given threshold) and the optimal solution is output as the initial weights and thresholds; otherwise, the iterations continue.
Combined Adam and PSO algorithm
Figure 4 illustrates the proposed BPNN model with a combined PSO + Adam algorithm, which is hereafter referred to as BPNN + PSO + Adam for the purpose of evaluation. In the illustration, the PSO is introduced at the global optimization to optimize the initial point to the global extreme value. At this point, the probability of local suboptimal convergence and minimax point is reduced, the model error is further reduced in order to improve the detection accuracy. Meanwhile, the introduction of Adam at the localization stage was to calculate the learning rate adaptively for each parameter in a simple and more efficient way.
Fig. 4.

Proposed BPNN model combined with PSO + Adam algorithm
In the training phase of the BPNN, the combined PSO + Adam algorithm first randomly initialize parameters and then performs PSO global optimization based on the iteration of the particles. If the PSO’s solution is satisfactory within a limited iterations, the training is terminated. However, if the solution is not satisfactory, all particles are subjected to fitness sequence by importing optimal and initial weighted thresholds of multiple particles into the neural network, and then applying Adam for local optimization. If the Adam’s solution is satisfactory within the limited iterations, the training is terminated. Otherwise the PSO is restarted at the global optimization phase. After the optimal weight and threshold value are obtained, the learning error rate is calculated to correct the connection weight values and the thresholds of the layers. If the error satisfies the expected requirements and the number of iterations has reached the targeted training time, the training is terminated. Otherwise, process continues. After the training is completed, the output results are passed unto a softmax layer for evaluation.
Performance evaluation
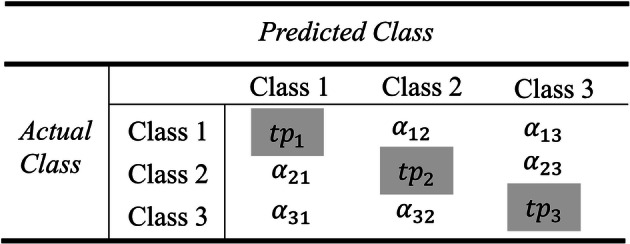
After a successful feature extraction method, a tenfold cross validation technique was used to partition the feature vector into training and testing sets. Such that one dataset was divided randomly into 10 parts, in which the first experiment made use of one-tenth of the data as testing while the remaining 9 of those parts are used for training, and the second experiment continues with the second partition until the tenth partition was completed. Then a neural network was trained to detect the sensory events from ECoG signals using the backpropagation and the optimization algorithms, namely BPNN, BPNN + Adam, BPNN + PSO, BPNN + PSO + Adam, and with SVM model for better comparison. All the five algorithms were tested and evaluated using the multiclass confusion matrix in Table 1. The confusion matrix was used to obtain the classification accuracy (CA) using formula (26). Other important metrics used in the medical field such sensitivity (Sen.) and specificity (Spec.) are calculated using the formulas (27) and (28).
| 26 |
| 27 |
| 28 |
Table 1.
Multiclass confusion matrix
Results
The experimental results obtained in this study are divided into two parts; first is the assessment of PWT by mechanical stimulation with VF filament, and the second is the results of the sensory event detection by the proposed SSAE_BPNN model and the impact of PSO and Adam optimization in the neural network training.
Assessment of PWT with VF filament
Figure 5 summarizes the assessment results of PWT with the aid of Q–Q plots. The PWT distributioin in this figure were all non-linear curves, and indicates non-normal distribution. Although each curves differ by the location of the nerves. For example Fig. 5a shows a less deviation from the normal towards the left, meanwhile we could observe a significant deviation from the normal curve in Fig. 5c as compared to Fig. 5b. For better analyzes of PWT, previous study has shown that tactile sensation is better perceived on a logarithm scale according to Weber’s Law (Lambert et al. 2009). This implies that animals can discriminate between mechanical forces on a lower scale more easily than a larger scale when applied to the skin surface. Therefore, we considered taking the logarithm scale of the normal Q–Q plot of each nerve locations. When the probability plots were graphed to analyze the log PWT responses for the three nerve locations (sural, saphenous, and tibia) on both right and left sides of the rat’s hind paw, it could be observed that the log transformation of PWT normalize the responses for three nerve functions as shown in Fig. 6. It could be observed that Fig. 6a deviated from the normal curve to the right at both the onset and end of the graph. Meanwhile Fig. 6b shows no deviation at both positions. And finally, the Fig. 6c shows that the data deviates towards the right at the onset and left at the end of the graph.
Fig. 5.

Assessment results of PWT with VF filament. The a normal Q–Q plot of Saphenous PWT b normal Q–Q plot of Tibia PWT c normal Q–Q plot of Sural PWT
Fig. 6.

Assessment results of log PWT with VF filament. The a log Q–Q plot of Saphenous PWT b log Q–Q plot of Tibia PWT c log Q–Q plot of Sural PWT acoss all rats’ experiment
Further analysis of the PWT results were performed using a box plot. Figure 7 represents the corresponding normal Q–Q plots of Fig. 5, while the Fig. 8 represents the corresponding log Q–Q plots of Fig. 6. We could observe an increasing outliers from the box plot represented in Fig. 7 which indicates a skewed or distorted data. Similar to the deviated curves from the normal to the right or left in Fig. 5, so also the box plots illustrates the level of distortions such as: saphenous (less distorted), tibia (moderately distorted), and sural (highly distorted) from the outliers. When the data was log transformed, the box plot in Fig. 8 appears to be evenly distributed without any trace of outliers. The log PWT in Fig. 6 distribution fits the data closely to the normal curves of the nerve responses, thus allowing for parametric analysis.
Fig. 7.

Assessment results of PWT with VF filament. The a boxplot of Saphenous PWT b boxplot of Tibia PWT c boxplot of Sural PWT
Fig. 8.

Assessment results of log PWT with VF filament. The a log boxplot of Saphenous PWT b log boxplot of Tibia PWT c log boxplot of Sural PWT acoss all rats’ experiment
In our analysis, we considered both the right and the left sides of the peripheral nerve locations. Our results indicates that the right side of the nerve area was significantly more sensitive in the tibia (p = 6.50 × 10⁻⁴), followed by saphenous (p = 7.84 × 10⁻⁴), and sural (p = 8.24 × 10⁻⁴) as shown in Table 2. Also, by calculating the mean sensitivity of each nerve responses from different sides of the hind-paw, and finding the mean difference between the nerve locations. We observed significant differences between the contact locations (repeated measures ANOVA shows that p < 0.001) from the different sides, and the mean value being the highest in tibia, followed by saphenous, and lastly sural as shown in Fig. 8. By performing the post hoc comparisons of paired t-tests adjusted with Bonferroni corrections for the three tested nerve locations considering the sides (right or left) and the sensory thresholds, it was observed that the mean values in tibia, saphenous and sural is significantly higher on the right side than on the left side. We could deduce from our results that tactile sensitivity and discrimination varies with respect to stimulus location on the skin, and corresponds with the density of innervation.
Table 2.
Comparison of sensitivity to von frey’s filament test
| Left Side (N = 40) | Right Side (N = 40) | |||||
|---|---|---|---|---|---|---|
| M | SD | M | SD | DF | P* | |
| Sural | − 0.6607 | 0.5089 | − 0.9475 | 0.4336 | 23 | 8.2 × 10⁻⁴ |
| Saphenous | − 0.6918 | 0.5671 | − 0.9909 | 0.4504 | 23 | 7.84 × 10⁻⁴ |
| Tibia | − 0.7471 | 0.6828 | − 1.0450 | 0.4826 | 23 | 6.50 × 10⁻⁴ |
The sural nerve, saphenous nerve, and tibia nerve are the locations of sensory touch
N Number of samples, M Mean, SD Standard deviation, DF Degrees of freedom, P* paired-samples t-test
Performance of BPNN model in the detection of sensory events
Figure 9 illustrates the performance of accuracy, specificity and sensitivity metrics at varying parameters of learning rate and hidden nodes. To determine the optimal value of the learning rate and hidden node, we tested a range of learning rate value from 0.001 to 0.01 at interval of 0.001 and hidden nodes 1 to 30 respectively. At maximum epoch of 80, the mean significant error (MSE) of different learning rate and hidden nodes were obtained. The results depicted in Fig. 9 demonstrates that the learning rate of 0.009 and the hidden node of 15 yielded a maximum average accuracy of 98.8% at a minimum average MSE of 0.03533. We could observe no significant difference across the average accuracies from the first optimal point; meanwhile the average value of MSE decreases as the learning rate increases with respect to decrease in hidden nodes. A maximum average sensitivity of 96.80% was obtained at the learning rate of 0.008 and hidden node of 12. While the maximum average specificity of 99.1% was obtained at the learning rate and hidden node of 0.006 and 8 respectively. It can be deduced that when the learning rate was 0.009 and the number of hidden node was 15, we obtained the most optimal performance value combination. Especially for the average accuracy and average MSE which have the best performance, while the average sensitivity and specificity still achieved a standard optimal results.
Fig. 9.

Optimal value at varying parameter of learning rate and hidden nodes
We further examined the optimal value of the population size to be between particles 10 and 20 in comparison with the maximum epoch value which is considered to be 80 and 100 as shown in Fig. 10. The selected learning rate and hidden nodes was based on the outcome of the results in Fig. 9 that yielded the maximum average accuracy. The parameters of Adam remains the same during the PSO evaluation. However, the results of the average accuracy, average sensitivity, specificity and MSE were obtained and hereafter analyzed. From the Fig. 10, it is shown that the maximum epoch of 80 at the learning rate of 0.009 and hidden node of 15 yielded the maximum average accuracy of 98.8%, specificity of 99.1%, and sensitivity of 96.8% when the optimal particle number was 20. In all, the average accuracy, average sensitivity, and average specificity had the best performance. In comparing the two maximum epoch values, we can infer that increase in the number of epochs does not yet guarantees higher accuracy as shown from our results in Fig. 10. Moreover, a minimum average MSE value of 0.03274 was attained in epoch 100 at the optimal particle number of 20. This connotes that average MSE has the tendency of yielding better results when the maximum epoch is increased. Thus, we can conclude that an increasing number of epochs will yield a minimum MSE value (better results), but not a maximum accuracy.
Fig. 10.

Optimal value of PSO particles at maximum Epoch
Lastly, we compare the performance of BPNN, the combined BPNN with Adam optimization and PSO optimization, and the SVM model. Based on the results obtained in Figs. 9 and 10, the optimal parameter values were used to generate the results presented in Fig. 11. We could observe from the figure that the proposed algorithm performed better than the others across the three nerve locations using the three metrics. Better accuracy, sensitivity, and specificity were achieved when the BPNN model was optimized with PSO and Adam.
Fig. 11.

Comparison of detection performance across the nerve locations
Discussion
This paper presented a novel approach for detecting TAS from a highly flexible ECoG electrode in rats. A combination of SSAE for feature extraction and BPNN model optimized with PSO and Adam algorithms were used to obtain optimal performance. To our knowledge, the proposed combined algorithms have never been applied for sensory events detection in animals. Likewise, the combined experimental approach have never been considered for this kind of study. The experiment was in two stages: the evaluation of the PWT which elicits the TAS from mechanical stimulation with VF filament, and the acquisition of TAS from ECoG signals recorded in the brain cortex with flexible electrode. And both stages are performed simultaneously. From the results of the assessment with VF, we found each nerve locations (saphenous, tibia, and Sural) possessing different characteristics graph. Since tactile sensation is better perceived on a logarithm scale according to Weber’s law, the log transform of the normal Q–Q plots and the boxplots allows for a parametric analysis. The results of the proposed model showed high detection accuracy, sensitivity, and specificity compared to other methods. Additionally, early detection of sensory events would improve Spontaneous sensory and motor activity. Therefore, the proposed sensory event detection model might be an effective method for sensory feedback in closed-loop systems.
Current development of ECoG electrode has presented multiple benefits, including signal stability and lower risk of medical complication. These qualities have also made ECoG more attractive for sensory feedback applications. However, the increasing number of ECoG channels generates huge signals that requires additional computational efforts. In addition, a soft-material based electrode is important for long term stability and biocompatibility because the human tissues are soft and flexible. In this study, we used a highly stretchable and flexible ECoG electrode with 8-channels implanted on the surface of rat’s brain cortex to record TAS. And a clear ECoG with high spatial resolution were recorded. More importantly, an effective deep learning method known as SSAE was applied to directly extract important features from the ECoG signals, thus eliminating the use of handcrafted feature extraction method. Consequently, the extracted features were fed into a BPNN for detection of sensory events from TAS. However, successful application of deep learning is based on parameters setting such as number of neurons, the hidden layer, and the learning rate. Traditionally, manual parameter setting and grid search methods have been used to set these key parameters. But usually takes longer time to achieve users’ tasks. Therefore, the proposed PSO and Adam algorithm showed great potential for optimizing the parameters setting of SSAE and the entire network model. The combined algorithms produced high accuracy of 98.8%, sensitivity of 96.8%, and specificity of 99.1%. Although the proposed model achieved high performance metrics for sensory event detection, the analysis of the present study was limited to instances where the TAS involved the response of either slow adapting (SA) or mixture of quick adapting (QA) and SA mechano-receptive afferents innervating the hind-paw for at least one channel electrode. Occasionally, only QA afferents (which responds only at initial stimulus onset or when a stimulus ends) would be recorded in all the channels. And this discontinuous detection of sensory events made it difficult to discriminate the exact period of sensory events. However, it is important to ensure that SA afferents (which continue to respond during a static stimulus) are recorded in at least one of the electrode channels to compensate for the problem of discriminating the period of sensory events. Therefore, during the experimental process, static touch thresholds were assessed with set of VF filaments. The up-down approach has proven to be accurate for measuring 50% Withdrawal thresholds from data (Kingma and Ba 2014; Shi 2001), but require a time-consuming stages. During the assessment procedure, we adopted an automated approach by using UDReader for 50% withdrawal thresholds. In addition, the assessment results showed that touch sensitivity varied between different parts of the plantar surface (p < 0.001).
The main advantage of the present study is that both the aspect of stimulation (mechanical stimulation) and recording (minimal-invasive) were thoroughly examined in awake rats. Meanwhile, most of the previous studies are based on either the stimulation or recording, and mostly performed in anaesthetized rats. Through the predicted sensory events, sensorimotor systems could simultaneously monitor the performances of various tasks in multiple sensory modalities, and quickly respond to pattern of errors observed. Consequently, the salient sensory signals obtained from multiple sensory modalities are essential for dexterous object manipulation. In the future studies, we intend to investigate the performance of the proposed model for multiple sensory modalities.
Conclusion
In this study, an approach based on deep learning technique was used for the detection of sensory events through a highly flexible ECoG. This technique is a combination of SSAE for feature extraction, and BPNN model for pre-training and fine-tuning of weights/biases. The experiment was divided into two parts, first was the assessment of PWT which elicits the TAS from mechanical stimulation with VF filament. While the second was the acquisition of TAS from ECoG signals recorded in the brain cortex with flexible electrode. The results of the assessment concluded that VF filament testing is a reliable technique for estimating tactile thresholds when standardized procedures are duly followed. Especially in our case where we adopt UDReader as a quick and efficient way of calculating 50% threshold values. On the part of sensory event detection with SSAE_BPNN model after a successful feature extraction, the combination of BPNN with Adam and PSO optimization yielded maximum average accuracy, sensitivity and specificity after tenfold validation at a considerable running time. And following the advantage of Adam and PSO optimization, when combined with BPNN can solve problems associated with outlier in the ECoG data, making it possible to realize sensation feedback in real time. Hence, this method could be used to accurately discriminate sensory events resulting from TAS, and might be applicable for restoring sensation feedback.
Acknowledgements
This work was supported in part by the National Key Research & Development Program of China (2017YFA0701103), the Shenzhen Basic Research Program (JCYJ20170818163724754), the National Natural Science Foundation of China (61773364, 81927804 and U1613222), the CAS Youth Innovation Promotion Association (2018395), the Shenzhen Science and Technology Plan Project (JCYJ20160331174854880), and the Shenzhen Engineering Laboratory of Neural Rehabilitation Technology.
Footnotes
Publisher's Note
Springer Nature remains neutral with regard to jurisdictional claims in published maps and institutional affiliations.
Contributor Information
Peng Fang, Email: peng.fang@siat.ac.cn.
Guanglin Li, Email: gl.li@siat.ac.cn.
References
- Antfolk C, D’Alonzo M, Rosén B, Lundborg G, Sebelius F, Cipriani C. Sensory feedback in upper limb prosthetics. Expert Rev Med Devices. 2013;10(1):45–54. doi: 10.1586/erd.12.68. [DOI] [PubMed] [Google Scholar]
- Azlan WAW, Low YF (2014) Feature extraction of electroencephalogram (EEG) signal—a review. In: 2014 IEEE conference on biomedical engineering and sciences (IECBES), Kuala Lumpur, pp 801–806
- Bernarding C, Strauss DJ, Hannemann R, et al. Neurodynamic evaluation of hearing aid features using EEG correlates of listening effort. Cogn Neurodyn. 2017;11:203–215. doi: 10.1007/s11571-017-9425-5. [DOI] [PMC free article] [PubMed] [Google Scholar]
- Bonin RP, Bories C, Koninck YD. A simplified up-down method (SUDO) for measuring mechanical nociception in rodents using von Frey filaments. Mol Pain. 2014;10:26. doi: 10.1186/1744-8069-10-26. [DOI] [PMC free article] [PubMed] [Google Scholar]
- Caldwell DJ, Ojemann JG, Rao RPN. Direct electrical stimulation in electrocorticographic brain–computer interfaces: enabling technologies for input to cortex. Front Neurosci. 2019;13:804. doi: 10.3389/fnins.2019.00804. [DOI] [PMC free article] [PubMed] [Google Scholar]
- Caro-Martín CR, Delgado-García JM, Gruart A, Sánchez-Campusano R. Spike sorting based on shape, phase, and distribution features, and K-TOPS clustering with validity and error indices. Sci Rep. 2018;8:17796. doi: 10.1038/s41598-018-35491-4. [DOI] [PMC free article] [PubMed] [Google Scholar]
- Chaplan SR, Bach FW, Pogrel JW, Chung JM, Yaksh TL. Quantitative assessment of tactile allodynia in the rat paw. J Neurosci Methods. 1994;53:55–63. doi: 10.1016/0165-0270(94)90144-9. [DOI] [PubMed] [Google Scholar]
- Chen G. Automatic EEG seizure detection using dual-tree complex wavelet-Fourier features. Expert Syst Appl. 2014;41(5):2391–2394. doi: 10.1016/j.eswa.2013.09.037. [DOI] [Google Scholar]
- Choi I, Rhiu I, Lee Y, Yun MH, Nam CS. A systematic review of hybrid brain-computer interfaces: taxonomy and usability perspectives. PLoS ONE. 2017 doi: 10.1371/journal.pone.0176674. [DOI] [PMC free article] [PubMed] [Google Scholar]
- Cordella F, Ciancio AL, Sacchetti R, Davalli A, Cutti AG, Guglielmelli E, Zollo L. Literature review on needs of upper limb prosthesis users. Front Neurosci. 2016;10:209. doi: 10.3389/fnins.2016.00209. [DOI] [PMC free article] [PubMed] [Google Scholar]
- Cronin JA, et al. Task-specific somatosensory feedback via cortical stimulation in humans. IEEE Trans Haptics. 2016;9(4):515–522. doi: 10.1109/toh.2016.2591952. [DOI] [PMC free article] [PubMed] [Google Scholar]
- Daoud H, Bayoumi MA. Efficient epileptic seizure prediction based on deep learning. IEEE Trans Biomed Circuits Syst. 2019;13(5):804–813. doi: 10.1109/TBCAS.2019.2929053. [DOI] [PubMed] [Google Scholar]
- Dixon WJ. Efficient analysis of experimental observations. Annu Rev Pharmacol Toxicol. 1980;20:441–462. doi: 10.1146/annurev.pa.20.040180.002301. [DOI] [PubMed] [Google Scholar]
- Fang P, et al. New control strategies for multifunctional prostheses that combine electromyographic and speech signals. IEEE Intell Syst. 2015;30(04):47–53. doi: 10.1109/MIS.2015.40. [DOI] [Google Scholar]
- Flesher N, Collinger L, Foldes T, Weiss M, Downey E, Tyler-Kabara C, Bensmaia J, Schwartz B, Boninger L, Gaunt A. Intracortical microstimulation of human somatosensory cortex. Sci Transl Med. 2016;8(361):361ra141. doi: 10.1126/scitranslmed.aaf8083. [DOI] [PubMed] [Google Scholar]
- González-Cano R, Boivin B, Bullock D, Cornelissen L, Andrews NA, Costigan ML. Up–down reader: an open source program for efficiently processing 50% von Frey thresholds. Front Pharmacol. 2018;9:433. doi: 10.3389/fphar.2018.00433. [DOI] [PMC free article] [PubMed] [Google Scholar]
- Hatsopoulos NG, Donoghue JP. The science of neural interface systems. Annu Rev Neurosci. 2009;32:249–266. doi: 10.1146/annurev.neuro.051508.135241. [DOI] [PMC free article] [PubMed] [Google Scholar]
- Hill NJ, Gupta D, Brunner P, Gunduz A, Adamo MA, Ritaccio A, Schalk G. Recording human electrocorticographic (ECoG) signals for neuroscientific research and real-time functional cortical mapping. J Vis Exp JoVE. 2012;64:3993. doi: 10.3791/3993. [DOI] [PMC free article] [PubMed] [Google Scholar]
- Hinton GE, Salakhutdinov RR. Reducing the dimensionality of data with neural networks. Science. 2006;313(5786):504–507. doi: 10.1126/science.1127647. [DOI] [PubMed] [Google Scholar]
- Hiremath SV, Tyler-Kabara EC, Wheeler JJ, Moran DW, Gaunt RA, Collinger JL, et al. Human perception of electrical stimulation on the surface of somatosensory cortex. PLoS ONE. 2017;12(5):e0176020. doi: 10.1371/journal.pone.0176020. [DOI] [PMC free article] [PubMed] [Google Scholar]
- Idowu, O.P., Fang, P., Li, X., Xia, Z., Xiong, J., & Li, G. (2018). Towards control of EEG-based robotic arm using deep learning via stacked sparse autoencoder. In: IEEE international conference on robotics and biomimetics (ROBIO), pp 1053–1057
- Idowu OP, Huang J, Zhao Y, Li G, Fang P. Electrophysiological assessment of peripheral nerve stimulation through somatosensory evoked potential in rat hindlimb. IEEE Int Conf Cyborg Bionic Syst (CBS) 2018;2018:21–24. [Google Scholar]
- Kaiju T, Doi K, Yokota M, Watanabe K, Inoue M, Ando H, Takahashi K, Yoshida F, Hirata M, Suzuki T. High spatiotemporal resolution ECoG recording of somatosensory evoked potentials with flexible micro-electrode arrays. Front Neural Circuits. 2017;11:20. doi: 10.3389/fncir.2017.00020. [DOI] [PMC free article] [PubMed] [Google Scholar]
- Kim GH, Kim K, Lee E, An T, Choi W, Lim G, Shin JH. Recent progress on microelectrodes in neural interfaces. Materials (Basel, Switzerland) 2018;11(10):1995. doi: 10.3390/ma11101995. [DOI] [PMC free article] [PubMed] [Google Scholar]
- Kingma DP, Ba J (2014). Adam: a method for stochastic optimization. CoRR, abs/1412.6980
- Lambert GA, Mallos G, Zagami AS. Von Frey’s hairs—a review of their technology and use—a novel automated von Frey device for improved testing for hyperalgesia. J Neurosci Methods. 2009;177:420–426. doi: 10.1016/j.jneumeth.2008.10.033. [DOI] [PubMed] [Google Scholar]
- Lefebvre B, Yger P, Marre O. Recent progress in multi-electrode spike sorting methods. J Physiol Paris. 2016;110(4 Pt A):327–335. doi: 10.1016/j.jphysparis.2017.02.005. [DOI] [PMC free article] [PubMed] [Google Scholar]
- Li G, Samuel OW, Lin C, Asogbon MG, Fang P, Idowu PO (2019) Realizing efficient EMG-based prosthetic control strategy. Adv Exp Med Biol 1101:149–166. ISSN: 0065-2598 [DOI] [PubMed]
- Meisel C, Bailey KA. Identifying signal-dependent information about the preictal state: a comparison across ECoG, EEG and EKG using deep learning. EBioMedicine. 2019;45:422–431. doi: 10.1016/j.ebiom.2019.07.001. [DOI] [PMC free article] [PubMed] [Google Scholar]
- Mohammadpoory Z, Nasrolahzadeh M, Mahmoodian N, et al. Complex network based models of ECoG signals for detection of induced epileptic seizures in rats. Cogn Neurodyn. 2019;13:325–339. doi: 10.1007/s11571-019-09527-y. [DOI] [PMC free article] [PubMed] [Google Scholar]
- Mora-Sánchez A, Dreyfus G, Vialatte F. Scale-free behaviour and metastable brain-state switching driven by human cognition, an empirical approach. Cogn Neurodyn. 2019;13:437–452. doi: 10.1007/s11571-019-09533-0. [DOI] [PMC free article] [PubMed] [Google Scholar]
- Nedic A, Moon JD, Kung TA, Langhals NB, Cederna PS, Urbanchek MG (2013) Von Frey monofilament testing successfully discriminates between sensory function of mixed nerve and sensory nerve regenerative peripheral nerve interfaces. In: 2013 6th International IEEE/EMBS conference on neural engineering (NER), pp 255–258
- Niknazar M, Mousavi SR, Motaghi S, Dehghani A, Vosoughi Vahdat B, Shamsollahi MB, Sayyah M, Noorbakhsh SM. A unified approach for detection of induced epileptic seizures in rats using ECoG signals. Epilepsy Behav. 2013;27(2):355–364. doi: 10.1016/j.yebeh.2013.01.028. [DOI] [PubMed] [Google Scholar]
- Obien ME, Deligkaris K, Bullmann T, Bakkum DJ, Frey U. Revealing neuronal function through microelectrode array recordings. Front Neurosci. 2015;8:423. doi: 10.3389/fnins.2014.00423. [DOI] [PMC free article] [PubMed] [Google Scholar]
- Rahman MA, Ma W, Tran D, Campbell J (2012) A comprehensive survey of the feature extraction methods in the EEG research. ICA3PP
- Randall JN. Interactions between motor commands and somatic perception in sensorimotor cortex. Curr Opin Neurobiol. 1996;6:801–810. doi: 10.1016/S0959-4388(96)80031-6. [DOI] [PubMed] [Google Scholar]
- Rao AR. An oscillatory neural network model that demonstrates the benefits of multisensory learning. Cogn Neurodyn. 2018;12:481–499. doi: 10.1007/s11571-018-9489-x. [DOI] [PMC free article] [PubMed] [Google Scholar]
- Raspopovic S, Carpaneto J, Udina E, Navarro X, Micera S. On the identification of sensory information from mixed nerves by using single-channel cuff electrodes. J NeuroEng Rehabil. 2010;7:17. doi: 10.1186/1743-0003-7-17. [DOI] [PMC free article] [PubMed] [Google Scholar]
- Ravish DK, Shenbaga Devi S, Krishnamoorthy SG, Karthikeyan MR. Detection of epileptic seizure in eeg recordings by spectral method and statistical analysis. J Appl Sci. 2013;13:207–219. doi: 10.3923/jas.2013.207.219. [DOI] [Google Scholar]
- Rey HG, Pedreira C, Quiroga RQ. Past, present and future of spike sorting techniques. Brain Res Bull. 2015;119:106–117. doi: 10.1016/j.brainresbull.2015.04.007. [DOI] [PMC free article] [PubMed] [Google Scholar]
- Roberts JA, Gollo LL, Abeysuriya RG, et al. Metastable brain waves. Nat Commun. 2019;10:1056. doi: 10.1038/s41467-019-08999-0. [DOI] [PMC free article] [PubMed] [Google Scholar]
- Roy Y, Banville HJ, Albuquerque I, Gramfort A, Falk TH, Faubert J. Deep learning-based electroencephalography analysis: a systematic review. J Neural Eng. 2019;16(5):051001. doi: 10.1088/1741-2552/ab260c. [DOI] [PubMed] [Google Scholar]
- Samuel OW, Geng Y, Li X, Li G. Towards efficient decoding of multiple classes of motor imagery limb movements based on EEG spectral and time domain descriptors. J Med Syst. 2017;41(12):194. doi: 10.1007/s10916-017-0843-z. [DOI] [PubMed] [Google Scholar]
- Schiefer M, Tan D, Sidek SM, et al. Sensory feedback by peripheral nerve stimulation improves task performance in individuals with upper limb loss using a myoelectric prosthesis. J Neural Eng. 2016;13(1):016001. doi: 10.1088/1741-2560/13/1/016001. [DOI] [PMC free article] [PubMed] [Google Scholar]
- Sharmila A, Mahalakshmi P. Wavelet-based feature extraction for classification of epileptic seizure EEG signal. J Med Eng Technol. 2017;41(8):670–680. doi: 10.1080/03091902.2017.1394388. [DOI] [PubMed] [Google Scholar]
- Shi Y (2001) Particle swarm optimization: developments, applications and resources. In: Proceedings of the 2001 congress on evolutionary computation (IEEE Cat. No.01TH8546), vol 1, pp 81–86
- Stephens-Fripp B, Alici G, Mutlu R. A review of non-invasive sensory feedback methods for transradial prosthetic hands. IEEE Access. 2018;6:6878–6899. doi: 10.1109/ACCESS.2018.2791583. [DOI] [Google Scholar]
- Svensson P, Wijk U, Björkman A, Antfolk C. A review of invasive and non-invasive sensory feedback in upper limb prostheses. Expert Rev Med Devices. 2017;14(6):439–447. doi: 10.1080/17434440.2017.1332989. [DOI] [PubMed] [Google Scholar]
- Thakor NV. Translating the brain-machine interface. Sci Transl Med. 2013;5(210):210ps17. doi: 10.1126/scitranslmed.3007303. [DOI] [PubMed] [Google Scholar]
- Umeda T, Isa T, Nishimura Y. The somatosensory cortex receives information about motor output. Sci Adv. 2019;5(7):eaaw5388. doi: 10.1126/sciadv.aaw5388. [DOI] [PMC free article] [PubMed] [Google Scholar]
- Volkova K, Lebedev MA, Kaplan A, Ossadtchi A. Decoding movement from electrocorticographic activity: a review. Front Neuroinf. 2019;13:74. doi: 10.3389/fninf.2019.00074. [DOI] [PMC free article] [PubMed] [Google Scholar]
- Waldert S. Invasive vs. non-invasive neuronal signals for brain-machine interfaces: will one prevail? Front Neurosci. 2016;10:295. doi: 10.3389/fnins.2016.00295. [DOI] [PMC free article] [PubMed] [Google Scholar]
- Wang C, Zou J, Zhang J, Wang M, Wang R. Feature extraction and recognition of epileptiform activity in EEG by combining PCA with ApEn. Cogn Neurodyn. 2010;4(3):233–240. doi: 10.1007/s11571-010-9120-2. [DOI] [PMC free article] [PubMed] [Google Scholar]
- Wang D, Liu Y, Hu D, Blohm G. EEG-based perceived tactile location prediction. IEEE Trans Auton Ment Dev. 2015;7:342–348. doi: 10.1109/TAMD.2015.2427581. [DOI] [Google Scholar]
- Wang R, Wang J, Yu H, Wei X, Yang C, Deng B. Power spectral density and coherence analysis of Alzheimer’s EEG. Cogn Neurodyn. 2015;9(3):291–304. doi: 10.1007/s11571-014-9325-x. [DOI] [PMC free article] [PubMed] [Google Scholar]
- Zhao Y, Yu M, Li G, Fang P. Highly stretchable electrodes based on gold films with cyclic stability for electrocorticogram recordings. IEEE Int Conf Cyborg Bionic Syst (CBS) 2018;2018:17–20. [Google Scholar]