

Abstract
Early studies suggested that Fe(III) complexes cannot compete with Gd(III) complexes as T1 MRI contrast agents. Here we show that one member of a new class of high spin macrocyclic Fe(III) complexes produces more intense contrast in mice kidneys and liver at 30 minutes post injection than does a commercially used Gd(III) agent and also produces similar T1 relaxivity in serum phantoms at 4.7 T and 37 °C. Comparison of four different Fe(III) macrocyclic complexes elucidates the factors that contribute to relaxivity in vivo including solution speciation. Variable temperature 17O NMR studies suggest that none of the complexes has a single, integral inner-sphere water that exchanges rapidly on the NMR time scale. MRI studies in mice show large in vivo differences of three of the Fe(III) complexes that correspond, in part, to their r1 relaxivity in phantoms. Changes in overall charge of the complex modulate contrast enhancement, especially of the kidneys.
Keywords: imaging agent, iron, macrocyclic ligand, NMR spectroscopy
Graphical Abstract
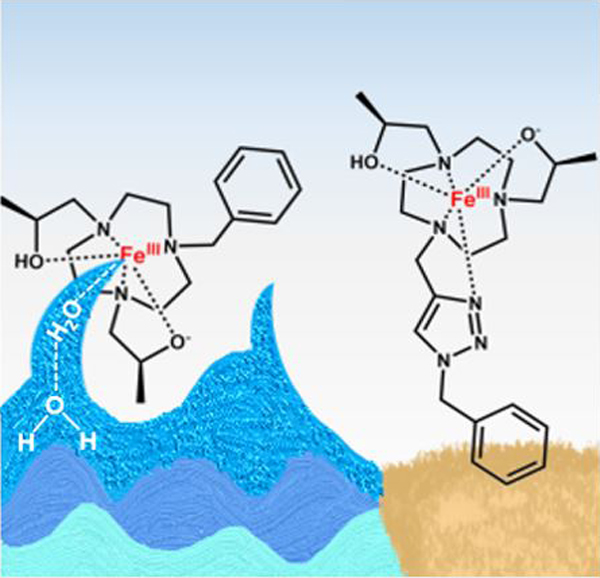
High spin iron(III) complexes with an open coordination site for solvent interactions are effective T1 MRI contrast agents in phantoms and in live mice. A coordinated water ligand with the deprotonation of an alcohol pendent stabilize the trivalent iron center that produces strong second-sphere water interactions.
Introduction
Early studies of T1 MRI contrast agents focused on complexes of several metal ions, most prominently Gd(III), Mn(II), and to a lesser extent, high spin Mn(III) and Fe(III).[1] Since these early days, Gd(III) MRI contrast agents have seen remarkable success with approximately 40% of all MRI scans incorporating Gd(III) contrast agents.[2] However, in response to concerns about patients who cannot tolerate Gd(III) contrast agents[3] as well as more recent reports of Gd(III) retention in the body,[4] the development of Mn(II) contrast agents has experienced a renaissance aimed at producing alternatives to Gd(III).[5] Fe(III) coordination complexes have been much less explored, despite the important status of iron as a metal ion that the human body stores and recycles. To address the need for alternatives, iron-based nanoparticles such as superparamagnetic iron oxides (SPIONS) are under continued investigation as T2 and T1 agents.[6] However, SPIONS demonstrate bio-distribution profiles that are characteristic of nanoparticles, and are cleared slowly through the liver. Fe(III) coordination complexes may more closely match the properties of clinically used Gd(III) agents in terms of biodistribution and pharmacokinetic clearance.
One of the barriers to the development of Fe(III) coordination complexes as contrast agents is their complicated aqueous solution chemistry. The complexes reported to date feature mostly hexadentate chelates with diamino-backbones and carboxylate and/or phenolate donors to give seven-coordinate complexes.[7] There are also tris-complexes of bidentate catechols that lack an innersphere water ligand as well as Fe(III) complexes with an azamacrocycle and bridging oxo groups to form a cluster.[8] Most of these reported Fe(III) complexes have ill-defined solution chemistry and unknown redox potentials. More recently, two studies of Fe(III) complexes of EDTA, DTPA or a related hexadentate polyaminocarboxylate ligand have been used for MRI of tumors in mice, albeit at three-fold higher concentrations than used for Gd(DTPA).[9] With the exception of these recent reports, the solution speciation and water ligand exchange rate constants of Fe(III) contrast agents have not been reported. Another property that has been overlooked involves the need to tune the redox potential of the Fe(III)/Fe(II) center so that Fe(III) is stabilized in the reducing biological environment.[10]
The small size of the Fe(III) ion and its correspondingly high Lewis acidity make it difficult to develop complexes with rapidly exchanging inner-sphere water ligands. However, these disadvantages may be offset by the small size of the Fe(III) that imparts strong second-sphere water interactions. The relaxation of the protons of water by a paramagnetic complex is described by the relaxivity, r1, which is obtained from a plot of the 1/T1 (rate constant) versus concentration of the contrast agent. Importantly, the r1 term has contributions from directly bound water (inner-sphere), from water bound to ligands in the coordination sphere (second-sphere) and from water diffusing in close proximity to the paramagnetic center (outer-sphere). The outer-sphere contribution in contrast agents can be quite substantial, although the focus has been on inner-sphere contributions.[11]
| (Eq. 1) |
Other properties to consider in the design of Fe(III) T1 agents include the relaxation time of bound water (T1M) as described in Eq. 2.[12] T1m depends on the Bohr magneton (μ0), the gyromagnetic ratio of proton (γH), the electron g factor (ge), the spin quantum number (S), metal proton distance (rMH), the proton Lamor frequency (ωH) and the correlation time (τc), as the time constant for the fluctuating magnetic dipole that mediates proton relaxation. The spin quantum number of S = 5/2 for high spin Fe(III) is the same as that in high spin Mn(II) complexes, but lower than that of Gd(III) at S = 7/2. However, the much shorter M-H bond radius in Fe(III) complexes may partially compensate for these other factors. The correlation time will be dominated by the fastest process (Eq. 3), whether it is electron spin relaxation (T1e), the lifetime of bound water (τm), or the rotational motion of the complex (τR). In this regard, the lifetime of a bound inner-sphere water is generally longer than the rotational correlation time for a low molecular weight complex, so that rotation is the limiting factor.[2a] However, second-sphere water lifetimes can be very short and thus limiting, making the creation of strong second-sphere interactions an important goal. Electron spin relaxation of Fe(III) is more rapid than Gd(III) or Mn(II) at low fields, but is less of a limiting factor at high field strengths (>3T).[13]
| (Eq. 2) |
| (Eq. 3) |
Here we present a new class of Fe(III) macrocyclic complexes as T1 MRI contrast agents which are studied in phantoms and in mice. The complexes have remarkable solution chemistry, a stabilized Fe(III) oxidation state and inertness to dissociation in acid or with anions present in the blood including carbonate and phosphate. The T1 relaxivity at 4.7 T in serum phantoms of one of the Fe(III) complexes is similar to that of Gd(DTPA), (Magnevist®) a clinically used agent. This Fe(III) agent shows kidney-specific enhancement in mice MRI studies, producing an increase in T1 relaxation rates which is higher than that of Gd(DTPA) at thirty minutes post injection. Slight changes in functional groups to modulate lipophilicity modulate the biodistribution and clearance of the agent as studied by dynamic MRI. These studies constitute some of the first structure activity studies on Fe(III) macrocyclic complexes towards their further development as T1 MRI contrast agents.
Results and Discussion
The triazacyclononane (TACN) macrocycle was used as the preferred ligand framework for binding the small Fe(III) ion.[14] Pendent alcohol groups were chosen as potentially anionic oxygen donors with chiral hydroxyl-propyl arms to rigidify the complex. Two macrocyclic ligands with a non-coordinating pendent (L1 and L3) were prepared to produce Fe(III) complexes with a coordination site for an inner-sphere water ligand. The triazole group was added as a versatile pendent to add functionality to the complex (Scheme 1). Triazole pendents have been shown to coordinate to trivalent metal ion centers,[15] and were chosen here to produce a coordinatively saturated complex. Ligands were synthesized in several steps from TACN by using the orthoamide protecting group and monoalkylation with a benzyl pendent. Benzyl TACN was directly alkylated with (S)-(−)-propylene oxide to give L1. Alternatively, the benzyl group was removed by using catalytic hydrogenation, and the triazole or benzoate groups were added (Schemes S2, S3). This route proved superior to adding the ancillary pendent directly to protected TACN. The triazole pendents were clicked prior to attachment to TACN to avoid complexation of Cu(II) (Scheme S1). The Fe(III) complexes were best prepared by stirring solutions of the Fe(II) bromide or chloride salts in ethanol with ligand in air. Solids were characterized for iron content by ICP-MS and analyzed as [Fe(L)X]X where L is the singly deprotonated ligand and X is Cl− or Br−. Solution studies confirmed high spin Fe(III) as shown by Evan’s method with ueff values ranging from 5.6–5.9 (TableS1).
Scheme 1.

Four complexes studied here shown with predominant protonation state at pH 7.4. Alternatively, Fe(L1) or Fe(L3) may have deprotonated water instead of deprotonated alcohol pendents. Note that Fe(L) designates all iron species in solution unless otherwise specified.
The electronic spectra of the four Fe(III) complexes showed an absorbance peak at 330 nm with extinction coefficients ranging from 3100 M−1cm−1 to 4800 M−1cm−1 that was useful for monitoring the dissociation of the complexes. Remarkably, in 100 mM HCl the complexes remained largely intact over 4 hours, but had dissociated by 20% to 40% over 72 hours (Table S2). In solutions with 25 mM carbonate and 0.40 mM phosphate, none of the complexes tested, Fe(L1), Fe(L2), Fe(L3), or Fe(L4) dissociated to any measurable degree over a period of 72 hours at 37 °C (Fig. S21–S28).
The pH-potentiometric titrations of the intact complexes showed one or two ionizations over the pH range of 3 to 11 (Fig. S30–S33). For Fe(L1), either an alcohol pendent and or a water ligand may ionize at neutral pH. Analogously, Fe(L3) has a nearly identical coordination sphere and we assign the ionization at near neutral pH as either an alcohol pendent or water ligand, and the ionization at acidic pH as the carboxylic acid. Fe(L2) appears to lack a water molecule at neutral pH as shown by relaxivity studies below, which leads us to assign the ionization with a pKa of 6.8 to an alcohol pendent. Fe(L4) shows values at 7.4 and at 4.0, consistent with deprotonation of a pendent alcohol group at near-neutral pH and the carboxylic acid at acidic pH. Based on this data, the predominate species at pH 7.4 are shown in Scheme 1 and speciation diagrams are shown in Figs S30–33. Additional experiments with Fe(L1) and Fe(L2) using UV-vis spectroscopy showed evidence of the loss of halide from the inner-coordination sphere upon addition of water (Fig. S29). Assignments of solution species and ionizing groups will be discussed further below in context with the 17O NMR and relaxivity experiments. The 1-octanol/water partition coefficients (Log P) are shown in Table 1 for comparison of the lipophilicity of the complexes.
Table 1.
Protonation constants from potentiometric titrations at 37°C, in 0.10 M NaCl (Eqs. S5, S6) and Log P octanol/water partition coefficients calculated from Eq. S4
| Compound | Log K1 | Log K2 | Log P |
|---|---|---|---|
| Fe(L1) | 7.05 ± 0.06 | - | −0.13 |
| Fe(L2) | 6.75 ± 0.08 | - | −1.32 |
| Fe(L3) | 6.91 ± 0.05 | 3.31 ± 0.01 | −1.53 |
| Fe(L4) | 7.44 ± 0.09 | 4.01 ± 0.13 | −1.87 |
The pH dependent change in speciation was mirrored in cyclic voltammetry experiments. At pH 3, all complexes exhibited a reversible wave at approximately 300 mV versus NHE. At neutral pH, a new wave at more negative potentials was produced. For example, Fe(L2) produces a reversible wave at pH 7 at −274 mV versus NHE which is shifted by nearly 600 mV from acidic pH (Fig. 1). The other three complexes, Fe(L1), Fe(L3), and Fe(L4) showed a similar shift in peak potential but had waves characteristic of quasi-reversible processes (Fig. S34). Notably, there was broadening of the oxidation peak in the voltammograms of both complexes that contain a carboxylate group, Fe(L3) and Fe(L4) at neutral pH, perhaps signifying the presence of an additional species in solution. The shift towards more negative potential reflects the stabilization of Fe(III) by the deprotonation of the macrocyclic ligand, most likely an alcohol pendent. In blood, the redox potential of the Fe(III)/Fe(II) center should be less than −200 mV to avoid reduction to Fe(II) and the reactions that may be promoted by Fe(II).[16] For example, when the complexes reported here were incubated with ascorbate as an important biological reductant and peroxide to assay for Fenton chemistry,[17] there was no detectable hydroxylation of aromatics in comparison to Fe(EDTA), which has a redox potential of 300 mV versus NHE (Fig. S35).
Figure 1.

Cyclic voltammogram of Fe(L2) at acidic and neutral pH at a scan rate of 100 mV/s. Solutions contained 1.0 mM Fe(L2) and 100 mM KCl as the supporting electrolyte.
The crystal structure of [Fe(L2)(Cl)]Cl) showed a six-coordinate Fe(III) center with one alcohol pendent deprotonated and one protonated as shown by the difference in Fe-O bond lengths of 0.25 Å. In this structure, the pendent triazole was not coordinated to the Fe(III) and there is a coordinated chloride completing the coordination sphere. The trigonal plane of the three nitrogens and the trigonal plane formed by the two alcohols and chloride produce a twist angle of 47°, consistent with a distorted octahedral geometry. Previously reported Fe(III) complexes of TACN with pendent hydroxyethyl alcohol groups also feature six-coordinate Fe(III) with all alcohols bound and partial deprotonation of the alcohol groups.[18] 17O NMR spectroscopy and T1 relaxivity measurements were studied to understand solution speciation and water interactions of the complexes.
Variable temperature 17O NMR spectroscopy experiments were recorded on the Fe(III) complexes. Swift-Connick plots for Fe(L1) Fe(L2), and Fe(L3) show a curved plot as typically observed for a rapidly exchanging inner-sphere water whereas Fe(L4) gives a linear plot (Fig. S36). However, a plot of the 17O NMR peak width as a function of inverse temperature (Fig. 3A) in comparison to Fe(CDTA), a well-studied complex with a q = 1, suggests otherwise.[19] These data show that the Fe(III) macrocyclic complexes produce much less broadening of the 17O resonance compared to that of Fe(CDTA). The peak width of the 17O resonance for Fe(L1) and Fe(L2) at pH 3 reaches about 21% and 14%, respectively of the maximum peak width of Fe(CDTA). At pH 6.5, the peak width of Fe(L1) is about 15% of Fe(CDTA) whereas Fe(L2), Fe(L3), Fe(L4) show virtually no broadening of the 17O resonance at this pH (Fig. S37). This data suggests that the macrocyclic complexes do not have an inner-sphere water (q = 1) that exchanges sufficiently rapidly on the NMR time scale to substantially broaden and shift the 17O water resonance.[20] To further study the q number, the shift of the 17O NMR resonance as a function of Fe(III) complex concentration was plotted (Fig. 3B). In this study, Fe(CDTA) and Fe(DTPA) are compared to Fe(L1) and Fe(L2). Fe(L1) and Fe(L2) have slopes much closer to that of Fe(DTPA) which has no bound water than to Fe(CDTA). The small shift and broadening of the 17O NMR resonance by the macrocyclic Fe(III) complexes is attributed to second sphere interactions, or alternatively, to a small percentage of a species with a bound water.
Figure 3.

Comparison of Fe(L1), Fe(L2), Fe(DTPA) and Fe(CDTA);
(A) 17O NMR resonance broadening at pH 6.5 as a function of temperature.
(B) 17O NMR resonance shift as a function of Fe(III) complex concentration.
The r1 and r2 relaxivity of the four complexes in buffer, HSA and serum on a 4.7 Tesla MRI scanner are given in Table 2. In buffer, there is a five-fold difference in r1 between the best (Fe(L1)) and worst complex (Fe(L4)). The r2 values vary by a factor of nearly four. The complexes with triazole pendent produce the lowest relaxivity. Both triazole complexes have r1 relaxivities that are similar to Fe(III) complexes that have no bound water including Fe(DTPA) at 0.57 mM−1s−1 at 4.7 T.[21] It is interesting that Fe(L1) and Fe(L3) have r1 relaxivities that are several times higher than those of Fe(L2) or Fe(L4). In fact, Fe(L1) and Fe(L3) both have higher relaxivity than Fe(III) complexes with a single innersphere water molecule, such as Fe(EDTA) (1.34 mM−1s−1 at 4.7 T).[21] As discussed above, Fe(L1) and Fe(L3) have one deprotonated alcohol ligand or hydroxide at neutral pH. Given the higher r1 proton relaxivity and apparent lack of exchangeable inner-sphere water, a hydroxide ligand may be responsible for strong second sphere water interactions, similar to a reported Fe(III) porphyrin with fluoride and no bound water ligands.[22] Alternatively, the coordination sphere may have a hydrogen-bonding network between alcohol pendents and bound water that produces effective proton exchange.[11b] Clearly, this network is missing for Fe(L2) or Fe(L4).
Table 2.
Relaxivity values for Fe(L1), Fe(L2), Fe(L3), and Fe(L4) measured at 4.7T, pH 7.2 and 37°C compared to Gd(DTPA).
| Complex | r1 (mM−1sec−1) | r2 (mM−1sec−1) | r1 (mM−1sec−1) in HSA | r2 (mM−1sec−1) in HSA | r1 (mM−1sec−1) in serum | r2 (mM−1sec−1) in serum |
|---|---|---|---|---|---|---|
| Fe(L1) | 2.2 ± 0.3 | 4.5 ± 1.1 | 2.5 ± 0.1 | 4.2 ± 0.7 | 3.8 ± 0.38 | 6.2 ± 0.62 |
| Fe(L2) | 0.81 ± 0.07 | 1.5 ± 0.1 | 1.1 ± 0.02 | 1.6 ± 0.04 | - | - |
| Fe(L3) | 1.7 ± 0.1 | 5.0 ± 0.5 | 2.2 ± 0.01 | 3.6 ± 0.2 | 1.8 ± 0.18 | 3.0 ± 0.30 |
| Fe(L4) | 0.42 ± 0.2 | 1.5 ± 0.05 | 0.96 ± 0.02 | 2.0 ± 0.2 | - | - |
| Gd(DTPA) | 3.1 ± 0.31 | 3.9 ± 0.39 | 3.2 ± 0.32 | 4.0 ± 0.40 | 4.1 ± 0.41 | 5.0 ± 0.50 |
It is curious that the relaxivity of the carboxylate containing complexes, Fe(L3) and Fe(L4) are lowered compared to their benzyl analogs. One explanation is that the carboxylate groups modulate the electronics at the Fe(III) center, which seems reasonable for Fe(L1) versus Fe(L3), but not for Fe(L2) versus Fe(L4) which contains a more remote aryl group. In the presence of human serum albumin (HSA), the r1 relaxivity of Fe(L1) and Fe(L3) increase by about 10–30%. The triazole complexes Fe(L2) and Fe(L4) increase r1 relaxivity by 40% and 100%, respectively, in the presence of HSA. This data suggests that the iron complexes bind to HSA, and that complexes containing a carboxylate bind more strongly. Notably, in blood serum, Fe(L1) has r1 values that are similar to that of Gd(DTPA).
Mice were injected via tail vein with the Fe(III) complexes at the relatively low dose of 0.05 mmol/kg. Fe(L1), Fe(L3) and Fe(L4) were tolerated well by the mice at this dose. However, mice who received Fe(L2) at doses as low as 0.025 mmol/kg showed signs of distress and this complex was not studied further. Interestingly, the addition of the carboxylate group to Fe(L2) to give Fe(L4) ameliorated adverse effects in mice, suggesting that the charge of the complex has a role in toxicity.
The three Fe(III) complexes were studied in mice on a small animal 4.7 T MRI scanner. Dynamic MRI was used to examine biodistribution and clearance of the complexes in mice. Fig. 4 shows T1 weighted images of kidney and liver of mice at 45 minutes and 4 h post-administration of Fe(L1). Exceptional enhancement of kidneys was observed at 30–45 minutes. At four hours, enhancement of the gall bladder indicates a portion of the agent is cleared through the hepatobiliary system.
Figure 4.

T1-weighted MRI of a healthy Balb/C mouse at 4.7 T at a dose of 0.05 mmol/kg Fe(L1). Top row: before and 45 min post-injection images (a & b) showing strong enhancement of kidneys (arrow). Kidney enhancement was observed at 4 h post-injection (c). Bottom: liver and gall bladder images before (d) and 45 min after injection (e). Enhancement of liver (L) was observed at early timepoints and substantial enhancement of gall bladder (arrow head) was observed at 4 h post-injection (f).
The three complexes showed distinctly different dynamic MRI profiles in mice. Consistent with its lower relaxivity in phantoms, Fe(L4) produced barely detectable changes in T1 weighted contrast in blood, liver or kidneys, but was visualized in the bladder after 7 minutes (Fig. S39). Fe(L3) showed slightly less contrast enhancement in the vena cava blood vessel than Fe(L1), and produced less kidney and liver contrast enhancement (Fig. S38). This difference may be linked to the higher lipophilicity of Fe(L1) compared to Fe(L3) that may favor better retention in blood.[23] The log P value for Fe(L1) is close to zero (−0.13), signifying a degree of lipophilicity not observed for the other complexes. The log P octanol constants for Fe(L3) or Fe(L4) are very negative (Table 1), as is Gd(DTPA) (−3.16).[2a]
Notably, the change in the 1/T1 (ΔR1) versus control for Fe(L1) was 6-fold higher in the kidney than for Gd(DTPA) at 30 minutes (Fig. S40). The basis for the large T1 contrast enhancement in kidneys is not clear. Specific kidney contrast enhancement by Fe(L1) may be linked to organic cation transporters which have been implicated in kidney secretion of lipophilic cationic drugs.[24] This is supported by the fact that the enhanced kidney contrast for the neutral Fe(L3) complex is not as pronounced as that of Fe(L1). The large difference in the lipophilicity of the two complexes may also have a role in the different pharmacokinetic profiles of the two complexes. As shown, Fe(L1) was cleared from the kidneys and liver at 24 hours (Fig. 5).
Figure 5.

Change in ΔR1 for Fe(L1) at 0.05 mmol/kg in kidneys, liver and blood of Balb/C mice (n =3) over time.
Conclusion
The development of Fe(III) complexes as T1 MRI contrast agents presents unique opportunities and challenges. For example, it is challenging to produce an iron coordination complex with a Fe(III)/Fe(II) redox potential of less than −200 mV that also has a water ligand. Spin state is a consideration as well, as some TACN complexes of Fe(III) are low spin.[25] The highly polarizing Fe(III) ion does not produce rapidly exchanging water ligands in the six-coordinate complexes presented here. Instead, strong second-sphere interactions are likely, especially through groups that have hydrogen-bonding capabilities such as alcohols, alkoxides or hydroxide ligands. These trivalent Fe(III) macrocyclic complexes have the advantage of being more kinetically inert in comparison to divalent metal ions.[26]
The two Fe(III) complexes Fe(L1) and Fe(L3) that lack a rapidly exchanging inner-sphere water still have r1 relaxivity values that are higher than complexes that do have an exchangeable water, such as Fe(EDTA)(OH2) under similar conditions.[21] We propose that strong second-sphere water interactions are formed that may be mediated by alcohol or hydroxide ligands or by a network involving both. Studies are underway to better understand structure activity relationships for modulation of biodistribution and clearance and to utilize the specific kidney contrast enhancement that is a remarkable property of Fe(L1).
Supplementary Material
Figure 2.

A perspective ORTEP view of the molecular structure (50% ellipsoid probability level) of [Fe(L2-H+)Cl]+, where hydrogen atoms are omitted for clarity. The benzyl group shows rotational disorder.
Acknowledgements
JRM acknowledges the NSF (CHE-1710224) and (STTR-1746556). JAS and JRM acknowledge the NIH (1R03EB02536901) for support of this work. The authors would like to thank the Chemistry Instrument Center (CIC), University at Buffalo. This work utilized ICP-MS and FTMS that was purchased with funding from a NSF Major Research Instrumentation Program (NSF CHE-0959565) and National Institutes of Health (S10 RR029517).
Footnotes
Conflict of interest
JRM is a co-founder of Ferric Contrast, Inc.
Supporting information for this article is given via a link at the end of the document.
References
- [1].a) Lauffer RB, Chem. Rev 1987, 87, 901–927; [Google Scholar]; b) Tweedle MF, Gaughan GT, Hagan J, Wedeking PW, Sibley P, Wilson LJ, Lee DW, International Journal of Radiation Applications and Instrumentation. Part B. Nuclear Medicine and Biology 1988, 15, 31–36. [DOI] [PubMed] [Google Scholar]
- [2].a) Caravan P, Ellison JJ, McMurry TJ, Lauffer RB, Chem. Rev 1999, 99, 2293–2352; [DOI] [PubMed] [Google Scholar]; b) Lin S-P, Brown JJ, of Magn J. Reson. Imaging 2007, 25, 884–899; [DOI] [PubMed] [Google Scholar]; c) Wahsner J, Gale EM, Rodríguez-Rodríguez A, Caravan P, Chem. Rev 2019, 119, 957–1057. [DOI] [PMC free article] [PubMed] [Google Scholar]
- [3].Bruce R, Wentland AL, Haemel AK, Garrett RW, Sadowski DR, Djamali A, Sadowski EA, Invest. Radiol 2016, 51, 701–705. [DOI] [PubMed] [Google Scholar]
- [4].a) Gianolio E, Gregorio ED, Aime S, Eur. J. Inorg. Chem 2019, 2019, 137–151; [Google Scholar]; Le Fur M, Caravan P, Metallomics 2019, 11, 240–254; [DOI] [PMC free article] [PubMed] [Google Scholar]; b) Olchowy C, Cebulski K, Łasecki M, Chaber R, Olchowy A, Kałwak K, Zaleska-Dorobisz U, in PLoS One, Vol. 12, 2017, p. e0171704; [DOI] [PMC free article] [PubMed] [Google Scholar]; c) Kanal E, Magn. Reson. Imaging 2016, 34, 1341–1345; [DOI] [PubMed] [Google Scholar]; d) Radbruch A, Weberling LD, Kieslich PJ, Hepp J, Kickingereder P, Wick W, Schlemmer H-P, Bendszus M, Invest. Radiol 2016, 51, 683–690; [DOI] [PubMed] [Google Scholar]; e) Murata N, Gonzalez-Cuyar LF, Murata K, Fligner C, Dills R, Hippe D, Maravilla KR, Invest. Radiol 2016, 51, 447–453; [DOI] [PubMed] [Google Scholar]; f) Semelka RC, Ramalho J, Vakharia A, AlObaidy M, Burke LM, Jay M, Ramalho M, Magn. Reson. Imaging 2016, 34, 1383–1390. [DOI] [PubMed] [Google Scholar]
- [5].a) Pan D, Schmieder AH, Wickline SA, Lanza GM, Tetrahedron 2011, 67, 8431–8444; [DOI] [PMC free article] [PubMed] [Google Scholar]; b) Drahoš B, Lukeš I, Tóth É, Eur. J. Inorg. Chem 2012, 2012, 1975–198 [Google Scholar]; c) Botta M, Carniato F, Esteban-Gómez D, Platas-Iglesias C, Tei L, Future Med. Chem 2019, 11, 1461–1483. [DOI] [PubMed] [Google Scholar]
- [6].Toth GB, Varallyay CG, Horvath A, Bashir MR, Choyke PL, Daldrup-Link HE, Dosa E, Finn JP, Gahramanov S, Harisinghani M, Macdougall I, Neuwelt A, Vasanawala SS, Ambady P, Barajas R, Cetas JS, Ciporen J, DeLoughery TJ, Doolittle ND, Fu R, Grinstead J, Guimaraes AR, Hamilton BE, Li X, McConnell HL, Muldoon LL, Nesbit G, Netto JP, Petterson D, Rooney WD, Schwartz D, Szidonya L, Neuwelt EA, Kidney Int. 2017, 92, 47–66. [DOI] [PMC free article] [PubMed] [Google Scholar]
- [7].a) Motekaitis RJ, Martell AE, Welch MJ, Inorg. Chem 1990, 29, 1463–1467; [Google Scholar]; b) Bannochie CJ, Martell AE, Inorg. Chem 1991, 30, 1385–1392. [Google Scholar]
- [8].Kuźnik N, Wyskocka M, Eur. J. Inorg. Chem 2016, 2016, 445–458. [Google Scholar]
- [9].a) Wang H, Jordan VC, Ramsay IA, Sojoodi M, Fuchs BC, Tanabe KK, Caravan P, Gale EM, J. Am. Chem. Soc 2019, 141, 5916–5925; [DOI] [PMC free article] [PubMed] [Google Scholar]; b) Boehm-Sturm P, Haeckel A, Hauptmann R, Mueller S, Kuhl CK, Schellenberger EA, Radiology 2018, 286, 537–546; [DOI] [PubMed] [Google Scholar]; c) Tweedle MF, Radiology 2018, 286, 409–411. [DOI] [PubMed] [Google Scholar]
- [10].a) Khan RK, Gadiraju SP, Kumar M, Hatmaker GA, Fisher BJ, Natarajan R, Reiner JE, Collinson MM, ACS Sens. 2018, 3, 1601–1608; [DOI] [PubMed] [Google Scholar]; b) Kosman DJ, Metallomics 2018, 10, 370–377. [DOI] [PMC free article] [PubMed] [Google Scholar]
- [11].a) Caravan P, Chem. Soc. Rev 2006, 35, 512–523; [DOI] [PubMed] [Google Scholar]; b) Botta M, Eur. J. Inorg. Chem 2000, 2000, 399–407. [Google Scholar]
- [12].Boros E, Gale EM, Caravan P, Dalton Trans. 2015, 44, 4804–4818. [DOI] [PMC free article] [PubMed] [Google Scholar]
- [13].Pujales-Paradela M. R.-F. Rosa, Esteban-Gomez David and Iglesias Carlos Platas, Chapter 5: Transition Metal-based T1 Contrast Agents, Royal Society of Chemistry, Croydon, UK, 2018. [Google Scholar]
- [14].Martell AE, Motekaitis RJ, Welch MJ, J. Chem. Soc., Chem. Commun 1990, 1748–1749. [Google Scholar]
- [15].a) Stasiuk GJ, Lowe MP, Dalton Trans. 2009, 9725–9727; [DOI] [PubMed] [Google Scholar]; b) Jauregui M, Perry WS, Allain C, Vidler LR, Willis MC, Kenwright AM, Snaith JS, Stasiuk GJ, Lowe MP, Faulkner S, Dalton Trans. 2009, 6283–6285. [DOI] [PubMed] [Google Scholar]
- [16].Joyner JC, Reichfield J, Cowan JA, J. Am. Chem. Soc 2011, 133, 15613–15626. [DOI] [PMC free article] [PubMed] [Google Scholar]
- [17].Koppenol WH, Hider RH, Free Radic. Biol. Med 2019, 133, 3–10. [DOI] [PubMed] [Google Scholar]
- [18].Luckay R, Hancock RD, Cukrowski I, Reibenspies JH, Inorg. Chim. Acta 1996, 246, 159–169. [Google Scholar]
- [19].Brausam A, Maigut J, Meier R, Szilágyi PÁ, Buschmann H-J, Massa W, Homonnay Z, van Eldik R, Inorg. Chem 2009, 48, 7864–7884. [DOI] [PubMed] [Google Scholar]
- [20].Gale EM, Zhu J, Caravan P, J. Am. Chem. Soc 2013, 135, 18600–18608. [DOI] [PMC free article] [PubMed] [Google Scholar]
- [21].Patel A, Asik D, Spernyak JA, Cullen PJ, Morrow JR, J. Inorg. Biochem 2019, 110832. [DOI] [PMC free article] [PubMed] [Google Scholar]
- [22].Koenig SH, Brown RD 3rd, Lindstrom TR, Biophys. J 1981, 34, 397–408. [DOI] [PMC free article] [PubMed] [Google Scholar]
- [23].Wang J, Wang H, Ramsay IA, Erstad DJ, Fuchs BC, Tanabe KK, Caravan P, Gale EM, J. Med. Chem 2018, 61, 8811–8824. [DOI] [PMC free article] [PubMed] [Google Scholar]
- [24].Koepsell H, Busch A, Gorboulev V, Arndt P, Physiology 1998, 13, 11–16; [DOI] [PubMed] [Google Scholar]; Koepsell H, Expert Opin. Drug Metab. Toxicol 2015, 11, 1–15. [DOI] [PubMed] [Google Scholar]
- [25].Tsitovich PB, Gendron F, Nazarenko AY, Livesay BN, Lopez AP, Shores MP, Autschbach J, Morrow JR, Inorg. Chem 2018, 57, 8364–8374. [DOI] [PubMed] [Google Scholar]
- [26].a) Dorazio SJ, Tsitovich PB, Gardina SA, Morrow JR, J. Inorg. Biochem 2012, 117, 212–219; [DOI] [PubMed] [Google Scholar]; b) Abozeid SM, Snyder EM, Tittiris TY, Steuerwald CM, Nazarenko AY, Morrow JR, Inorg. Chem 2018, 57, 2085–2095. [DOI] [PubMed] [Google Scholar]
Associated Data
This section collects any data citations, data availability statements, or supplementary materials included in this article.