Abstract
Activation of the IRE1/XBP1s signaling arm of the unfolded protein response (UPR) is a promising strategy to correct defects in endoplasmic reticulum (ER) proteostasis implicated in diverse diseases. However, no pharmacologic activators of this pathway identified to date are suitable for ER proteostasis remodeling through selective activation of IRE1/XBP1s signaling. Here, we use high-throughput screening to identify non-toxic compounds that induce ER proteostasis remodeling through IRE1/XBP1s activation. We employ transcriptional profiling to stringently confirm that our prioritized compounds selectively activate IRE1/XBP1s signaling without activating other cellular stress-responsive signaling pathways. Furthermore, we demonstrate that our compounds improve ER proteostasis of destabilized variants of amyloid precursor protein (APP) through an IRE1-dependent mechanism and reduce APP-associated mitochondrial toxicity in cellular models. These results establish highly selective IRE1/XBP1s activating compounds that can be widely employed to define the functional importance of IRE1/XBP1s activity for ER proteostasis regulation in the context of health and disease.
Keywords: unfolded protein response (UPR), IRE1, endoplasmic reticulum (ER) proteostasis, protein secretion, proteotoxicity
INTRODUCTION
The unfolded protein response (UPR) is the primary signaling pathway activated by endoplasmic reticulum (ER) stress1, 2. The UPR comprises three signaling cascades activated downstream of the ER stress-sensing proteins IRE1, PERK, and ATF63, 4. In response to acute ER stress, UPR activation results in transcriptional and translational signaling to alleviate the misfolded protein load in the ER and promote adaptive remodeling of ER function and global cellular physiology5, 6. However, in response to chronic or severe ER insults, prolonged UPR signaling induces a pro-apoptotic response that results in cellular death7, 8. Through this combination of adaptive and pro-apoptotic signaling, the UPR dictates cellular function and survival in response to diverse pathologic insults.
The capacity of UPR signaling pathways to promote adaptive remodeling makes them attractive targets to ameliorate imbalances in ER proteostasis associated with etiologically diverse diseases9–11. The IRE1 pathway is the most evolutionarily conserved arm of the unfolded protein response (UPR), as it is found in all eukaryotes from yeast to mammals12. In response to ER stress, IRE1 is activated through a mechanism involving autophosphorylation, oligomerization, and allosteric activation of a cytosolic endoribonuclease (RNAse) domain 13–15. This RNAse is involved in splicing the XBP1 mRNA, resulting in a frameshift that allows translation of the active XBP1 spliced (XBP1s) transcription factor 13, 16. XBP1s adapts ER proteostasis through the increased expression of stress-responsive genes including chaperones and degradation factors5, 6. The activated IRE1 RNAse domain also promotes the degradation of ER-localized mRNAs through a process known as regulated IRE1-dependent decay (RIDD)17, 18. While the functional implications of RIDD remain to be fully established, recent results suggest that RIDD plays a protective role during ER stress through the selective degradation of mRNA encoding pro-apoptotic factors (e.g., DR5) and increased microautophagy through the degradation of BLOS117, 19. Thus, IRE1 activation can promote adaptive remodeling that alleviates ER stress and enhances ER proteostasis through XBP1 splicing and/or RIDD.
Increasing IRE1/XBP1s activity offers a unique opportunity to ameliorate pathologic imbalances in ER proteostasis implicated in diverse diseases. XBP1s overexpression promotes neuroprotection in animal models of neurodegenerative disease including Parkinson’s disease, Huntington’s disease, and peripheral nerve injury20–22. Increasing XBP1s can also promote the degradation of destabilized amyloid precursor protein (APP) mutants, reducing extracellular populations of the APP cleavage product Aβ associated with Alzheimer’s disease (AD)23, 24. Furthermore, chemical genetic activation of IRE1/XBP1s reduces the intracellular aggregation of destabilized, aggregation-prone variants of rhodopsin and α1-antitrypsin (A1AT) implicated in retinitis pigmentosa and A1AT deficiency, respectively5, 25, 26. IRE1/XBP1s activation is also advantageous in models of other disorders including diabetes and myocardial infarction27, 28.
Based on the above, there is significant interest in identifying non-toxic compounds that activate IRE1/XBP1s signaling. Previous work identified compounds that allosterically activate the IRE1 RNAse by binding the IRE1 kinase active site13–15. While these compounds are useful for defining the mechanism of IRE1 activation, many show off-pathway activity and/or toxicity, limiting their utility for defining the functional implications of IRE1/XBP1s activation in health and disease15, 29, 30. This necessitates the development of new compounds that activate IRE1/XBP1s through an alternative mechanism.
Here, we use a high-throughput screening (HTS) approach to identify non-toxic compounds that activate IRE1-dependent XBP1 splicing through a mechanism independent of binding the IRE1 kinase active site. We utilize RNAseq transcriptional profiling to demonstrate the selectivity of these compounds for IRE1/XBP1s signaling over other arms of the UPR or other stress-responsive signaling pathways. These compounds, which are prioritized on the fidelity of their transcriptional response, offer an opportunity to promote adaptive ER proteostasis remodeling through selective IRE1/XBP1s activation. To exemplify this, we demonstrate that our compounds promote the degradation of AD-associated APP mutants through an IRE1-dependent mechanism and mitigate APP-associated mitochondrial toxicity in cell models. Our results establish IRE1/XBP1s activating compounds that provide new opportunities to explore the mechanisms by which signaling through this pathway influences cellular physiology, and to define the utility of IRE1/XBP1s signaling for ameliorating pathologies associated with etiologically diverse diseases.
RESULTS
HTS to Identify IRE1/XBP1s Activating Compounds
We utilized a HEK293TREX cell line stably expressing a XBP1-Renilla luciferase (XBP1-RLuc) splicing reporter to identify compounds that activated the IRE1/XBP1s signaling pathway (Fig. 1A, Extended Data Fig. 1A)31, 32. Activated IRE1 splices mRNA encoded by this reporter, resulting in a frame-shift that allows RLuc expression31. We confirmed that the XBP1-Rluc reporter is activated by the ER stressor thapsigargin (Tg; a SERCA inhibitor) and is blocked by co-treatment with the selective IRE1 RNAse active site inhibitor 4μ8c33 (Extended Data Fig. 1B). We miniaturized this assay to a 1536-well plate format and screened the 646,251 compound Scripps Drug Discovery Library at the Scripps Research Institute Molecular Screening Center (SRIMSC)(Fig. 1A and Supplementary Table 1). Our primary screen identified 10,114 compounds that activated XBP1-RLuc activity >13.83% relative to Tg (Extended Data Fig. 1C). We removed compounds previously found to activate cell-based reporters of the cytosolic heat shock response34, as well as promiscuous compounds identified as positive hits in >7 assays at the SRIMSC (Fig. 1A, Extended Data Fig. 1D,E). We then selected the top ~6,400 compounds for triplicate confirmation and toxicity screening. Compounds (5.17 μM) that reduced cell viability >26.19% were removed (Extended Data Fig. 1F). We then deprioritized compounds which also activated other UPR signaling arms by removing compounds previously reported to activate the ATF6-selective ERSE-luciferase reporter31 (Fig. 1A and Extended Data Fig. 1D,G). From these data, we selected 638 compounds that preferentially activate the XBP1-RLuc reporter for further characterization (Source Data Table 1).
Figure 1. High-throughput screen to identify preferential IRE1/XBP1s activating compounds.
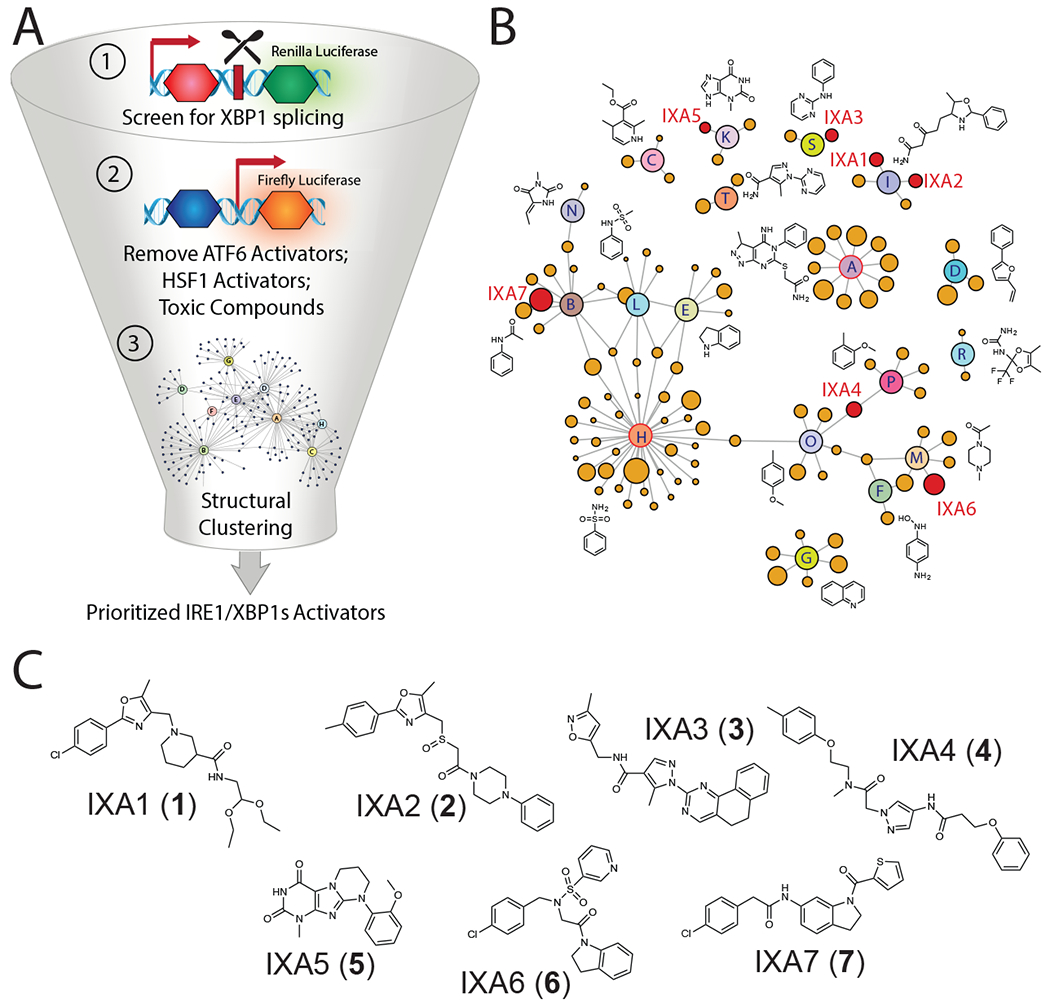
A. Illustration of the screening pipeline employed to identify prioritized compounds that selectively activate the IRE1-dependent XBP1-RLuc reporter. This pipeline includes a primary screen to identify compounds that activate the XBP1-RLuc reporter, removal of compounds that activate reporters of other stress-responsive signaling pathways (e.g., the ATF6 arm of the UPR and the HSR), and structural clustering of selective activators into defined structural classes.
B. Network plot illustrating shared structural motifs among a subset of the 128 compounds identified to preferentially activate the XBP1-Rluc reporter >20%, display a maximal EC50 for reporter activation of <3 μM, and show an IC50 for toxicity of >3 μM. Prioritized compounds identified for subsequent studies are shown in red.
C. Chemical structures of our top 7 prioritized IRE1/XBP1s activators identified via high-throughput screening.
We removed compounds that showed an EC50 for XBP1-Rluc activation >3 μM, in dose response studies, and maximal activity <20% relative to Tg activation (Extended Data Fig. 1H). We then performed iterative chemical subclustering of these hits to yield a representative set of 128 compounds that reflects the diversity and relative abundance of similar scaffolds among these top hits (Fig. 1B, Supplementary Table 2). The two most represented groups in this analysis were Cluster “H” containing an aryl sulfonamide moiety and Cluster “A” containing a N1-phenyl substituted pyrazolopyrimidine substructure (Fig. 1B, outlined in red). These structures are commonly found in compounds that bind kinase active sites, suggesting they likely activate IRE1 by binding the IRE1 kinase domain35. Since we were focused on identifying compounds that activate IRE1 independent of this mechanism, we excluded compounds in Clusters A and H in the initial characterization. Instead, we selected 7 compounds that represent 5 different structural classes for immediate follow-up (Fig. 1C, Supplementary Table 3).
Compounds Promote IRE1-Dependent XBP1 Splicing
We confirmed concentration-dependent activation of XBP1-RLuc in HEK293TREX cells, demonstrating reporter activation to levels 35-50% that observed with Tg and EC50’s consistent with those observed during HTS (Fig. 2A, Extended Data Fig. 2A, and Supplementary Table 2). Importantly, we confirmed that co-administration of our compounds with the IRE1 RNAse active site inhibitor 4μ8c blocked compound-dependent activation of XBP1-RLuc (Fig. 2A). Next, we showed that our compounds activate the IRE1/XBP1s-selective target gene DNAJB9 (ERDJ4; Fig. 2B, Extended Data Fig. 2B) to levels 30–50% those observed for Tg (Fig. 2B), mirroring the levels of activation observed in our reporter assay (Fig. 2A). Compound-dependent DNAJB9 expression was inhibited in cells co-treated with the IRE1 RNAse active site inhibitor 4μ8c, confirming that this effect is IRE1 dependent (Fig. 2B). Importantly, our compounds did not significantly induce the PERK-regulated target gene CHOP or the ATF6-regulated target gene BiP (HSPA5), indicating that our compounds are selective for the IRE1/XBP1s arm of the UPR (Extended Data Fig. 2C–F) Collectively, these results suggest that our compounds selectively activate IRE1/XBP1s signaling independent of other UPR signaling pathways.
Figure 2. Compound-Dependent IRE1/XBP1s Activation Requires IRE1 Autophosphorylation.
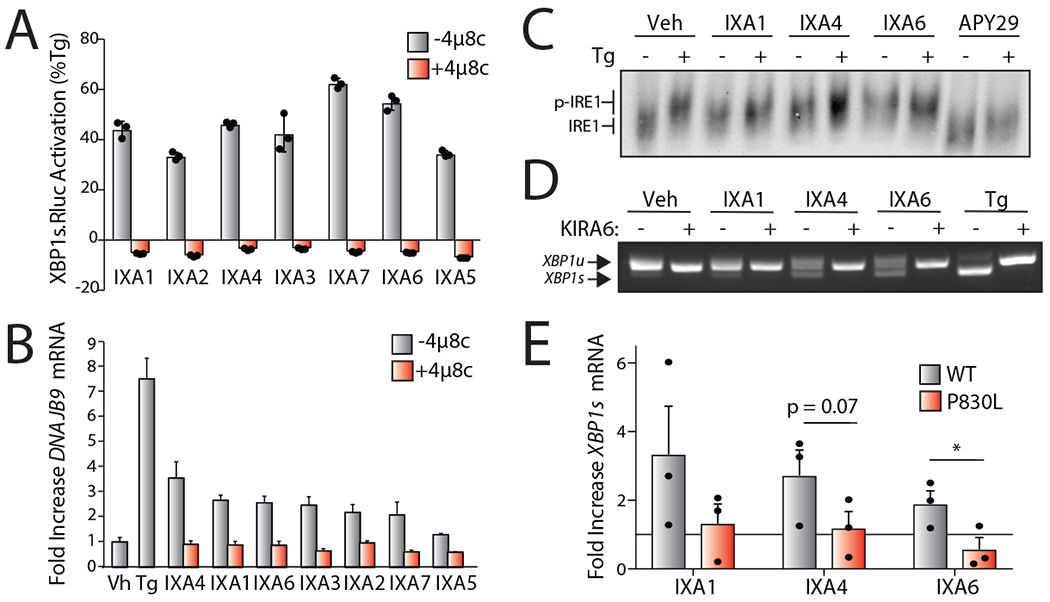
H. Luminescence in HEK293TREX cells stably expressing the XBP1-RLuc splicing reporter treated with indicated IRE1/XBP1s activators (10 μM) in the presence or absence of the IRE1 active site inhibitor 4μ8c (32 μM) for 18 hrs. Luminescence is shown as % signal relative to Tg (500 nM; 18 hr). Error bars represent SD for n = 3 replicates.
I. Graph showing qPCR of the XBP1 target gene DNAJB9 in HEK293T cells treated for 4 hrs with the indicated compound (10 μM) or Tg (500 nM) in the presence or absence of 4μ8c (32 μM). Error bars show 95% CI for n = 3 replicates.
J. Immunoblot of IRE1 following Phos-tag SDS-PAGE to separate phosphorylated and unphosphorylated IRE1 in lysates prepared from HEK293T cells treated for 4 hrs with 10 μM IXA1, IXA4, or IXA6 or 1 μM APY29 in the presence or absence of 500 nM Tg. Phosphorylated (p-IRE1) and unphosphorylated (IRE1) are indicated on the gel.
K. cDNA gel showing splicing of XBP1 mRNA in HEK293T cells treated for 4 hrs with 10 μM IXA1, IXA4, IXA6, or 500 nM Tg in the presence or absence of 10 μM IRE1 kinase inhibitor KIRA6 for 4 hr.
L. Graph showing qPCR of Xbp1s mRNA in Ire1−/− MEFs reconstituted with WT or kinase inactive P830L IRE1, treated for 4 hrs with 10μM IXA1, IXA4, IXA6. Fold increase for each condition is presented relative to vehicle-treated control. Error bars represent SE for n = 3 replicates. P-values were calculated using one-tailed Student’s t-test. *p<0.05.
We selected compounds IXA1 (1), IXA4 (4), and IXA6 (6) (Fig. 1C) as our top hits based on their selective IRE1-depedendent induction of DNAJB9, their EC50 of XBP1-RLuc activation of <3 μM, and their maximal activation of IRE1/XBP1s signaling to levels ~40-50% that observed with Tg. We confirmed that IXA1, IXA4, and IXA6 moderately increased IRE1-dependent Xbp1 splicing in wild-type mouse embryonic fibroblast (MEF) cells, but not in Ire1-deficient MEF cells, further demonstrating that these compounds increase Xbp1 splicing through an IRE1-dependent mechanism (Extended Data Fig. 2G).
Compound Activity Requires IRE1 Phosphorylation
Compounds that activate the IRE1 RNAse through binding the IRE1 kinase domain inhibit IRE1 autophosphorylation and can elicit off-target activity likely associated with binding to other kinases15, 29, 30. Thus, we sought to define the impact of IXA1, IXA4, and IXA6 on IRE1 kinase activity. Treatment with APY29, an IRE1 kinase inhibitor that allosterically activates the IRE1 RNAse15, blocked Tg-dependent IRE1 phosphorylation in HEK293T cells measured by a band shift in Phos-tag gel electrophoresis (Fig. 2C). In contrast, all three of our prioritized compounds increased IRE1 phosphorylation in these cells, indicating that they promote IRE1 autophosphorylation in the presence or absence of ER stress. Furthermore, co-treatment of IXA1, IXA4, and IXA6 with the IRE1 kinase inhibitor KIRA6, a compound that binds the IRE1 nucleotide binding pocket and inhibits both IRE1 kinase and RNAse activity30, inhibits IRE1-dependent XBP1 splicing in HEK293T cells (Fig. 2D). Similarly, our compounds did not significantly increase XBP1s mRNA levels in Ire1-deficient MEF cells reconstituted with the kinase inactive P830L IRE1 (Fig. 2E). Collectively, these results indicate that our compounds do not bind the IRE1 kinase active site, but instead activate IRE1/XBP1s signaling through a mechanism requiring IRE1 autophosphorylation.
IXA4 and IXA6 Selectively Activate IRE1/XBP1s Signaling
We next performed RNAseq to define the selectivity of our compounds for IRE1/XBP1s signaling (Source Data Table 2). The majority of genes induced by IXA1, IXA4, and IXA6 are known transcriptional targets of IRE1/XBP1s (Fig. 3A–C). These include the ER proteostasis factors SEC24D, DNAJB9, and HERPUD15. We next defined the selectivity of our compounds for IRE1/XBP1s signaling relative to other arms of the UPR. We assessed selectivity by monitoring the expression of genesets comprised of 10–20 genes that are preferentially induced by the IRE1/XBP1s, ATF6, or PERK UPR signaling pathways (Source Data Table 3)5, 36. For this analysis, we normalized the expression of individual genes to that observed in Tg-treated cells (Tg representing 100% activation of each gene). This allows us to directly compare gene expression without complications arising from differential expression36. We found that IXA1, IXA4, and IXA6 activate the IRE1/XBP1s geneset to levels ~30–40% that observed for Tg (Fig. 3D–F); levels nearly identical to those observed in other experiments (Fig. 2A,B). Our compounds showed only a modest increase in the activation of the ATF6 target geneset (<20% that observed with Tg), which is consistent with previous reports showing overlap between genes primarily regulated by ATF6 and their mild induction by IRE1/XBP1s (e.g., BiP; Extended Data Fig. 2F)5. Thus, these results indicate that our compounds do not significantly activate ATF6 transcriptional signaling. However, IXA1 did increase expression of the PERK geneset, indicating mild activation of the PERK pathway (Fig. 3D). Notably, IXA4 and IXA6 did not activate the PERK geneset (Fig. 3E,F). Collectively, these results indicate that compounds IXA4 and IXA6 preferentially activate IRE1/XBP1s signaling, while compound IXA1 shows some promiscuous activity in the context of UPR signaling.
Figure 3. Transcriptional profiling of compounds IXA1, IXA4, and IXA6 shows preferential induction of IRE1/XBP1s target genes.
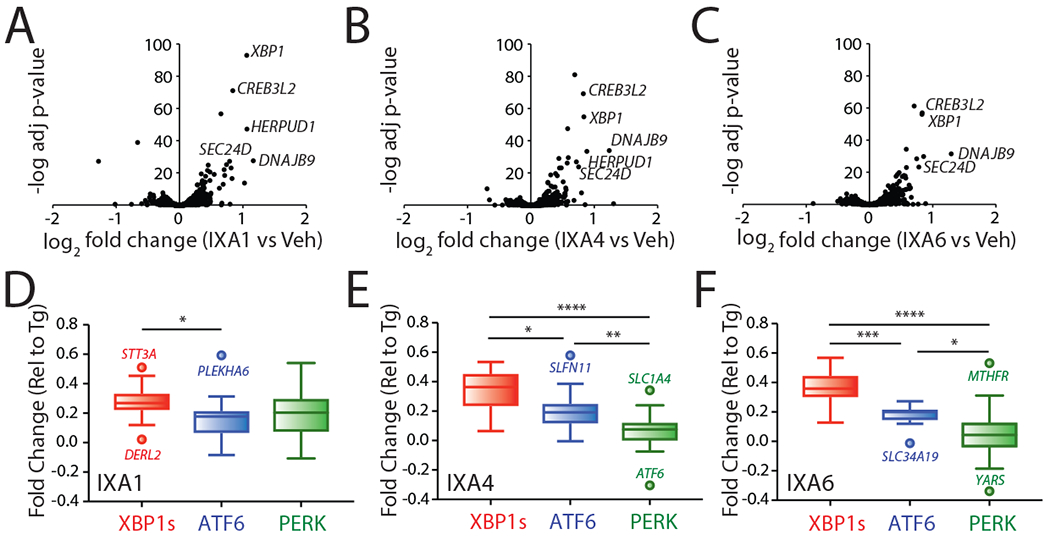
A. Volcano plots from whole-transcriptome RNAseq showing negative log transformed adjusted p-values for gene expression (y-axis) versus log2 transformed fold change (x-axis) in HEK293T cells treated for 4 hrs with IXA1 (10 μM).
B. Volcano plots from whole-transcriptome RNAseq showing negative log transformed adjusted p-values for gene expression (y-axis) versus log2 transformed fold change (x-axis) in HEK293T cells treated for 4 hrs with IXA4 (10 μM).
C. Volcano plots from whole-transcriptome RNAseq showing negative log transformed adjusted p-values for gene expression (y-axis) versus log2 transformed fold change (x-axis) in HEK293T cells treated for 4 hrs with IXA6 (10 μM).
D. Plots showing fold change values from whole-transcriptome RNAseq of target genes regulated downstream of the IRE1/XBP1s (red), ATF6 (blue), or PERK (green) signaling arms of the UPR expressed as fold change relative to Tg treatment (1 μM, 4hr) in HEK293T cells treated with IXA1 (10 μM, 4hr). Center line reflects median, box limits reflect upper and lower quartiles, whiskers reflect 1.5x IQ range, and points reflect outliers as calculated by Tukey method. The composition of these genesets is shown in Source Data Table 3.
E. Plots showing fold change values from whole-transcriptome RNAseq of target genes regulated downstream of the IRE1/XBP1s (red), ATF6 (blue), or PERK (green) signaling arms of the UPR expressed as fold change relative to Tg treatment (1 μM, 4hr) in HEK293T cells treated with IXA4 (10 μM, 4hr). Center line reflects median, box limits reflect upper and lower quartiles, whiskers reflect 1.5x IQ range, and points reflect outliers as calculated by Tukey method. The composition of these genesets is shown in Source Data Table 3.
F. Plots showing fold change values from whole-transcriptome RNAseq of target genes regulated downstream of the IRE1/XBP1s (red), ATF6 (blue), or PERK (green) signaling arms of the UPR expressed as fold change relative to Tg treatment (1 μM, 4hr) in HEK293T cells treated with IXA6 (10 μM, 4hr). Center line reflects median, box limits reflect upper and lower quartiles, whiskers reflect 1.5x IQ range, and points reflect outliers as calculated by Tukey method. The composition of these genesets is shown in Source Data Table 3.
We additionally evaluated IRE1 RIDD activity using our RNAseq dataset. Despite observing robust IRE1/XBP1s transcriptional activity following 4 hrs of treatment, we did not observe significant reductions in the RIDD targets SCARA3, BLOC1S1 or COL6A117, although the levels of these mRNA are reduced in Tg-treated cells (Extended Data Fig. 3A–C). This may reflect a dependence of RIDD on PERK-dependent eIF2α phosphorylation.37 Taken together, these results indicate that our prioritized compounds promote adaptive IRE1/XBP1s signaling, but not RIDD, following 4 hrs of treatment in HEK293T cells.
Compounds Activate the XBP1s Transcriptional Response
Gene Ontology (GO) analysis shows that our IRE1/XBP1s activating compounds primarily induce expression of genes annotated with GO terms related to ER stress and the UPR (Fig. 4A–B, Extended Data 4A, Supplementary Table 4). This suggests that our compounds do not activate other stress-signaling pathways. Consistent with this, applying a geneset approach similar to that described in Fig. 3D–F36, we show that our compounds do not significantly activate stress-responsive proteostasis pathways such as the cytosolic heat shock response, the oxidative stress response, the mitochondrial unfolded protein response, or the NFB inflammatory response (Extended Data Fig. 4B–D, Source Data Table 3). These results indicate that IXA4 and IXA6 (and to a lesser extent IXA1) do not significantly activate other stress responsive signaling pathways apart from IRE1/XBP1s.
Figure 4. Compounds IXA4 and IXA6 show selectivity for IRE1/XBP1s-dependent ER proteostasis remodeling.
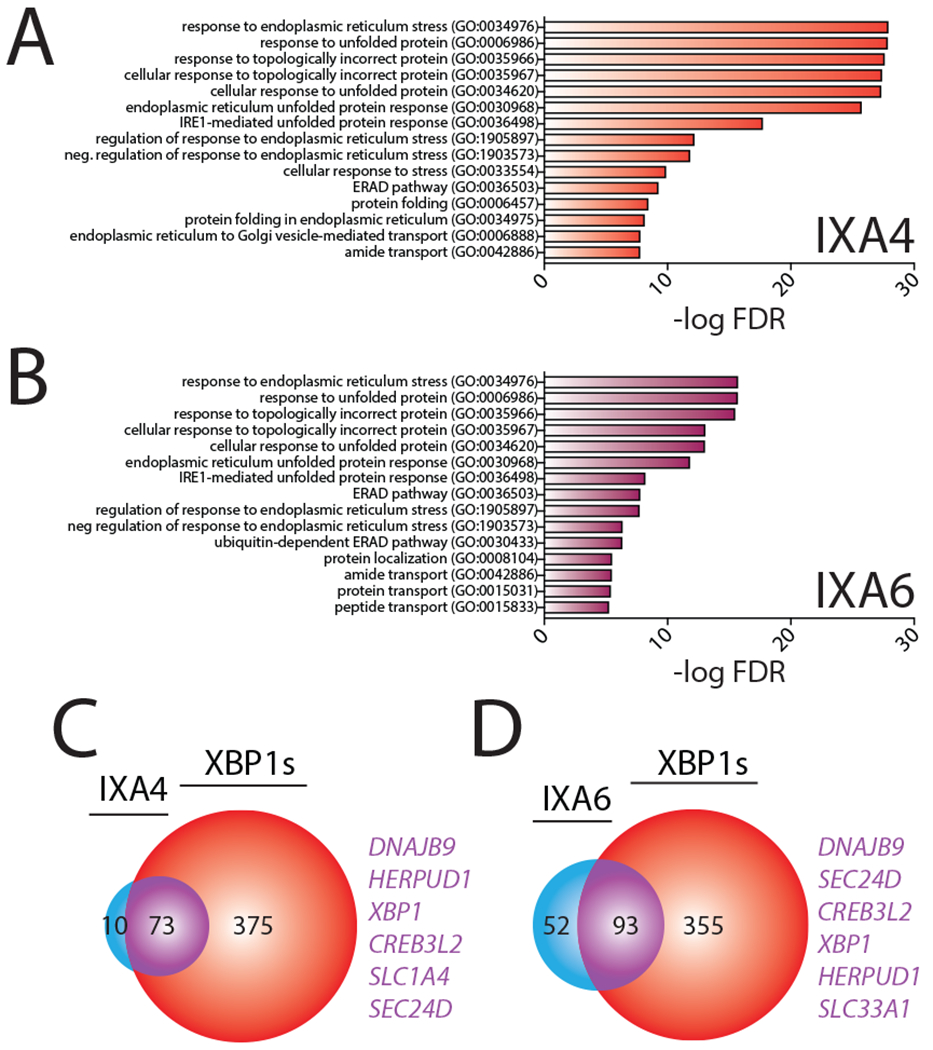
A. Gene Ontology (GO) analysis of differentially expressed genes from RNAseq for HEK293T cells treated with IXA4 (10 μM, 4hr). Top 15 entries with lowest FDR are shown. See Supplementary Table 4 for full GO analysis.
B. Gene Ontology (GO) analysis of differentially expressed genes from RNAseq for HEK293T cells treated with IXA6 (10 μM, 4hr). Top 15 entries with lowest FDR are shown. See Supplementary Table 4 for full GO analysis.
C. Venn diagram of genes upregulated >1.2 fold (adjusted p-value <0.05) in HEK293T cells treated with compound IXA4 (10 μM) for 4 hrs in comparison to genes induced >1.2 fold (adjusted p-value < 0.05) in HEK293DAX cells treated with doxycycline (1 μg/mL) for 4 hrs. Genes listed in purple are top overlapping targets between conditions.
D. Venn diagram of genes upregulated >1.2 fold (adjusted p-value <0.05) in HEK293T cells treated with compound IXA6 (10 μM) for 4 hrs in comparison to genes induced >1.2 fold (adjusted p-value < 0.05) in HEK293DAX cells treated with doxycycline (1 μg/mL) for 4 hrs. Genes listed in purple are top overlapping targets between conditions.
Next, we compared the expression of the top 100 genes significantly induced by our compounds to the expression of these genes following stress-independent XBP1s or ATF6 transcription factor activation in HEK293DAX cells, where chemical genetic activation of XBP1s or ATF6 transcriptional signaling can be achieved by addition of different activating ligands5. Interestingly, the majority of the top 100 genes induced by IXA4 and IXA6 overlapped with genes induced by genetic XBP1s activation (Extended Data Fig. 5A,B), although, as expected, genetic XBP1s activation induces these genes to higher extents (Extended Data Fig. 4E). However, substantial overlap with ATF6 target genes was not observed, further indicating that our compounds do not significantly activate this UPR pathway (Extended Data Fig. 5A,B). The high level of overlap observed for genes induced by XBP1s and our compounds is further evident when comparing the groups of genes induced >1.2 fold by either IXA4 or IXA6 and genetic XBP1s activation. Compound IXA4 shows 88% overlap of genes induced >1.2 fold, while compound IXA6 shows 64% overlap (Fig. 4C,D). In contrast, compound IXA1 shows less overlap with genetic XBP1s activation (Extended Data Fig. 4F,5C), reflecting the more promiscuous nature of this compound (Fig. 3D). Interestingly, of the 10 non-overlapping genes identified for IXA4 (Fig. 4C), 9 are also induced by IXA6, likely reflecting a similar mechanism of induction (Extended Data Fig. 4G). Two of these genes, IDI1 and SLC35A3 are reported to be regulated by IRE1/XBP1s38, 39. Furthermore, the mild IXA4-dependent increase in LRRCC1 appears to be reduced by co-treatment with 4μ8c, suggesting that this gene is also regulated by IRE1 (Extended Data Fig. 4H). In contrast, HSPA1A and HSPA1B are induced by many different stress pathway activators through an undefined mechanism36 and the mild IXA4-dependent increase in CETN3 does not appear sensitive to 4μ8c (Extended Data Fig. 4I). This indicates that IXA4 may induce a small subset of genes through an IRE1-independent mechanism. Taken together, the results in Fig. 4 confirm that IXA4 is the most selective for the IRE1/XBP1s signaling pathway. Thus, we prioritized IXA4 for further mechanistic scrutiny and phenotypic studies based on the fidelity of its transcriptional response.
We confirmed the identity and chemical purity of IXA4 using NMR and HPLC (Supplementary Figure 1). We then used immunoblotting to show that IXA4 increases XBP1s protein in HEK293T cells to levels ~40% that with Tg, but did not significantly increase phosphorylation of PERK or eIF2, further highlighting the selectivity of this compound (Extended Data Fig. 6A). Similarly, we showed IXA4 selectively upregulates XBP1s mRNA, relative to genes regulated by ATF6 (e.g., BiP) or PERK (e.g., CHOP), in other cell lines including Huh7 and SHSY5Y cells (Extended Data Fig. 6B,C). Similar results were observed for IXA6 (Extended Data Fig. 6A–C). Lastly, phosphokinase profiling shows that IXA4 did not increase phosphorylation of JNK or c-Jun (Extended Data Fig. 6D) – two kinase targets phosphorylated upon chronic IRE1 activation through an XBP1s-independent mechanism40. Other kinase targets measured in this assay were also not significantly impacted by IXA4 treatment. These data further support the selective activation of IRE1/XBP1s UPR signaling pathway afforded by IXA4.
IXA4 Reduces Secretion of APP through IRE1 activation
IRE1/XBP1s signaling promotes targeted remodeling of ER proteostasis pathways comprised of chaperones, folding enzymes, trafficking proteins, and degradation factors5, 6. Consistent with its selectivity for IRE1/XBP1s, IXA4 also promotes selective transcriptional remodeling of ER proteostasis pathways, relative to cytosolic or mitochondrial pathways (Fig. 5A, Source Data Table 2,3). Quantitative immunoblotting of the IRE1/XBP1s trafficking factor SEC24D confirmed IXA4-dependent increases in ER proteostasis factor gene expression correspond to increased protein levels (Extended Data Fig. 7A). Similar results were observed with IXA6 (Extended Data Fig. 7A,B).
Figure 5. Compound IXA4 increases degradation of amyloid precursor protein (APP) mutants.
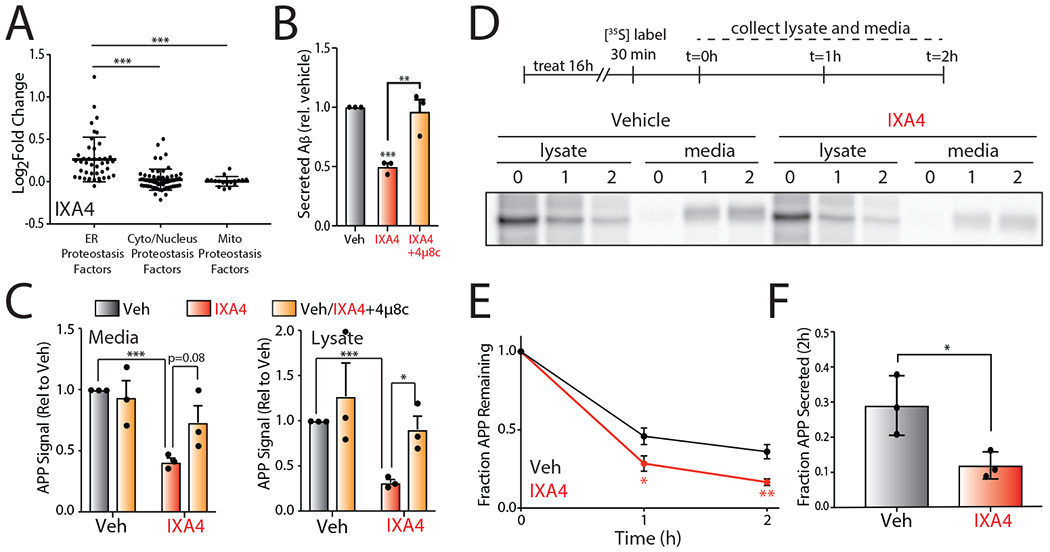
I. Plot of log2 Fold Change mRNA levels from RNAseq in cells treated with IXA4 (10 μM, 4hr) of proteostasis factors found in the ER, cytosol/nucleus, or mitochondria. The composition of these proteostasis genesets is shown in Source Data Table 3.
J. Graph showing relative signal from ELISA of secreted Aβ peptide in conditioned media from CHO7PA2 cells treated with IXA4 (10 μM) in the presence or absence of 4μ8c (32 μM). Cells were pretreated for 18 hrs with compounds. Media was then replaced and conditioned in the presence of compounds for 24 hrs before harvesting conditioned media for ELISA. Secreted Aβ was normalized to that observed in untreated controls. Error bars represent SE for n = 3 replicates. P-values calculated from one-tailed Student’s t-test. **p<0.01, ***p<0.001.
K. Quantification of mutant APP relative to vehicle-treated controls in media and lysate isolated from CHO7PA2 cells treated with IXA4 (10 μM) and/or 4μ8c (32 μM) as in panel B, measured by immunoblotting. A representative immunoblot is shown in Extended Data Fig. 8A. Error bars represent SD for n = 3 replicates. P-values calculated from one-tailed Student’s t-test. *p<0.05, ***p<0.001.
L. Representative autoradiogram showing the [35S] metabolic labeling of mutant APP in CHO7PA2 cells treated with IXA4 (10μM) for 16 hrs prior to 30 min labeling. Media and lysates were collected at 0, 1, or 2 hrs and [35S]-labeled mutant APP was isolated by immunopurification. The experimental protocol is shown above.
M. Plot showing fraction mutant APP remaining at each time point of the metabolic labeling experiment shown in panel D. Fraction remaining was calculated using the following equation: (APP in lysate at time = t + APP in media at time = t) / (APP in lysates at t = 0 + APP in media at t = 0). Error bars represent SD for n = 3 replicates. P-values were calculated from one-tailed Student’s t-test. *p<0.05, **p<0.01.
N. Plot showing fraction of fraction APP secreted at 2 hrs of the metabolic labeling experiment shown in panel D. Fraction secretion was calculated using the following equation: (APP in media at time = t) / (APP in lysates at t = 0 + APP in media at t = 0). Error bars represent SD for n = 3 replicates. P-values were calculated from one-tailed Student’s t-test. *p<0.05.
The potential of our compounds to remodel the ER proteostasis network through IRE1/XBP1s activation suggests that these compounds could correct pathologic imbalances in ER proteostasis for disease-relevant proteins such as amyloid precursor protein (APP). APP is a secretory protein that undergoes proteolytic processing to produce aggregation-prone cleavage products including the amyloidogenic peptide Aβ41. Enhancing ER proteostasis through XBP1s overexpression reduces secretion of toxic Aβ23, 24. Thus, we predicted that the enhanced ER proteostasis environment afforded by IRE1/XBP1s activation by our compounds would similarly reduce Aβ secretion.
We show that IXA4 reduced Aβ levels 50% in conditioned media prepared on CHO7PA2 cells expressing the V717F APP (APPV717F) mutant (Fig. 5B)42. We confirmed compound-dependent IRE1/XBP1s activation in these cells by qPCR (Extended Data Fig. 7C). Importantly, IXA4 did not significantly influence CHO7PA2 viability measured by CellTiter Glo (Extended Data Fig. 7D). Similarly, we did not observe reductions in cell proliferation or increases in PARP cleavage in IXA4-treated CHO7PA2 cells (Extended Data Fig. 7E,F). These results indicate that the compound-dependent reduction in Aβ secretion cannot be attributed to cell death. Importantly, the IXA4-dependent reduction in Aβ secretion is blocked by co-treatment with 4μ8c, confirming this reduction is dependent on IRE1 RNAse activity (Fig. 5B). Similar results were observed in CHO7WD10 cells stably expressing wild-type APP (APPWT) and in cells treated with the alternative IRE1/XBP1s activator IXA6 (Extended Data Fig. 7D–H).
XBP1s overexpression has been shown to reduce Aβ secretion through the increased targeting of APP to ER-associated degradation (ERAD).23, 24 Interestingly, IXA4 reduced APPV717F protein levels in both lysates and conditioned media prepared on CHO7PA2 cells, indicating that this compound increases APP degradation (Fig. 5C, Extended Data Fig. 8A). This reduction was reversed by co-treatment with either 4μ8c or the proteasome inhibitor MG132 (Fig. 5C, Extended Data Fig. 8A–C), indicating that APPV717F levels were reduced through a mechanism involving both IRE1 RNAse activity and ERAD via the proteasome. This is consistent with reports demonstrating that XBP1s overexpression increases APP ERAD.24 We further demonstrated that IXA4 reduces APPV717F secretion and increases APPV717F degradation using [35S] metabolic labeling (Fig. 5D–F). Similar results were observed with IXA6 (Extended Data Fig. 8D). Collectively, these results demonstrate that our compounds reduce Aβ secretion and increase APP degradation through an IRE1-dependent mechanism.
IXA4 prevents APP-associated mitochondrial dysfunction
Previous results show that overexpression of wild-type (APPWT) or Swedish APP (APPSW) double mutant (K595N/M596L) induces mitochondrial dysfunction in SHSY5Y cells through the production of toxic APP cleavage products that localize to mitochondria and mitochondria-associated ER membranes (MAMs)43, 44. Consistent with this, overexpression of APPWT or APPSW in SHSY5Y resulted in a 25% or 40% reduction of mitochondrial membrane potential, respectively, as measured by tetramethylrhodamine (TMRE) staining (Fig. 6A,B). Overexpression of APPSW in SHSY5Y cells modestly increased expression of the IRE1/XBP1s target gene DNAJB9, but not other UPR genes such as the PERK-regulated target gene CHOP (Extended Data Fig. 9A,B). Treatment with IXA4 further increased DNAJB9 expression, indicating that our compounds are active in this model. Interestingly, treatment with IXA4 prevented the APPWT- or APPSW-dependent reductions in mitochondrial membrane potential in these cells (Fig. 6C,D and Extended Data Fig. 9C). This indicates that pharmacologically enhancing IRE1/XBP1s activity can block APP-associated mitochondrial depolarization.
Figure 6. The IRE1/XBP1s activator IXA4 rescues mitochondrial defects in SH-SY5Y cells expressing disease-relevant APP mutants.
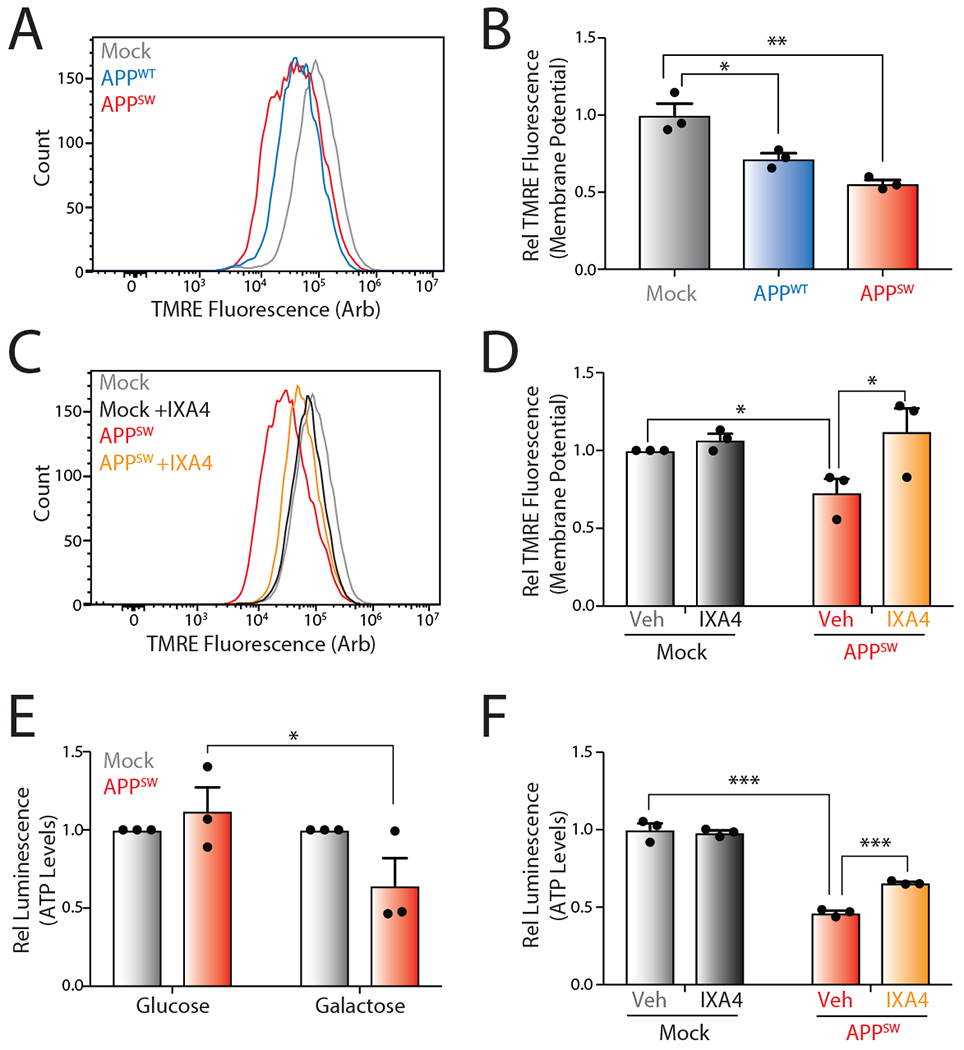
D. Representative histograms showing TMRE staining of SHSY5Y cells transiently expressing empty vector (Mock), wild-type APP (APPWT), or Swedish mutant APP (APPSW).
E. Quantification of TMRE staining from panel A. TMRE normalized to geometric mean from cells transiently expressing empty vector (Mock). Error bars represent SD for n = 3 replicates. P-values were calculated from one-tailed Student’s t-test. *p<0.05, **p<0.01.
F. Representative histograms showing TMRE staining of SHSY5Y cells transiently expressing empty vector (Mock) or APPSW in the presence or absence of IXA4 (10 μM) for 72 hrs.
G. Quantification of TMRE staining from panel C. TMRE normalized to geometric mean from cells transiently expressing empty vector (Mock). Error bars represent SE for n = 3 replicates. P-values were calculated from one-tailed Student’s t-test. *p<0.05.
H. Graph showing relative ATP levels measured by CellTiterGlo luminescence in SHSY5Y cells transiently expressing empty vector or APPSW cultured in either normal high glucose media or glucose-free media supplemented with galactose for 72 hrs. Luminescence signal was normalized to that observed in cells transiently expressing empty vector (Mock) cultured in glucose- or galactose-containing media. Error bars represent SE for n = 3 replicates. P-values were calculated from one-tailed Student’s t-test. *p<0.05
I. Graph showing relative ATP levels measured by CellTiterGlo luminescence in SHSY5Y cells transiently expressing empty vector (Mock) or APPSW cultured in galactose media for 72 hrs in the presence or absence of IXA4 (10 μM). Luminescence signal was normalized to that observed in cells transiently expressing empty vector (Mock) incubated in the absence of IXA4. Error bars represent SD for n = 3 replicates. P-values were calculated from one-tailed Student’s t-test. ***p<0.001.
Mitochondrial depolarization decreases the capacity for cells to produce ATP through oxidative phosphorylation at the inner mitochondrial membrane. Thus, APPSW-dependent mitochondrial depolarization should reduce mitochondrial ATP production. To confirm this, we demonstrated that APPSW overexpression reduced ATP levels in SHSY5Y cells cultured in galactose-containing media, where ATP is primarily produced by mitochondria, but not in SHSY5Y cells cultured in glucose media, where ATP is primarily produced by glycolysis (Fig. 6E)45. Importantly, treatment with IXA4 rescued ATP levels in APPSW-overexpressing cells cultured in galactose media, further demonstrating that this compound mitigates mitochondrial dysfunction induced by toxic APPSW overexpression (Fig. 6F).
DISCUSSION
IRE1 activating compounds have traditionally been developed by targeting the IRE1 nucleotide binding pocket to induce allosteric activation of the IRE1 RNAse13–15. While these types of compounds have provided important insights into the molecular mechanism of IRE1 activation, their utility for defining the functional implications of IRE1/XBP1s signaling is limited due to off-pathway activity, likely due to their binding to other kinases15, 29, 30. This indicates that new strategies are required to establish highly selective IRE1/XBP1s activating compounds that can be used to probe the biological and potentially therapeutic benefit of IRE1/XBP1s signaling in the context of diverse diseases. The implications of finding these highly selective IRE1/XBP1s activators is evident from recent work establishing non-toxic, selective activators of the ATF6 UPR signaling pathway, which have revealed new insights into the functional importance of ATF6 activity in diverse biological functions including ER proteostasis remodeling, mammalian development, and cardiac protection against myocardial infarction31, 46, 47.
Here, we employ a screening strategy that prioritizes transcriptional profiling over mechanism-based activation to identify non-toxic compounds that selectively activate the IRE1/XBP1s arm of the UPR. Our compounds (e.g., IXA4) activate IRE1/XBP1s signaling without globally activating the UPR or other stress-responsive signaling pathways (e.g., the heat shock response or oxidative stress response). Importantly, our compounds increase IRE1 RNase activity through a mechanism independent of binding the IRE1 nucleotide-binding pocket. This demonstrates that our compounds are distinct from currently available IRE1 activators, which bind the kinase active site. Interestingly, we showed that treatment of HEK293T cells with our prioritized compound IXA4 does not induce XBP1s-independent IRE1 signaling such as RIDD or JNK phosphorylation – two aspects of IRE1 activity often associated with chronic activation of this signaling pathway37, 40. The lack of RIDD and JNK phosphorylation could reflect the moderate activation of IRE1/XBP1s signaling afforded by our compounds or requirements of other signaling inputs (e.g., PERK activation37) to promote their activation. However, it is possible that our compounds could activate these aspects of IRE1 signaling in other cell types or experimental conditions, although this could likely be controlled through varying the compound dosage and administration.
While the mechanism by which our compounds activate IRE1/XBP1s signaling requires further exploration, we show that they induce adaptive ER proteostasis remodeling that mimics that observed with chemical genetic XBP1s activation. This provides new opportunities to define the functional implications of IRE1/XBP1s signaling in the context of health and disease. We demonstrate this potential by showing that our prioritized compound IXA4 improves ER proteostasis of AD-relevant APP mutants, reducing the secretion of Aβ through the increased targeting of APP to degradation. Further, we show that IXA4 reduces mitochondrial dysfunction associated with mutant APP overexpression, likely reflecting the reduced intracellular APP afforded by compound treatment. These results highlight the potential for targeting ER proteostasis to mitigate pathologic disruption in other organelles, including the mitochondria, which can be induced by destabilized, disease-associated proteins.
Genetic activation of IRE1/XBP1s signaling promotes protection against different types of pathologic insults associated with multiple diseases20–22, 25, 28, 48. This indicates that IRE1 represents a potential therapeutic target for these disorders. However, in the context of ER stress, chronic IRE1 activity can promote detrimental phenotypes such as increased apoptosis and inflammation in models of diseases such as atheroscleorosis and sepsis49, 50, potentially limiting the therapeutic applications for IRE1/XBP1s activating compounds. Pharmacologic IRE1/XBP1s activation afforded by our compounds (e.g., IXA4) offers advantages over genetic strategies to probe the therapeutic potential for IRE1/XBP1s activation to intervene in these diseases. Our compounds allow selective activation of IRE1/XBP1s in disease-relevant models, independent of genetic manipulation. Furthermore, they allow dosable and temporal control over IRE1/XBP1s activity using different dosing regimens, potentially limiting the adverse outcomes associated with chronic IRE1 activation. Thus, the highly selective, non-toxic IRE1/XBP1s activating compounds established herein (e.g., IXA4) provide new opportunities to probe the functional implications of this signaling pathway in diverse contexts and define the therapeutic potential for activating IRE1 to mitigate pathologic imbalances in cellular physiology implicated in diverse diseases.
ONLINE METHODS
Materials and Reagents
Antibodies: APP (6E10, Fisher Scientific Cat #501029533), APP (HRP-4G8, Fisher Scientific Cat #501029498), SEC24D (mouse) antibody was provided as a generous gift from the Balch Lab at TSRI, XBP1s (Cell Signaling Cat #12782S), KDEL (Enzo Cat # ADI-SPA-827-F), P-eIF2α (Cell Signaling Cat #9721S), Tot-eIF2α (Abcam Cat # ab5369), PERK (Cell Signaling Cat #3192S), PARP (Cell Signaling Cat #9542S), Tubulin (Sigma Cat # T6074-200UL)
Pharmacologics: Thapsigargin (Fisher Scientific Cat # 50-464-295), 4μ8c (EMD Millipore Cat #412512), IXA1 (ChemDiv Cat # C522-3739), IXA2 (ChemDiv Cat # C527-0672), IXA3 (Hit2Lead Cat # SC-46317020), IXA4 (Hit2Lead Cat # SC-91093541), IXA5 (Life Chemicals Cat # F3164-0105), IXA6 (Life Chemicals Cat # F5120-0005), IXA7 (Life Chemicals Cat # F5098-0023), KIRA6 (Selleck Chemicals Cat #S8658), Staurosporine (LKT Cat # S7600-1 mg), MG132 ( Selleck Chem Cat# S3619)
High Throughput Screening (including all the filtering steps and the Chemical Clustering)
HEK293TREX cells incorporating either the XBP1-Rluc or ERSE-FLuc reporters were collected by trypsinization and resuspended at a density of 500,000 cells per mL. The assay was started by dispensing 5 μL of cell suspension into each well of white, solid-bottom 1536-well plates using a flying reagent dispenser (FRD) and placed into an online incubator for 3 hrs. Cells were then treated with 34 nL/well of either test compounds to give final concentrations of 5.17 μM, DMSO (low control, final concentration 0.68%, 0% activation) or 37 μM of Delta-7 thapsigargin (high control, final concentration 500 nM, 100% activation). Plates were incubated for 18 hrs at 37°C, removed from the incubator and equilibrated to room temperature for 10 min. Luciferase activity was detected by addition of 5 μL of Renilla-Glo reagent (Promega) to each well. After a 10 min incubation time, light emission was measured with the ViewLux reader (PerkinElmer). Tg exhibited a robust signal to noise ratio (4.06 +/− 0.23) and was used to confirm consistent assay performance across experimental plates (Z’ = 0.69 +/− 0.01). Compound (5.17 μM) dependent XBP1-RLuc activation was additionally normalized to Tg (assigned to be 100% activation) to allow comparisons between compounds across screening plates. The percent activation of each test compound was calculated as follows: % Activation = 100*(Test Compound- Median Low Control) / (Median High Control – Median Low Control). Primary screening of the 646,275 compound library at Scripps Florida yielded 10,114 hits for XBP1-Rluc activity at ≥ 13.83% activation by thapsigargin (three times the standard deviation of the negative DMSO control in the assay), an approximate 1.5% hit rate. Compounds that hit in more than 7 screens (promiscuity score) were eliminated, as well as those that elicited HSP70 activation. The top 6,391 remaining compounds were moved forward to triplicate confirmation screening and HEK293TREX CTG cytotoxicity counterscreening. Toxic compounds found to reduce cell viability >26.19% (5.17 μM) relative to doxorubicin were removed, leaving 6,185 non-toxic compounds showing reproducible XBP1-RLuc activation. Duplicates were removed from the resulting list, and the top 638 activating compounds were moved forward for triplicate titration screening and HEK293TREX CTG titration counterscreening. These 638 compounds were subjected to hierarchical clustering using the Library MCS application from the ChemAxon JChem Suite, grouping 551 of these by 20 conserved structural motifs, with 87 singletons. All 638 compounds were also subject to quality control measurements by LC-MS, UV-vis spectroscopy, MS, and ELSD to confirm purity and mass. Those that did not pass both of these quality checks were eliminated. From titration data of the remaining compounds, those with < 20% reporter activation, and EC50s >3uM were eliminated. Additionally, compounds from the HEK293TREX CTG counterscreen with EC50s <3uM were also eliminated. Remaining clustered compounds were iteratively subclustered so that the diversity of the cluster would be captured by a smaller representative group, comprised only of compounds that activated the reporter to a practical degree for in vitro measurements (>30%). Remaining singleton compounds that passed quality control and showed reporter activation >30% were also included for in vitro assays.
RNASeq analysis (including Geneset analysis and GO-term analysis)
Cells were lysed and total RNA collected using the RNeasy mini kit, according to manufacturer’s instructions (Qiagen). Conventional RNAseq was conducted via BGI Americas on the BGI Proprietary platform, providing single-end 50bp reads at 20 million reads per sample. Alignment of sequencing data was done using DNAstar Lasergene SeqManPro to the GRCh37.p13 human genome reference assembly, and assembly data were imported into ArrayStar 12.2 with QSeq (DNAStar Inc.) to quantify the gene expression levels and normalization to reads per kilobase per million (RPKM). Differential expression analysis and statistical significance calculations between different conditions was assessed using “DESeq” in R, compared to vehicle-treated cells, using a standard negative binomial fit of the RPKM data to generate Fold Change quantifications.
Cell Culture and Transfections
Briefly, all cells lines were cultured in high-glucose Dulbecco’s Modified Eagle’s Medium (DMEM; Corning-Cellgro) supplemented with 10% fetal bovine serum (FBS; Omega Scientific), 2 mM L-glutamine (Gibco), 100 U*mL−1 penicillin, and 100 μg*mL-1 streptomycin (Gibco). SH-SY5Y cells in galactose conditions were cultured in glucose-free Dulbecco’s Modified Eagle’s Medium (DMEM; Corning-Cellgro) supplemented with 10% fetal bovine serum (FBS; Omega Scientific), 2 mM L-glutamine (Gibco), 100 U*mL−1 penicillin, and 100 μg*mL-1 streptomycin (Gibco) and 5mM galactose. All cells were cultured under typical tissue culture conditions (37°C, 5% CO2). Cells were routinely tested for mycoplasma every 6 months. No further authentication of cell lines was performed by the authors. Cells were transfected using calcium phosphate precipitation. All plasmids for transfection were prepared using the Qiagen Midiprep kit according to the manufacturers protocol. 7PA2 cells were kindly provided by Prof. E. Koo (University of California, San Diego).
qPCR, Transcriptional Profiling
Primers:
hDNAJB9 (F: GGAAGGAGGAGCGCTAGGTC, R: ATCCTGCACCCTCCGACTAC)
hBiP (F:GCCTGTATTTCTAGACCTGCC, R: TTCATCTTGCCAGCCAGTTG)
hCHOP (F:ACCAAGGGAGAACCAGGAAACG, R: TCACCATTCGGTCAATCAGAGC)
hLRRCC1 (F:TCATCGAGAAAGAGAACAAGCGC, R: GATTATGACAGAGAAGCCACAGG)
hCETN3 (F:GATTATGACAGAGAAGCCACAGG, R: ATGCCTTGAGTATTTCTTCATGGG)
hRiboPro (F:CGTCGCCTCCTACCTGCT, R: CCATTCAGCTCACTGATAACCTTG)
mXBP1s (F:ACGAGGTTCCAGAGGTGGAG, R: TGTCCAGAATGCCCAAAAGG)
mRiboPro (F:TGTCATCGCTCAGGGTGTTG, R: AAGCCAAATCCCATGTCGTC)
hamXBP1u (F:CTCCAGAGACGGAGTCCAAG, R: CAGAGGTGCACGTAGTCTGAGTGCTG)
hamXBP1s (F:CTCCAGAGACGGAGTCCAAG, R: CACCTGCTGCGGACTC)
hamActin (F:AGCTGAGAGGGAAATTGTGCG, R: GCAACGGAACCGCTCATT)
The relative mRNA expression levels of target genes were measured using quantitative RT-PCR. Cells were treated as described at 37°C, washed with Dulbecco’s phosphate-buffered saline (GIBCO), and then RNA was extracted using the RNeasy Mini Kit (QIAGEN). qPCR reactions were performed on cDNA prepared from 500 ng of total cellular RNA using the QuantiTect Reverse Transcription Kit (QIAGEN). The FastStart Universal SYBR Green Master Mix (Roche), cDNA, and primers purchased from Integrated DNA Technologies were used for amplifications (6 min at 95°C then 45 cycles of 10 s at 95°C, 30 s at 60°C) in an ABI 7900HT Fast Real Time PCR machine. Primer integrity was assessed by a thermal melt to confirm homogeneity and the absence of primer dimers. Transcripts were normalized to the housekeeping genes RiboPro and all measurements were performed in triplicate. Data were analyzed using the RQ Manager and DataAssist 2.0 softwares (ABI). qPCR data are reported as mean ± 95% confidence interval as calculated in DataAssist 2.0.
Immunoblotting, SDS-PAGE, and Phos-tag SDS-PAGE
Cell lysates were prepared as previously described in RIPA buffer (50 mM Tris, pH 7.5, 150 mM NaCl, 0.1 % SDS, 1% Triton X-100, 0.5% deoxycholate and protease inhibitor cocktail (Roche). Total protein concentration in cellular lysates was normalized using the Bio-Rad protein assay. Lysates were then denatured with 1X Laemmli buffer + 100 mM DTT and boiled before being separated by SDS-PAGE. Samples were transferred onto nitrocellulose membranes (Bio-Rad) for immunoblotting and blocked with 5% milk in Tris-buffered saline, 0.5 % Tween-20 (TBST) following incubation overnight at 4°C with primary antibodies. Membranes were washed in TBST, incubated with IR-Dye conjugated secondary antibodies and analyzed using Odyssey Infrared Imaging System (LI-COR Biosciences). Quantification was carried out with LI-COR Image Studio software.
Phosphokinase Array
The Proteome Profile Human Phospho-kinase Array Kit from R&D Systems (Cat # ARY003C) was used to assess phosphorylation status of a panel of human kinases in HEK293T cells treated with IXA4 compared to vehicle. The array was performed per manufacturer instructions. Briefly, cell lysates were prepared after 4 hrs of treatment, and incubated on membranes containing antibodies for kinases of interest. Each antibody had been dotted in duplicate. After washing, HRP-conjugated secondary antibody cocktail was incubated on membranes. HRP substrate was then incubated on membranes, and dot blots were visualized via chemiluminescence with a Bio-Rad ChemiDoc XRS+.
PCR and Agarose Gel Electrophoresis
To amplify the spliced and unspliced XBP1 mRNA, XBP1 primers were used as described previously16. PCR products were electrophoresed on 2.5% agarose gel. GAPDH (forward 5′GGATGATGTTCTGGAGAGCC3′, reverse 5′CATCACCATCTTCCAGGAGC3′) was used as a loading control. The size difference between the spliced and the unspliced XBP1 is 26 nucleotides.
Aβ ELISA
7PA2 or 7WD10 cells were cultured on 96-well plates (Corning) and treated with IRE1 activating compounds +/− 4μ8c overnight. The medium was then replaced with fresh medium containing treatment at a reduced volume (50%), culture medium was collected after 24 hrs. The medium was analyzed by an Aβ ELISA as follows. Monoclonal 6E10 anti-Aβ(residues 1–17) mouse IgG1, (Biolegend) was coated in 50 mm carbonate buffer, pH 9.6, at 4°C overnight on high binding assay black plates (Costar), washed with TBST (tris buffered saline with 0.05% Tween 20) and blocked with 5% non-fat milk in TBST. Samples and standards (condition 7PA2 media) were incubated for 1.5 hrs, followed by addition of 4G8 antibody [anti-Aβ residues 17–24, mouse IgG2b (Biolegend)] conjugated to horseradish peroxidase (HRP) and incubated for 1.5 hrs at 25°C. After washing, ABTS substrate was added, followed by detection with an absorbance plate reader.
[35S] Metabolic Labeling
[35S] metabolic labeling experiments were performed as previously described5. Briefly, transfected CHO7PA2 cells were plated and treated on poly-D-lysine coated 6-well plates and metabolically labeled in DMEM-Cys/-Met (Corning CellGro, Mediatech Inc., Manassas, VA) supplemented with glutamine, penicillin/streptomycin, dialyzed fetal bovine serum, and EasyTag EXPRESS [35S] Protein Labeling Mix (Perkin Elmer) for 30 min. Cells were washed twice with complete media and incubated in pre-warmed DMEM for the indicated times. Media or lysates were harvested at the indicated times. Lysates were prepared in RIPA buffer (50mM Tris [pH 7.5], 150mM NaCl, 1% Triton X100, 0.5% sodium deoxycholate, 0.1% SDS) containing proteases inhibitors cocktail (Roche). APP species were immunopurified using protein G sepharose beads bound with 6E10 antibody and washed four times with RIPA buffer. The immunoisolates were then eluted by boiling in 6X Laemmli buffer and separated on 12% SDS-PAGE. Gels were stained with Coomassie Blue, dried, exposed to phosphorimager plates (GE Healthcare, Pittsburgh, PA) and imaged by autoradiography using a Typhoon Trio Imager (GE Healthcare). Band intensities were quantified by densitometry in ImageQuant. Fraction secreted was calculated using the equation: fraction secreted = [extracellular [35S]-APP signal at t / (extracellular [35S]-APP signal at t=0 + intracellular [35S]-APP signal at t=0)]. Fraction remaining was calculated using the equation: [(extracellular [35S]-APP signal at t + intracellular [35S]-APP signal at t) / (extracellular [35S]-APP signal at t=0 + intracellular [35S]-APP signal at t=0)].
CellTiterGlo Viability Assays
For determination of relative cellular ATP levels, SHSY5Y cells were seeded into flat black, poly-D-lysine coated 96-well plates (Corning). Cells were treated as indicated then lysed by the addition of CellTiter-Glo reagent (Promega). Samples were dark adapted for 10 min to stabilize signals. Luminescence was then measured in an Infinite F200 PRO plate reader (Tecan) and corrected for background signal. All measurements were performed in biologic triplicate.
TMRE Staining and Flow Cytometry
Cells were treated as indicated then incubated with TMRE dye (200 nM) for 30 mins at 37°C. Samples were collected by trypsinization. Trypsin was neutralized by washing into cell culture media and then samples were washed twice in DPBS. Cell pellets were suspended into DPBS supplemented with 0.1% BSA. Fluorescence intensity of TMRE was recorded on the PE channel of a Novocyte Flow Cytometer (ACEA Biosciences, Inc). Data are presented as mean of the fluorescence intensity from 3 experiments. For each experiment, 10,000 cells per condition in triplicates were recorded.
DATA AVAILABILITY
The raw data that support the findings of this study are available within the paper and its Extended Data files (pertaining to Figures 1, 3, 4, and Extended Data Figures 1, 3, 4, and 5), and/or are available from the corresponding author upon reasonable request. The RNAseq data have been deposited to the public National Center for Biotechnology Information GEO repository under the data identifier GSE148802.
CODE AVAILABILITY
Code for standard open-source DESeq differential gene expression RNAseq analysis used in R statistical software is available from the corresponding author upon reasonable request.
Extended Data
Extended Data Fig. 1.
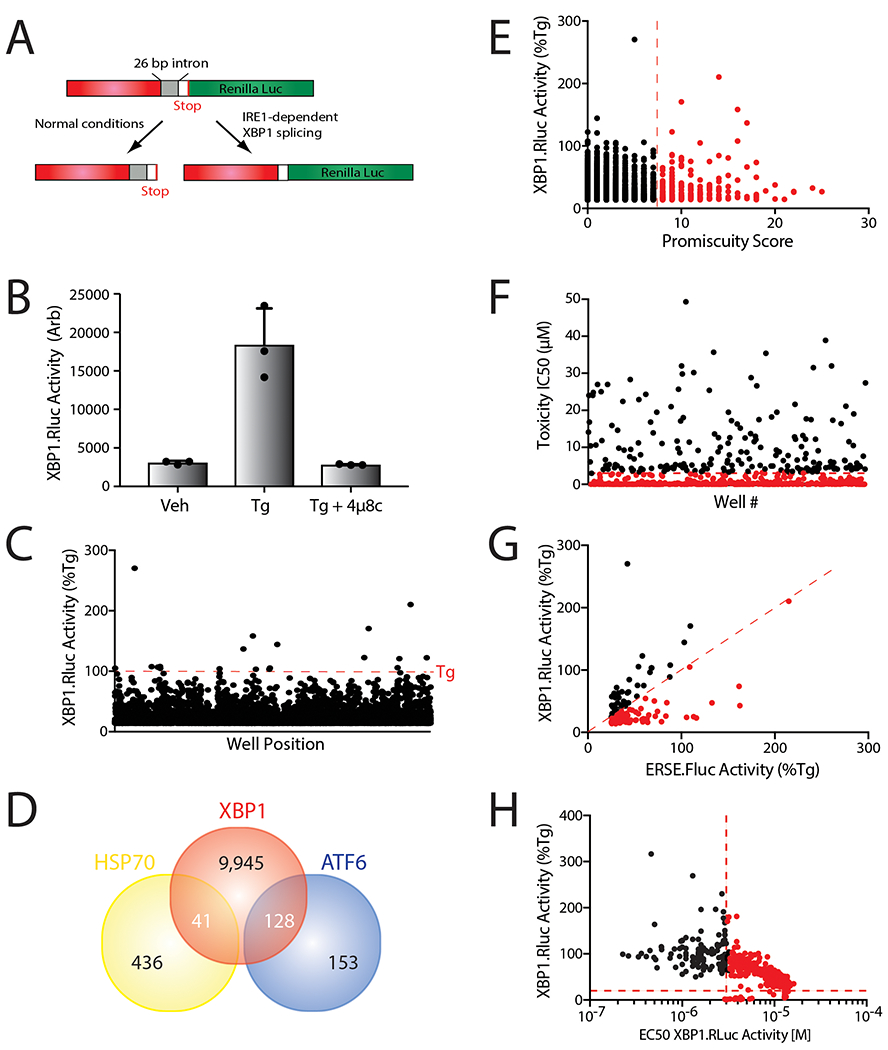
A. Schematic of the XBP1-Renilla luciferase (XBP1-RLuc) splicing reporter used in our high-throughput screen to identify small molecule activators of IRE1/XBP1s signaling.
B. Graph showing XBP1-RLuc splicing reporter activation in HEK293TREX cells incubated with Tg (500 nM) in the presence or absence of 4μ8c (64 μM) for 16 hrs. Error bars show SD for n=3 replicates.
C. Plot showing XBP1-RLuc activation in HEK293TREX cells stably expressing the XBP1-RLuc reporter treated with the 10,114 small molecules (6 μM; 18 hrs) identified as hits in the primary screen. Luminescence is shown as % signal relative to treatment with Tg (500 nM; 18 hrs).
D. Venn diagram of overlap of compounds identified to activate the IRE1-dependent XBP1-RLuc splicing reporter, the ATF6-selective ERSE-FLuc reporter, or the HSF1-dependent HSP70-FLuc reporter via high-throughput screening.
E. Plot showing XBP1-RLuc activation HEK293TREX cells (% signal compared to that observed with 500 nM Tg, 18 hrs) versus promiscuity score for our top 638 compounds identified by HTS. The promiscuity score reports on the number of assays performed at the TSRI-FL Screening Center where each compound was identified as a positive hit.
F. Plot showing IC50 for toxicity as measured by CellTiterGlo luminescence calculated from titration screening of 638 hit compounds. The dashed red lines indicates IC50 = 3 μM.
G. Plot showing IRE1-dependent XBP1-RLuc activation versus ATF6-selective ERSE-Fluc activation in HEK293TREX cells (% signal compared to that observed with 500nM Tg, 18 hrs) for the subset of our top 638 compounds that were also identified to activate the ATF6-selective ERSE-FLuc reporter. The dashed red line indicates equal XBP1s-Rluc and ERSE-Fluc activation.
H. Plot showing XBP1-RLuc activation in HEK293TREX cells (% signal compared to that observed with 500nM Tg, 18 hrs) versus EC50 of XBP1-RLuc activation in HEK293TREX cells calculated from titration screening of hit 638 compounds. The dashed red lines indicates 20% Rluc activation and Rluc EC50 = 3μM.
Extended Data Fig. 2.
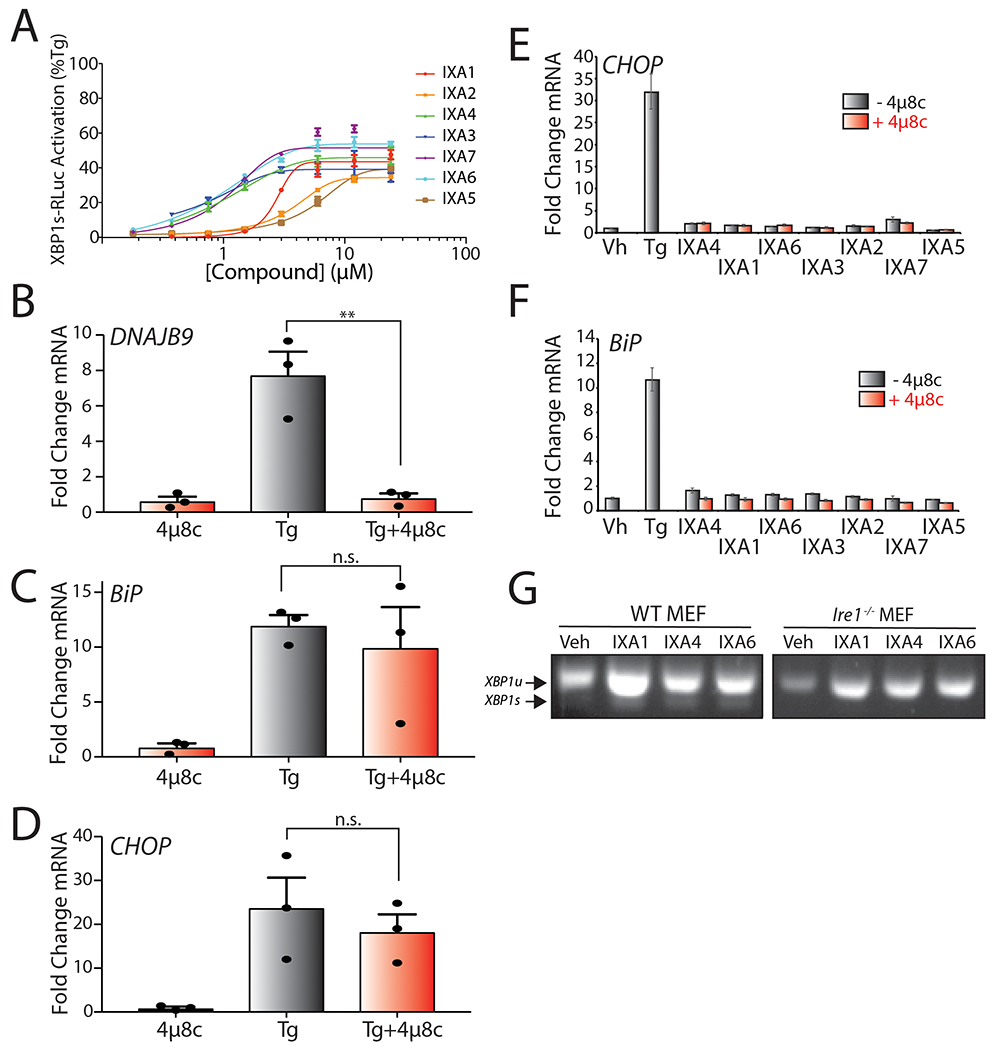
A. Plot showing XBP1-RLuc activation in HEK293TREX cells (% signal compared to that observed with 500nM Tg, 18 hrs) treated for 18 hrs with the indicated concentrations of prioritized IRE1/XBP1s activator. Error bars represent SD for n = 3 replicates.
B. Graph showing qPCR of the XBP1 target gene DNAJB9 in HEK293T cells treated for 4 hrs with Tg (500 nM) in the presence or absence of 4μ8c (64 μM). Error bars show SE for n= 3. P-values were calculated using one-tailed Student’s t-test. **p<0.01.
C. Graph showing qPCR of the ATF6 target gene BiP in HEK293T cells treated for 4 hrs with Tg (500 nM) in the presence or absence of 4μ8c (64 μM). Error bars show SE for n= 3. P-values were calculated using one-tailed Student’s t-test.
D. Graph showing qPCR of the PERK target gene CHOP in HEK293T cells treated for 4 hrs with Tg (500 nM) in the presence or absence of 4μ8c (64 μM). Error bars show SE for n= 3. P-values were calculated using one-tailed Student’s t-test.
E. Graph showing qPCR of the PERK target gene CHOP in HEK293T cells treated for 4 hrs with prioritized IRE1/XBP1s activators (10 μM) or Tg (500nM), in the presence or absence of 4μ8c (32 μM). Error bars show 95% CI for n= 3 replicates.
F. Graph showing qPCR analysis of the ATF6 target gene BiP in HEK293T cells treated for 4 hrs with indicated compound (10 μM), or Tg (500nM), in the presence or absence of 4μ8c (32 μM). Error bars show 95% CI for n= 3 replicates.
G. cDNA gel showing splicing of XBP1 mRNA in WT MEF or Ire1−/− MEF cells treated with IXA1, IXA4, or IXA6 (10 μM) for 4 hrs.
Extended Data Fig. 3.
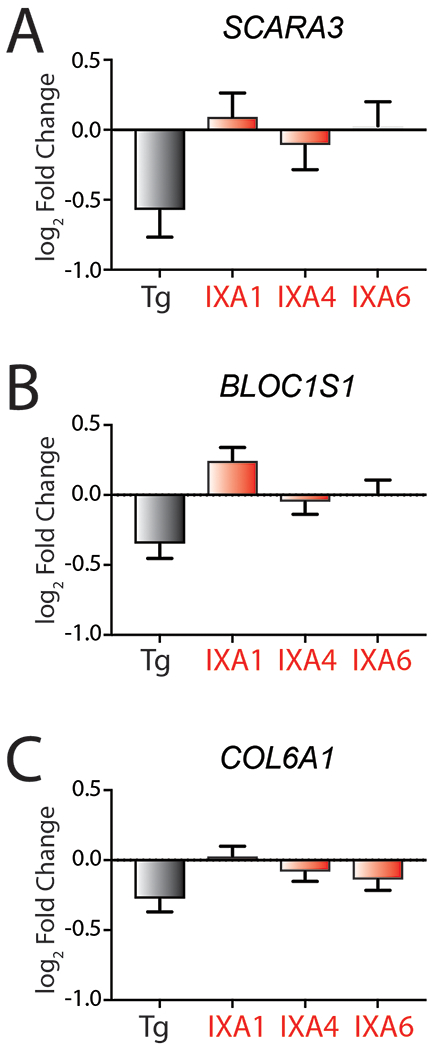
A. Graph showing log2 Fold change mRNA levels from RNAseq for the RIDD target SCARA3 in HEK293T cells treated with 10 μM IXA1, IXA4, IXA6, or 500 nM Tg for 4 hrs. Error bars represent SD for n = 3 replicates.
B. Graph showing log2 Fold change mRNA levels from RNAseq for the RIDD target BLOC1S1 in HEK293T cells treated with 10 μM IXA1, IXA4, IXA6, or 500 nM Tg for 4 hrs. Error bars represent SD for n = 3 replicates.
C. Graph showing log2 Fold change mRNA levels from RNAseq for the RIDD target COL6A1 in HEK293T cells treated with 10μM IXA1, IXA4, IXA6, or 500nM Tg for 4 hrs. Error bars represent SD for n = 3 replicates.
Extended Data Fig. 4.
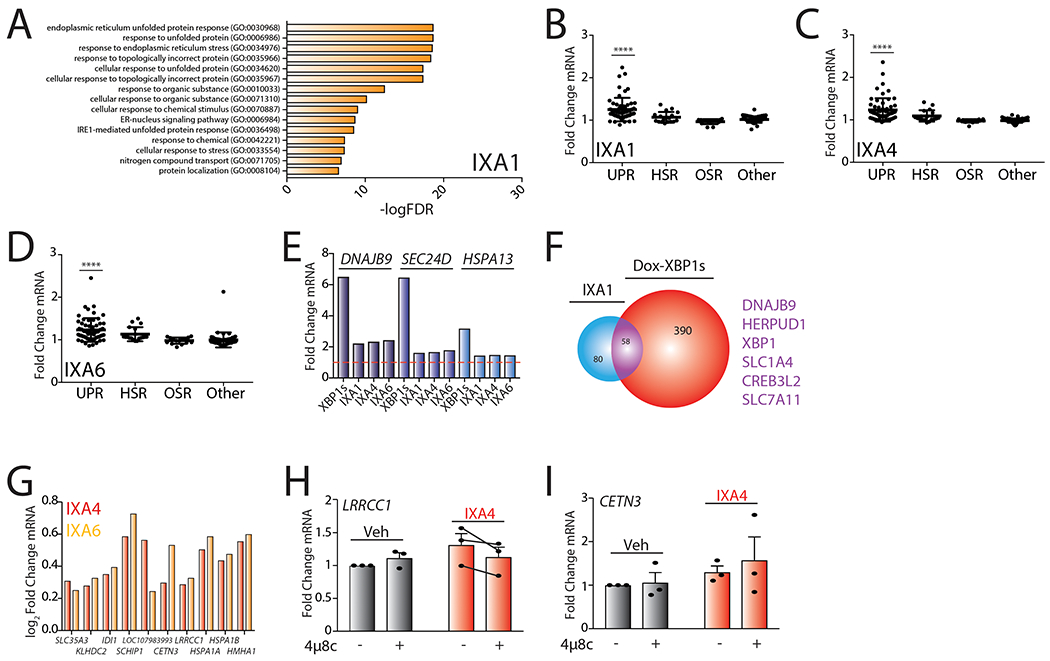
A. Gene Ontology (GO) analysis of differentially expressed genes from RNAseq for HEK293T cells treated with IXA1 (10 μM, 4hrs). Top 15 entries with lowest FDR are shown. See Supplementary Table 4 for full GO analysis.
B. Graph showing fold change mRNA levels from RNAseq of target genes activated downstream of the UPR, HSR, OSR, and other stress signaling pathways in HEK293T cells treated with IXA1 (10 μM) for 4 hrs. The composition of these genesets is shown in Source Data Table 3. P-values were calculated using one-way ANOVA compared to “Other”. ****p<0.0001.
C. Graph showing fold change mRNA levels from RNAseq of target genes activated downstream of the UPR, HSR, OSR, and other stress signaling pathways in HEK293T cells treated with IXA4 (10μM) for 4 hrs. The composition of these genesets is shown in Source Data Table 3. P-values were calculated using one-way ANOVA compared to “Other”. ****p<0.0001.
D. Graph showing fold change mRNA levels from RNAseq of target genes activated downstream of the UPR, HSR, OSR, and other stress signaling pathways in HEK293T cells treated with IXA6 (10μM) for 4 hrs. The composition of these genesets is shown in Source Data Table 3. P-values were calculated using one-way ANOVA compared to “Other”. ****p<0.0001.
E. Bar graph showing fold change mRNA levels of the IRE1/XBP1s targets DNAJB9, SEC24D, and HSPA13 from RNAseq of HEK293DAX cells expressing dox-inducible XBP1s treated with dox (1 μg/mL) for 4 hr or HEK293T cells treated with compounds IXA1, IXA4, or IXA6 (10 μM) for 4 hrs.
F. Venn diagram of genes upregulated >1.2 fold (adjusted p-value <0.05) in HEK293T cells treated with compound IXA1 (10 μM) for 4 hrs in comparison to genes induced >1.2 fold (adjusted p-value < 0.05) in HEK293DAX cells treated with doxycycline (1 μg/mL) for 4 hrs. Genes listed in purple are top overlapping targets between conditions.
G. Graph showing log2Fold Change mRNA levels from RNAseq of the 10 non-overlapping genes activated in cells treated with IXA4 (10μM) compared to dox-inducible XBP1s. Log2Fold change mRNA levels of these genes in cells treated with IXA6 (10μM) are also included.
H. Graph showing qPCR of the LRRCC1 gene in 293T cells treated with IXA4 (10 μM) in the presence or absence of 4μ8c (64μM) for 4 hrs. Error bars show SE for n= 3.
I. Graph showing qPCR of the CETN3 gene in 293T cells treated with IXA4 (10 μM) in the presence or absence of 4μ8c (64μM) for 4 hrs. Error bars show SE for n= 3.
Extended Data Fig. 5.
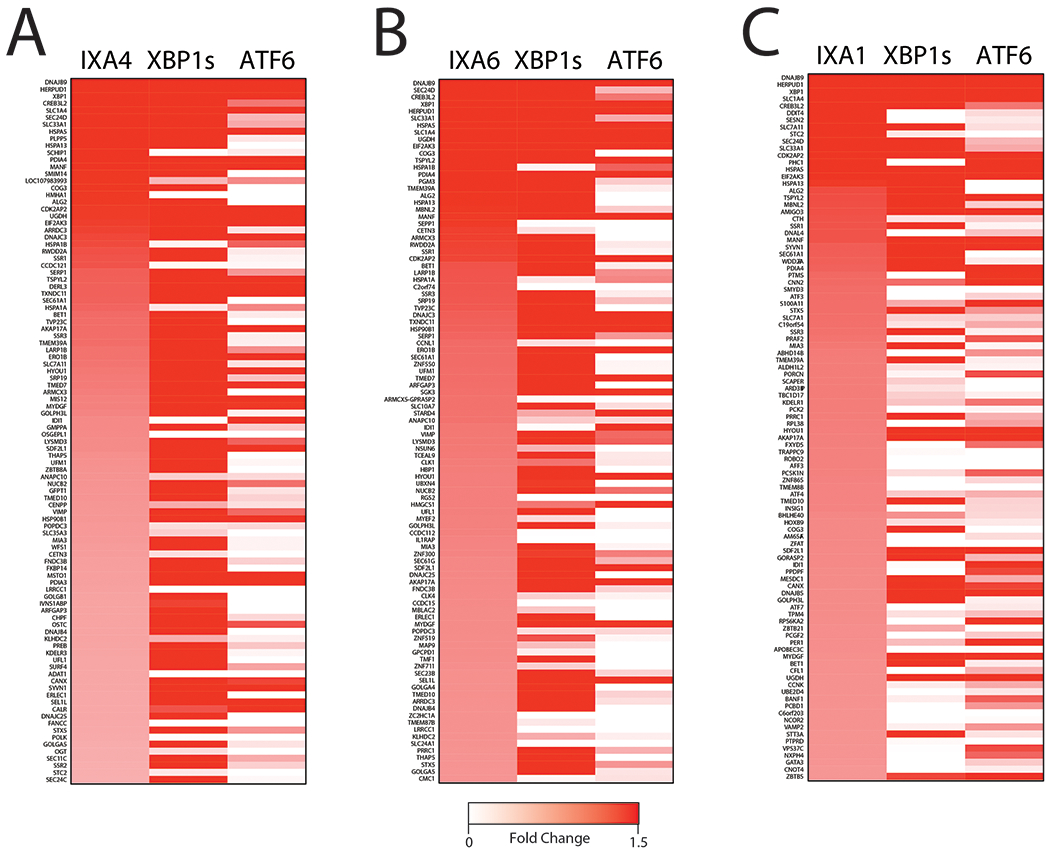
A. Heat map of top 100 genes upregulated in HEK293T cells treated for 4 hrs with IXA4 (10 μM) compared to dox-inducible XBP1s or TMP-stabilized DHFR.ATF6 in HEK293DAX cells treated with doxycycline (1 μg/mL) or TMP (10 μM) for 4 hr.
B. Heat map of top 100 genes upregulated in HEK293T cells treated for 4 hrs with IXA6 (10μM) compared to dox-inducible XBP1s or TMP-stabilized DHFR.ATF6 in HEK293DAX cells treated with doxycycline (1 μg/mL) or TMP (10μM) for 4 hrs.
C. Heat map of top 100 genes upregulated in HEK293T cells treated for 4 hr with IXA1 (10 μM) compared to dox-inducible XBP1s or TMP-stabilized DHFR.ATF6 in HEK293DAX cells treated with doxycycline (1 μg/mL) or TMP (10 μM) for 4 hrs.
Extended Data Fig. 6.
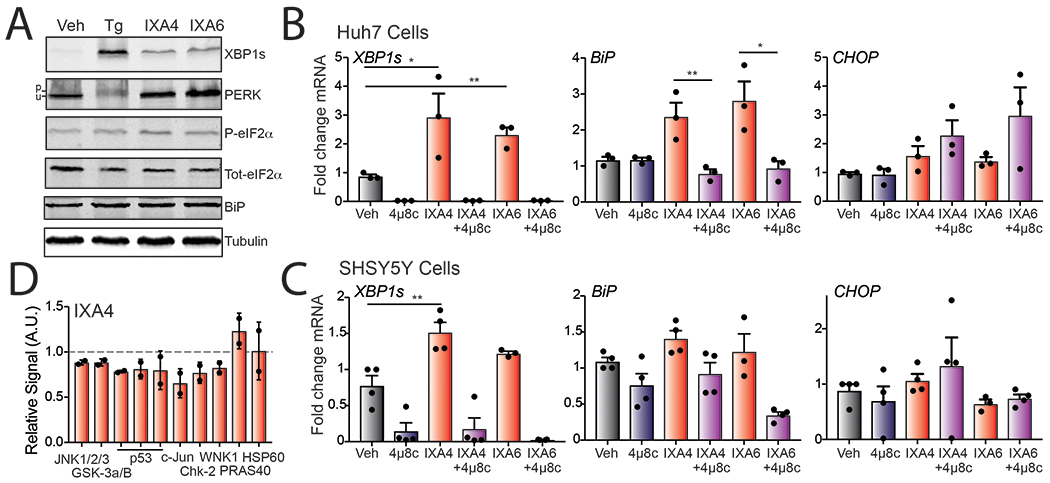
A. Representative immunoblots of XBP1s, PERK, eIF2α, and BiP in lysates prepared from HEK293T cells treated with vehicle, thapsigargin (1μM), IXA4 (10μM), or IXA6 (10 μM) for 4 hrs.
B. Graph showing qPCR of the XBP1 target gene DNAJB9, ATF6 target gene BiP, and PERK target gene CHOP in Huh-7 cells treated with IXA4 (10 μM) or IXA6 (10μM) in the presence or absence of 4μ8c (64μM) for 4 hrs. Error bars show SE for n=3 replicates. Statistics calculated from one-tailed Student’s t-test. *p<0.05, **p<0.01.
C. Graph showing qPCR of the XBP1 target gene DNAJB9, ATF6 target gene BiP, and PERK target gene CHOP in SHSY5Y cells treated with IXA4 (10 μM) or IXA6 (10μM) in the presence or absence of 4μ8c (64μM) for 4 hrs. Error bars show SE for n=4 replicates. Statistics calculated from one-tailed Student’s t-test. *p<0.05, **p<0.01.
D. Graph showing relative signal of phosphorylated target proteins by phosphokinase array dot immunoblotting in HEK293T cells treated with IXA4 (10μM) for 4 hrs. Error bars show SD for n=2.
Extended Data Fig. 7.
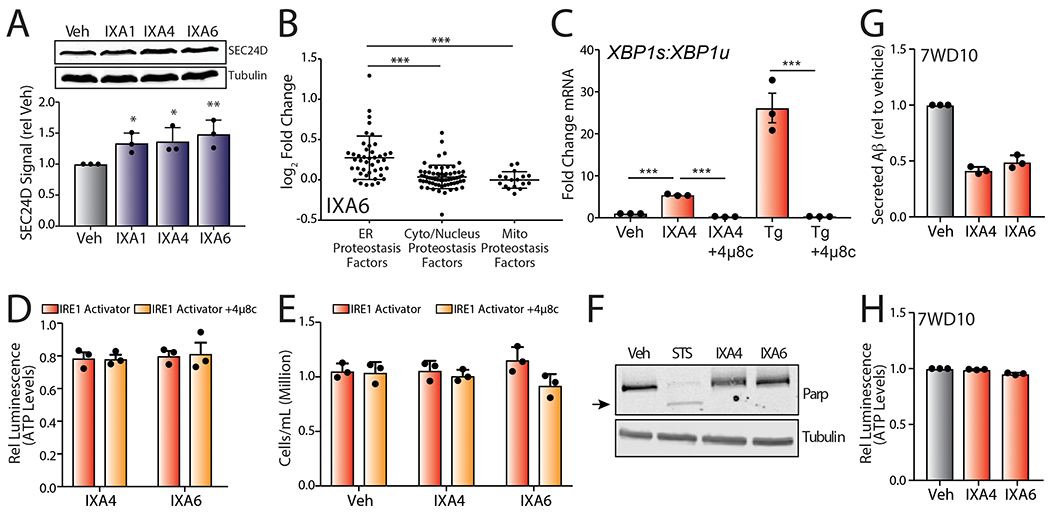
A. Representative immunoblots and quantification of SEC24D in lysates prepared from HEK293T cells treated with vehicle, IXA1, IXA4, or IXA6 (10 μM, 18 hrs). Error bars show SD for n= 3 replicates. P-values were calculated using one-tailed Student’s t-test. *p<0.05, **p<0.01.
B. Plot of log2 Fold Change mRNA levels from RNAseq in cells treated with IXA6 (10μM, 4 hrs) of proteostasis factors found in the ER, cytosol/nucleus, or mitochondria. The composition of these proteostasis genesets is shown in Source Data Table 3.
C. Graph showing the Fold change mRNA ratio of Xbp1s:Xbp1u by qPCR in CHO7PA2 cells treated with IXA4 (10 μM) or thapsigargin (1μM) in the presence or absence of 4μ8c (64μM) for 4 hrs. Error bars show SE for n=3 replicates. Statistics calculated from one-tailed Student’s t-test. *p<0.05, **p<0.01.
D. Graph showing relative CellTiterGlo luminescence from CHO7PA2 cells treated with IRE1/XBP1s activators IXA4, or IXA6 (10 μM) in the presence or absence of 4μ8c (32 μM). Cells were treated for 18 hrs, media was then replaced and conditioned in the presence of treatments for 24 hrs before measuring ATP levels. Luminescence signal was normalized to that observed in untreated controls. Error bars represent SE for n = 3 replicates.
E. Graph showing cell counts (106cells/mL) of CHO7PA2 cells treated with IXA4 or IXA6 (10 μM) in the presence or absence of 4μ8c (64 μM) for 24 hrs.
F. Immunoblot of mutant PARP in lysates collected from CHO7PA2 cells treated with IXA4 or IXA6 (10 μM) or staurosporine (1 μM) for 24 hrs.
G. Graph showing relative signal from ELISA of secreted Aβ peptide from conditioned media prepared on CHO7WD10 cells treated with IXA4 or IXA6 (10 μM). Cells were pretreated for 18 hrs with compounds. Media was then replaced and conditioned in the presence of compounds for 24 hrs before harvesting the media for ELISA. Secreted Aβ was normalized to that observed in untreated controls. Error bars represent SE for n = 3 replicates.
H. Graph showing relative CellTiterGlo luminescence from CHO7WD10 cells treated with IRE1/XBP1s activators IXA4 or IXA6 (10 μM). Cells were treated for 18 hrs, media was then replaced and conditioned in the presence of treatments for 24 hrs before measuring ATP levels. Luminescence signal was normalized to that observed in untreated controls. Error bars represent SE for n = 3 replicates.
Extended Data Fig. 8.
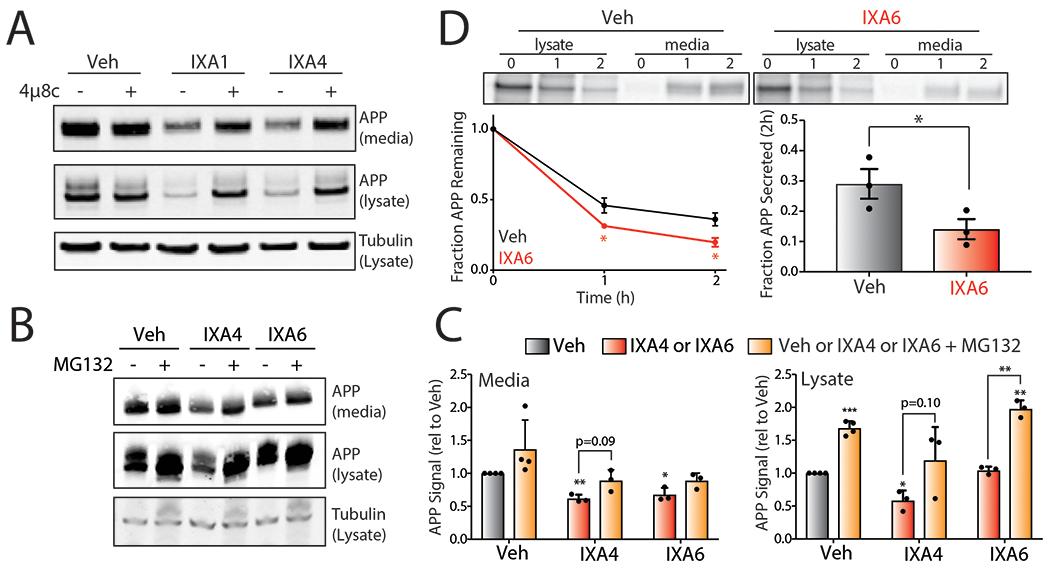
A. Representative immunoblot of mutant APP in media and lysates collected from CHO7PA2 cells treated with IXA1 or IXA4 (10 μM) in the presence or absence of 4μ8c (64 μM). Cells were treated for 18 hrs, media was then replaced and conditioned in the presence of treatments for 24 hrs before harvesting.
B. Representative immunoblot of mutant APP in media and lysates collected from CHO7PA2 cells treated with IXA4 or IXA6 (10 μM) in the presence or absence of MG132 (10 μM) for 18hrs.
C. Quantification of immunoblots represented in panel B of relative APP signal in lysates or conditioned media from CHO7PA2 cells treated with IRE1/XBP1s activators IXA4 or IXA6 (10 μM) in the presence or absence of MG132 (10 μM) for 18hrs. Error bars represent SE for n=4 replicates. Statistics calculated from one-tailed Student’s t-test. *p<0.05, **p<0.01, ***p<0.001.
D. Representative autoradiogram showing the [35S] metabolic labeling of mutant APP in CHO7PA2 cells treated with IXA6 (10 μM) for 16 hrs prior to 30 min labeling. Media and lysates were collected at 0, 1, or 2 hrs and [35S]-labeled mutant APP was isolated by immunopurification. The experimental protocol is shown above. Fraction remaining was calculated as described in Fig. 5D and fraction secretion was calculated as in Fig. 5E. Error bars represent SD for n = 3 replicates. P-values were calculated from one-tailed Student’s t-test. *p<0.05.
Extended Data Fig. 9.

A. Graph showing qPCR of the XBP1 target gene DNAJB9 in SHSY5Y cells transiently expressing empty vector (Mock) or Swedish mutant APP (APPSW) in the presence or absence of IXA4 (10 μM) for 72 hrs. Error bars show SE for n= 2. Statistics calculated from one-tailed Student’s t-test. *p<0.05, **p<0.01.
B. Graph showing qPCR of the PERK target gene CHOP in SHSY5Y cells transiently expressing empty vector (Mock) or APPSW in the presence or absence of IXA4 (10 μM) for 72 hrs. Error bars show SE for n= 2.
C. Representative histograms showing TMRE staining of SHSY5Y cells transiently expressing empty vector (Mock) or wild-type APP (APPWT) in the presence or absence of IXA4 (10 μM) for 72 hrs.
Supplementary Material
ACKNOWLEDGEMENTS
We would like to thank Jonathan Lin (UCSD), Matthew D. Shoulders (MIT), David Ron (Cambridge), and Vladislav Belyy, Weihan Li, Peter Walter (UCSF) for helpful suggestions and experimental support. Funding for this work is provided by the NIH (NS095892 and NS092829 to RLW; AG046495 to RLW and JWK; AG063489 for JMDG) and the Skaggs Institute for Chemical Biology.
Footnotes
COMPETING INTERESTS STATEMENT
Jeffrey W. Kelly is a co-founder of Proteostasis Therapeutics Inc. A patent has been submitted for compounds identified through work described in this manuscript. This patent includes R. Luke Wiseman, Jeffery W. Kelly, Julia M.D. Grandjean, Lars Plate, and Christina B. Cooley as co-inventors. No other author has a conflict of interest.
REFERENCES:
- 1.Walter P; Ron D, The unfolded protein response: from stress pathway to homeostatic regulation. Science 2011, 334 (6059), 1081–6. [DOI] [PubMed] [Google Scholar]
- 2.Bernales S; Papa FR; Walter P, Intracellular signaling by the unfolded protein response. Annu Rev Cell Dev Biol 2006, 22, 487–508. [DOI] [PubMed] [Google Scholar]
- 3.Schroder M; Kaufman RJ, ER stress and the unfolded protein response. Mutat Res 2005, 569 (1–2), 29–63. [DOI] [PubMed] [Google Scholar]
- 4.Patil C; Walter P, Intracellular signaling from the endoplasmic reticulum to the nucleus: the unfolded protein response in yeast and mammals. Curr Opin Cell Biol 2001, 13 (3), 349–55. [DOI] [PubMed] [Google Scholar]
- 5.Shoulders MD; Ryno LM; Genereux JC; Moresco JJ; Tu PG; Wu C; Yates JR 3rd; Su AI; Kelly JW; Wiseman RL, Stress-independent activation of XBP1s and/or ATF6 reveals three functionally diverse ER proteostasis environments. Cell Rep 2013, 3 (4), 1279–92. [DOI] [PMC free article] [PubMed] [Google Scholar]
- 6.Lee AH; Iwakoshi NN; Glimcher LH, XBP-1 regulates a subset of endoplasmic reticulum resident chaperone genes in the unfolded protein response. Mol Cell Biol 2003, 23 (21), 7448–59. [DOI] [PMC free article] [PubMed] [Google Scholar]
- 7.Han J; Back SH; Hur J; Lin YH; Gildersleeve R; Shan J; Yuan CL; Krokowski D; Wang S; Hatzoglou M; Kilberg MS; Sartor MA; Kaufman RJ, ER-stress-induced transcriptional regulation increases protein synthesis leading to cell death. Nat Cell Biol 2013, 15 (5), 481–90. [DOI] [PMC free article] [PubMed] [Google Scholar]
- 8.Chang TK; Lawrence DA; Lu M; Tan J; Harnoss JM; Marsters SA; Liu P; Sandoval W; Martin SE; Ashkenazi A, Coordination between Two Branches of the Unfolded Protein Response Determines Apoptotic Cell Fate. Mol Cell 2018, 71 (4), 629–636 e5. [DOI] [PubMed] [Google Scholar]
- 9.Balch WE; Morimoto RI; Dillin A; Kelly JW, Adapting proteostasis for disease intervention. Science 2008, 319 (5865), 916–9. [DOI] [PubMed] [Google Scholar]
- 10.Chen JJ; Genereux JC; Wiseman RL, Endoplasmic reticulum quality control and systemic amyloid disease: Impacting protein stability from the inside out. IUBMB Life 2015, 67 (6), 404–13. [DOI] [PMC free article] [PubMed] [Google Scholar]
- 11.Wong MY; Shoulders MD, Targeting defective proteostasis in the collagenopathies. Curr Opin Chem Biol 2019, 50, 80–88. [DOI] [PMC free article] [PubMed] [Google Scholar]
- 12.Zhang L; Zhang C; Wang A, Divergence and Conservation of the Major UPR Branch IRE1-bZIP Signaling Pathway across Eukaryotes. Sci Rep 2016, 6, 27362. [DOI] [PMC free article] [PubMed] [Google Scholar]
- 13.Joshi A; Newbatt Y; McAndrew PC; Stubbs M; Burke R; Richards MW; Bhatia C; Caldwell JJ; McHardy T; Collins I; Bayliss R, Molecular mechanisms of human IRE1 activation through dimerization and ligand binding. Oncotarget 2015, 6 (15), 13019–35. [DOI] [PMC free article] [PubMed] [Google Scholar]
- 14.Korennykh AV; Egea PF; Korostelev AA; Finer-Moore J; Zhang C; Shokat KM; Stroud RM; Walter P, The unfolded protein response signals through high-order assembly of Ire1. Nature 2009, 457 (7230), 687–93. [DOI] [PMC free article] [PubMed] [Google Scholar]
- 15.Wang L; Perera BG; Hari SB; Bhhatarai B; Backes BJ; Seeliger MA; Schurer SC; Oakes SA; Papa FR; Maly DJ, Divergent allosteric control of the IRE1alpha endoribonuclease using kinase inhibitors. Nat Chem Biol 2012, 8 (12), 982–9. [DOI] [PMC free article] [PubMed] [Google Scholar]
- 16.Yoshida H; Matsui T; Yamamoto A; Okada T; Mori K, XBP1 mRNA is induced by ATF6 and spliced by IRE1 in response to ER stress to produce a highly active transcription factor. Cell 2001, 107 (7), 881–91. [DOI] [PubMed] [Google Scholar]
- 17.Hollien J; Lin JH; Li H; Stevens N; Walter P; Weissman JS, Regulated Ire1-dependent decay of messenger RNAs in mammalian cells. J Cell Biol 2009, 186 (3), 323–31. [DOI] [PMC free article] [PubMed] [Google Scholar]
- 18.Tam AB; Koong AC; Niwa M, Ire1 has distinct catalytic mechanisms for XBP1/HAC1 splicing and RIDD. Cell Rep 2014, 9 (3), 850–8. [DOI] [PMC free article] [PubMed] [Google Scholar]
- 19.Bae D; Moore KA; Mella JM; Hayashi SY; Hollien J, Degradation of Blos1 mRNA by IRE1 repositions lysosomes and protects cells from stress. J Cell Biol 2019, 218 (4), 1118–1127. [DOI] [PMC free article] [PubMed] [Google Scholar]
- 20.Valdes P; Mercado G; Vidal RL; Molina C; Parsons G; Court FA; Martinez A; Galleguillos D; Armentano D; Schneider BL; Hetz C, Control of dopaminergic neuron survival by the unfolded protein response transcription factor XBP1. Proc Natl Acad Sci U S A 2014, 111 (18), 6804–9. [DOI] [PMC free article] [PubMed] [Google Scholar]
- 21.Zuleta A; Vidal RL; Armentano D; Parsons G; Hetz C, AAV-mediated delivery of the transcription factor XBP1s into the striatum reduces mutant Huntingtin aggregation in a mouse model of Huntington's disease. Biochem Biophys Res Commun 2012, 420 (3), 558–63. [DOI] [PubMed] [Google Scholar]
- 22.Valenzuela V; Collyer E; Armentano D; Parsons GB; Court FA; Hetz C, Activation of the unfolded protein response enhances motor recovery after spinal cord injury. Cell Death Dis 2012, 3, e272. [DOI] [PMC free article] [PubMed] [Google Scholar]
- 23.Cui H; Deng M; Zhang Y; Yin F; Liu J, Geniposide Increases Unfolded Protein Response-Mediating HRD1 Expression to Accelerate APP Degradation in Primary Cortical Neurons. Neurochem Res 2018, 43 (3), 669–680. [DOI] [PubMed] [Google Scholar]
- 24.Kaneko M; Koike H; Saito R; Kitamura Y; Okuma Y; Nomura Y, Loss of HRD1-mediated protein degradation causes amyloid precursor protein accumulation and amyloid-beta generation. J Neurosci 2010, 30 (11), 3924–32. [DOI] [PMC free article] [PubMed] [Google Scholar]
- 25.Chiang WC; Messah C; Lin JH, IRE1 directs proteasomal and lysosomal degradation of misfolded rhodopsin. Mol Biol Cell 2012, 23 (5), 758–70. [DOI] [PMC free article] [PubMed] [Google Scholar]
- 26.Sifers RN, Intracellular processing of alpha1-antitrypsin. Proc Am Thorac Soc 2010, 7 (6), 376–80. [DOI] [PMC free article] [PubMed] [Google Scholar]
- 27.Ozcan U; Cao Q; Yilmaz E; Lee AH; Iwakoshi NN; Ozdelen E; Tuncman G; Gorgun C; Glimcher LH; Hotamisligil GS, Endoplasmic reticulum stress links obesity, insulin action, and type 2 diabetes. Science 2004, 306 (5695), 457–61. [DOI] [PubMed] [Google Scholar]
- 28.Bi X; Zhang G; Wang X; Nguyen C; May HI; Li X; Al-Hashimi AA; Austin RC; Gillette TG; Fu G; Wang ZV; Hill JA, Endoplasmic Reticulum Chaperone GRP78 Protects Heart From Ischemia/Reperfusion Injury Through Akt Activation. Circ Res 2018, 122 (11), 1545–1554. [DOI] [PMC free article] [PubMed] [Google Scholar]
- 29.Mendez AS; Alfaro J; Morales-Soto MA; Dar AC; McCullagh E; Gotthardt K; Li H; Acosta-Alvear D; Sidrauski C; Korennykh AV; Bernales S; Shokat KM; Walter P, Endoplasmic reticulum stress-independent activation of unfolded protein response kinases by a small molecule ATP-mimic. Elife 2015, 4. [DOI] [PMC free article] [PubMed] [Google Scholar]
- 30.Ghosh R; Wang L; Wang ES; Perera BG; Igbaria A; Morita S; Prado K; Thamsen M; Caswell D; Macias H; Weiberth KF; Gliedt MJ; Alavi MV; Hari SB; Mitra AK; Bhhatarai B; Schurer SC; Snapp EL; Gould DB; German MS; Backes BJ; Maly DJ; Oakes SA; Papa FR, Allosteric inhibition of the IRE1alpha RNase preserves cell viability and function during endoplasmic reticulum stress. Cell 2014, 158 (3), 534–48. [DOI] [PMC free article] [PubMed] [Google Scholar]
- 31.Plate L; Cooley CB; Chen JJ; Paxman RJ; Gallagher CM; Madoux F; Genereux JC; Dobbs W; Garza D; Spicer TP; Scampavia L; Brown SJ; Rosen H; Powers ET; Walter P; Hodder P; Wiseman RL; Kelly JW, Small molecule proteostasis regulators that reprogram the ER to reduce extracellular protein aggregation. Elife 2016, 5. [DOI] [PMC free article] [PubMed] [Google Scholar]
- 32.Iwawaki T; Akai R; Kohno K; Miura M, A transgenic mouse model for monitoring endoplasmic reticulum stress. Nat Med 2004, 10 (1), 98–102. [DOI] [PubMed] [Google Scholar]
- 33.Cross BC; Bond PJ; Sadowski PG; Jha BK; Zak J; Goodman JM; Silverman RH; Neubert TA; Baxendale IR; Ron D; Harding HP, The molecular basis for selective inhibition of unconventional mRNA splicing by an IRE1-binding small molecule. Proc Natl Acad Sci U S A 2012, 109 (15), E869–78. [DOI] [PMC free article] [PubMed] [Google Scholar]
- 34.Calamini B; Silva MC; Madoux F; Hutt DM; Khanna S; Chalfant MA; Saldanha SA; Hodder P; Tait BD; Garza D; Balch WE; Morimoto RI, Small-molecule proteostasis regulators for protein conformational diseases. Nat Chem Biol 2011, 8 (2), 185–96. [DOI] [PMC free article] [PubMed] [Google Scholar]
- 35.Merour JY; Buron F; Ple K; Bonnet P; Routier S, The azaindole framework in the design of kinase inhibitors. Molecules 2014, 19 (12), 19935–79. [DOI] [PMC free article] [PubMed] [Google Scholar]
- 36.Grandjean JMD; Plate L; Morimoto RI; Bollong MJ; Powers ET; Wiseman RL, Deconvoluting Stress-Responsive Proteostasis Signaling Pathways for Pharmacologic Activation Using Targeted RNA Sequencing. ACS Chem Biol 2019, 14 (4), 784–795. [DOI] [PMC free article] [PubMed] [Google Scholar]
- 37.Moore K; Hollien J, Ire1-mediated decay in mammalian cells relies on mRNA sequence, structure, and translational status. Mol Biol Cell 2015, 26 (16), 2873–84. [DOI] [PMC free article] [PubMed] [Google Scholar]
- 38.So JS; Hur KY; Tarrio M; Ruda V; Frank-Kamenetsky M; Fitzgerald K; Koteliansky V; Lichtman AH; Iwawaki T; Glimcher LH; Lee AH, Silencing of lipid metabolism genes through IRE1alpha-mediated mRNA decay lowers plasma lipids in mice. Cell Metab 2012, 16 (4), 487–99. [DOI] [PMC free article] [PubMed] [Google Scholar]
- 39.Wong MY; Chen K; Antonopoulos A; Kasper BT; Dewal MB; Taylor RJ; Whittaker CA; Hein PP; Dell A; Genereux JC; Haslam SM; Mahal LK; Shoulders MD, XBP1s activation can globally remodel N-glycan structure distribution patterns. Proc Natl Acad Sci U S A 2018, 115 (43), E10089–E10098. [DOI] [PMC free article] [PubMed] [Google Scholar]
- 40.Urano F; Wang X; Bertolotti A; Zhang Y; Chung P; Harding HP; Ron D, Coupling of stress in the ER to activation of JNK protein kinases by transmembrane protein kinase IRE1. Science 2000, 287 (5453), 664–6. [DOI] [PubMed] [Google Scholar]
- 41.Chow VW; Mattson MP; Wong PC; Gleichmann M, An overview of APP processing enzymes and products. Neuromolecular Med 2010, 12 (1), 1–12. [DOI] [PMC free article] [PubMed] [Google Scholar]
- 42.Portelius E; Olsson M; Brinkmalm G; Ruetschi U; Mattsson N; Andreasson U; Gobom J; Brinkmalm A; Holtta M; Blennow K; Zetterberg H, Mass spectrometric characterization of amyloid-beta species in the 7PA2 cell model of Alzheimer's disease. J Alzheimers Dis 2013, 33 (1), 85–93. [DOI] [PubMed] [Google Scholar]
- 43.Pera M; Larrea D; Guardia-Laguarta C; Montesinos J; Velasco KR; Agrawal RR; Xu Y; Chan RB; Di Paolo G; Mehler MF; Perumal GS; Macaluso FP; Freyberg ZZ; Acin-Perez R; Enriquez JA; Schon EA; Area-Gomez E, Increased localization of APP-C99 in mitochondria-associated ER membranes causes mitochondrial dysfunction in Alzheimer disease. EMBO J 2017, 36 (22), 3356–3371. [DOI] [PMC free article] [PubMed] [Google Scholar]
- 44.Krako N; Magnifico MC; Arese M; Meli G; Forte E; Lecci A; Manca A; Giuffre A; Mastronicola D; Sarti P; Cattaneo A, Characterization of mitochondrial dysfunction in the 7PA2 cell model of Alzheimer's disease. J Alzheimers Dis 2013, 37 (4), 747–58. [DOI] [PubMed] [Google Scholar]
- 45.Rainbolt TK; Lebeau J; Puchades C; Wiseman RL, Reciprocal Degradation of YME1L and OMA1 Adapts Mitochondrial Proteolytic Activity during Stress. Cell Rep 2016, 14 (9), 2041–2049. [DOI] [PMC free article] [PubMed] [Google Scholar]
- 46.Blackwood EA; Azizi K; Thuerauf DJ; Paxman RJ; Plate L; Kelly JW; Wiseman RL; Glembotski CC, Pharmacologic ATF6 activation confers global protection in widespread disease models by reprograming cellular proteostasis. Nat Commun 2019, 10 (1), 187. [DOI] [PMC free article] [PubMed] [Google Scholar]
- 47.Kroeger H; Grimsey N; Paxman R; Chiang WC; Plate L; Jones Y; Shaw PX; Trejo J; Tsang SH; Powers E; Kelly JW; Wiseman RL; Lin JH, The unfolded protein response regulator ATF6 promotes mesodermal differentiation. Sci Signal 2018, 11 (517). [DOI] [PMC free article] [PubMed] [Google Scholar]
- 48.Casas-Tinto S; Zhang Y; Sanchez-Garcia J; Gomez-Velazquez M; Rincon-Limas DE; Fernandez-Funez P, The ER stress factor XBP1s prevents amyloid-beta neurotoxicity. Hum Mol Genet 2011, 20 (11), 2144–60. [DOI] [PMC free article] [PubMed] [Google Scholar]
- 49.Tufanli O; Telkoparan Akillilar P; Acosta-Alvear D; Kocaturk B; Onat UI; Hamid SM; Cimen I; Walter P; Weber C; Erbay E, Targeting IRE1 with small molecules counteracts progression of atherosclerosis. Proc Natl Acad Sci U S A 2017, 114 (8), E1395–E1404. [DOI] [PMC free article] [PubMed] [Google Scholar]
- 50.Rosen DA; Seki SM; Fernandez-Castaneda A; Beiter RM; Eccles JD; Woodfolk JA; Gaultier A, Modulation of the sigma-1 receptor-IRE1 pathway is beneficial in preclinical models of inflammation and sepsis. Sci Transl Med 2019, 11 (478). [DOI] [PMC free article] [PubMed] [Google Scholar]
Associated Data
This section collects any data citations, data availability statements, or supplementary materials included in this article.
Supplementary Materials
Data Availability Statement
The raw data that support the findings of this study are available within the paper and its Extended Data files (pertaining to Figures 1, 3, 4, and Extended Data Figures 1, 3, 4, and 5), and/or are available from the corresponding author upon reasonable request. The RNAseq data have been deposited to the public National Center for Biotechnology Information GEO repository under the data identifier GSE148802.


