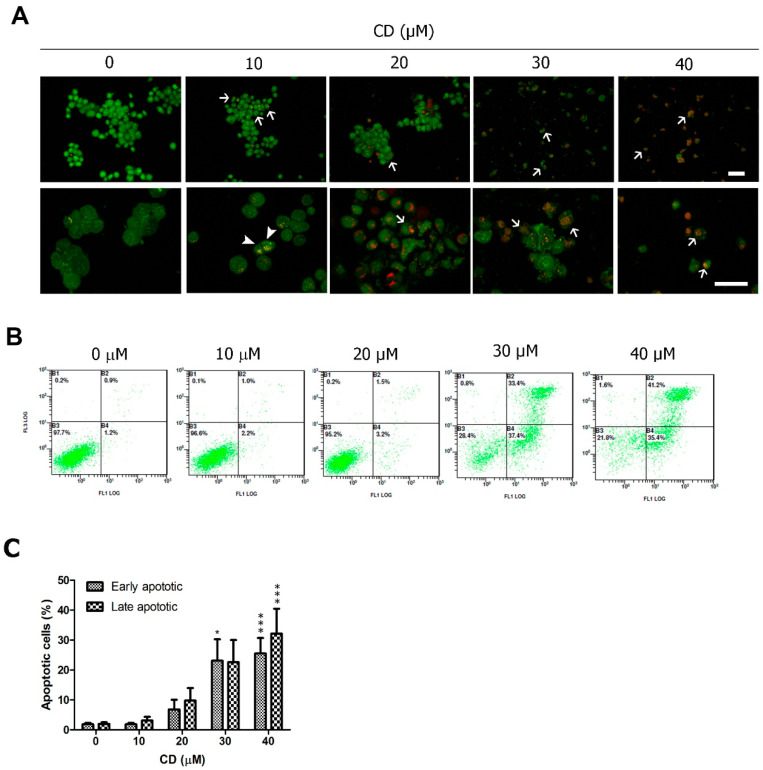
Figure 2.
Apoptosis induced by CD in T24 BC cells. (A) AO/EB double staining with arrows indicating early apoptotic cells that have fragmented bright green chromatin and late apoptotic cells with a nucleus with fragmented orange chromatin (arrowhead). The upper row is 200× and the lower row is 400× magnification. Scale bar = 50 µm. (B) Flow cytometry analysis of annexin V-PI double staining. (C) Quantification of apoptotic populations. * p < 0.05, *** p < 0.001 as compared with the control group (0 µM). Data are expressed as mean ± SD of three independent experiments.

