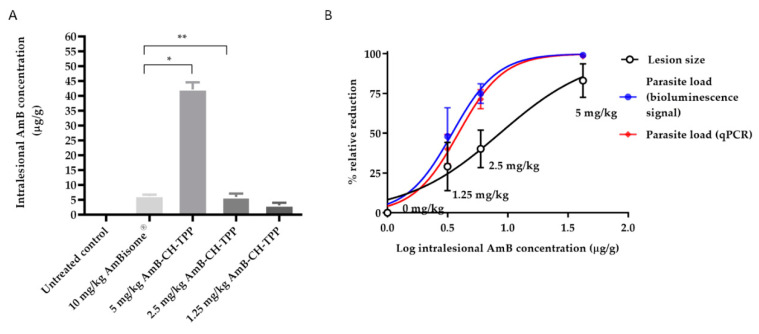
Figure 5.
Multiple dose skin pharmacokinetics of AmB-CH-TPP nanoparticles and AmBisome®. L. major-infected BALB/c mice received intravenous doses of AmBisome® (G3, 10 mg/kg/QAD for 10 days; i.v.), AmB-CH-TPP nanoparticles (G4, 5 mg of AmB/kg/QAD for 10 days; i.v.), AmB-CH-TPP nanoparticles (G5, 2.5 mg of AmB/kg/QAD for 10 days; i.v.) and AmB-CH-TPP nanoparticles (G6, 1.25 mg of AmB/kg/QAD for 10 days; i.v.). Then, 24 h after the last dosing, AmB levels in skin were determined. The CL lesion was localized on the rump, while the back skin of same mice used as lesion-free, healthy control site. Each point represents the mean and standard error of the mean (n = 5 per group). (A) represents intralesional AmB, (B) outcomes are linked in a logarithmic scale dose–response curve plotting drug concentrations against relative reduction in lesion size and parasite load measured using bioluminescence and qPCR. The data represent the mean ± standard error. ANOVA followed by Tukey’s multiple-comparison tests was used to compare outcomes among the groups. A p-value < 0.05 was considered statistically significant ((*) p < 0.05 and (**) p > 0.05).

