

Abstract
Prostaglandin E2 (PGE2) is well-known as an endogenous proinflammatory prostanoid synthesized from arachidonic acid by the activation of cyclooxygenase-2. E type prostanoid (EP) receptors are cognates for PGE2 that have four main subtypes: EP1 to EP4. Of these, the EP2 and EP4 prostanoid receptors have been shown to couple to Gαs-protein and can activate adenylyl cyclase to form cAMP. Studies suggest that EP4 receptors are involved in colorectal homeostasis and cancer development, but further work is needed to identify the roles of EP2 receptors in these functions. After sufficient inflammation has been evoked by PGE2, it is metabolized to 15-keto-PGE2. Thus, 15-keto-PGE2 has long been considered an inactive metabolite of PGE2. However, it may have an additional role as a biased and/or partial agonist capable of taking over the actions of PGE2 to gradually terminate reactions. Here, using cell-based experiments and in silico simulations, we show that PGE2-activated EP4 receptor–mediated signaling may evoke the primary initiating reaction of the cells, which would take over the 15-keto-PGE2–activated EP2 receptor–mediated signaling after PGE2 is metabolized to 15-keto-PGE2. The present results shed light on new aspects of 15-keto-PGE2, which may have important roles in passing on activities to EP2 receptors from PGE2-stimulated EP4 receptors as a “switched agonist.” This novel mechanism may be significant for gradually terminating PGE2-evoked inflammation and/or maintaining homeostasis of colorectal tissues/cells functions.
Keywords: EP4 prostanoid receptors, EP2 prostanoid receptors, PGE2, 15-keto-PGE2, biased agonist, switched agonist, Schild regression, pharmacology, G-protein–coupled receptor (GPCR), prostaglandin, cancer biology, bioinformatics, biased ligand, switched ligand
E-type prostanoid (EP) receptors are known as cognates for prostaglandin E2 (PGE2) that have four main subtypes: EP1, EP2, EP3, and EP4 (1). Prostanoid receptors have been reported to be activated not only by their cognate ligands but also noncognate prostanoids as biased ligands (2–4). For example, we previously found that PGE1 and PGE3 are able to induce cAMP formation effectively as full agonist like PGE2, but they only partially activate β-catenin/T-cell factor (TCF)-mediated signaling as partial agonists, approximately half-maximal effects/responses compared with those induced by PGE2 (4). Because β-catenin/TCF–mediated signaling is well-known colorectal cancer–related signaling (5), PGE1 and PGE3 act as negative biased agonists for EP4 receptors to mediate anti-cancer effects by selectively not fully activating β-catenin/TCF–mediated signaling. These biased activities are possibly due to the different receptor conformations caused by the numbers and patterns of hydrogen-bonding formation between EP4 receptors and each PGE (4). Therefore, depending on slight structural differences, such as the numbers of double bonds, each prostanoid may activate distinct signaling as biased agonist via the same receptors.
PGE2 is well-known as an endogenous proinflammatory prostanoid, which is synthesized from arachidonic acid by the activation of cyclooxygenase-2 (COX-2) (6). After PGE2 has evoked sufficient inflammation, it is metabolized to 15-keto-PGE2 by the action of 15-hydroxyprostaglandin dehydrogenase. 15-Keto-PGE2 is widely considered as an inactive form of PGE2 (7, 8). On the other hand, 15-keto-PGE2 has also been previously shown to activate and produce cAMP via Gαs-protein–coupled EP2 and EP4 receptors, although the potencies and/or efficacies are weaker than those of PGE2 (9), because this prostanoid is not able to effectively activate EP receptors (10). The EP2 and EP4 receptors are, however, currently known to activate not only Gαs-protein–coupled cAMP-mediated signaling but also β-catenin/TCF-mediated signaling (6, 11). Because 15-keto-PGE2 is a one-hydrogen-removed reduced form of PGE2, this prostanoid will plausibly show the activity of β-catenin/TCF–mediated signaling besides Gαs-protein–coupled cAMP-mediated signaling and could act as a biased ligand for EP2 and EP4 receptors to regulate their diverged signaling pathways.
The expression levels of EP4 receptors have been reported to be higher in normal than cancerous tissues (12, 13), so EP4 receptors have been considered to play important roles in the maintenance of normal colorectal homeostasis (14). Normal colorectal epithelial cell proliferation and differentiation have also been reported to be regulated by β-catenin/TCF–mediated signaling. Indeed, this signaling is considered to have key roles in maintaining colorectal homeostasis (15). On the other hand, PGE2 is also well-known to be involved in colorectal cancer development (1, 16). Thus, increases in the levels of PGE2 and COX-2 are biomarkers for the early stage of colorectal cancer development. Because the up-regulation of COX-2 expression has been reported to be associated with the activation of EP4 receptors, the signaling pathways and expression mechanisms of EP4 receptors have been extensively investigated (12, 17–19). As described, β-catenin/TCF–mediated signaling is a biomarker for colorectal cancer (5), and it is evoked via activation of EP4 receptors (11). Therefore, if the EP4 receptor–mediated β-catenin/TCF-regulated homeostasis systems collapse, it will lead to the early stage of colorectal cancer, possibly due to the aberrant expression of EP4 receptors followed by unrestrained induction of COX-2 and excess amounts of de novo synthesis of PGE2 (19, 20). Meanwhile, β-catenin/TCF–mediated signaling is not only activated by EP4 receptors but also EP2 receptors (11). In collaboration with knockout mouse studies, EP2 receptors have been considered to be involved in colorectal cancer development as well (21). However, the detailed roles of EP2 receptors in colorectal cancer development as well as in normal homeostasis are not clearly understood.
Because 15-keto-PGE2 is able to bind to and has lower efficacies for EP2 and EP4 receptors than PGE2, at least in terms of cAMP formation (9), there is a possibility that 15-keto-PGE2 may take over the PGE2-evoked responses after PGE2 has been metabolized. Thus, it is plausible that 15-keto-PGE2 may play the role of attenuating and/or terminating PGE2-evoked functions. In the present study, to further estimate the role of 15-keto-PGE2 in attenuating PGE2-evoked signaling pathways, we examined the effects of 15-keto-PGE2 on each diverse signaling pathway as well as the binding affinity of EP2 or EP4 receptors. Because it is very difficult to monitor/measure the ratios of PGE2 and 15-keto-PGE2 as well as each ligand-induced signaling in regular cultured cell–based assay methods, operational model calculation, in silico analysis, and computer simulation were applied along with cell-based experiments using actual data, such as Emax values and EC50 values that were obtained by pharmacological experiments as well as IC50 values of the binding assay as provided in this study. Here we show that PGE2-activated EP4 receptor–mediated signaling may evoke the primary initiating reaction of the cells, which would take over the 15-keto-PGE2–activated EP2 receptor–mediated signaling after PGE2 is metabolized to 15-keto-PGE2. In other words, 15-keto-PGE2 may not be just an inactive metabolite of PGE2 but could act as a “switched agonist” of EP2 receptors from PGE2-activated EP4 receptors, which would mildly restore/terminate the PGE2/EP4 receptor–induced signaling for inflammatory reactions, and/or for maintaining homeostasis for colorectal cell functions. Therefore, once the EP2 receptor–mediated signaling is relatively weaker and/or the EP4 receptor–mediated signaling is persistently activated, the 15-keto-PGE2–mediated restoration/termination of signaling may not be started. The continuous PGE2-mediated signaling would evoke aberrant EP4 receptor–dominated signaling that would disrupt homeostasis and eventually lead to cancerous transformation.
Results and Discussion
The EP2 and EP4 prostanoid receptors are well-known to couple to Gαs-protein and can activate adenylyl cyclase to form cAMP. Although the levels of receptor expression are similar (HEK-293 cells stably expressing human EP2 receptors (HEK-EP2 cells), 122.6 ± 15.90 fmol/mg of protein; HEK-293 cells stably expressing human EP4 receptors (HEK-EP4 cells), 112.4 ± 5.570 fmol/mg of protein), PGE2-stimulated cAMP formation is significantly higher in HEK-EP2 cells compared with HEK-EP4 cells (11, 22). To evaluate the agonistic effects of PGE2 and its metabolite 15-keto-PGE2 (Fig. 1A), HEK-EP2 or HEK-EP4 cells were treated with the indicated concentrations of PGE2 or 15-keto-PGE2 for 60 min. As shown in Fig. 1B, the maximal level of cAMP formation in HEK-EP2 cells stimulated with PGE2 was approximately twice that obtained in HEK-EP4 cells stimulated with PGE2, consistent with our previous reports (11, 22). As described in the Introduction, PGE2 is known to be metabolized by oxidation to 15-keto-PGE2, which is widely considered as the inactive form of PGE2 (7, 8, 10). Although the EC50 value of 15-keto-PGE2 in HEK-EP2 cells is ∼200 times larger than PGE2 (PGE2, 548 pm (95% confidence interval: 320–929 pm); 15-keto-PGE2, 137 nm (95% confidence interval: 110–170 nm)), the Emax values of both prostanoids were similar (PGE2, 23.2 ± 0.723 pmol; 15-keto-PGE2, 23.0 ± 0.540 pmol), indicating that 15-keto-PGE2 is able to activate EP2 receptors as a full agonist (Fig. 1B, table of EP2 receptors). However, in HEK-EP4 cells, the EC50 value of 15-keto-PGE2 was more than 2,000 times larger than that of PGE2 (PGE2, 135 pm (95% confidence interval: 69.8–261 pm); 15-keto-PGE2, 426 nm (95% confidence: 20.1–90.4 nm)), and also the Emax value of 15-keto-PGE2 was almost half that of PGE2 (PGE2, 10.7 ± 0.308 pmol; 15-keto-PGE2, 5.64 ± 0.524 pmol) (Fig. 1B, table of EP4 receptors). These results indicate that 15-keto-PGE2 may work as a partial agonist of EP4 receptors in terms of cAMP formation.
Figure 1.
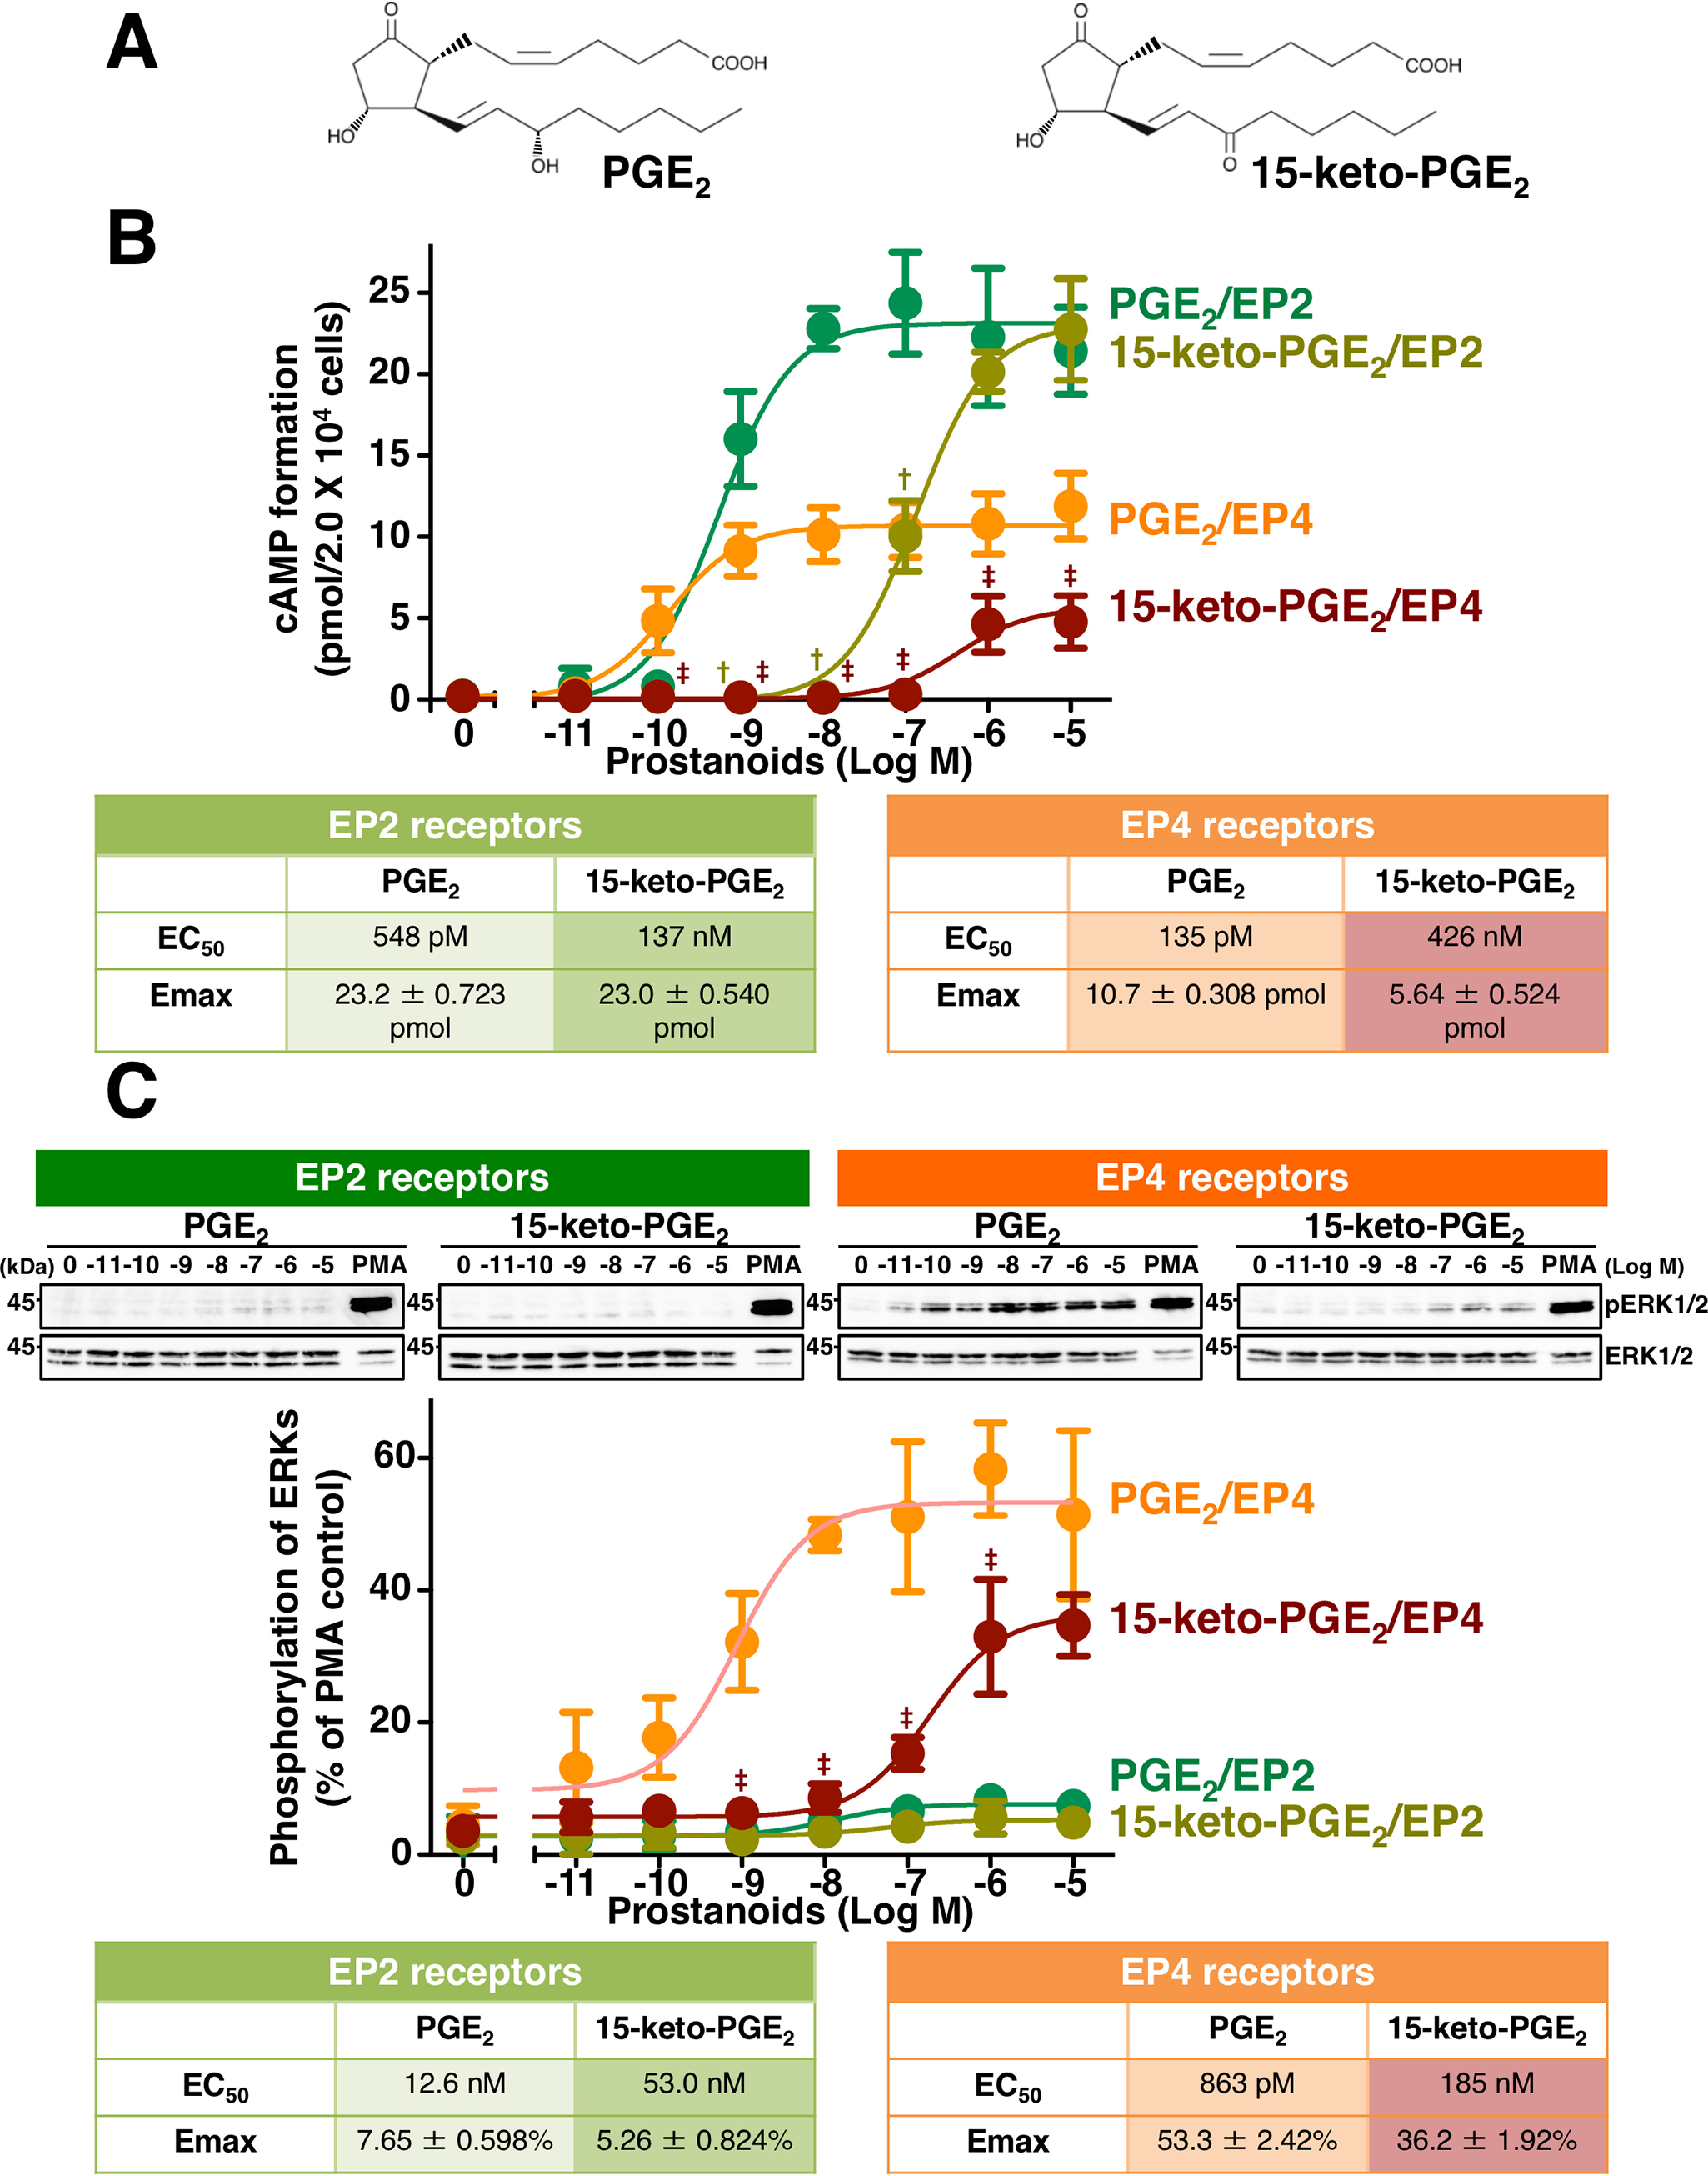
Effects of PGE2 or 15-keto-PGE2 on cAMP formation and the phosphorylation of ERKs in HEK-EP2 and HEK-EP4 cells. A, structures of PGE2 and 15-keto-PGE2. B and C, HEK-EP2 cells or HEK-EP4 cells were treated with vehicle or the indicated concentration of PGE2 or 15-keto-PGE2 for 60 min in the cAMP assay (B) or for 5 min in Western blots detecting the phosphorylation of ERKs (C). The tables show EC50 values and Emax values of PGE2– or 15-keto-PGE2–stimulated formation of cAMP (B) or phosphorylation of ERKs (C) in HEK-EP2 or HEK-EP4 cells. The amounts of cAMP formed are shown in pmol/2.0 × 104 cells/sample and are the mean ± S.E. (error bars) of at least three independent experiments, each performed in duplicate (B). Data are normalized to 10 nm PMA-stimulated phosphorylation of ERKs as 100% and are the mean ± S.D. (error bars) of at least three independent experiments (C). †, p < 0.05: analysis of variance for 15-keto-PGE2 significantly different from the corresponding concentrations of PGE2 in HEK-EP2 cells. ‡, p < 0.05: analysis of variance for 15-keto-PGE2 significantly different from the corresponding concentrations of PGE2 in HEK-EP4 cells.
We previously reported that PGE2 stimulation of HEK-EP4 cells, but not HEK-EP2 cells, can induce the phosphorylation of extracellular signal–regulated kinases (ERKs) via the Gαi-protein–mediated pathway (22, 23). Therefore, the effects of 15-keto-PGE2 on phosphorylation of ERKs were examined in HEK-EP2 and HEK-EP4 cells. As shown in Fig. 1C, when HEK-EP2 cells were treated with the indicated concentrations of PGE2 or 15-keto-PGE2 for 5 min, PGE2– and 15-keto-PGE2–stimulated HEK-EP2 cells showed slight increases in the phosphorylation of ERKs with Emax values of 7.65 ± 0.598 and 5.26 ± 0.824%, respectively, when compared with phorbol 12-myristate 13-acetate (PMA)-induced phosphorylation of ERKs as 100%. The EC50 values of PGE2 and 15-keto-PGE2–induced phosphorylation of ERKs in HEK-EP2 cells were 12.6 nm (95% confidence interval: 2.22–71.3 nm) and 53.0 nm (95% confidence interval: 682 pm to 4.11 μm), respectively. In the case of HEK-EP4 cells, the EC50 value and Emax value of PGE2-stimulated phosphorylation of ERKs were about 863 pm (95% confidence interval: 334 pm to 2.23 nm) and 53.3 ± 2.42%, respectively, when compared with a PMA-induced state as 100%, whereas those of 15-keto-PGE2–stimulated phosphorylation of ERKs were around 185 nm (95% confidence interval: 92.7–371 nm) and 36.2 ± 1.92%, respectively. These results indicate that PGE2 and 15-keto-PGE2 have little effect, if any, on phosphorylation of ERKs in HEK-EP2 cells, whereas 15-keto-PGE2 acts as a partial agonist when compared with full agonist PGE2 on the phosphorylation of ERKs in HEK-EP4 cells.
We previously showed that the stimulation of HEK-EP2 cells as well as HEK-EP4 cells with PGE2 induces β-catenin–mediated TCF transcriptional activities (11). However, the EP2 receptor–activated β-catenin/TCF–mediated transcriptional activity is mainly via Gαs-protein activation, whereas the EP4 receptor–activated β-catenin/TCF–mediated activity is predominantly via Gαi-protein activation (11). Thus, the effects of 15-keto-PGE2 on β-catenin/TCF-mediated activities were examined when compared with PGE2-stimulated activities using HEK-EP2 and HEK-EP4 cells. As shown in Fig. 2A, PGE2-stimulated β-catenin/TCF transcriptional activities in HEK-EP2 and HEK-EP4 cells were in a concentration-dependent manner with similar EC50 values (EP2, 123 pm (95% confidence interval: 53.7–282 pm); EP4, 65.4 pm (95% confidence interval: 30.7–139 pm)) and Emax values (EP2, 454 ± 15.2%; EP4, 471 ± 13.2%). 15-Keto-PGE2–stimulated β-catenin/TCF–mediated activities in both cell lines were essentially in a concentration-dependent manner. However, in HEK-EP2 cells, the maximal activation was 376 ± 11.9%, close to that of PGE2-stimulated activation, with an EC50 value of around 29.3 nm (95% confidence interval: 16.2–53.0 nm), whereas in HEK-EP4 cells, the Emax value of 15-keto-PGE2 was around 230 ± 21.2% with an EC50 value of about 19.5 nm (95% confidence interval: 2.35–163 nm). Therefore, in terms of β-catenin/TCF-mediated transcriptional activities, 15-keto-PGE2 functioned as a partial agonist of both EP2 and EP4 receptors, but 15-keto-PGE2 showed lower efficacy as well as potency for EP4 receptors than for EP2 receptors.
Figure 2.

Effects of PGE2 or 15-keto-PGE2 on β-catenin/TCF–mediated luciferase transcriptional activities and the competitive whole-cell radioligand binding of [3H]PGE2 in HEK-EP2 and HEK-EP4 cells. A, HEK-EP2 or HEK-EP4 cells were treated with vehicle or the indicated concentration of PGE2 or 15-keto-PGE2 for 16 h for the β-catenin/TCF–mediated luciferase assay. The table shows EC50 values and Emax values of PGE2– or 15-keto-PGE2–stimulated β-catenin/TCF–mediated luciferase activities in HEK-EP2 or HEK-EP4 cells. B, HEK-EP2 or HEK-EP4 cells were trypsinized and resuspended in MES buffer, and cell samples were then treated with vehicle or the indicated concentration of PGE2 or 15-keto-PGE2 for 120 min, followed by washing, and were then assayed for specific binding for [3H]PGE2. The table shows IC50 values obtained from the PGE2– or 15-keto-PGE2–competitive [3H]PGE2 radioligand whole-cell binding assay in HEK-EP2 or HEK-EP4 cells. Data are normalized to each vehicle-treated control as 100% and are the mean ± S.E. (error bars) of at least three independent experiments, each performed in duplicate (A and B). †, p < 0.05: analysis of variance for 15-keto-PGE2 significantly different from the corresponding concentrations of PGE2 in HEK-EP2 cells. ‡, p < 0.05: analysis of variance for 15-keto-PGE2 significantly different from the corresponding concentrations of PGE2 in HEK-EP4 cells.
Next, to examine the binding affinity of 15-keto-PGE2 for each EP2 or EP4 receptor, a competitive whole-cell radioligand binding of [3H]PGE2 assay was then performed. As shown in Fig. 2B, PGE2 and 15-keto-PGE2 caused the concentration-dependent inhibition of [3H]PGE2 binding to both HEK-EP2 and HEK-EP4 cells. The IC50 values of EP2 receptors for PGE2 and 15-keto-PGE2 were ∼2.94 nm (95% confidence interval: 1.23–7.00 nm) and 118 nm (95% confidence interval: 82.2–170 nm), respectively. The IC50 values of EP4 receptors for both prostanoids were about 434 pm (95% confidence interval: 282–668 pm) and 2.82 μm (95% confidence interval: 1.66–4.80 μm), respectively. Thus, the differences in IC50 values between PGE2 and 15-keto-PGE2 are around 100 times in HEK-EP2 cells but around 10,000 times in HEK-EP4 cells. Therefore, PGE2 may tend to bind EP4 receptors rather than EP2 receptors, whereas 15-keto-PGE2 may more easily bind to EP2 receptors than EP4 receptors. The lower potencies and efficacies of 15-keto-PGE2 for EP4 receptors in terms of cAMP formation, phosphorylation of ERKs, and β-catenin/TCF-mediated transcriptional activity could be due, at least in part, to the lower binding affinity of this prostanoid for EP4 receptors. In addition, 15-keto-PGE2 is also known to act through the activation of peroxisome proliferator-activated receptor (PPAR) (8); however, treatment with 15-keto-PGE2 of parent HEK-293 cells did not evoke PPAR-response element–luciferase reporter gene activity at any concentrations (data not shown), so the effects of this prostanoid may be mediated through EP2 or EP4 receptors, but not via PPAR.
We previously showed that tyrosine 196 on transmembrane 5 (TM5) and glutamate 288 on TM6 in human EP2 receptors, as well as lysine 82 on TM2, arginine 291 on TM6, and serine 307 on TM7 in human EP4 receptors, are key amino acids for ligand binding (3, 4). Thus, to further examine the interactions between PGE2 or 15-keto-PGE2 and either EP2 or EP4 receptors, in silico simulations were performed. As shown in Fig. 3A, 15-keto-PGE2 was retained to form a nonclassical CH-π hydrogen bond at position 10 with the phenol ring structure of Tyr-196 in EP2 receptors, similar to PGE2. However, unlike PGE2, because position 15 of the hydroxyl functional group was oxidized to a carbonyl functional group, the hydrogen bond was not formed to 15-keto-PGE2 with Glu-288 in EP2 receptors. As we discussed previously, PGE2 forms a CH-π hydrogen bond with the EP2 receptor, resulting in a stable cognate receptor for PGE2 because the CH-π bonds do not form with PGD2 or PGF2α (3). Thus, the higher potencies and efficacies of 15-keto-PGE2 for EP2 receptors than EP4 receptors in terms of cAMP formation and β-catenin/TCF–mediated activity could be due to the higher affinity of this prostanoid for EP2 receptors through CH-π bond formation, at least to some extent.
Figure 3.

Binding models of EP2 receptors (A) or EP4 receptors (B) with PGE2 or 15-keto-PGE2. Shown are molecular interactions within PGE2 (a), 15-keto-PGE2 (c), or the binding cavity of the EP2 receptor (A) or EP4 receptor (B). Shown is a schematic representation of hydrogen-bonding interactions between PGE2 (b) or 15-keto-PGE2 (d) and Tyr-196 and Glu-288 of the EP2 receptor (A) or Lys-82, Arg-291, and Ser-307 of the EP4 receptor (B). Dashed lines, hydrogen bonds.
In the case of EP4 receptors, as shown in Fig. 3B, 15-keto-PGE2 was retained to form a hydrogen bond at position 1 with Lys-82 in EP4 receptors, similar to PGE2. As we reported previously, PGE2 formed a single hydrogen bond at position 9 to Arg-291 and two hydrogen bonds at position 15 to Ser-307 in EP4 receptors (4). 15-Keto-PGE2 formed two hydrogen bonds at position 9 to Arg-291, but no bond was formed with Ser-307, possibly because position 15 of the hydroxyl functional group was oxidized to a carbonyl functional group. These two hydrogen bonds formed at position 9 of the cyclopentane ring of 15-keto-PGE2 with Arg-291 of EP4 receptors were also formed by PGE1 as well as PGE3, which was discussed previously and considered as one reason why they are not able to transform the receptor conformation fully to activate β-catenin/TCF-mediated transcriptional activity of EP4 receptors (4). Interestingly, PGE1 and PGE3 are able to form one hydrogen bond at position 15 to Ser-307 of EP4 receptors (4); however, no bond was formed at position 15 of 15-keto-PGE2 with Ser-307 of EP4 receptors, as shown in Fig. 3B. It is considered that this hydrogen bond between position 15 of prostanoids and Ser-307 of EP4 receptors may be a key factor in biased activity for cAMP formation. Thus, hydrogen bond–forming PGE1 and PGE3 are able to act as full agonists in the pathway to cAMP formation, whereas 15-keto-PGE2 may not be able to act as a full agonist but as a partial agonist for that pathway, because the key position 15 of the hydroxyl functional group was oxidized to a carbonyl functional group.
As described in the Introduction, 15-keto-PGE2 has been considered as an inactive metabolite of PGE2 (7, 8, 10). However, to summarize the points so far, 15-keto-PGE2 acted as a full agonist for EP2 receptors in terms of the pathway to cAMP formation and as a partial agonist of β-catenin/TCF signaling. In terms of EP4 receptors, 15-keto-PGE2 acted as a partial agonist of all the tested EP4 receptor–mediated signaling. Therefore, it is considered that 15-keto-PGE2 is not an inactive form of PGE2 but that this prostanoid itself may have the potential to evoke and take over the signaling even after PGE2 has been degraded by the action of 15-hydroxyprostaglandin dehydrogenase to 15-keto-PGE2. Moreover, 15-keto-PGE2 showed a predilection for the EP2 receptor and its signaling rather than for the EP4 receptor and its signaling. However, it is very difficult to monitor/measure the ratios of PGE2 and 15-keto-PGE2 as well as each ligand-induced signaling in regular cultured cell–based assay methods. Thus, to examine the roles of 15-keto-PGE2 after PGE2 degradation, we applied the actual data, such as IC50 values of the binding assay and Emax values obtained by PGE2 stimulations and EC50 values that were obtained in Figs. 1 (B and C) and 2A, to the Black/Leff operational model (24–29) and to in silico computer simulations.
From the experimental results obtained in Figs. 1 (B and C) and 2A, the best-fit curves of cAMP formation, phosphorylation of ERKs, and β-catenin/TCF–mediated activity evoked by either PGE2 or 15-keto PGE2 in HEK-EP2 or HEK-EP4 cells were regressed.
The regressed PGE2 concentration-response curve was plotted (solid wine-red line), and then the reverse style of the 15-keto-PGE2 concentration-response curve was plotted (solid blue-gray line), as shown in Fig. 4A (a). When PGE2 reached a maximal concentration of 10−5 m, then all the metabolized PGE2 would eventually become 15-keto-PGE2. Thus, the concentration of PGE2 would be considered to decrease in reverse increments (Fig. 4A (a), dashed wine-red line). Along with the decrease in the concentration of PGE2, metabolized 15-keto-PGE2 was increased (dashed blue-gray line). For example, when PGE2 was 10−6 m, the corresponding metabolized 15-keto-PGE2 was considered to be ∼10−5.05 m using the formula, [15-keto-PGE2] = 10−5 − [PGE2]. When all the PGE2 had been completely metabolized to 15-keto-PGE2, then the maximal concentration of 15-keto-PGE2 was considered to reduce the concentration as shown in Fig. 4A (a) (solid blue-gray line).
Figure 4.

The simulated total effects/responses of cAMP, phosphorylation of ERKs, and TCF-mediated transcriptional activities of EP2 and EP4 receptors evoked by PGE2 followed by 15-keto-PGE2. A, schematic methods to estimate the apparent affinities by operational model followed by Schild regression analysis simulation based on the obtained experimental data, including IC50 values. a, as illustrated, the regressed best-fit concentration-effect/response curves based on EC50 values and Emax values obtained in Figs. 1 (B and C) and 2A. The increase of PGE2 reached the maximal concentration (solid wine-red line) and was assumed to decrease in the reverse way of increment (dashed wine-red line). The curves of the regressed best-fit concentration-effect/response of 15-keto-PGE2 were plotted in reverse order, from left to right as 10−5 to 0 m (blue-gray line). Accompanying the decrease in the concentration of PGE2 (dashed wine-red line), 15-keto-PGE2 was increased based on the formula, [15-keto-PGE2] = 10−5 − [PGE2], and it reached the maximal concentration when all PGE2 had been completely metabolized to 15-keto-PGE2 (dashed blue-gray line), followed by the reduction (solid blue-gray line). Because those prostanoids could compete with each other at each receptor during the period when PGE2 was metabolized to 15-keto-PGE2 (dashed lines), because both prostanoids concomitantly exist in the same environment, the apparent concentrations of each prostanoid competing with either EP2 or EP4 receptors were calculated by Schild regression analysis as described under “Experimental procedures” (Schild Area). b, apparent concentrations of PGE2 (CE2) and 15-keto-PGE2 (C15) were estimated by Schild regression using actual results of Figs. 1 (B and C) and 2A with IC50 values of PGE2 and 15-keto-PGE2 obtained in Fig. 2B, and each apparent affinity value of 15-keto-PGE2 was determined by the Black/Leff operational model calculation (K15). c, the effect/response of PGE2 (EE2) for PGE2 at the concentration of CE2 and effect/response of 15-keto-PGE2 (E15) for 15-keto-PGE2 at the concentration of C15 were estimated from each regressed best-fit curve obtained in Figs. 1 (B and C) and 2A. Total effect/response in the Schild area, which was combined EE2 and E15, was plotted to the corresponding concentration of CE2 and C15 (pink-violet line). B, schema of the increase or decrease of PGE2 and 15-keto-PGE2, where the area in which both prostanoids exist is named the Schild area, from ∼10−6 to 10−11 m PGE2 and corresponding 15-keto-PGE2. Shown are the simulated total amounts of cAMP formation (C and D), phosphorylated ERKs (E and F), and TCF transcriptional activities (G and H) of EP2 and EP4 receptors with PGE2 followed by 15-keto-PGE2. Wine-red line, PGE2 alone; blue-gray line, 15-keto-PGE2 alone; pink-violet line, PGE2 with 15-keto-PGE2. ΔTC represents each signaling TC – TC of cAMP signaling (set as the standard).
When PGE2 was metabolized to 15-keto-PGE2, however, those prostanoids could compete with each other at each receptor, because both prostanoids concomitantly exist in the same environment. Thus, the area in which PGE2 and 15-keto-PGE2 co-existed as shown in Fig. 4A (a) was named as the Schild area.
In the case of cAMP formation response curves in EP2 receptors, as shown in Fig. 1B, 15-keto-PGE2 was able to activate EP2 receptors to a similar level of PGE2 as full agonist. Therefore, apparent concentrations of PGE2– and 15-keto-PGE2–competing EP2 receptors were calculated using Schild regression analysis, as described under “Experimental procedures” and were replotted using the calculated results (Schild area). Schild regression analysis is known to quantify the affinity of competitive antagonists (i.e. if the concentration of the antagonist is known, the affinity of the antagonist can be calculated) (24). Here, we have utilized Schild regression analysis for estimating the apparent concentrations of the agonist by using the affinity value of the antagonist. Thus, using IC50 values of PGE2 and 15-keto-PGE2 for EP2 receptors obtained in Fig. 2B, either 15-keto-PGE2 or PGE2 was regarded as a competing antagonist, and apparent concentrations of both prostanoids were calculated using Schild regression analysis (Fig. 4, A and C).
On the other hand, 15-keto-PGE2 was not able to activate both EP2 and EP4 receptors to the levels of PGE2, a full agonist, in each signaling pathway except for cAMP formation response in EP2 receptors, as described above. Therefore, 15-keto-PGE2 acted as partial agonist for phosphorylation of ERKs, β-catenin/TCF–mediated signaling in both EP2 and EP4 receptors, and cAMP formation response in EP4 receptors (Figs. 1 (B and C) and 2A).
Although the IC50 (the index of binding affinity) values of 15-keto-PGE2 to EP2 and EP4 receptors are shown in Fig. 2B, these values may not be appropriate for directly estimating the apparent concentrations of partial agonist (i.e. 15-keto-PGE2) by Schild regression analysis. Because the concentration-response curve of partial agonist is determined by the efficacy of that partial agonist and the sensitivity of the system of each signaling pathway or the surrounding environment where the receptors are expressing, it may not always reflect the experimental IC50 value of that partial agonist (29). Therefore, to determine the apparent affinity of partial agonist, the Black/Leff operational model was utilized (24–29). The Black/Leff operational model is used to accommodate the fitting of experimental results and the occurrence of ligand-stimulated response cooperatively, because experimental concentration-response curves do not always reflect the stimulus-response processes (24). In this particular case, the maximum possible effect/response (Emax value) experimentally obtained by each concentration-response curve of each signaling pathway of PGE2 (full agonist) and each EC50 value as well as each Emax value of 15-keto-PGE2 experimentally obtained by each concentration-response curve of each signaling pathway (Figs. 1 (B and C) and 2A) can determine each signaling pathway's specific apparent affinity of 15-keto-PGE2 by Black/Leff operational model calculation. Note that the apparent responses should be directly calculated by the Black/Leff operational model without using the Schild regression analysis. However, we utilized this operational model just for calculating the apparent affinities of the partial agonistic activity of 15-keto-PGE2, because it would be difficult to calculate the apparent affinities and efficacies of full agonist (15-keto-PGE2, which fully agonistically stimulated cAMP signaling via EP2 receptors) directly by this model.
Therefore, apparent concentrations of PGE2 (CE2) and 15-keto-PGE2 (C15) competing with either EP2 or EP4 receptors in the Schild area were estimated by Schild regression using IC50 values as well as apparent affinities of either PGE2 or 15-keto-PGE2 calculated by the Black/Leff operational model (Fig. 4A (b)).
Next, using the regressed best-fit concentration-response curves obtained from Figs. 1 (B and C) and 2A, the apparent effect/response of PGE2 (EE2) at the concentration of CE2 and apparent effect/response of 15-keto-PGE2 (E15) at the concentration of C15 were estimated. Finally, the total effect/response, which was combined EE2 and E15, was replotted back to the corresponding concentrations of CE2 + C15, as shown in Fig. 4A (c).
As presented in Fig. 4B, the PGE2 concentration will simply increase from 0 to 10−5 m, with the characters from a to h shown in wine-red color. When PGE2 reached 10−5 m, the maximal concentration, then there was a decrease in increment. With a decrease in the concentration of PGE2, 15-keto-PGE2 will increase, because all the metabolized PGE2 is considered to become 15-keto-PGE2. Thus, again, when PGE2 was metabolized to 10−6 m, the corresponding 15-keto-PGE2 was estimated as ∼10−5.05 m, which was calculated from the formula, [15-keto-PGE2] = 10−5 − [PGE2]. The Schild area, where both prostanoids exist, is indicated with the characters from i to n in pink-violet color (from ∼10−6 to 10−11 m PGE2 and corresponding 15-keto-PGE2). Then, after PGE2 has been completely metabolized to 15-keto-PGE2, it will simply be decreased, as indicated with the characters from o to v in blue-gray color (from about 10−6 to 0 m).
Based on the Schild regression analysis using IC50 values and/or apparent affinities calculated by the Black/Leff operational model, we estimated the total effects/responses of each receptor-activated cAMP formation, phosphorylation of ERKs, and β-catenin/TCF–mediated transcriptional activities. In the Schild area, when apparent concentration of PGE2 to the EP2 receptors was 10−6.11 m, the corresponding apparent concentration of 15-keto-PGE2 was 10−7.58 m. The effects/responses evoked by each prostanoid using regressed best-fit curves of cAMP were 23.13 pmol for PGE2 and 3.720 pmol for 15-keto-PGE2, so that the total amount of cAMP would be 26.92 pmol; although the Emax value of cAMP formation caused by PGE2 was 23.15 pmol, total amounts higher than 23.15 pmol were plotted as 23.15 pmol (Fig. 4C). Similar simulations were performed in terms of cAMP in EP4 receptors as well as phosphorylation of ERKs and β-catenin/TCF-mediated transcriptional activities in both EP2 and EP4 receptors (Fig. 4, D–H).
As shown in Fig. 4C, the simulated EP2 receptor–stimulated total cAMP formed by PGE2 and 15-keto-PGE2 (pink-violet line) reached the Emax at 10−8 m PGE2 (e) and continued to the highest levels in the Schild area at 10−6 m 15-keto-PGE2 (p) and then gradually decreased to 10−9 m prostanoid (s). Although, as shown in Fig. 4D, the simulated EP4 receptor–stimulated total cAMP formed by PGE2 and 15-keto-PGE2 (pink-violet line) reached the Emax at 10−9 m PGE2 (d), the effect/response was less than half when compared with EP2 receptor–stimulated cAMP formation shown in Fig. 4C. The Emax level continued in the Schild area at around 10−9 m PGE2 with ∼10−5 m 15-keto-PGE2 (l) and was markedly reduced during the last half of the Schild area and then decreased gradually and in a stepwise manner to 10−8 m prostanoid (r), as shown in Fig. 4D (pink-violet line).
In terms of phosphorylation of ERKs, the simulated EP2 receptor–stimulated phosphorylation of ERKs was only weakly or not evoked by either PGE2 or 15-keto-PGE2 (Fig. 4E, pink-violet line), whereas, as shown in Fig. 4F, the simulated EP4 receptor–stimulated phosphorylation of ERKs reached the Emax level at 10−8 m PGE2 (e) (pink-violet line). The Emax level continued to the Schild area at around 10−7 m PGE2 with ∼10−5 m 15-keto-PGE2 (j) (pink-violet line), gradually reduced during the last half of the Schild area, and then decreased in a stepwise manner to 10−9 m prostanoid (s), similar to the cAMP formation shown in Fig. 4D (Fig. 4F). With regard to β-catenin/TCF–mediated activity, the simulated curves were more robustly reduced under EP4 receptor–stimulated conditions than EP2 receptor–stimulated conditions in the Schild area (pink-violet line). However, they were similarly activated by PGE2, reached almost identical Emax levels at the same concentration, and then decreased gradually and in a stepwise manner to 10−9 m prostanoids (Fig. 4, G and H).
As described earlier, in terms of cAMP formation, although it was previously reported to have partial agonistic effects on EP2 and EP4 receptors (9), 15-keto-PGE2 is widely considered as the inactive metabolite of PGE2 (7, 8, 10). However, from the simulated results shown in Fig. 4, PGE2-evoked signaling may not be shut down immediately, but 15-keto-PGE2 has the potential to take over the actions of PGE2 to bring such signaling to an end. The phase-out decline of the signaling by 15-keto-PGE2 is probably attributable to the affinity, efficacy, and sensitivity of the system/surrounding environment of 15-keto-PGE2 for the receptors. Thus, regarding EP2 receptor–mediated signaling, the maximal effects/responses evoked by 15-keto-PGE2 were similar or showed little decline when compared with the effects/responses evoked by PGE2. Therefore, the PGE2-evoked signaling may be prolonged with higher effect/response, and it may be terminated smoothly and gradually because 15-keto-PGE2 could act as a full and/or potent partial agonist of EP2 receptors with higher binding affinity than that of EP4 receptors. On the other hand, regarding EP4 receptor–mediated signaling, the maximal effects/responses evoked by 15-keto-PGE2 for EP4 receptors were lower than those of PGE2. Thus, the EP4 receptors were not fully activated by 15-keto-PGE2 so that each signaling was only marginally extended; the effects/responses from EP4 receptors evoked by 15-keto-PGE2 were declined ∼50% in cAMP formation, 40% in the case of activation of ERKs, and 75% in β-catenin/TCF–mediated activation when compared with the effects/responses evoked by a full agonist, PGE2 (Figs. 4, D, F, and H). Nevertheless, 15-keto-PGE2 may not terminate the EP4 receptor–mediated PGE2-evoked signaling abruptly but does so in a stepwise manner.
Meanwhile, each apparent affinity of 15-keto-PGE2 (K15) calculated by the Black/Leff operational model was similar in EP2 receptors but different in EP4 receptors from the each signaling pathway as well as the IC50 value obtained by binding assay as shown in Fig. 2B.
Thus, the experimental IC50 value of EP2 receptors to 15-keto-PGE2 was 118 nm (Fig. 2B), which was very close to the apparent affinities calculated by the Black/Leff operational model: 103 nm (phosphorylation of ERKs; Fig. 4E) and 123 nm (β-catenin/TCF–mediated transcriptional activity; Fig. 4G). On the other hand, in EP4 receptors, all the apparent affinities of 15-keto-PGE2 calculated by the Black/Leff operational model were smaller (stronger) and different (884 nm (cAMP formation: Fig. 4D), 590 nm (phosphorylation of ERKs; Fig. 4F), and 32.9 nm (β-catenin/TCF-mediated transcriptional activity; Fig. 4H)) from the experimental IC50 value (2.82 μm; Fig. 2B).
Therefore, it is possible to speculate that the partial agonistic activity of each signaling pathway evoked by 15-keto-PGE2 on EP4 receptors could be differently regulated; the differences among the apparent affinities of the signaling pathways and IC50 value of 15-keto-PGE2 on EP4 receptors may reflect the different sensitivity of the system/surrounding environment among the signaling pathway–specific transitional states of EP4 receptors. Unlike the solely Gαs-protein–coupled EP2 receptors, EP4 receptors are shown to couple with additional Gαi-protein along with Gαs-protein (22). Thus, stepwise activation of each signaling pathway from EP4 receptors by 15-keto-PGE2, which may alter Gαs- and Gαi-protein coupling balances, depends on the signaling pathways, similarly to what we have discussed previously (3).
Interestingly, in comparison with the EC50 values of PGE2, as shown in Figs. 1 (B and C) and 2A, PGE2 may prefer to activate the β-catenin/TCF–mediated pathway (EP2, 123 pm; EP4, 65.4 pm) rather than cAMP-mediated signaling (EP2, 548 pm; EP4, 135 pm) and the ERK-mediated pathway (EP2, 12.6 nm; EP4, 863 pm) in both EP2 receptors and EP4 receptors, whereas in comparison with the EC50 values of 15-keto-PGE2, 15-keto-PGE2 may prefer to activate the β-catenin/TCF–mediated pathway (EP2, 29.3 nm; EP4, 19.5 nm) rather than the ERK-mediated pathway (EP2, 53.0 nm; EP4, 185 nm) and cAMP-mediated signaling (EP2, 137 nm; EP4, 426 nm). Therefore, 15-keto-PGE2–stimulated Gαs-protein–mediated cAMP signaling showed the weakest potencies in both EP2 and EP4 receptors. It is thought that the reason why 15-keto-PGE2 has been regarded as an inactive metabolite of PGE2, which may come from these least potent effects on cAMP-mediated signaling because EP2 and EP4 receptors had been considered to couple simply and solely with Gαs-protein.
Incidentally, in terms of the maximal effects/responses of the signaling pathways of EP2 receptors, 15-keto-PGE2 can fully activate the cAMP-mediated pathway (about 100% of PGE2) but may act as partial agonist for the β-catenin/TCF–mediated signaling (∼83% of PGE2) and ERK pathways (around 70% of PGE2). Thus, with respect to the Emax values, 15-keto-PGE2 showed biased activity for the cAMP-mediated pathway compared with other signaling pathways of EP2 receptors. In the case of EP4 receptors, 15-keto-PGE2 could not fully activate all the EP4 receptor–mediated signaling pathways to the levels that were stimulated by PGE2, it acted as a partial agonist: about 53% in cAMP, around 68% in ERK activation, and ∼49% in the β-catenin/TCF–mediated pathway.
Meanwhile, the transduction coefficient (TC) is known as a system/surrounding environment–independent parameter considering affinity and efficacy of the agonist (27–29). To use TC of the cAMP signaling as the standard, ΔTC can be calculated by simple subtraction; TC (cAMP) is subtracted from each signaling TC, which can be used as a signaling bias parameter. When compared with each ΔTC of PGE2, as shown in Fig. 4 (C–H), PGE2 may prefer to activate the β-catenin/TCF–mediated pathway (EP2, 0.66; EP4, 0.32) rather than cAMP-mediated signaling (EP2, 0; EP4, 0) and the ERK-mediated pathway (EP2, −1.35; EP4, −0.81), in both EP2 receptors and EP4 receptors, whereas in the case of 15-keto-PGE2, it may prefer to activate the β-catenin/TCF-mediated pathway (EP2, 0.60; EP4, 1.11) rather than the ERK-mediated pathway (EP2, 0.14; EP4, 0.37) rather than cAMP-mediated signaling (EP2, 0; EP4, 0) in both EP2 receptors and EP4 receptors. Therefore, signaling biases of 15-keto-PGE2 have changed from PGE2, and according to the values of ΔTC of 15-keto-PGE2, Gαs-protein–mediated cAMP signaling showed the smallest biased activity in both EP2 and EP4 receptors. Again, it could be a reason why 15-keto-PGE2 has been regarded as an inactive metabolite of PGE2, which is also suggested by the Black/Leff operational model calculated ΔTC values.
Taken together, 15-keto-PGE2 is able to act as a meaningful ligand to extend/sustain and/or terminate each signaling pathway evoked by PGE2, probably as a biased and/or partial agonist/ligand, in some cases as a full agonist/ligand, to pleiotropically fine-tune each signaling pathway.
In terms of effects/responses, from the results so far, EP2 receptors have biased activity for the cAMP-mediated pathway, whereas EP4 receptors have biased activity for activation of ERKs. Therefore, if the cells dominantly express EP2 receptors, PGE2/15-keto-PGE2 would predominantly and continuously activate cAMP-mediated signaling, whereas if the cells mainly express EP4 receptors, ERK-mediated signaling would be predominant. On the other hand, in terms of apparent affinities, 15-keto-PGE2 may preferentially affect (and hence inhibit) the ERK-mediated pathway (103 nm; Fig. 4E) via EP2 receptors and/or the β-catenin/TCF–mediated signaling (32.9 nm; Fig. 4H) via EP4 receptors as described above. Moreover, in terms of TC, 15-keto-PGE2 may preferentially activate the β-catenin/TCF–mediated signaling rather than the cAMP-mediated signaling through both receptor subtypes. In any case, depending on the dominantly expressing receptor subtype (i.e. EP2 or EP4), the predominantly activated signaling would be different. Thus, to clarify the extent to which the PGE2/15-keto-PGE2–evoked signaling differed, simple simulations were performed by altering the ratios of EP2 and EP4 receptors, such as EP2/EP4 ratios of 4:0, 3:1, 2:2, 1:3, and 0:4, as depicted in Fig. 5A.
Figure 5.

Simulations of the effects of altering the ratios of EP2 and EP4 receptors on PGE2 followed by 15-keto-PGE2-stimulated cAMP formation, phosphorylation of ERKs, and TCF transcriptional activations. A, schema of altering the ratios of EP2 and EP4 receptors (EP2/EP4) as 4:0, 3:1, 2:2, 1:3, and 0:4. Shown are the amounts of cAMP formation (B), phosphorylated ERKs (C), and TCF transcriptional activities (D) of EP2 and EP4 receptors with PGE2 followed by 15-keto-PGE2. Green line, EP2/EP4 as 4:0; sky-blue line, EP2/EP4 as 3:1; purple line, EP2/EP4 as 2:2; red line, EP2/EP4 as 1:3; orange line, EP2/EP4 as 0:4.
The formed maximal amounts and sustained ability to produce cAMP were highest if the cells expressed only the EP2 receptor subtype, and those were decreased in a stepwise manner by increasing the expression of EP4 receptors (Figs. 4C and 5B), whereas if the expressed receptor subtype was only EP4, the maximal amounts formed were markedly decreased but were still a little less than half when compared with the EP2 receptor only. However, the ability to produce cAMP was markedly reduced at the point when PGE2 was metabolized to 15-keto-PGE2 in the Schild area (Fig. 5B). On the other hand, in the case of activation of ERKs, if the cells expressed only the EP4 receptor subtype, PGE2-stimulated EP4 receptors evoked strong activation of ERKs, but this was reduced to some extent when PGE2 was replaced with 15-keto-PGE2 in the Schild area (Figs. 4F and 5C). Interestingly, although the maximal activation of ERKs was decreased in a stepwise manner, the decreased gap in activation caused by switching to 15-keto-PGE2 became inconspicuous by increasing the expression of EP2 receptors (Fig. 5C), whereas if the expressed receptor was only the EP2 subtype, the activation of ERKs by PGE2 as well as 15-keto-PGE2 was very weak and may be negligible. It should be noted that the cAMP assay was performed under the effects of a phosphodiesterase inhibitor, 3-isobutyl-1-methylxanthine, so that in the physiological conditions, the EP4 receptor–stimulated cAMP may be degraded much faster than the EP2 receptor–stimulated cAMP, which may make it negligible like activation of ERKs evoked by EP2 receptors.
As shown in Fig. 5 (B and C), the cAMP-mediated signaling and ERK-mediated signaling could markedly change if the expression ratio of EP2 and EP4 receptors is altered. However, interestingly, the induction of β-catenin/TCF–mediated transcriptional activity was not changed by altering the ratio of receptor subtypes, although the ability to sustain the activation was gradually reduced by an increasing ratio of the EP4 receptor subtype after the point when PGE2 was metabolized to 15-keto-PGE2 in the Schild area (Fig. 5D), plausibly because of potent apparent affinity (32.9 nm) and weak Emax (about 49% of PGE2) as shown in Figs. 4H and 2A. Thus, β-catenin/TCF-mediated signaling would be stimulated to a similar extent regardless of the EP2 or EP4 receptor subtypes. Of particular interest, it has been reported that β-catenin/TCF–mediated signaling is involved in colorectal epithelial cell proliferation as well as differentiation for maintaining intestinal homeostasis (15). We previously showed that EP2 receptor–mediated β-catenin/TCF–mediated signaling is mainly involved in the cAMP/PKA pathway, whereas EP4 receptor–mediated signaling is primarily involved in the PI3K/ERKs pathway (11). Thus, despite utilizing distinct pathways via EP2 receptors and/or EP4 receptors, PGE2 may maintain β-catenin/TCF–mediated signaling to preserve homeostasis. This may be the reason why 15-keto-PGE2 preferentially activates β-catenin/TCF–mediated signaling in both EP2 receptors and EP4 receptors in terms of potencies for retaining homeostasis. Thus, regardless of the expression ratio of EP2 or EP4 receptors, PGE2-stimulated β-catenin/TCF–mediated signaling may not be so different among persons if the total amounts of EP2 and EP4 receptor subtypes are similar, so that colorectal tissue homeostasis may not be affected by the ratio of the expression levels of both EP receptor subtypes. Note that the simulations we have performed here were based on the situation in which sufficient PGE2 was provided to each receptor subtypes around the environment. However, according to the results obtained in Fig. 4, if there is not much PGE2 available, both receptor subtypes may be competing for the ligand so that simulation would be complicated because it must consider the apparent affinities and the effects/responses for each signaling pathway, which will need to be taken into account in the future. cAMP/PKA-mediated signaling is widely accepted as regulating the inhibition of cellular growth (30), whereas PI3K/ERK-mediated signaling is often associated with cancer malignancy (20, 31). Thus, to estimate the relationship between the ratio difference of EP2 and EP4 receptors and the possibility of cancer development, in silico analysis using the colon and rectal cancer data of the Cancer Genome Atlas (TCGA) database was performed. Fig. 6A shows the mRNA expression of 383 colorectal cancer samples, which were extracted from the COADREAD data set, and the mRNA expression ratio of EP4 and EP2 was calculated and plotted. The median ratio was 5.89. The EP4/EP2 ratio in the high group was the same as or higher than the median (192 samples); when the ratio was lower than the median, the sample was plotted as ratio-low (191 samples). Using Kaplan–Meier analysis, the probabilities of survival were calculated and plotted between EP4/EP2 ratio-high and ratio-low groups, shown in Fig. 6B. Thus, the survival probability of the EP4/EP2 ratio-high group was significantly lower than that of the ratio-low group, indicating that relatively high EP4 receptor–expressing colorectal cancer may be related to a poor survival rate. Next, the expression levels of EP2 and EP4 receptors were shown side by side between high and low ratio groups. As shown in Fig. 6C, the expression levels of EP4 receptors were similar between high and low ratio groups (Fig. 6C). However, the EP2 receptor expression levels were significantly higher in the ratio-low group than in the ratio-high group (Fig. 6D). Thus, the poor survival probability of the EP4/EP2 ratio-high group may be due to the lower expression level of EP2 receptors, which is possibly caused by the relatively lower activation of the cAMP-mediated signaling as well as the comparatively higher ERK-mediated signaling.
Figure 6.

The relationship between the ratio difference of EP2 and EP4 receptors and the possibility of cancer development using the TCGA database and schema of homeostasis or cancer development mechanisms regulated by expression levels of EP2 and EP4 receptors. A, the mRNA expression of 383 colorectal cancer samples, which were extracted from the COADREAD data set, and the mRNA expression ratio of EP4 and EP2 were calculated and plotted. B, with Kaplan–Meier analysis, the probabilities of survival were calculated and plotted between EP4/EP2 ratio-high and ratio-low groups. The expression levels of EP4 receptors (C) and EP2 receptors (D) are shown side by side between high- and low-ratio groups. E, homeostatic mechanism regulated by the expression levels of EP2 and EP4 receptors (left scheme). Relatively higher EP4 receptor–dominated signaling would turn to cancer malignancy signaling, probably by reducing the expression of EP2 receptors (right scheme).
When taken together, based on the results obtained in this study, the homeostatic mechanism may be tightly regulated by the expression levels of EP2 and EP4 receptors, as depicted in Fig. 6E (left scheme). As described in the Introduction, EP4 receptors are involved in the pathophysiology of colon cancer based on previous studies (12, 17–19). Thus, as depicted in Fig. 6E (right scheme), it is plausible that the relatively higher EP4 receptor–dominant signaling would derail this homeostatic mechanism and turn to cancer malignancy signaling by reducing the expression of the monitoring/guarding receptor subtype, the EP2 receptors.
Conclusions
It has long been considered that 15-keto-PGE2 is the inactive metabolite of PGE2. However, this prostanoid may have an additional role as a biased/partial agonist to take over the actions of PGE2 to gradually terminate reactions as soft-landing ways. Moreover, because of the marked differences in the binding affinity for the EP2 and EP4 receptors, 15-keto-PGE2 also acts as a switch for cellular signaling to the EP2 receptor–mediated pathway from the EP4 receptor–mediated pathway, if both receptors are expressed closely on the same tissues and/or cells. In other words, PGE2-initiated EP4 receptor–mediated signaling would be terminated by the subsequent 15-keto-PGE2–adopted EP2 receptor–mediated restoring-signaling, which may have a role in maintaining homeostasis. Thus, once EP2 receptor–mediated signaling is relatively weaker and/or EP4 receptor–mediated signaling is persistently activated, the restoring signaling may not be started, so continuous PGE2-initiated signaling would evoke aberrant EP4 receptor–dominant signaling that would eventually lead to cancerous signaling. Note that those simulated 15-keto-PGE2–prolonged activations of each signaling pathway are likely to be altered in a physiological system/surrounding environment. Because it would be complicated and difficult to simulate, we did not consider the influences of 13,14-dyhydro-15-keto-PGE2, which is the further metabolized prostanoid of 15-keto-PGE2. The effects of 13,14-dyhydro-15-keto-PGE2 should be examined in the near future; however, it is plausible that this prostanoid-mediated signaling may further take over 15-keto-PGE2 signaling, which may terminate the PGE2-initiated signaling more smoothly, stepwisely, and pleiotropically. We are aware that these speculations are based on simulated calculations. As described earlier, it is very difficult to monitor metabolite conversion and their activities in actual experiments, which needs to be addressed in the future, but we believe that the present results shed new light on aspects of 15-keto-PGE2 as not an inactive metabolite, but a biased and/or partial agonist to pleiotropically fine-tune each signaling pathway. Although there are some differences among the apparent affinities and the effects/responses among the signaling pathways and between the receptor subtypes, according to the actual experimental IC50 values obtained in Fig. 2B, 15-keto-PGE2 may have important roles in translational activities from EP4 to EP2 receptors as a “switched agonist” for restoring/terminating the inflammatory reaction and/or maintaining homeostasis, such as in the colorectal tissues/cells functions.
Experimental procedures
Cell culture and materials
HEK-293 cells stably expressing human EP2 (HEK-EP2 cells) or human EP4 (HEK-EP4 cells) prostanoid receptors were cultured at 37 °C in Dulbecco's modified Eagle's medium (DMEM; Sigma) containing 10% fetal bovine serum (Thermo Scientific, Waltham, MA, USA), 250 µg/ml Geneticin (Phyto Technology Laboratories, Shawnee Mission, KS, USA), 200 µg/ml hygromycin B (Enzo Life Sciences, Farmingdale, NY, USA), and 100 µg/ml gentamicin (Life Technologies, Inc.). PGE2 and 15-keto-PGE2 were purchased from Cayman Chemical (Ann Arbor, MI, USA). All materials were obtained from Wako Pure Chemical (Osaka, Japan) unless stated otherwise.
cAMP assay
HEK-EP2 or HEK-EP4 cells were cultured in 6-well plates and were switched from DMEM to Opti-MEM (Invitrogen, Carlsbad, CA, USA) containing 250 µg/ml Geneticin, 200 µg/ml hygromycin B, and 100 µg/ml gentamicin 16 h prior to the experiments. Cells were treated with 0.1 mg/ml 3-isobutyl-1-methylxanthine (Sigma) for 25 min followed by vehicle (0.1% DMSO) or the indicated concentrations of PGE2 or 15-keto-PGE2 for 60 min. Experiments were terminated by the removal of medium. The amount of cAMP that formed was calculated from a prepared standard curve using nonradiolabeled cAMP, as reported previously (3, 4).
Western blotting
HEK-EP2 or HEK-EP4 cells were cultured in 6-well plates, and, prior to immunoblotting experiments, the culture medium was switched to Opti-MEM containing antibiotics at 37 °C for 16 h, as stated above. Cells were then treated with either vehicle or the indicated concentrations of PGE2, 15-keto-PGE2, or 10 nm PMA for 5 min. Cells were scraped into lysis buffer consisting of 50 mm Tris-HCl (pH 8.0), 5 mm ethylene diamine (pH 8.0), 150 mm NaCl, 0.5% sodium deoxycholate, 1% Nonidet P-40, 10 mm sodium fluoride, 10 mm disodium pyrophosphate, 0.1% SDS, 0.1 mm phenylmethylsulfonyl fluoride, 1 mm sodium orthovanadate, 10 µg/ml leupeptin, and 10 µg/ml aprotinin, as described previously (4). As reported previously (4), ∼50 µg of protein samples was electrophoresed on 10% SDS-polyacrylamide gels and transferred to nitrocellulose membranes. After blocking for 1 h with 5% nonfat milk, the membranes were incubated with 1:1,000 dilutions of either an anti-phospho-ERK1/2 antibody (catalog no. 43705, Cell Signaling Technology, Danvers, MA, USA) in 5% BSA (Sigma) or a mixture of a 1:500 dilution of an anti-ERK1 antibody (sc-93, Santa Cruz Biotechnology, Inc., Dallas, TX, USA) and a 1:20,000 dilution of an anti-ERK2 antibody (sc-154, Santa Cruz Biotechnology) in 5% nonfat milk at 4 °C for 16 h. Membranes were washed twice after incubating with the primary antibody and then incubated with a 1:4,000 dilution of the appropriate secondary antibodies conjugated with horseradish peroxidase following the washouts, as described previously (4). To ensure the equal loading of proteins, membranes were stripped and reprobed with the anti-ERK1 and anti-ERK2 antibodies under the conditions described above.
TCF luciferase reporter gene assay
HEK-EP2 or HEK-EP4 cells were cultured in 6-well plates and were switched from DMEM to Opti-MEM (Invitrogen) containing 250 µg/ml Geneticin, 200 µg/ml hygromycin B, and 100 µg/ml gentamicin prior to the experiments. Cells were transiently transfected with either TOP flash or FOP flash, as reported previously (3, 4), along with the Renilla luciferase control plasmid, pRL-CMV (Promega, Madison, WI, USA), using HyliMax transfection reagent (Dojindo, Kumamoto, Japan). After ∼4 h, transfection reagents were removed by a medium change, and cells were treated with the indicated concentrations of PGE2 or 15-keto-PGE2 for a further 16 h. Cells were then lysed and assayed using the Dual-Luciferase reporter assay system (Promega) according to the manufacturer's instructions with TECAN infinite M200 (TECAN, Mannedorf, Switzerland). Data were normalized by calculating the ratios of firefly luciferase scores to the corresponding Renilla luciferase values and corrected for background activity by the subtraction of FOP flash values from the corresponding TOP flash values, as described previously (3, 4).
Whole-cell radioligand binding assay
HEK-EP2 or HEK-EP4 cells were cultured in 10-cm dishes. Prior to experiments, cell medium was switched to Opti-MEM containing antibiotics, as stated above, at 37 °C for 16 h. Cells were trypsinized and resuspended at 105 cells/sample in 100 µl of ice-cold 10 mm MES (pH 6.0; Sigma) buffer containing 0.4 mm EDTA and 10 mm MnCl2 (Sigma). As described previously (4), 2.5 nm [3H]PGE2 (GE Healthcare) was used for the binding assay with increased concentrations of PGE2 or 15-keto-PGE2. Samples were incubated at 4 °C for 2 h, and assays were terminated by filtration through a Whatman GF/C glass filter (Whatman, Maidstone, UK) followed by 3–5 washes with ice-cold MES buffer. Radioactivity was measured by liquid scintillation counting, as performed previously (4).
In silico analysis
The construction of the three-dimensional structure of human EP2 or human EP4 receptor and a docking simulation of PGE2 or 15-keto-PGE2 to either EP2 or EP4 receptor were performed with MOE (version 2016.08, CCG Inc., Montreal, Canada) based on the Protein Data Bank entry 4GRV.
In silico simulations
The simulated curves of cAMP formation, phosphorylation of ERKs, TCF-mediated transcriptional activity, and receptor occupancy were simulated using the results obtained in Figs. 1 and 2. The simulated cAMP formation curves were obtained using the average EC50 value and Emax shown in Fig. 1B (EP2/PGE2, 548 pm and 23.2 pmol; EP2/15-keto-PGE2, 137 nm and 23.0 pmol; EP4/PGE2, 135 pm and 10.7 pmol; EP4/15-keto-PGE2, 426 nm and 5.64 pmol), with the top value as each Emax value, bottom value as 0, and Hill slope as 1. The simulated ERK phosphorylation curves were obtained using the average EC50 value and Emax shown in Fig. 1C (EP2/PGE2, 12.6 nm and 7.65%; EP2/15-keto-PGE2, 53.0 nm and 5.26%; EP4/PGE2, 863 nm and 53.3%; EP4/15-keto-PGE2, 185 nm and 36.2%), with the top value as each Emax value, bottom value as each bottom value (EP2/PGE2, 2.81%; EP2/15-keto-PGE2, 2.86%; EP4/PGE2, 9.75%, EP4/15-keto-PGE2, 5.70%), and Hill slope as 1. The simulated TCF-mediated transcriptional activity curves were obtained using the average EC50 value and Emax shown in Fig. 2A (EP2/PGE2, 123 pm and 454%; EP2/15-keto-PGE2, 29.3 nm and 376%; EP4/PGE2, 65.4 pm and 471%; EP4/15-keto-PGE2, 19.5 nm and 230%), with the top value as each Emax value, bottom value as 100%, and Hill slope as 1. The curves of 15-keto-PGE2–stimulated cAMP formation, phosphorylation of ERKs, and TCF-mediated transcriptional activation in EP2 or EP4 receptors were plotted in reverse order, from left to right as 10−5 to 0 m.
Black/Leff operational model calculation
The estimated affinity (K15) and τ value of 15-keto-PGE2 were determined by GraphPad Prism software (version 8.0.1, La Jolla, CA, USA). The equation “operational model−partial agonist” was performed using the results obtained Fig. 1 (B–D) by using the formulas below. The basal level of the analysis for cAMP-mediated signaling was 0, for β-catenin/TCF-mediated signaling it was 100, and for phosphorylation of ERKs it was each bottom value. All Hill slopes used were specified as 1. Each signaling Emax value of PGE2 obtained by each experiment as shown in Figs. 1 (B and C) and 2A was used as Effectmax, an assumed maximal effect/response of each receptor (EP2 or EP4 receptor) activated by full agonist (PGE2).
| (Eq. 1) |
| (Eq. 2) |
where [B] represents 15-keto-PGE2 concentration and Y is each effect/response.
For partial agonist, TC (log(τ/KA)) was obtained from K15 and τ calculated by the Black/Leff operational model for partial agonist. For full agonist, TC was directly calculated according to the formula below. The basal level of the analysis for cAMP-mediated signaling was 0, for β-catenin/TCF-mediated signaling it was 100, and for phosphorylation of ERKs it was each bottom value. All Hill slopes used were specified as 1. Each signaling Emax value of PGE2 obtained by experiments was used as Effectmax.
| (Eq. 3) |
where [A] represents PGE2 or 15-keto-PGE2 concentration and Y is each effect/response.
Schild regression analysis
PGE2 was assumed to be degraded/metabolized after reaching the maximal concentration, 10−5 m, to 15-keto-PGE2. The corresponding 15-keto-PGE2 concentration was calculated by the formula, [15-keto-PGE2] = 10−5 − [PGE2]. To consider 15-keto-PGE2 as an antagonist, Schild regression for PGE2 analysis was calculated as below,
| (Eq. 4) |
which can convert to the following,
| (Eq. 5) |
where [A0] represents the apparent PGE2 concentration, [Ax] is PGE2 concentration when 15-keto-PGE2 exists, [Bx] is the 15-keto-PGE2 concentration when PGE2 exists, and kB is the IC50 value of 15-keto-PGE2 in EP2 receptors for the cAMP assay or apparent affinity of 15-keto-PGE2.
The apparent concentration of PGE2 or 15-keto-PGE2 was calculated as follows: [apparent PGE2 concentration] = IC50 value of 15-keto-PGE2 (cAMP assay in EP2 receptors) or K15 value (apparent affinity of 15-keto-PGE2 estimated by operational model calculation)/([15-keto-PGE2 concentration when PGE2 exists] + IC50 value of 15-keto-PGE2 (cAMP assay in EP2 receptors) or K15 value of 15-keto-PGE2) [PGE2 concentration when 15-keto-PGE2 exists].
Similarly, to consider PGE2 as an antagonist, Schild regression for 15-keto-PGE2 analysis was calculated as follows: [apparent 15-keto-PGE2 concentration] = IC50 value of PGE2/([PGE2 concentration when 15-keto-PGE2 exists] + IC50 value of PGE2) [15-keto-PGE2 concentration when PGE2 exists].
The apparent concentrations of PGE2 and 15-keto-PGE2 were estimated by Schild regression analysis. The apparent values of cAMP formed, phosphorylated ERKs, and activated β-catenin/TCF–mediated activity in the Schild area were obtained by the conversion from each apparent concentration of PGE2 and 15-keto-PGE2 with the simulated curves of each signaling pathway as described under “In silico simulations.” The plotted total amounts of each signaling pathway in the Schild area were estimated using the sum of PGE2 and 15-keto-PGE2, but if the total values were higher than Emax values caused by PGE2, they were plotted as each Emax value, respectively. The amounts of cAMP formed, phosphorylated ERKs, and activated TCF-mediated transcription evoked by PGE2 at 0 m (a) to 10−5 m (h) and by 15-keto-PGE2 at 10−5 m (o) to 0 m (v) were plotted as curves, shown in Fig. 4B.
The simulation-based effects of altering of the ratios of EP2 and EP4 receptors on the total amounts of cAMP formed, phosphorylated ERKs, and activated TCF-mediated transcription
The total combined amounts of cAMP formed, phosphorylated ERKs, and activated TCF-mediated transcription were calculated using the simple sum of the EP2 receptor–stimulated results and EP4 receptor–stimulated results obtained in Fig. 5 when the ratios of EP2 and EP4 receptors were altered to 4:0 (100%:0%), 3:1 (75%:25%), 2:2 (50%:50%), 1:3 (25%:75%), and 0:4 (0%:100%).
Bioinformatics analysis
The University of California Santa Cruz Xena browser (RRID:SCR_018938) was used to obtain the colon and rectal cancer data of TCGA (RRID:SCR_003193). The EP2 and EP4 gene expression values (log2 of normalized count) of 383 colorectal cancer samples with no missing overall survival data were extracted from the COADREAD data set, which was converted to non-logarithmic value, and the expression ratio of the EP4 gene relative to the EP2 gene was calculated. The samples were divided into two groups, the EP4/EP2 ratio-high group (192 samples) and the EP4/EP2 ratio-low group (191 samples), by the median value of the EP4/EP2 expression ratio (5.89). The probabilities of survival of the groups were calculated using the Kaplan–Meier analysis method, and significance was analyzed using the log-rank test. Statistical analyses were performed with R (version 3.4.1, RRID:SCR_001905). Significance was assumed at p < 0.05.
Data availability
For bioinformatic analysis, the University of California Santa Cruz Xena browser (RRID:SCR_018938) was used to obtain the colon and rectal cancer data of TCGA (RRID:SCR_003193). The rest of the data are contained within the article.
Acknowledgments
We thank all the laboratory members, former, current, and new, of the Department of Pharmacology for Life Sciences for kind suggestions and discussions.
Author contributions—S. E., A. S., K. F., K. S., Y. A., and Y. T. formal analysis; S. E., A. S., K. F., K. S., Y. A., and Y. T. validation; S. E., A. S., K. F., K. S., Y. A., and Y. T. methodology; A. S., K. F., and Y. T. software; A. S., K. F., Y. T., and H. F. visualization; K. F. and H. F. funding acquisition; J. W. R., M. M., Y. T., and H. F. data curation; J. W. R., M. M., Y. T., and H. F. writing-original draft; Y. T. and H. F. investigation; H. F. conceptualization; H. F. supervision; H. F. project administration; H. F. writing-review and editing.
Funding and additional information—This research was supported in part by MEXT KAKENHI Grants 17K08308 (JAPAN) (to H.F.), 20K07084 (JAPAN) (to H. F.), and 19K16374 (JAPAN) (to K. F.).
Conflict of interest—The authors declare that they have no conflicts of interest with the contents of this article.
- EP
- E type prostanoid
- PGE2
- prostaglandin E2
- COX-2
- cyclooxygenase-2
- TCF
- T-cell factor
- ERK
- extracellular signal–regulated kinase
- PMA
- phorbol 12-myristate 13-acetate
- PPAR
- peroxisome proliferator–activated receptor
- TM
- transmembrane
- TCGA
- the Cancer Genome Atlas
- HEK-EP2 cells
- HEK-293 cells stably expressing human EP2
- HEK-EP4 cells
- HEK-293 cells stably expressing human EP4
- DMEM
- Dulbecco's modified Eagle's medium
- PKA
- protein kinase A
- TC
- transduction coefficient
- PI3K
- phosphatidylinositol 3-kinase.
References
- 1. Woodward D. F., Jones R. L., and Narumiya S. (2011) International Union of Basic and Clinical Pharmacology. LXXXIII: classification of prostanoid receptors, updating 15 years of progress. Pharmacol. Rev. 63, 471–538 10.1124/pr.110.003517 [DOI] [PubMed] [Google Scholar]
- 2. Abramovitz M., Adam M., Boie Y., Carrière M., Denis D., Godbout C., Lamontagne S., Rochette C., Sawyer N., Tremblay N. M., Belley M., Gallant M., Dufresne C., Gareau Y., Ruel R., et al. (2000) The utilization of recombinant prostanoid receptors to determine the affinities and selectivities of prostaglandins and related analog. Biochim. Biophys. Acta 1483, 285–293 10.1016/S1388-1981(99)00164-X [DOI] [PubMed] [Google Scholar]
- 3. Suganami A., Fujino H., Okura I., Yanagisawa N., Sugiyama H., Regan J. W., Tamura Y., and Murayama Y. (2016) Human DP and EP2 prostanoid receptors take on distinct forms depending on the diverse binding of different ligands. FEBS J. 283, 3931–3940 10.1111/febs.13899 [DOI] [PubMed] [Google Scholar]
- 4. Araki Y., Suganami A., Endo S., Masuda Y., Fukushima K., Regan J. W., Murayama T., Tamura Y., and Fujino H. (2017) PGE1 and E3 show lower efficacies than E2 to β-catenin-mediated activity as biased ligands of EP4 prostanoid receptors. FEBS Lett. 591, 3771–3780 10.1002/1873-3468.12878 [DOI] [PubMed] [Google Scholar]
- 5. Srivastava S., Verma M., and Henson D. E. (2001) Biomarkers for early detection of colon cancer. Clin. Cancer Res. 7, 1118–1126 [PubMed] [Google Scholar]
- 6. Regan J. W. (2003) EP2 and EP4 prostanoid receptor signaling. Life Sci 74, 143–153 10.1016/j.lfs.2003.09.031 [DOI] [PubMed] [Google Scholar]
- 7. Tai H. H., Ensor C. M., Tong M., Zhou H., and Yan F. (2002) Prostaglandin catabolizing enzymes. Prostaglandins Other Lipid Mediat. 68-69, 483–493 10.1016/S0090-6980(02)00050-3 [DOI] [PubMed] [Google Scholar]
- 8. Chou W. L., Chuang L. M., Chou C. C., Wang A. H. J., Lawson J. A., Ga F., and Chang Z. F. (2007) Identification of a novel prostaglandin reductase reveals the involvement of prostaglandin E2 catabolism in regulation of peroxisome proliferator-activated receptor γ activation. J. Biol. Chem. 282, 16162–18172 [DOI] [PubMed] [Google Scholar]
- 9. Nishigaki N., Negishi M., and Ichikawa A. (1996) Two Gs-coupled prostaglandin E receptor subtypes, EP2 and EP4, differ in desensitization and sensitivity to the metabolic inactivation of the agonist. Mol. Pharmacol. 50, 1031–1037 [PubMed] [Google Scholar]
- 10. Kishore A. H., Owens D., and Word R. A. (2014) Prostaglandin E2 regulates its own inactivating enzyme, 15-PGDH, by receptor-mediated cervical cell-specific mechanisms. J. Clin. Endocrinol. Metab. 99, 1006–1018 10.1210/jc.2013-3392 [DOI] [PMC free article] [PubMed] [Google Scholar]
- 11. Fujino H., West K. A., and Regan J. W. (2002) Phosphorylation of glycogen synthase kinase-3 and stimulation of T-cell factor signaling following activation of EP2 and EP4 prostanoid receptors by prostaglandin E2. J. Biol. Chem. 277, 2614–2619 10.1074/jbc.M109440200 [DOI] [PubMed] [Google Scholar]
- 12. Yokoyama U., Iwatsubo K., Umemura M., Fujita T., and Ishikawa Y. (2013) The prostanoid EP4 receptor and its signaling pathway. Pharmacol. Rev. 65, 1010–1052 10.1124/pr.112.007195 [DOI] [PubMed] [Google Scholar]
- 13. Takafuji V., Cosme R., Lublin D., Lynch K., and Roche J. K. (2000) Prostanoid receptors in intestinal epithelium: selective expression, function, and change with inflammation. Prostaglandins Leukot. Essent. Fatty Acids 63, 223–235 10.1054/plef.2000.0144 [DOI] [PubMed] [Google Scholar]
- 14. Kabashima K., Saji T., Murata T., Nagamachi M., Matsuoka T., Segi E., Tsuboi K., Sugimoto Y., Kobayashi T., Miyachi Y., Ichikawa A., and Narumiya S. (2002) The prostaglandin receptor EP4 suppresses colitis, mucosal damage and CD4 cell activation in the gut. J. Clin. Investig. 109, 883–893 10.1172/JCI0214459 [DOI] [PMC free article] [PubMed] [Google Scholar]
- 15. van de Wetering M., Sancho E., Verweij C., de Lau W., Oving I., Hurlstone A., van der Horn K., Batlle E., Coudreuse D., Haramis A. P., Tjon-Pon-Fong M., Moerer P., van den Born M., Soete G., Pals S., et al. (2002) The β-catenin/TCF-4 complex imposes a crypt progenitor phenotype on colorectal cancer cells. Cell 111, 241–250 10.1016/S0092-8674(02)01014-0 [DOI] [PubMed] [Google Scholar]
- 16. Eisinger A. L., Prescott S. M., Jones D. A., and Stafforini D. M. (2007) The role of cyclooxygenase-2 and prostaglandins in colon cancer. Prostaglandins Other Lipid Mediat. 82, 147–154 10.1016/j.prostaglandins.2006.05.026 [DOI] [PubMed] [Google Scholar]
- 17. Yoshida K., Fujino H., Otake S., Seira N., Regan J. W., and Murayama T. (2013) Induction of cyclooxygenase-2 expression by prostaglandin E2 stimulation of the prostanoid EP4 receptor via coupling to Gαi and transactivation of the epidermal growth factor receptor in HCA-7 human colon cancer cells. Eur. J. Pharmacol. 718, 408–417 10.1016/j.ejphar.2013.08.002 [DOI] [PubMed] [Google Scholar]
- 18. Konya V., Marsche G., Schuligoi R., and Heinemann A. (2013) E-type prostanoid receptor 4 (EP4) in disease and therapy. Pharmacol. Ther. 138, 485–502 10.1016/j.pharmthera.2013.03.006 [DOI] [PMC free article] [PubMed] [Google Scholar]
- 19. Fujino H. (2016) The role of EP4 prostanoid receptors in cancer malignancy signaling. Biol. Pharm. Bull. 39, 149–155 10.1248/bpb.b15-00840 [DOI] [PubMed] [Google Scholar]
- 20. Fujino H., and Regan J. W. (2003) Prostanoid receptors and phosphatidylinositol 3-kinase: a pathway to cancer? Trends Pharmacol. Sci. 24, 335–340 10.1016/S0165-6147(03)00162-7 [DOI] [PubMed] [Google Scholar]
- 21. Aoki T., and Narumiya S. (2017) Prostaglandin E2-EP2 signaling as a node of chronic inflammation in the colon tumor microenvironment. Inflamm. Regen. 37, 4 10.1186/s41232-017-0036-7 [DOI] [PMC free article] [PubMed] [Google Scholar]
- 22. Fujino H., and Regan J. W. (2006) EP4 prostanoid receptor coupling to a pertussis toxin-sensitive inhibitory G protein. Mol. Pharmacol. 69, 5–10 10.1124/mol.105.017749 [DOI] [PubMed] [Google Scholar]
- 23. Fujino H., Xu W., and Regan J. W. (2003) Prostaglandin E2 induced functional expression of early growth response factor-1 by EP4, but not EP2, prostanoid receptors via the phosphatidylinositol 3-kinase and extracellular signal-regulated kinases. J. Biol. Chem. 278, 12151–12156 10.1074/jbc.M212665200 [DOI] [PubMed] [Google Scholar]
- 24. Kenakin T. P. (2009) A Pharmacology Primer: Theory, Applications, and Methods, 3rd Ed., pp. 43–59, Elsevier Academic Press, London, UK [Google Scholar]
- 25. Black J. W., and Leff P. (1983) Operational models of pharmacological agonism. Proc. R. Soc. B Biol. Sci. 220, 141–162 10.1098/rspb.1983.0093 [DOI] [PubMed] [Google Scholar]
- 26. Black J. W., Leff P., Shankley N. P., and Wood J. (2010) An operational model of pharmacological agonism: the effect of E/[A] curve shape on agonist dissociation constant estimation. Br. J. Pharmacol. 160, S54–S64 10.1111/j.1476-5381.2010.00855.x [DOI] [PMC free article] [PubMed] [Google Scholar]
- 27. Kenakin T., Watson C., Muniz-Medina V., Christopoulos A., and Novick S. (2012) A simple method for quantifying functional selectivity and agonist bias. ACS Chem. Neurosci. 3, 193–203 10.1021/cn200111m [DOI] [PMC free article] [PubMed] [Google Scholar]
- 28. Kenakin T., and Christopoulos A. (2013) Signalling bias in new drug discovery: detection, quantification and therapeutic impact. Nat. Rev. Drug Discov. 12, 205–216 10.1038/nrd3954 [DOI] [PubMed] [Google Scholar]
- 29. Kenakin T. (2019) Analytical pharmacology: how numbers can guide drug discovery. ACS Pharmacol. Transl. Sci. 2, 9–17 10.1021/acsptsci.8b00057 [DOI] [PMC free article] [PubMed] [Google Scholar]
- 30. Schmitt J. M., and Stork P. J. S. (2001) Cyclic AMP-mediated inhibition of cell growth requires the small G protein Rap1. Mol. Cell Biol. 21, 3671–3683 10.1128/MCB.21.11.3671-3683.2001 [DOI] [PMC free article] [PubMed] [Google Scholar]
- 31. McCubrey J. A., Steelman L. S., Chappell W. H., Abrams S. L., Wong E. W. T., Chang F., Lehmann B., Terrian D. M., Milella M., Tafuri A., Stivala F., Libra M., Basecke J., Evangelisti C., Martelli A. M., et al. (2007) Roles of the Raf/MEK/ERK pathway in cell growth, malignant transformation and drug resistance. Biochim. Biophys. Acta 1773, 1263–1284 10.1016/j.bbamcr.2006.10.001 [DOI] [PMC free article] [PubMed] [Google Scholar]
Associated Data
This section collects any data citations, data availability statements, or supplementary materials included in this article.
Data Availability Statement
For bioinformatic analysis, the University of California Santa Cruz Xena browser (RRID:SCR_018938) was used to obtain the colon and rectal cancer data of TCGA (RRID:SCR_003193). The rest of the data are contained within the article.