

Abstract
Background:
Overdose deaths increased exponentially in the United States to be the leading cause of adult injury deaths, and declining economic opportunity may contribute. To our knowledge, there has been no quantitative research into the impact of relative economic measures on overdose risk. Prior longitudinal studies on impact of socioeconomic conditions used fixed effects approaches that can result in biased estimates in the presence of time-varying confounders.
Methods:
We estimated county-level longitudinal associations between drug overdose deaths and unemployment and labor-force nonparticipation rates by gender and racial/ethnic subgroup using longitudinal g-computation and the clustered bootstrap. Results: We find evidence for associations between both overall and relative aspects of unemployment and labor-force nonparticipation and drug overdose mortality; patterns of associations differed, sometime qualitatively, across subgroups. For males across racial-ethnic groups, greater overall and relative unemployment rates were generally associated with greater overdose mortality in both the short- and long-term (e.g., for white males, increasing in the overall percentage of unemployed adults by five percentage points in 2000, 2009, and 2015 is associated with an increase of 3.2 overdose deaths (95% CI: −2.8, 14) in 2015, and increasing the ratio by 0.5 in 2000, 2009, and 2015 is associated with an increase of 9.1 overdose deaths (95% CI: 1.6, 24).
Conclusions:
These findings point to important complexity in how the economic and contextual landscape differentially shapes overdose risks, underscoring a need for increased understanding of the mechanisms operating for women and minority groups.
Keywords: substance misuse, overdose, unemployment, labor force, longitudinal g-computation
Introduction
Drug overdose deaths in the United States (US) have increased exponentially over the past several decades (1) and are now the leading cause of injury death among adults (2).There are multiple subepidemics contributing to this overall surge, with heterogeneities in terms of demographic subgroup [e.g., gender (3), race/ethnicity (4), region (5–8), and substance involved (1, 9, 10)], with overdoses involving opioids being the major contributing factor (9).
Declining economic opportunity, especially for those with less than a college degree, has been implicated in fueling the epidemic (1, 5, 6, 11–15). Unemployment and labor-force nonparticipation are two measures of economic opportunity. Higher unemployment rates have been associated with increased psychological distress, opioid prescribing, misuse, emergency room visits and hospitalizations, and overdose mortality. This is in contrast to a body of literature that has found that aggregate studies, counter to expectation, find health and longevity improve during recessions and worsen during periods of economic expansion (16), a finding that has been replicated across numerous high-income countries. However, recent studies have failed to replicate this procyclical relationship in the US during the 21st century, likely due to the US’s rapidly changing relationship with prescription opioids (17). Countercyclical patterns were most pronounced for drug poisonings, which were predominantly concentrated among males and persons less than 45 years old, similar to the recent spike in mortality rates among less educated middle-aged non-Hispanic Whites previously documented by Case and Deaton (18).
To be counted as unemployed, an individual must have actively searched for a job within the past 4 weeks (19). However, many others may desire work, but have stopped actively searching due to an inability to find work and/or a belief that no work is available (20). Thus, the unemployment rate does not fully capture those who desire jobs but are job-less. Consequently, we also examine labor-force nonparticipation to capture adults who have given up on finding a job—”discouraged workers”(20)—and those who have been pushed into early retirement (21), back to school (21, 22), or onto disability (21, 23) because of poor economic opportunities. Each of the aforementioned subgroups comprising those out of the labor force increased substantially since the early 2000s (24). Disconnection from work may have widespread potential consequences at the individual, household, and societal levels, including losses of structure/organization, self-efficacy, emotional well-being, accomplishment, and social connectedness (5, 6, 13, 21, 25), which may ultimately be detrimental to mental health and increase substance use (5, 11, 26).
Although linking economic factors (e.g., unemployment, poverty, housing prices, income) to drug overdose is a burgeoning area of research (1, 5–8, 11–15, 27, 28), several gaps persist. First, to better characterize the subepidemics, there is a need to examine how the economy may affect drug overdose deaths across gender and racial/ethnic subgroups. In contrast, most previous studies (though there are important exceptions (e.g., 27, 29)) examine associations adjusting for sex and/or race/ethnicity (5, 8, 13). Such a strategy assumes a common relationship across groups, which may obscure the heterogeneous subgroup-specific associations that prior sociological and demographic research suggests (12). Second, economic factors in relation to overdose have largely been examined in terms of their overall levels; therefore, how one demographic group’s economic prospects compares relative to another’s has not been quantitatively tested, despite receiving high-profile attention in the sociology literature (30, 31) and popular press (e.g., 32). Examination of the extent to which relative economic position contributes to overdose mortality over and above overall economic conditions has roots in the relative deprivation literature (e.g., 33) and social status gradient literature (e.g., 31, 34). For example, applying these literature bases informs our hypothesis that higher relative unemployment for a particular subgroup would act to increase that subgroup’s overdose mortality rate, over and above the contribution of that subgroup’s overall unemployment rate. Third, most longitudinal research has used fixed effects approaches (e.g., 7, 13, 27), which can lead to biased estimation when the effect of an earlier exposure on an outcome operates through time-varying confounders (including prior outcomes) affected by the earlier exposure (35, 36) (see the Statistical Analysis subsection for additional discussion and figure).
We estimate county-level longitudinal associations between drug overdose mortality and the overall and relative contributions of two economic factors—unemployment and labor-force nonparticipation rates—addressing the aforementioned research gaps. The overall economic measures include the county average as well as the subgroup-specific average. The relative economic measure is the ratio of the subgroup-specific economic measure over the county average. We estimate associations separately by gender (male, female) and race/ethnicity (white, Black, and Hispanic/Latino) subgroup. Finally, in estimating these associations, we utilize longitudinal g-computation, an analytic method that allows for un-biased estimates of longitudinal effects in the presence of time-varying confounders affected by prior exposure (35).
Methods
Data and sample
We used US county-level data 2000–2015 from the Centers of Disease Control and Prevention (CDC) (37), Census, American Community Survey (ACS), and Geolytics. Alaska was excluded due to county boundary changes during this period. For each demographic subgroup (e.g., Black women), we restricted to counties with more than 5,000 individuals in that subgroup to increase the likelihood for an expected number of overdose deaths greater than zero (38). We further restricted to counties with evidence of economic constraint, because of sociologic theory positing that alienation may grow in the presence of scarcity (30). For the unemployment analytic sample, we restricted to counties with > 4.9% of unemployed adults, N=1701 counties (out of a total of 3109). For the labor force analytic sample, we restricted to counties with >33% of adults out of the labor force, N=2659. The Table gives the sample sizes by economic measure and demographic subgroup. In addition to adhering to our theoretical model, restricting to counties with unemployment and labor-force nonparticipation greater than 4.9% and 33%, respectively, resulted in a linear relationship between each economic measure and the outcome. However, such restriction limits generalizability, so we show results of a sensitivity analysis where we do not make this restriction in Section 5 of the eAppendix. Results were similar. In a related sensitivity analysis in Section 6 in the eAppendix, we restricted to a common set of N=197 counties. An interactive map of the counties included in each sample is available: https://smirniotis.shinyapps.io/sampledcounties/. Institutional Review Boards at University of California, Davis, Columbia University, and New York University Langone Health reviewed and approved the study.
Table.
Analytic county sample sizes by subgroup and economic measure.
| Subgroup (> 5000) | Unemployment (> 4.9%, N=1701) | Labor-force nonparticipation (> 33%, N=2659) |
|---|---|---|
| White men | 1243 | 1837 |
| White women | 1239 | 1843 |
| Black men | 290 | 425 |
| Black women | 290 | 425 |
| Hispanic/Latino men | 243 | 307 |
| Hispanic/Latina women | 230 | 343 |
Measures
Our first exposure is what is commonly referred to as unemployment rate (though not actually a rate), defined as the percentage of those in the labor force 16 years or older who had no employment in the current week and who were actively looking for work during the previous 4 weeks (19). The relative version of this measure is the unemployment rate in each subgroup over the overall unemployment rate for each county. This ratio serves as one operationalization of a subgroup potentially feeling as though they are falling behind when compared to their community as a whole. In conjunction with that ratio, we also were interested in the overall unemployment rate and the interaction between the ratio and overall rate, which equals the subgroup-specific unemployment rate. Data were obtained from ACS 5-year estimates for 2009 (i.e., 2005–2009) and 2015 (i.e. 2011–2015), and from the Census for 2000. The Bureau of Labor Statistics would be another data source for these measures but are not available within gender–racial/ethnic subgroups. Our second exposure is labor-force nonparticipation rate, defined as the percentage of those 16 years or older who are not working and not looking for work (19). The relative and overall versions of this measure are analogous to those for unemployment rate. One may also consider the exposure of how one subgroup’s economic status compares to the county average on the additive scale. We describe and show results of this sensitivity analysis in Section 7 of the eAppendix. The resulting estimates follow a similar pattern as seen in the main results.
Our outcome was the drug overdose mortality rate in 2015 by county calculated as the number of drug overdose deaths for each gender-race/ethnicity subgroup using the total county population of that subgroup as an offset. We included the drug overdose mortality rates in 2000 and 2009 as time-varying covariates (see below). We identified deaths from overdoses using the International Statistical Classification of Diseases and Related Health Problems, Tenth Revision (ICD-10); see the eAppendix for details. We included all drug overdoses regardless of intent to avoid misclassification of intent across counties and over time. However, we include a sensitivity analysis where we restrict to only unintentional overdoses in Section 8 of the eAppendix and find similar results. Note that we do not include alcohol-alone overdoses.
We included a number of time-varying covariates: 1) percentage of the county population in the racial/ethnic subgroup used in the analytic sample, 2) percentage of the population in the gender subgroup used in the analytic sample, 3) percentage of the population aged 0–19 years and 4) > 64 years, 5) ratio of the 0–19 year percentage and 6) >64 year percentage for the gender-race/ethnicity subgroup to overall percentage. In a sensitivity analysis, we stratified on urbanicity (Section 9 of the eAppendix). These covariates were obtained from the Census (2000) and ACS 5-year estimates (2009, 2015). As noted above, we also include drug overdose deaths in 2000 and 2009 as time-varying covariates, as is standard (39).
Statistical analysis
We estimate the association of each exposure—e.g., the out-of-labor-force ratio and overall out-of-labor-force percentage—with drug overdose mortality in the population in 2015. We make these estimates at two different timescales. For the first, “acute” timescale, we compare counterfactual outcomes if the exposures had been greater by an amount δ only in 2015 versus not. Formally, E(Ya2000,a2009,a2015+δ)−E(Ya2000,a2009,a2015), where a indicates the observed value of the exposure and numbers indicate years—e.g., a2015 is the observed value of A in 2015 for county i—and where Ya2015 is the counterfactual Y under the exposure being set to its observed value in 2015; similarly, Ya2015+δ is the counterfactual Y if the exposure value in 2015 had been an amount δ greater than its observed value. In this “acute” case, the exposure is greater by δ only in year 2015. In the second, “cumulative” timescale, we compare counterfactual outcomes if the exposures had been greater by an amount δ in 2000, 2009, and 2015 versus not: E(Ya2000+δ,a2009+ ,a2015+δ)−E(Ya2000,a2009,a2015). We set δ = 0.5 and δ = 5% for unemployment ratio and overall unemployment rate, respectively, which both correspond to approximately a 1 standard deviation increase. Estimating the association of greater ratios with overdose deaths while holding the overall rate constant is equivalent to estimating the association of greater subgroup-level unemployment rates with overdose deaths but leaving the overall rate unchanged. We also compare counterfactual outcomes if the overall rate were greater by δ, holding the ratio constant. We set δ = 5% for both the relative and overall labor-force nonparticipation measures, which correspond to approximately a 0.8 standard deviation increase.
For each gender–racial/ethnic subgroup and for each timescale, we estimated associations using longitudinal g-computation (40). This estimator relies on the sequential randomization assumption that at each timepoint, the exposure is independent of potential outcomes given past history (41) as well as the typical causal inference assumptions of positivity and noninterference as well as the consistency rule that states using the notation above, with L representing covariates (42). Of note, this analysis appropriately addresses time-varying covariates aėcted by prior exposure (35). Figure 1 highlights the pathway estimated in the cumulative timescale analysis. This pathway is contrasted with the pathway that would be estimated by a fixed effects analysis in eFigure 1.
Figure 1:
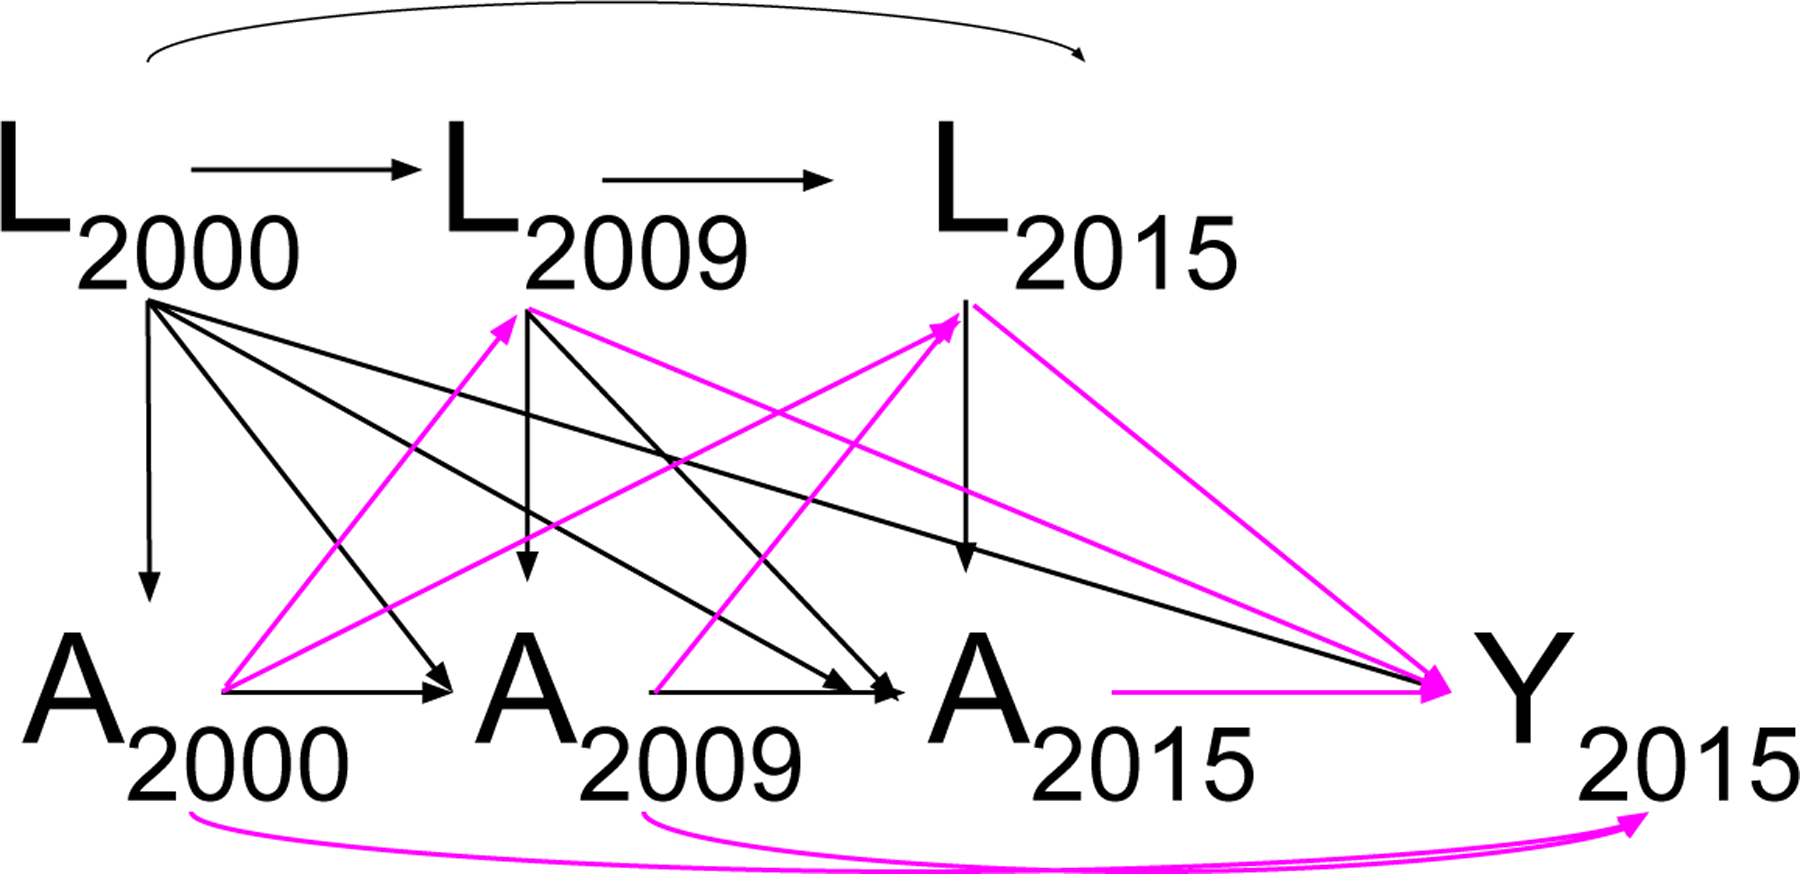
Directed acyclic graph (DAG) with the path estimated by the analysis highlighted. A denotes exposure variables; L denotes time-varying covariates, which include confounders and intermediate variables such as the outcome in years 2000 and 2009; Y denotes the outcome in 2015.
We modeled the the count of overdose deaths per county for the specific gender– racial/ethnic subgroup using a negative binomial model with the log of the county’s population of the specific gender–racial/ethnic subgroup as the offset. Various checks for model fit indicated the negative binomial distribution fit the data well. We calculated 95% confidence intervals from 1,000 clustered bootstrapped samples, where we used the bias corrected accelerated bootstrap (43) with counties clustered in states.
Results
We show characteristics of analytic samples used in this analysis in eTable 1. Of the counties included in these analytic samples, many were in the South, e.g., 72% for the Black male sample and 48% the Hispanic/Latino male sample. One clear difference across samples was urbanicity; half of all counties in the white male sample were fully rural whereas none of the counties for Hispanic/Latino males were fully rural. Black and Hispanic/Latino samples included higher proportions in larger metropolitan areas and higher population densities. Remaining characteristics were generally similar (eTable 1).
Figure 2 shows the estimated same-year associations between overall and relative unemployment and labor-force nonparticipation and overdose mortality for each gender–racial/ethnic subgroup, and Figure 3 shows the corresponding cumulative, 15-year estimated associations. Complete tables of results are given in eTables 2 and 3.
Figure 2:
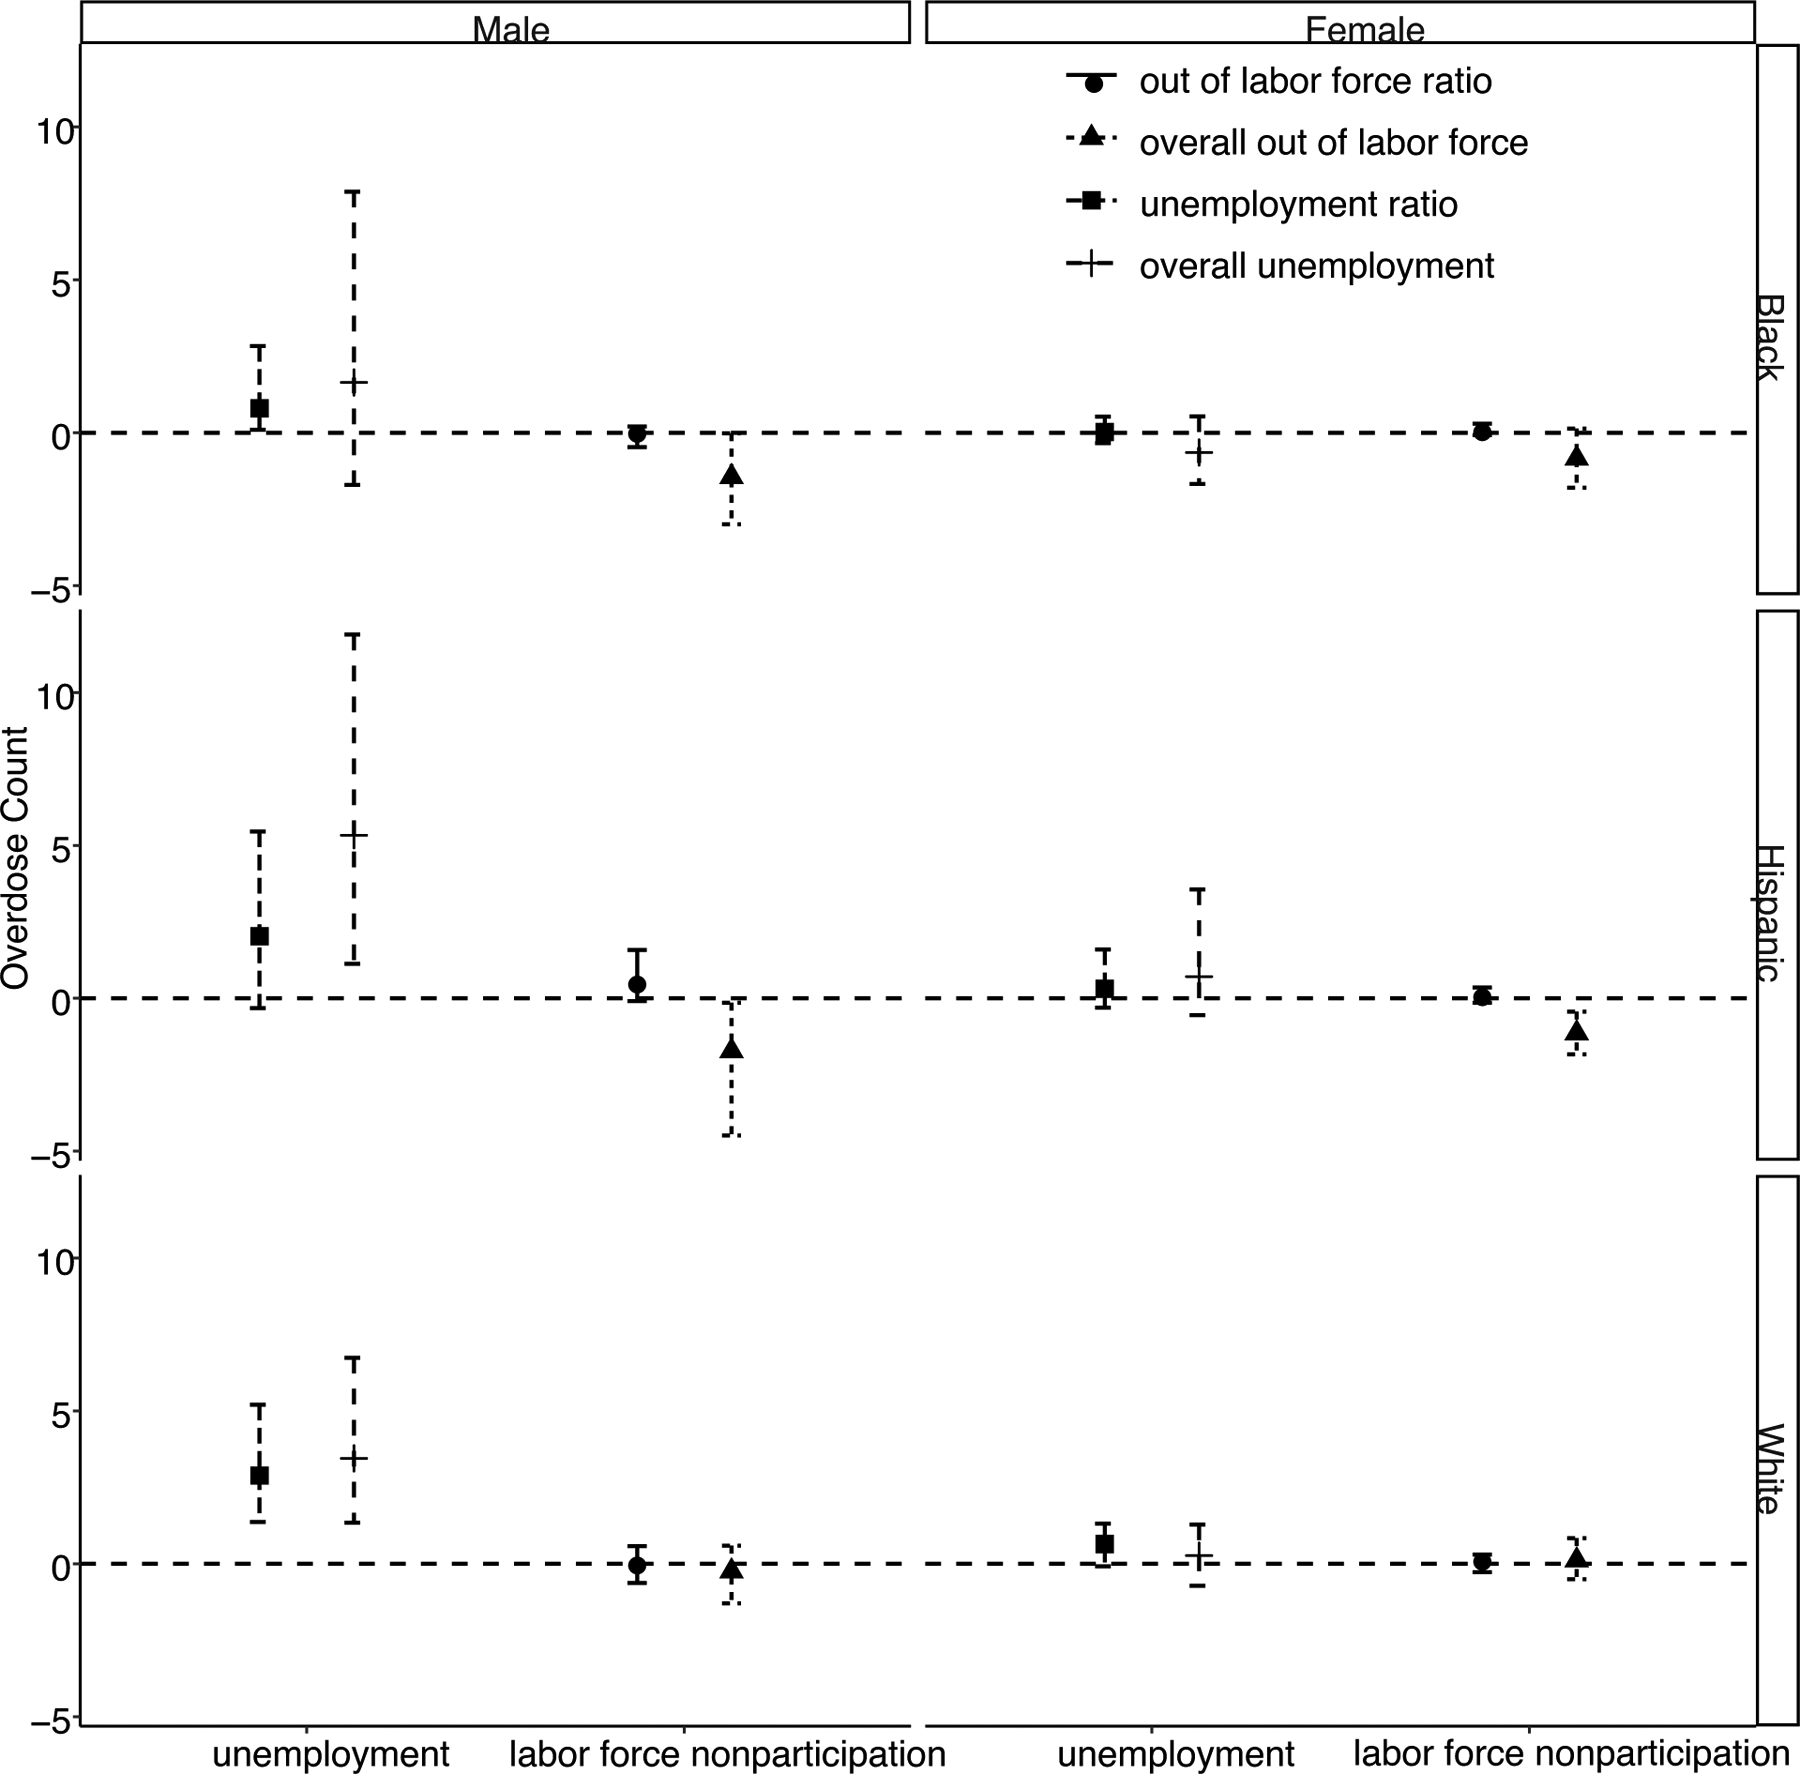
Acute, same-year effects of overall and relative unemployment and labor-force nonparticipation on overdose mortality by subgroup at the county level.
Figure 3:
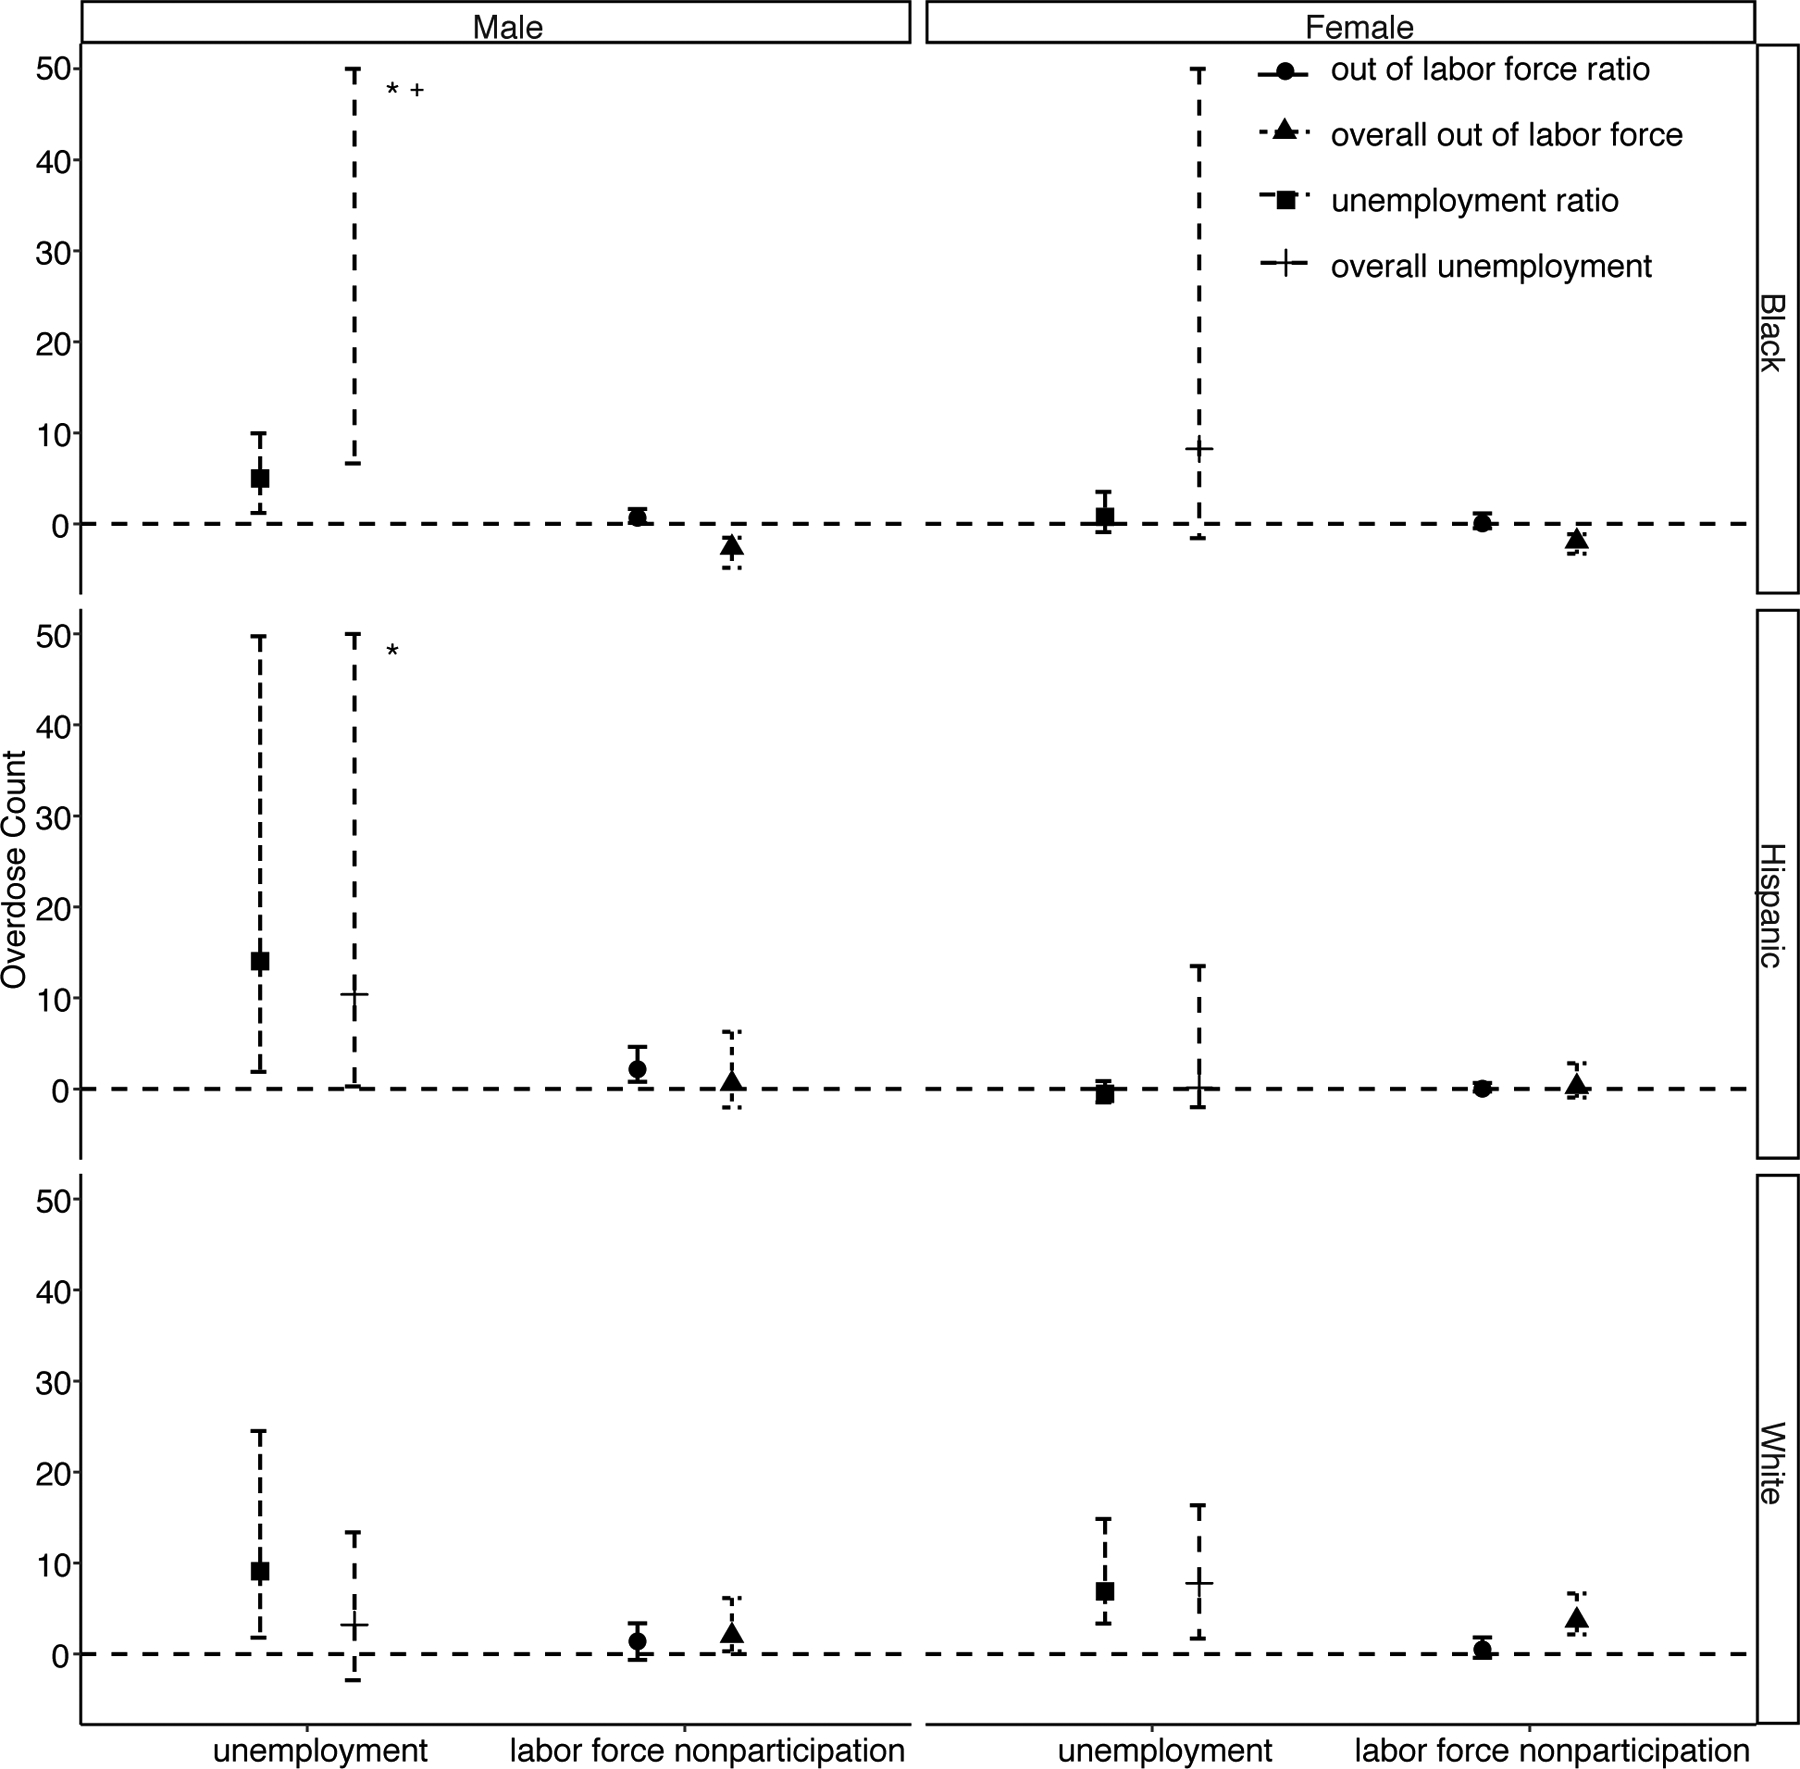
Cumulative, 15-year effects of overall and relative unemployment and labor-force nonparticipation on overdose mortality by subgroup at the county level.
* Denotes where the confidence bound extends beyond the y-axis maximum.
+ Denotes where the point estimate and confidence bound extend beyond the y-axis maximum.
Figures 2 and 3 demonstrate that, for males, across racial-ethnic groups, greater overall and relative unemployment rates are generally associated with greater overdose mortality in both the short- and long-term. However, confidence intervals for the cumulative 15-year associations for Black and Hispanic/Latino men are extremely wide, due in part to smaller sample sizes for these subgroups. Taking the subgroup of white males as an example, increasing in the overall percentage of unemployed adults by five percentage points in 2000, 2009, and 2015 is associated with an increase of 3.2 overdose deaths (95% CI: −2.8, 14) in this subgroup in 2015. Increasing the ratio comparing the proportion of unemployed white men relative to the overall proportion unemployed in the county by 0.5 in 2000, 2009, and 2015 is associated with an increase of 9.1 overdose deaths (95% CI: 1.6, 24) in this subgroup in 2015, holding the overall proportion unemployed constant.
For women, associations between unemployment and overdose are generally absent in the short-term. However, in the long-term, cumulative increases in unemployment rates are associated with increased overdose mortality rates for white and Black women; for Hispanic/Latina women, the associations continue to be null.
Associations between labor-force nonparticipation and overdose mortality demon-strates a different pattern across subgroups. When unemployment was the exposure, differences were most pronounced between genders. In contrast, when labor-force nonparticipation is the exposure, differences are most pronounced across race/ethnicity.
White men and women demonstrate similar associations; overall and relative labor-force nonparticipation rates were not associated with greater overdose mortality in the short-term. Over the 15-year period, greater overall labor-force nonparticipation was associated with increased overdose mortality for both white men and women. For example, for white women, increasing the overall percentage out of the labor force by five percentage points in 2000, 2009, and 2015 is associated with an increase of 3.7 overdose deaths (95% CI: 2.1, 6.2). For men, greater relative labor-force nonparticipation was also associated with increased overdose mortality (a 0.05 increase was associated with 1.4 additional overdose deaths (95% CI: −0.7, 3.3)), though this was not true for women.
For Black men and women subgroups, in the short term, there is no association between relative labor-force nonparticipation and an inverse relationship between overall labor-force nonparticipation and overdose mortality. Over the longer, 15-year term, the inverse relation between overall labor-force nonparticipation and overdose mortality strengthens, and greater levels of Black men out of the labor force relative to the overall out-of-labor-force rate is associated with increased overdose mortality (0.7, 95% CI: 0.1, 1.5).
Similarly, for Hispanic/Latino men and women, in the short term there is an inverse relationship between overall labor-force nonparticipation and overdose mortality. Over the longer, 15-year term, there is no association between overall labor-force nonparticipation and overdose mortality. For Hispanic/Latino men but not women, greater labor-force nonparticipation among Hispanic/Latino males relative to average nonparticipation in the county is associated with greater overdose mortality in that subgroup in both the short and long terms (cumulative estimate of 2.2, 95%CI: 0.7, 4.4).
Discussion
We found evidence for associations between aspects of economic opportunity, including previously unexamined relative factors (e.g., subgroup-specific relative unemployment and labor-force nonparticipation), and drug overdose mortality at the county level, though the pattern of associations differed, sometimes qualitatively, across subgroups.
We found overall and relative unemployment rates to be associated with increases in overdose deaths in the short- and long-term for men, only over the long-term for Black and white women, and not associated with overdose for Hispanic/Latina women. This is generally aligned with previous research linking higher unemployment rates to increased overall rates of illegal drug use (see (28) for a review), overdose emergency department visits (27), and drug overdose deaths (7). For example, Ghertner et al., 2018(7) found that a 1% increase in the US county-level unemployment rate was associated with a 4.6% increase in the overdose death rate using 2006–2016 data.
Labor-force nonparticipation may be an important companion measure to unemployment as it captures workers who are discouraged, or for whom poor economic prospects have pushed them into early retirement, onto disability, or back to school (21). There is less research linking labor-force participation and overdose. The available evidence suggests an association between increased nonparticipation and higher rates of opioid prescribing (21), and between greater overdose mortality and increases in a combined measure of unemployment and nonparticipation (7). Aligned with this previous work, we found that overall county-level nonparticipation rates were associated with greater overdose deaths in the long-term for white adults. However, contrary to our hypothesis and previous work, overall nonparticipation was associated with decreased overdose deaths for Black and Hispanic/Latino adults in the short-term and with decreased overdose deaths for Black adults in the long-term. We examine potential reasons for this below. The subgroup-specific relative measures of nonparticipation were associated with increased overdose mortality for men but not women in the long-term, suggesting that the relative status associated with participating in the labor-force may be protective for men but that the same mechanism may not apply for women, possibly due to historical gender roles in which women more commonly report not working outside the home (44).
The unexpected associations between greater labor-force nonparticipation rates and decreased overdose mortality for Black adults in the short and long term and for Hispanic/Latino adults in the short term was unexpected and motivated post-hoc sensitivity analyses. In the first of these sensitivity analyses, we restricted to a common set of N=197 counties across all subgroups (i.e., counties with > 33% out of the labor-force and > 5000 residents in each demographic subgroup), to test the hypothesis that differences were due to disparate sets of counties being used for the subgroup analyses with differential distributions of county characteristics that modified effects. eTable 4 shows the results of this sensitivity analysis. Confidence intervals are very wide, owing to the smaller number of counties. However, point estimates follow a similar pattern as the primary analysis, suggesting that different sets of counties are not responsible for the inverse relationship among Black and Hispanic/Latino adults. This is also corroborated by a related sensitivity analysis in which we stratified by urbanicity. The results of this are presented in eTable 5. As estimates did not differ greatly across urbanicity, we conclude that our measure of urbanicity, albeit crude, was likely not a strong modifying factor.
Generally, the contrasting results between unemployment and labor-force nonparticipation for minority subgroups suggests that labor-force nonparticipation may not represent the same set of economic conditions for Black and Hispanic/Latino adults as for white adults. The similar pattern of results for white adults between unemployment and nonparticipation provides some evidence that rising rates of each may correlate with a constrained economic climate. However, labor-force nonparticipation may be not positively correlated with or may even be negatively correlated with a constrained economic climate for Black and Hispanic/Latino adults. Existing research is limited (45) but suggests several possible contributing factors. First, labor-force nonparticipation is more likely to be involuntary among women and minorities (46), and persistent nonparticipation may be in part due to lower social capital (47). Although the incarcerated population is not included in the economic measures we considered, having a previous conviction, which is more common among Black men, is associated with decreased labor-force participation (48) and is also associated with increased drug overdose mortality (15). Thus, current and past incarceration could represent important censoring and intermediate variables, respectively. For women, differences in marriage rates among race/ethnicity (eTable 1) could be a contributing factor, as single women with children typically have more financial incentives to work than married women with children (49). Together, these points suggest several possible explanations. First, minority adults with poor economic prospects may be more likely to have periods of unemployment but remain in the labor force as compared to white adults with similarly poor economic prospects who may be more likely to exit the labor force via early retirement, school, or disability. Minority adults may be less likely to exit the labor force voluntarily under similarly poor economic conditions fearing difficultly in rejoining the labor force and due to economic necessity. Second, minority adults with poor economic prospects are also more likely to be incarcerated than similar white adults, and being incarcerated may be related to decreased overdose mortality, thus contributing to an inverse overall association. Third, differential censoring by incarceration status by race could bias estimates. Analyses using individual-level data to quantify these contributions is an area for future work.
This study has several key limitations. First, restricting to counties with large enough subgroup population sizes to expect an overdose fatality was important to reduce noise but came at the price of reduced power and generalizability. Second, previous demographic research has found that economic drivers of the overdose epidemic may be particularly relevant for those with less than a college degree (5, 12, 31). We requested but were unable to obtain data by gender-race/ethnicity-education level subgroups.
Third, interference (50) is likely present, as the economic climate of one county may influence the potential overdose mortality rate in a nearby county, which may bias estimates. Previous research into the contextual drivers of overdose has, to our knowledge, largely ignored this issue, though there are exceptions (8). That strategy may be reasonable, as counties are large geographic measures and nearly three-quarters of US workers do not travel outside their counties of residence to work, with an average one-way commuting time of 26.4 minutes (51). However, we believe that quantifying potential biases due to interference is an important area for future work. Though there exist a few sensitivity analyses to quantify such bias (52), they have not been extended to accommodate longitudinal data. We show preliminary results from such an extension in Section 10 of the eAppendix (eFigures 8 and 9) for the white male subgroup, given that it has the largest sample size. Results for unemployment are similar modeling versus not modeling interference (eFigure 8). However, results for labor-force nonparticipation differ slightly (eFigure 9). More work is needed to identify the best approach for addressing interference for this research question.
Finally, the estimands we estimate do not correspond to a well-defined intervention. Thus, this work cannot directly inform policy decisions or priorities today. However, we agree with others (e.g., 42, 53–55) that one can nonetheless have a well-defined and identified estimand even without a well-defined intervention. Such estimands contribute to scientific understanding;(53) in this case, evidence supporting a causal relationship between economic conditions and drug overdose mortality. We acknowledge, though, that others have a different perspective, believing that effects are worth estimating if they correspond to an experiment that could be implemented today (e.g., 56, 57).
In addition to interference, because the counties in our analysis are not independent and identically distributed, standard errors may be too narrow and incorrect inference may result. To our knowledge, this is rarely addressed in previous research (see again (8) for an exception). We partially addressed this issue by performing a clustered bootstrap with states serving as the clusters, though this approach is imperfect.
Another analytic strength of this study is our use of longitudinal g-computation (40) to appropriately adjust for time-varying confounding variables affected by prior exposure. Previous analytic approaches utilizing longitudinal panel data such as these have controlled for the time-varying confounders by including them as covariates in an outcome regression model with year fixed effects (e.g., 7, 13, 27). However, this strategy would not allow the effects of A2000 and A2009 to operate through L2009 and L2015, resulting in biased estimates for our cumulative, long-term exposure associations.
We also examined relative economic measures, relating one demographic subgroup’s economic prospects to the average for the county, which have not been previously quantitatively studied in relation to drug overdose or overdose deaths. This provides for the first time a quantitative examination of the elements of status and alienation that qualitative research has identified as potential drivers of the overdose epidemic (6, 11) and incorporates the relative deprivation and social status literature bases (e.g., 33). We believe this may provide a more complete picture of how the contextual, economic environment may influence overdose. For example, we may increase predictive power of recent model-building approaches to predict overdose hotspots (58) by incorporating the relative measures we examined herein.
Last, we examined gender-race/ethnicity subgroups that have received far less attention in the current growth of overdose and opioid research. Our findings of quantitative and qualitative differences across subgroups point to important heterogeneity and complexity in how the economic and contextual landscape differentially shapes overdose risks. Thus, far from supporting the current focus on the white male subgroup, this research underscores a current lack of understanding of the mechanisms operating for women and minority groups and suggests more research focused on these subgroups is warranted.
Supplementary Material
Sources of financial support:
This work was supported by the National Institute on Drug Abuse (R00DA042127; PI Rudolph and R01DA039962; PI: Cerda).
Footnotes
Conflicts of interest: None declared.
Replication: Computing code to replicate analyses is available https://github.com/kararudolph/code-for-papers/releconomyoverdose.R. Exposure and covariate data are publicly available through the sources cited in the manuscript. Outcome data are available upon application from the U.S. Centers for Disease Control and Prevention.
References
- [1].Jalal H, Buchanich JM, Roberts MS, et al. , Changing dynamics of the drug overdose epidemic in the united states from 1979 through 2016. Science 2018;361(6408):eaau1184. [DOI] [PMC free article] [PubMed] [Google Scholar]
- [2].Centers for Disease Control and Prevention, Ten Leading Causes of Injury Deaths by Age Group Highlighting Unintentional Injury Deaths, United States - 2017. https://www.cdc.gov/injury/images/lc-charts/leading_causes_of_death_by_age_group_unintentional_2017_1100w850h.jpg, 2019.
- [3].Mazure CM, Fiellin DA, Women and opioids: something different is happening here. The Lancet 2018;392(10141):9–11. [DOI] [PubMed] [Google Scholar]
- [4].Alexander MJ, Kiang MV, Barbieri M, Trends in black and white opioid mortality in the united states, 1979–2015. Epidemiology (Cambridge, Mass) 2018;29(5):707. [DOI] [PMC free article] [PubMed] [Google Scholar]
- [5].Monnat SM, Factors associated with county-level differences in us drug-related mortality rates. American journal of preventive medicine 2018;54(5):611–619. [DOI] [PMC free article] [PubMed] [Google Scholar]
- [6].McLean K, “there’s nothing here”: Deindustrialization as risk environment for overdose. International Journal of Drug Policy 2016;29:19–26. [DOI] [PubMed] [Google Scholar]
- [7].Ghertner Robin and Groves Lincoln, The opioid crisis and economic opportunity: geographic and economic trends. https://aspe.hhs.gov/system/files/pdf/259261/ASPEEconomicOpportunityOpioidCrisis.pdf, 2018.
- [8].Pear VA, Ponicki WR, Gaidus A, et al. , Urban-rural variation in the socioeconomic determinants of opioid overdose. Drug and alcohol dependence 2019;195:66–73. [DOI] [PMC free article] [PubMed] [Google Scholar]
- [9].Scholl L, Seth P, Kariisa M, et al. , Drug and opioid-involved overdose deaths—united states, 2013–2017. Morbidity and Mortality Weekly Report 2019;67(5152):1419. [DOI] [PMC free article] [PubMed] [Google Scholar]
- [10].Ciccarone D, The triple wave epidemic: supply and demand drivers of the us opioid overdose crisis. International journal on drug policy 2019;. [DOI] [PMC free article] [PubMed] [Google Scholar]
- [11].Dasgupta N, Beletsky L, Ciccarone D, Opioid crisis: No easy fix to its social and economic determinants. American journal of public health 2018;108(2):182–186. [DOI] [PMC free article] [PubMed] [Google Scholar]
- [12].Case A, Deaton A, Rising morbidity and mortality in midlife among white non-hispanic americans in the 21st century. Proceedings of the National Academy of Sciences 2015; 112(49):15078–15083. [DOI] [PMC free article] [PubMed] [Google Scholar]
- [13].Zoorob MJ, Salemi JL, Bowling alone, dying together: the role of social capital in mitigating the drug overdose epidemic in the united states. Drug and alcohol dependence 2017;173:1–9. [DOI] [PubMed] [Google Scholar]
- [14].Dean A, Kimmel S, Free trade and opioid overdose death in the united states. SSM-Population Health 2019;100409. [DOI] [PMC free article] [PubMed] [Google Scholar]
- [15].Nosrati E, Kang-Brown J, Ash M, et al. , Economic decline, incarceration, and mortality from drug use disorders in the usa between 1983 and 2014: an observational analysis. The Lancet Public Health 2019;4(7):e326–e333. [DOI] [PubMed] [Google Scholar]
- [16].Ruhm CJ, Are recessions good for your health? The Quarterly journal of economics 2000;115(2):617–650. [Google Scholar]
- [17].Gordon SH, Sommers BD, Recessions, poverty, and mortality in the united states: 1993–2012. American Journal of Health Economics 2016;2(4):489–510. [Google Scholar]
- [18].Ruhm CJ, Recessions, healthy no more? Journal of health economics 2015;42:17–28. [DOI] [PubMed] [Google Scholar]
- [19].of Labor Statistics B, Glossary. 2016, URL https://www.bls.gov/bls/glossary.htm.
- [20].Cohany S, Ranks of discouraged workers and other marginally attached to the labor force rise during recession. Issues in labor statistics 2009;Summary 09–04. [Google Scholar]
- [21].Krueger AB, Where have all the workers gone? an inquiry into the decline of the us labor force participation rate. Brookings papers on economic activity 2017;2017(2):1. [DOI] [PMC free article] [PubMed] [Google Scholar]
- [22].Bureau of Labor Statistics, Labor force statistics from the current population survey: How the government measures unemployment. https://www.bls.gov/cps/cps_htgm.htm, 2015.
- [23].Bureau of Labor Statistics, Persons with a disability: Labor force characteristics summary. https://www.bls.gov/news.release/disabl.nr0.htm, 2019.
- [24].Hipple SF, People who are not in the labor force: why aren’t they working? Beyond the Numbers: Employment Unemployment 2015;4(15), URL https://www.bls.gov/opub/btn/volume-4/people-who-are-not-in-the-labor-force-why-arent-they-working.htm. [Google Scholar]
- [25].Wilson WJ, When work disappears: The world of the new urban poor, Vintage2011. [Google Scholar]
- [26].Monnat SM, Deaths of despair and support for trump in the 2016 presidential election. Pennsylvania State University Department of Agricultural Economics Research Brief 2016;5. [Google Scholar]
- [27].Hollingsworth A, Ruhm CJ, Simon K, Macroeconomic conditions and opioid abuse. Journal of health economics 2017;56:222–233. [DOI] [PubMed] [Google Scholar]
- [28].Nagelhout GE, Hummel K, de Goeij MC, et al. , How economic recessions and unemployment affect illegal drug use: a systematic realist literature review. International Journal of Drug Policy 2017;44:69–83. [DOI] [PubMed] [Google Scholar]
- [29].Knapp EA, Bilal U, Dean LT, et al. , Economic insecurity and deaths of despair in us counties. American Journal of Epidemiology 2019;. [DOI] [PMC free article] [PubMed] [Google Scholar]
- [30].Hochschild AR, Strangers in their own land: Anger and mourning on the American right, The New Press2018. [Google Scholar]
- [31].Ho JY, The contribution of drug overdose to educational gradients in life expectancy in the united states, 1992–2011. Demography 2017;54(3):1175–1202. [DOI] [PMC free article] [PubMed] [Google Scholar]
- [32].Bebinger M, Opioid addiction drug going mostly to whites, even as black death rate rises. NPR 2019;URL https://www.npr.org/sections/health-shots/2019/05/08/721447601/addiction-medicine-mostly-prescribed-to-whites-even-as-opioid-deaths-rose-in-bla. [Google Scholar]
- [33].Subramanyam M, Kawachi I, Berkman L, et al. , Relative deprivation in income and self-rated health in the united states. Social Science & Medicine 2009;69(3):327–334. [DOI] [PubMed] [Google Scholar]
- [34].Adler NE, Boyce T, Chesney MA, et al. , Socioeconomic status and health: the challenge of the gradient. American psychologist 1994;49(1):15. [DOI] [PubMed] [Google Scholar]
- [35].Daniel RM, Cousens S, De Stavola B, et al. , Methods for dealing with time-dependent confounding. Statistics in medicine 2013;32(9):1584–1618. [DOI] [PubMed] [Google Scholar]
- [36].Imai K, Kim IS, When should we use unit fixed effects regression models for causal inference with longitudinal data? American Journal of Political Science 2019;63(2):467–490. [Google Scholar]
- [37].Centers for Disease Control and Prevention, Wide-ranging online data for epidemiologic research. https://wonder.cdc.gov/, 2019. [Google Scholar]
- [38].Hedegaard H, Warner M, Miniño A, Drug overdose deaths in the united states, 1999–2016. NCHS data brief 2017;(294):1. [PubMed] [Google Scholar]
- [39].Lendle S, Schwab J, Petersen ML, et al. , ltmle: an r package implementing targeted minimum loss-based estimation for longitudinal data. J Stat Softw 2017;81(1):1–21. [Google Scholar]
- [40].Gill RD, Robins JM, Causal inference for complex longitudinal data: the continuous case. Annals of Statistics 2001;1785–1811. [Google Scholar]
- [41].Robins JM, Optimal structural nested models for optimal sequential decisions. In: Proceedings of the second seattle Symposium in Biostatistics, Springer2004 189–326. [Google Scholar]
- [42].Pearl J, On the consistency rule in causal inference: axiom, definition, assumption, or theorem? Epidemiology 2010;21(6):872–875. [DOI] [PubMed] [Google Scholar]
- [43].Efron B, Better bootstrap confidence intervals. Journal of the American statistical Association 1987;82(397):171–185. [Google Scholar]
- [44].Chamie Joseph, Despite growing gender equality, more women stay at home than men. https://yaleglobal.yale.edu/content/despite-growing-gender-equality-more-women-stay-home-men, 2018.
- [45].Netherland J, Hansen H, White opioids: Pharmaceutical race and the war on drugs that wasn’t. BioSocieties 2017;12(2):217–238. [DOI] [PMC free article] [PubMed] [Google Scholar]
- [46].Flippen C, Tienda M, et al. , Pathways to retirement: Patterns of labor force participation and labor market exit among the pre-retirement population by race, hispanic origin, and sex. Journals of Gerontology series b 2000;55(1):S14–S27. [DOI] [PubMed] [Google Scholar]
- [47].Browne I, Explaining the black-white gap in labor force participation among women heading households. American Sociological Review 1997;236–252. [Google Scholar]
- [48].Dotsey M, Fujita S, Rudanko L, et al. , Where is everybody? the shrinking labor force participation rate. Economic Insights 2017;2(4):17–24. [Google Scholar]
- [49].Ho˙man SD, The changing impact of marriage and children on women’s labor force participation. Monthly Lab Rev 2009;132:3. [Google Scholar]
- [50].Tchetgen EJT, VanderWeele TJ, On causal inference in the presence of interference. Statistical methods in medical research 2012;21(1):55–75. [DOI] [PMC free article] [PubMed] [Google Scholar]
- [51].American Community Survey 5 year estimates, Table S0801: Communiting characteristics by sex. https://factfinder.census.gov/, 2017.
- [52].VanderWeele TJ, Tchetgen EJT, Halloran ME, Interference and sensitivity analysis. Statistical science: a review journal of the Institute of Mathematical Statistics 2014; 29(4):687. [DOI] [PMC free article] [PubMed] [Google Scholar]
- [53].Pearl J, Does obesity shorten life? or is it the soda? on non-manipulable causes. Journal of Causal Inference 2018;6(2). [Google Scholar]
- [54].Glymour C, Glymour MR, Commentary: race and sex are causes. Epidemiology 2014; 25(4):488–490. [DOI] [PubMed] [Google Scholar]
- [55].Schwartz S, Gatto NM, Campbell UB, Causal identification: a charge of epidemiology in danger of marginalization. Annals of epidemiology 2016;26(10):669–673. [DOI] [PubMed] [Google Scholar]
- [56].Holland PW, Statistics and causal inference. Journal of the American statistical Association 1986;81(396):945–960. [DOI] [PubMed] [Google Scholar]
- [57].Hernán MA, VanderWeele TJ, Compound treatments and transportability of causal inference. Epidemiology (Cambridge, Mass) 2011;22(3):368. [DOI] [PMC free article] [PubMed] [Google Scholar]
- [58].Neill DB, Herlands W, Machine learning for drug overdose surveillance. Journal of Technology in Human Services 2018;36(1):8–14. [Google Scholar]
Associated Data
This section collects any data citations, data availability statements, or supplementary materials included in this article.