

Abstract
Background
The international outbreak of coronavirus disease (COVID-19) has led many countries to enforce drastic containment measures. It has been suggested that this abrupt lockdown of populations will foster addiction-related habits such as caloric/salty food intake, screen use, and substance use.
Objective
Our aim was to assess the global changes and factors of increase in addiction-related habits during the early COVID-19 containment phase in France.
Methods
A web-based survey was provided from day 8 to day 13 of the containment and was completed by 11,391 participants. The questions explored sociodemographic features, psychiatric/addiction history, material conditions of lockdown, general stress, mental well-being, and reported changes in several addiction-related behaviors. Global changes were described and factors of increase were explored using population-weighted and adjusted logistic regression models, providing adjusted odds ratios (aORs) and their 95% confidence intervals.
Results
Overall, the respondents reported more increases in addiction-related habits than decreases, specifically 28.4% (caloric/salty food intake), 64.6% (screen use), 35.6% (tobacco use), 24.8% (alcohol use), and 31.2% (cannabis use). Reduced well-being scores and increased stress scores were general factors of increase in addiction-related habits (P<.001 for all habits). Factors of increase in caloric/salty food intake (n=10,771) were female gender (aOR 1.62, 95% CI 1.48-1.77), age less than 29 years (P<.001), having a partner (aOR 1.19, 95% CI 1.06-1.35), being locked down in a more confined space (per 1 square meter/person decrease: aOR 1.02, 95% CI 1.01-1.03), being locked down alone (aOR 1.29, 95% CI 1.11-1.49), and reporting current (aOR 1.94, 95% CI 1.62-2.31) or past (aOR 1.27, 95% CI 1.09-1.47) psychiatric treatment. Factors of increase in screen use (n=11,267) were female gender (aOR 1.31, 95% CI 1.21-1.43), age less than 29 years (P<.001), having no partner (aOR 1.18, 95% CI 1.06-1.32), being employed (P<.001), intermediate/high education level (P<.001), being locked down with no access to an outdoor space (aOR 1.16, 95% CI 1.05-1.29), being locked down alone (aOR 1.15, 95% CI 1.01-1.32), living in an urban environment (P<.01), and not working (P<.001). Factors of increase in tobacco use (n=2787) were female gender (aOR 1.31, 95% CI 1.11-1.55), having no partner (aOR 1.30, 95% CI 1.06-1.59), intermediate/low education level (P<.01), and still working in the workplace (aOR 1.47, 95% CI 1.17-1.86). Factors of increase in alcohol use (n=7108) were age 30-49 years (P<.05), a high level of education (P<.001), and current psychiatric treatment (aOR 1.44, 95% CI 1.10-1.88). The only significant factor of increase in cannabis use (n=620) was intermediate/low level of education (P<.001).
Conclusions
The early phase of COVID-19 containment in France led to widespread increases in addiction-related habits in the general population. Reduced well-being and increased stress were universal factors of increase. More specific factors were associated with increases in each of the explored habits.
Keywords: COVID-19, containment, eating behaviors, screen use, internet use, substance use, public health, mental health, pandemic, lifestyle, online survey, addiction
Introduction
In March 2020, the outbreak of coronavirus disease (COVID-19) led the national authorities of most countries worldwide to implement extraordinary measures that dramatically restricted the mobility and social interactions of their populations with the aim of limiting transmission of the virus [1]. In this respect, many countries, including Italy, France, and Spain, decided to establish total or at least very strict lockdown. In France, this containment was announced by the President on March 16, and it went into effect at noon ECT on March 17, 2020 [2]. Only activities deemed “essential” were maintained; these included some medical activities but also activities related to the food supply, including access to alcohol as well as to tobacco and electronic cigarette shops. In France, as in other countries, due to this unprecedented situation, a large majority of the population became locked down at home overnight.
These containment measures, as well as the abrupt international health and economic crises caused by COVID-19, may have caused substantial stress in the population and thus may have significantly impacted people’s general health and, more specifically, their mental well-being. Previous situations of reduced well-being and impaired social environment have been found to be associated with overeating and being overweight as well as increased substance and screen use [3-5]. In this context, it has been suggested that at-risk behaviors that are in the spectrum of addiction are likely to be exacerbated by the COVID-19 outbreak and the related containment but that this should be confirmed by studies [6].
The LockUwell study is a nationwide web-based survey aiming to assess the overall effects of the official containment on the French general population with respect to mental well-being and general health conditions, including eating habits as well as screen and substance use. In this study, we describe the containment-related changes in the respondents’ daily habits of eating, screen use, and substance use, and we explore the main characteristics of the participants who reported the most substantial changes.
Methods
Type of Study
An open web-based survey was launched on March 25, 2020, that is, 8 days after the official implementation of the containment in France.
The reporting of the survey follows the Checklist for Reporting Results of Internet E-Surveys (CHERRIES) [7]. The completed checklist can be found in Multimedia Appendix 1.
Recruitment
Any French-speaking person older than 16 years was invited to participate in the survey without restriction criteria provided they could complete the questionnaire autonomously. The link leading to the online survey was disseminated on the internet using social media (ie, Twitter, LinkedIn, and Facebook) and national media. The recruitment strategy thus followed a convenience sampling method. To prevent individuals from completing the questionnaire multiple times, only one questionnaire could be submitted from a particular IP address.
Questionnaire
The English version of the full questionnaire is available in Multimedia Appendix 2. There was no preliminary assessment of the test-retest reliability or the internal consistency of the questionnaire; however, several tools included in it were previously validated in international studies.
The survey questions aimed to comprise a large range of items related to mental well-being and psychological distress and to collect sociodemographic and environmental data related to the situation of containment, such as total living space or number of persons sharing the house during the containment. The questionnaire was divided in six consecutive sections: 1) sociodemographic features; 2) the French version [8] of the Warwick-Edinburgh Mental Well-Being Scale (WEMWBS), which is a validated scale of 14 items that are rated from 1 to 5, leading to a single total score ranging from 14 (ie, minimum possible well-being) to 70 (ie, maximum possible well-being) to measure mental well-being in the general population [9]; 3) overall and specific (eg, professional, health-related, family) levels of stress, using a visual analog scale ranging from 0 (no stress) to 10 (maximum possible stress) [10]; 4) medical history, in particular the history of psychiatric and addiction treatment; 5) perceptions and apprehensions about COVID-19 and the related official measures; and 6) personal and environmental conditions under which participants were facing the lockdown and their consequences.
In particular, question F-25 explored whether respondents had changed their intake of caloric/salty food, their use of screens, and their use of substances (tobacco, alcohol, cannabis, and other drugs). The response modalities were 1) no usual use; 2) no change in use; 3) decrease with craving/withdrawal; 4) decrease without craving/withdrawal; 5) increase (moderate); and 6) increase (difficult to control).
Data Extraction and Preprocessing
The data were extracted on March 30, 2020, that is, 5 days after the start of the survey. For the present analysis, we included only respondents aged 16 years and older who completed the questionnaire and were living in France at the time when containment was declared. Among the 20,235 participants who started the questionnaire, 11,742 (58.0%) completed it. After excluding inoperable questionnaires and respondents from countries other than France, 11,391/20,235 questionnaires (56.3%) were included in the analyses. A complete flowchart is displayed in Multimedia Appendix 3. Only the responses to questions A-1 to A-7, A-12 to A-14, A-16, B-1, C-1c, D-4b and D-4c, F-6 to F-9, F-17, and F-25 were used in this preliminary investigation.
Statistical Analysis
Statistical analyses were performed using SAS software version 9.4 (SAS Institute). To ensure respondents were representative of French residents aged 16 years and older, the data were weighted to French census targets for age and gender based on distributions reported in 2020 [11]. All descriptive and statistical tests were conducted using weighting variables. The descriptive statistics display categorical variables as the number and percentage of respondents (n, %), while quantitative variables are presented as mean (SD) or median (IQR). We explored caloric/salty food intake, screen use, and tobacco, alcohol, and cannabis use because insufficient data were collected regarding other substances. For each behavior and substance used, the different levels of subjective change (ie, no change, decrease with craving/withdrawal, decrease without craving/withdrawal, moderate increase, or difficult-to-control increase) are displayed.
Increase was expected to be a much more frequent pattern of change than decrease for all behaviors; therefore, we more deeply explored the parameters specifically associated with increase (both types of increase combined) in each type of behavior compared to other modalities of change using weighted logistic regression models. Respondents declaring no usual use were not included in the analyses. For each model, raw odds ratios (ORs) and adjusted odds ratios (aORs) are provided with their 95% confidence intervals. We entered the following variables in the model (each was adjusted with the others in the adjusted analyses): sociodemographic factors (age, gender, family, occupation, and educational level), psychiatric and addiction history, well-being (WEMWBS total score), stress (general stress VAS), housing conditions (surface, outdoor, geographical area) and working conditions during containment as explanatory variables. Multicollinearity was screened using the variance inflation factor and the COLLIN option in SAS.
Results
The raw and weighted descriptive data of the 11,391 participants are shown in Table 1. The weighted sample consisted of 52.1% female respondents with a mean age of 47.47 years (SD 17.28).
Table 1.
Descriptive characteristics of the survey population (N=11,391).
| Characteristic | Values | ||
|
|
|
Unweighted | Weighted |
| Age (years), mean (SD) | |||
|
|
16-29 | 3404 (29.88) | 2421 (21.26) |
|
|
30-49 | 5316 (46.67) | 3488 (30.61) |
|
|
50-64 | 2043 (17.94) | 2651(23.27) |
|
|
65-74 | 547 (4.80) | 2469 (21.67) |
|
|
≥75 | 81 (0.71) | 364 (3.20) |
| Gender, n (%) | |||
|
|
Male | 2557 (22.45) | 5415 (47.5) |
|
|
Female | 8782 (77.10) | 5932 (52.1) |
|
|
Other | 52 (0.46) | 52 (0.4) |
| Marital status, n (%) | |||
|
|
Single, divorced, or widowed | 4033 (35.41) | 4215 (37) |
|
|
In a couple | 7358 (64.59) | 7178 (63) |
| Employment status, n (%) | |||
|
|
Worker | 8032 (70.51) | 6486 (56.92) |
|
|
Job seeker | 568 (4.99) | 475 (4.17) |
|
|
Student | 1407 (12.35) | 987 (8.66) |
|
|
No employment or retired | 1384 (12.15) | 3447 (30.25) |
| Educational level (ISCEDa 2011), n (%) | |||
|
|
≤3 | 727 (6.38) | 1074 (9.42) |
|
|
4 | 1326 (11.64) | 1485 (13.03) |
|
|
5-6 | 3985 (34.98) | 3727 (32.71) |
|
|
≥6 | 5353 (46.99) | 5108 (44.83) |
| Psychiatric history, n (%) | |||
|
|
Current | 1244 (10.92) | 1031 (9.05) |
|
|
Past | 1632 (14.33) | 1622 (14.24) |
|
|
Never | 8515 (74.75) | 8740 (76.71) |
| Addiction treatment, n (%) | |||
|
|
Current | 78 (0.68) | 80 (0.71) |
|
|
Past | 223 (1.96) | 286 (2.51) |
|
|
Never | 11090 (97.36) | 11026 (96.78) |
| Access to outdoor space, n (%) | |||
|
|
Yes | 6911 (60.67) | 7103 (62.34) |
|
|
No | 4480 (39.33) | 4291(37.66) |
| Housing space (square meters/person), median (IQR) | 34.67 (25-50) | 40.00 (28-60) | |
| Well-being (WEMWBSb score), mean (SD) | 49.37 (8.12) | 50.51 (8.17) | |
| General stress (0-10 VASc), mean (SD) | 5.23 (2.35) | 4.84 (2.43) | |
| Housing location, n (%) | |||
|
|
Urban | 6303 (55.33) | 6375 (55.95) |
|
|
Periurban | 2419 (21.24) | 2409 (55.95) |
|
|
Rural | 2669 (23.43) | 2610 (55.95) |
| People locked down in the household (including the respondent), n (%) | |||
|
|
1 | 2528 (22.20) | 3159 (27.73) |
|
|
≥2 but <10 | 8845 (77.66) | 8214 (72.10) |
| Work location during lockdown, n (%) | |||
|
|
In the workplace | 2266 (19.89) | 1755 (15.41) |
|
|
Telecommuting | 4708 (41.33) | 3871 (33.97) |
|
|
Not working | 4417 (41.33) | 5768 (50.62) |
| Change in caloric/salty food intake, n (%) | |||
|
|
No intake | 511 (4.49%) | 622 (5.50) |
|
|
No change | 5655 (49.64%) | 6510 (57.14) |
|
|
Increase | 4125 (36.21%) | 3233 (28.38) |
|
|
Decrease | 1100 (9.65%) | 1028 (9.02) |
| Change in screen use, n (%) | |||
|
|
No use | 99 (0.87) | 127 (1.11%) |
|
|
No change | 3241 (28.45) | 3785 (33.22) |
|
|
Increase | 7843 (68.85) | 7274 (63.84) |
|
|
Decrease | 208 (1.82) | 208 (1.82) |
| Change in tobacco use, n (%) | |||
|
|
No use | 8241 (72.35) | 8607 (75.55) |
|
|
No change | 1218 (10.69) | 1208 (10.55) |
|
|
Increase | 1279 (11.23) | 995 (8.74) |
|
|
Decrease | 653 (5.74) | 589 (5.17) |
| Change in alcohol use, n (%) | |||
|
|
No use | 4292 (37.68) | 4285 (37.62) |
|
|
No change | 3708 (32.55) | 4109 (36.07) |
|
|
Increase | 2023 (17.76) | 1761 (15.46) |
|
|
Decrease | 1368 (12.0) | 1237 (10.86) |
| Change in cannabis use, n (%) | |||
|
|
No use | 10697 (93.91) | 10724 (94.12) |
|
|
No change | 264 (2.32) | 263 (2.31) |
|
|
Increase | 233 (2.05) | 210 (1.84) |
|
|
Decrease | 197 (1.73) | 195 (1.73) |
aISCED: International Standard Classification of Education.
bWEMWBS: Warwick-Edinburgh Mental Well-Being Scale.
cVAS: visual analog scale.
The overall changes reported in the daily habits that were explored in the survey are displayed in Figure 1.
Figure 1.
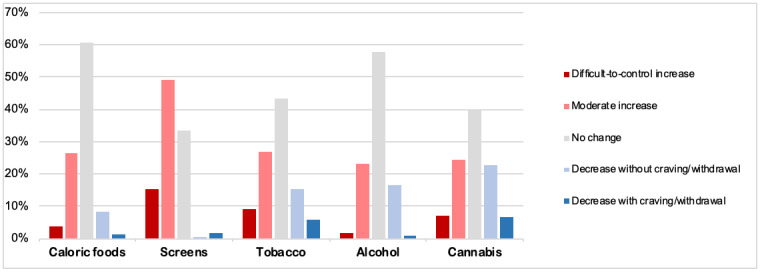
Changes in addiction-related habits in the early phase of COVID-19 containment in France from March 17 to 31, 2020.
Regarding eating patterns, 6510/11,391 (57.14%) participants reported that they did not increase or decrease their average daily intake of caloric/salty food, whereas 2836 (24.89%) moderately increased their intake, 397 (3.49%) increased their intake in a difficult-to-control manner, 874 (7.67%) reduced their intake without craving, and 154 (1.35%) reduced their intake with craving.
With respect to screen use, 124/11,391 (1.09%) respondents declared that they did not usually use screens. Among the 11,267 remaining participants, 3784 (33.59%) reported that they did not change their average daily screen use, whereas 5545 (49.22%) declared having moderately increased their screen use, 1729 (15.35%) increased their screen use in a difficult-to-control manner, 179 (1.59%) reduced or stopped their screen use without craving/withdrawal, and 29 (0.26%) reduced their screen use with craving/withdrawal.
Concerning tobacco use, 2787/11,391 (24.47%) respondents reported that they were current smokers. Among the 2787 smokers, 1208 (43.27%) reported that they did not change their average daily use of tobacco, whereas 746 (26.72%) declared having moderately increased their tobacco use, 249 (8.92%) increased their tobacco use in a difficult-to-control manner, 432 (15.47%) declared that they reduced or stopped their tobacco use without craving/withdrawal, and 157 (5.62%) reduced their tobacco use with craving/withdrawal. Regarding alcohol use, 7108/11,391 (62.40%) respondents were found to use alcohol more or less regularly. Among them, 4109/7108 (57.82%) reported that they had not changed their average daily use of alcohol, whereas 1654 (23.27%) moderately increased their alcohol use, 107 (1.50%) increased their alcohol use in a difficult-to-control manner, 1167 (16.4%) declared having reduced or stopped without craving/withdrawal, and 70 (0.98%) having reduced with craving/withdrawal.
Finally, regarding cannabis use, 620/11,391 (5.44%) participants reported using cannabis. Among the, 263/620 (39.49%) reported that they had not changed their average daily use of cannabis, whereas 162 (24.32%) declared having moderately increased their cannabis use, 46 (6.91%) increased their cannabis use in a difficult-to-control manner, 150 (22.52%) reduced or stopped their cannabis use without craving/withdrawal, and 45 (6.76%) reduced their cannabis use with craving/withdrawal.
Raw and adjusted analyses of the factors associated with the increase in each of the explored habits can be found in Table 2 and Table 3, respectively.
Table 2.
Results of the unadjusted analyses exploring the increases in caloric/salty food, screen use, and substance use in the early phase of COVID-19 containment in France among the general population.
| Characteristic | Caloric/salty food intake (n=10,771; 3233 increase vs 7538 no increase) |
Screen use (n=11,267; 7274 increase vs 3993 no increase) | Tobacco use (n=2787; 996 increase vs 1791 no increase) | Alcohol use (n=7108; 1761 increase vs 5347 no increase) | Cannabis use (n=666; 208 increase vs 458 no increase) | |||||||||||||||||||
| ORa (95% CI) | P value | OR (95% CI) | P value | OR (95% CI) | P value | OR (95% CI) | P value | OR (95% CI) | P value | |||||||||||||||
| Gender | ||||||||||||||||||||||||
|
|
Male | Reference | N/Ab | Reference | N/A | Reference | N/A | Reference | N/A | Reference | N/A | |||||||||||||
|
|
Female | 1.59 (1.46-1.73) | <.001 | 1.33 (1.23-1.44) | <.001 | 1.36 (1.16-1.59) | <.001 | 1.13 (1.12-1.26) | .02 | 1.01 (0.71-1.44) | .96 | |||||||||||||
|
|
Other | 2.08 (1.17-3.68) | .01 | 1.57 (0.86-2.87) | .14 | 1.26 (0.46-3.50) | .67 | 0.53 (0.19-1.54) | .25 | 0.63 (0.13-3.05) | .57 | |||||||||||||
| Age (years) | ||||||||||||||||||||||||
|
|
16-29 | Reference | N/A | Reference | N/A | Reference | N/A | Reference | N/A | Reference | N/A | |||||||||||||
|
|
30-49 | 0.85 (0.77-0.95) | <.001 | 0.61 (0.54-0.69) | <.001 | 0.89 (0.73-1.08) | .25 | 1.33 (1.16-1.53) | <.001 | 0.90 (0.63-1.28) | .53 | |||||||||||||
|
|
50-64 | 0.50 (0.44-0.56) | <.001 | 0.50 (0.45-0.57) | <.001 | 0.71 (0.57-0.89) | .003 | 0.79 (0.67-0.93) | .005 | 0.36 (0.21-0.62)c | <.001 | |||||||||||||
|
|
≥65 | 0.28 (0.23-0.31) | <.001 | 0.40 (0.35-0.45) | <.001 | 0.22 (0.16-0.31) | <.001 | 0.49 (0.41-0.59) | <.001 | N/A |
|
|||||||||||||
| In a couple | ||||||||||||||||||||||||
|
|
Yes | Reference | N/A | Reference | N/A | Reference | N/A | Reference | N/A | Reference | N/A | |||||||||||||
|
|
No | 1.00 (0.92-1.09) | .98 | 1.44 (1.32-1.56) | <.001 | 1.27 (1.09-1.49) | .003 | 0.87 (0.77-0.97) | .01 | 1.33 (0.96-1.85) | .09 | |||||||||||||
| Professional situation | ||||||||||||||||||||||||
|
|
Worker | Reference | N/A | Reference | N/A | Reference | N/A | Reference | N/A | Reference | N/A | |||||||||||||
|
|
Student | 1.25 (1.09-1.44) | .002 | 1.74 (1.49-2.04) | <.001 | 0.83 (0.64-1.09) | .174 | 0.73 (0.59-0.89) | <.001 | 0.80 (0.51-1.26) | <.001 | |||||||||||||
|
|
Job seeker | 0.94 (0.76-1.15) | .53 | 1.14 (0.93-1.39) | .21 | 0.81 (0.60-1.11) | .193 | 1.06 (0.82-1.36) | .69 | 1.02 (0.57-1.81) | .95 | |||||||||||||
|
|
Not employed or retired | 0.41 (0.37-0.45) | <.001 | 0.65 (0.60-0.71) | <.001 | 0.38 (0.30-0.48) | <.001 | 0.47 (0.41-0.54) | <.001 | 0.25 (0.12-0.52) | <.001 | |||||||||||||
| Educational level (ISCEDd 2011) | ||||||||||||||||||||||||
|
|
3 | Reference | N/A | Reference | N/A | Reference | N/A | Reference | N/A | Reference | N/A | |||||||||||||
|
|
≥6 | 0.96 (0.84-1.09) | .55 | 0.91 (0.80-1.02) | .11 | 0.70 (0.55-0.89) | .004 | 1.58 (1.30-1.91) | <.001 | 0.46 (0.29-0.73) | <.001 | |||||||||||||
|
|
4-5 | 1.05 (0.92-1.20) | .45 | 0.96 (0.84-1.09) | .51 | 0.68 (0.54-0.87) | .002 | 1.34 (1.10-1.64) | .004 | 0.47 (0.29-0.74) | <.001 | |||||||||||||
|
|
1-2 | 0.64 (0.53-0.78) | <.001 | 0.55 (0.47-0.65) | <.001 | 0.67 (0.48-0.70) | .01 | 1.64 (0.80-1.42) | .69 | 0.48 (0.25-0.92) | .03 | |||||||||||||
| Access to outdoor space | ||||||||||||||||||||||||
|
|
Yes | Reference | N/A | Reference | N/A | Reference | N/A | Reference | N/A | Reference | N/A | |||||||||||||
|
|
No | 1.17 (1.07-1.27) | <.001 | 1.50 (1.38-1.63) | <.001 | 1.17 (1.01-1.37) | .043 | 1.04 (0.93-1.16) | .56 | 1.64 (1.17-2.29) | .004 | |||||||||||||
| Well-being (WEMWBSe score) | ||||||||||||||||||||||||
|
|
Per 1-point increase | 0.96 (0.95-0.96) | <.001 | 0.96 (0.96-0.96) | <.001 | 0.96 (0.95-0.97) | <.001 | 0.96 (0.96-0.97) | <.001 | 0.96 (0.94-0.98) | <.001 | |||||||||||||
| General stress (0-10 VASf) | ||||||||||||||||||||||||
|
|
Per 1-point increase | 1.15 (1.13-1.17) | <.001 | 1.12 (1.10-1.14) | <.001 | 1.14 (1.11-1.18) | <.001 | 1.12 (1.10-1.15) | <.001 | 1.09 (1.02-1.16) | .01 | |||||||||||||
| Living space | ||||||||||||||||||||||||
|
|
Per 5 square meters/person increase | 0.95 (0.94-0.96) | <.001 | 0.98 (0.97-0.99) | <.001 | 0.97 (0.96-0.99) | <.001 | 0.96 (0.95-0.97) | <.001 | 0.96 (0.93-1.00) | .64 | |||||||||||||
| Confined with other people | ||||||||||||||||||||||||
|
|
Yes | Reference | N/A | Reference | N/A | Reference | N/A | Reference | N/A | Reference | N/A | |||||||||||||
|
|
No (alone) | 0.92 (0.84-1.01) | .09 | 0.78 (0.72-0.86) | <.001 | 1.04 (0.88-1.23) | .69 | 0.77 (0.68-0.88) | <.001 | 0.95 (0.66-1.37) | .78 | |||||||||||||
| Housing location | ||||||||||||||||||||||||
|
|
Urban | Reference | N/A | Reference | N/A | Reference | N/A | Reference | N/A | Reference | N/A | |||||||||||||
|
|
Periurban | 1.00 (0.90-1.11) | .95 | 0.75 (0.68-0.83) | <.001 | 0.85 (0.69-1.05) | .14 | 1.01 (0.88-1.16) | .86 | 0.81 (0.50-1.32) | .41 | |||||||||||||
|
|
Rural | 0.91 (0.82-1.01) | .07 | 0.71 (0.64-0.78) | <.001 | 0.88 (0.72-1.06) | .18 | 0.96 (0.85-1.15) | .57 | 0.81 (0.51-1.28) | .37 | |||||||||||||
| Working conditions | ||||||||||||||||||||||||
|
|
Telecommuting | Reference | N/A | Reference | N/A | Reference | N/A | Reference | N/A | Reference | N/A | |||||||||||||
|
|
Not working | 0.58 (0.51-0.65) | <.001 | 1.11 (0.99-1.24) |
|
0.48 (0.39-0.59) | <.001 | 0.68 (0.58-0.79) | <.001 | 0.69 (0.43-1.11) | .13 | |||||||||||||
|
|
Working in the workplace | 0.90 (0.80-1.02) | .10 | 1.23 (1.09-1.38) | <.001 | 0.66 (0.54-0.83) | <.001 | 0.99 (0.85-1.15) | .86 | 0.89 (0.56-1.44) | .66 | |||||||||||||
| Psychiatric treatment | ||||||||||||||||||||||||
|
|
Never | Reference | N/A | Reference | N/A | Reference | N/A | Reference | N/A | Reference | N/A | |||||||||||||
|
|
Past | 1.27 (1.09-1.47) | <.001 | 1.28 (1.11-1.49) | <.001 | 1.04 (0.79-1.35) | .81 | 1.10 (0.90-1.34) | .35 | 1.13 (0.67-1.90) | .66 | |||||||||||||
|
|
Current | 1.94 (1.62-2.31) | .002 | 1.32 (1.10-1.59) | .003 | 1.64 (1.22-2.22) | .001 | 1.77 (1.39-2.26) | <.001 | 0.99 (0.52-1.85) | .97 | |||||||||||||
| Addiction treatment | ||||||||||||||||||||||||
|
|
Never | Reference | N/A | Reference | N/A | Reference | N/A | Reference | N/A | Reference | N/A | |||||||||||||
|
|
Past | 1.01 (0.77-1.33) | .95 | 1.00 (0.78-1.28) | .98 | 1.48 (1.01-2.15) | .04 | 1.06 (0.73-1.54) | .77 | 0.82 (0.38-1.80) | .64 | |||||||||||||
|
|
Current | 1.11 (0.68-1.80) | .69 | 1.04 (0.66-1.66) | .87 | 1.15 (0.65-2.03) | .65 | 1.20 (0.63-2.29) | .58 | 0.62 (0.17-2.19) | .46 | |||||||||||||
aOR: odds ratio.
bN/A: not applicable.
cDue to power requirements, the age categories of 50-64 years and ≥65 years were pooled in the model exploring cannabis use increase.
dISCED: International Standard Classification of Education.
eWEMWBS: Warwick-Edinburgh Mental Well-Being Scale.
fVAS: visual analog scale.
Table 3.
Results of the adjusted analyses exploring the increase in caloric/salty food, screen use, and substance use in the early phase of COVID-19 containment in France among the general population.
| Characteristic | Caloric/salty food intake (n=10,771; 3233 increase vs 7538 no increase) | Screen use (n=11,267; 7274 increase vs 3993 no increase) | Tobacco use (n=2787; 996 increase vs 1791 no increase) | Alcohol use (n=7108; 1761 increase vs 5347 no increase) | Cannabis use (n=666; 208 increase vs 458 no increase) | ||||||||||
|
|
|
aORa (95% CI) | P value | aOR (95% CI) | P value | aOR (95% CI) | P value | aOR (95% CI) | P value | aOR (95% CI) | P value | ||||
| Gender | |||||||||||||||
|
|
Male | Reference | N/Ab | Reference | N/A | Reference | N/A | Reference | N/A | Reference | N/A | ||||
|
|
Female | 1.62 (1.48-1.77) | <.001 | 1.31 (1.21-1.43) | <.001 | 1.31 (1.11-1.55) | .002 | 1.02 (0.91-1.14) | .76 | 0.99 (0.67-1.46) | .95 | ||||
|
|
Other | 1.17 (0.64-2.14) | .63 | 0.66 (0.35-1.25) |
|
0.95 (0.32-2.78) | .93 | 0.26 (0.08-0.89) | .03 | 0.45 (0.07-2.74) | .39 | ||||
| Age (years) | |||||||||||||||
|
|
16-29 | Reference | N/A | Reference | N/A | Reference | N/A | Reference | N/A | Reference | N/A | ||||
|
|
30-49 | 0.81 (0.71-0.92) | <.001 | 0.70 (0.61-0.81) | <.001 | 0.81 (0.64-1.01) | .07 | 1.18 (1.01 -1.39) | <.001 | 0.90 (0.58-1.39) | .65 | ||||
|
|
50-64 | 0.54 (0.47-0.63) | <.001 | 0.68 (0.58-0.79) | <.001 | 0.71 (0.55-0.93) | .01 | 0.84 (0.69-1.01) | .07 | 0.48 (0.25-0.89)c | .02 | ||||
|
|
≥65 | 0.42 (0.34-0.53) | <.001 | 0.65 (0.53-0.80) | <.001 | 0.32 (0.20 -0.50) | <.001 | 0.76 (0.56-1.07) | .10 |
|
|
||||
| In a couple | |||||||||||||||
|
|
Yes | Reference | N/A | Reference | N/A | Reference | N/A | Reference | N/A | Reference | N/A | ||||
|
|
No | 0.84 (0.74-0.94) | .003 | 1.18 (1.06-1.32) | <.001 | 1.30 (1.06-1.59) | .01 | 0.92 (0.79-1.07) | .27 | 1.18 (0.77-1.79) | .46 | ||||
| Professional situation | |||||||||||||||
|
|
Worker | Reference | N/A | Reference | N/A | Reference | N/A | Reference | N/A | Reference | N/A | ||||
|
|
Student | 0.89 (0.75-1.05) | .17 | 1.17 (0.97-1.42) | .10 | 0.61 (0.44-0.84) | .003 | 0.71 (0.56-0.90) | .004 | 0.55 (0.31-0.95) | .03 | ||||
|
|
Job seeker | 0.86 (0.69-1.08) | .20 | 0.69 (0.55-0.86) | .001 | 0.84 (0.59-1.20) | .35 | 1.02 (0.77-1.36) | .87 | 0.94 (0.48-1.82) | .86 | ||||
|
|
No employment/retired | 0.72 (0.59-0.87) | <.001 | 0.51 (0.43-0.61) | <.001 | 0.68 (0.48-0.97) | .03 | 0.72 (0.55-0.94) | .02 | 0.22 (0.09-0.52) | <.001 | ||||
| Educational level (ISCEDd 2011) | |||||||||||||||
|
|
3 | Reference | N/A | Reference | N/A | Reference | N/A | Reference | N/A | Reference | N/A | ||||
|
|
≥6 | 0.87 (0.75-1.00) | .06 | 0.95 (0.83-1.09) | .46 | 0.69 (0.53-0.90) | .006 | 1.52 (1.24-1.86) | <.001 | 0.38 (0.22-0.65) | <.001 | ||||
|
|
I4-5 | 0.94 (0.82-1.09) | .44 | 0.97 (0.85-1.11) | .65 | 0.68 (0.53-0.88) | .003 | 1.25 (1.02-1.54) | .03 | 0.41 (0.24-0.69) | <.001 | ||||
|
|
1-2 | 0.74 (0.60-0.90) | .003 | 0.60 (0.50-0.71) | <.001 | 0.72 (0.51-1.02) | .06 | 1.14 (0.85-1.54) | .39 | 0.48 (0.23-1.01) | .05 | ||||
| Access to outdoor space | |||||||||||||||
|
|
Yes | Reference | N/A | Reference | N/A | Reference | N/A | Reference | N/A | Reference | N/A | ||||
|
|
No | 0.95 (0.85-1.05) | .32 | 1.16 (1.05-1.29) | 0.005 | 1.00 (0.82-1.23) | .98 | 0.92 (0.80-1.06) | .27 | 1.54 (1.01-2.38) | .048 | ||||
| Well-being (WEMWBSe score) | |||||||||||||||
|
|
Per 1-point increase | 0.98 (0.97-0.98) | <.001 | 0.98 (0.97-0.98) | <.001 | 0.97 (0.96-0.98)c | <.001 | 0.97 (0.96-0.98) | <.001 | 0.96 (0.93-0.98) | <.001 | ||||
| General stress (0-10 VASf) | |||||||||||||||
|
|
Per 1-point increase | 1.07 (1.05-1.10) | <.001 | 1.08 (1.05-1.10) | <.001 | 1.07 (1.03-1.11) | <.001 | 1.06 (1.03-1.09) | <.001 | 1.03 (0.95-1.12) | .46 | ||||
| Living space | |||||||||||||||
|
|
Per 5 square meters/person increase | 0.98 (0.97-0.99) | .003 | 0.99 (0.98-1.01) | >0.99 | 1.01 (0.98-1.03) | .68 | 0.99 (0.98-1.00) | .19 | 1.01 (0.96-1.05) | .86 | ||||
| Confined with other people | |||||||||||||||
|
|
Yes | Reference | N/A | Reference | N/A | Reference | N/A | Reference | N/A | Reference | N/A | ||||
|
|
No (alone) | 1.29 (1.11-1.49) | <.001 | 1.15 (1.01-1.32) | .049 | 0.91 (0.70-1.17) | .46 | 0.87 (0.72-1.05) | .16 | 0.90 (0.53-1.54) | .72 | ||||
| Housing location | |||||||||||||||
|
|
Urban | Reference | N/A | Reference | N/A | Reference | N/A | Reference | N/A | Reference | N/A | ||||
|
|
Periurban | 1.08 (0.96-1.22) | .21 | 0.88 (0.79-0.98) | .03 | 0.87 (0.68-1.11) | .26 | 1.04 (0.89-1.22) | .62 | 1.21 (0.69-2.14) | .50 | ||||
|
|
Rural | 0.98 (0.86-1.11) | .73 | 0.82 (0.73-0.92) | <.001 | 0.95 (0.75-1.21) | .71 | 1.06 (0.90-1.24) | .53 | 1.12 (0.63-1.98) | .72 | ||||
| Working conditions | |||||||||||||||
|
|
Telecommuting | Reference | N/A | Reference | N/A | Reference | N/A | Reference | N/A | Reference | N/A | ||||
|
|
Not working | 0.98 (0.87-1.11) | .72 | 1.69 (1.48-1.93) | <.001 | 0.87 (0.70-1.09) | .24 | 1.00 (0.85-1.18) | .98 | 0.87 (0.56-1.36) | .56 | ||||
|
|
Working in the workplace | 1.08 (0.95-1.23) | .21 | 0.83 (0.73-0.94) | .003 | 1.47 (1.17-1.86) | .001 | 1.06 (0.90-1.24) | .49 | 0.98 (0.58-1.65) | .93 | ||||
| Psychiatric treatment | |||||||||||||||
|
|
Never | Reference | N/A | Reference | N/A | Reference | N/A | Reference | N/A | Reference | N/A | ||||
|
|
Past | 1.27 (1.09-1.47) | <.001 | 1.07 (0.91-1.25) | .44 | 0.80 (0.60-1.08) | .15 | 1.00 (0.81-1.23) | .99 | 1.01 (0.55-1.86) | .99 | ||||
|
|
Current | 1.94 (1.62-2.31) | .31 | 0.92 (0.75-1.13) | .45 | 1.33 (0.94-1.88) | .10 | 1.44 (1.10-1.88)d | .008 | 1.12 (0.54-2.35) | .78 | ||||
| Addiction treatment | |||||||||||||||
|
|
Never | Reference | N/A | Reference | N/A | Reference | N/A | Reference | N/A | Reference | N/A | ||||
|
|
Past | 1.01 (0.77-1.33) | .45 | 0.95 (0.72-1.24) | .70 | 1.51 (0.99-2.29) | .06 | 1.01 (0.68-1.49) | .97 | 0.70 (0.29-1.73) | .45 | ||||
|
|
Current | 1.11 (0.68-1.80) | .89 | 0.88 (0.53-1.45) | .63 | 0.98 (0.53-1.82) | .96 | 0.78 (0.39-1.58) | .49 | 0.65 (0.15-2.78) | .57 | ||||
aaOR: adjusted odds ratio.
bN/A: not applicable.
cDue to power requirements, the age categories of 50-64 years and ≥65 years were pooled in the model exploring cannabis use increase.
dISCED: International Standard Classification of Education.
eWEMWBS: Warwick-Edinburgh Mental Well-Being Scale.
fVAS: visual analog scale.
After adjustment, the respondents who reported increasing their caloric/salty food intake were more likely to be female, to be aged ≤30 years (see Table 3), to have a partner, to be professionally active, a student, or a job seeker, to report a lower score of well-being and a higher score of general stress, to be locked down alone in a reduced space, and to report current or past treatment for psychiatric disorder (for ORs and 95% CIs, see Table 3).
Based on the results of the multivariable logistic regression models, the respondents who reported increasing their screen use were more likely to be female, to be aged <30 years, to have no partner, to be professionally active, to have a relatively high level of education (ie, ISCED 4 or more), to report a lower score of well-being and a higher score of general stress, to be locked down alone, in a city, and with no access to an outdoor space, and to have stopped their professional activity because of the lockdown (for ORs and 95% CIs, see Table 3).
After adjustment, the interviewees who reported increasing their use of tobacco were more likely to be female, to be aged <50 years, to have no partner, to be professionally active or a job seeker, to have a relatively low level of education (ie, ISCED 3 or less), to report a lower score of well-being and a higher score of general stress, and to continue working in the workplace (for ORs and 95% CIs, see Table 3).
After adjustment, the individuals who reported increasing their alcohol use were more likely to be aged 30 to 49 years, to be professionally active or job seekers, to have a high level of education (ie, ISCED 5 or more), to report a lower score of well-being and a higher score of general stress, and to report current treatment for a psychiatric disorder (for ORs and 95% CIs, see Table 3).
After adjustment, the participants who reported increasing their cannabis use were more likely to be aged <50 years, to have a relatively low level of education (ie, ISCED 4 or less), and to live in a dwelling with no access to an outdoor space (for ORs and 95% CIs, see Table 3).
Discussion
Principal Results
Overall, we found that increases were much more frequent than decreases for all the habits explored. Moreover, it appears that the use of screens increased greatly; 4125/11,391 (36.21%) of the survey population reported increased screen use, and 1729 (15.18%) noted difficulties in controlling their screen use.
The early impact of the COVID-19 outbreak and the related lockdown thus appear to be associated with substantial increases in the intake of caloric/salty food as well as in screen and substance use among the French population. In animal models, it is well-demonstrated that reducing social connections enhances stress; as a result, increases are observed in both eating and weight [12] as well as in substance use [13,14]. In humans, epidemiological studies on this topic are more limited, as situations of abrupt reduction in social interaction at the population level are relatively uncommon. However, analogies can be made to studies that investigated individuals enrolled in armed forces during conflicts, which revealed that the social interactions of the individuals were dramatically reduced and that their substance use increased in parallel. For example, studies by Lee Robins [15] among US soldiers who were sent to Vietnam in the 1970s found an important reduction in social interactions accompanied by an important increase in the use of opioids by soldiers during their presence in the field; meanwhile, these patterns of use rapidly and almost completely disappeared after the soldiers returned home. A comparison with our findings should be made with caution, as a situation of war is in no way comparable with that of the COVID-19 lockdown. However, the results of our survey are in line with the fact that a substantial reduction of social habits can be associated with enhanced stress and boredom and thus with increases in addiction-related habits.
Furthermore, our findings enlighten both common aspects and singularities between habits in the profiles of respondents who reported increases. Overall, reduced mental well-being and greater overall stress were shared risk factors of increase for all habits. A current or past history of addiction treatment did not appear to impact the observed changes; this is noteworthy because the respondents were supposed to be more vulnerable to stress and were thus expected to increase or relapse in addictive behaviors [6]. More specifically, the typology of respondents who increased their habits substantially differed depending on the habit. Respondents who increased their intake in caloric/salty foods were primarily young women who were living in smaller dwellings and were locked down alone. Previous studies have demonstrated that emotional eating in stressful environments is more common in women [16,17]. It can thus be hypothesized that women who faced the stress induced by the COVID-19 crisis and the related containment coped more by consuming caloric/salty food relative to men. In this context, living alone in a smaller space or reporting past or current treatment for psychiatric disorder can be seen as additional sources of stress.
Survey respondents who reported increasing their screen use were more likely to be female, less than 30 years of age, single, locked down alone, living in an urban area, without access to an outdoor space, and not working. Stress is also a well-demonstrated risk factor of increasing screen use; it is more expressed in younger people, although usually more commonly in men [18,19]. Living alone is another known risk factor for increased screen use [20,21], and this factor was certainly accentuated during the lockdown. Similarly, not working was previously found to be associated with increased internet use [22]. Interestingly, a previous study found that increased use of the internet in a stressful environment was more frequent in young people living in urban areas [23]. This is in line with our findings, which can be explained by a more confined environment in this case. However, fewer respondents who were currently working in the workplace reported increased screen use compared to telecommuting respondents; this also suggests that enhanced screen use is related to telecommuting in some cases.
Among tobacco smokers, the main risk factors for increased smoking were also being female, age less than 50 years, being single, and low level of education. In line with these findings, female gender, younger age, lower socioeconomic status, and psychological distress are the main factors associated with tobacco use [24]. It thus appears that the same risk factors that are associated with tobacco use in general were associated with increasing tobacco use in the case of the COVID-19 lockdown.
The profile of respondents who increased their alcohol use was different, as this increase preferentially affected people aged 30 to 49 years with high levels of education. A possible explanation is that increased use of alcohol may be less stigmatized than that of tobacco or cannabis, as people who use cannabis and tobacco in France are globally younger, have lower income, and are less educated [25,26]. For this reason, alcohol use may have increased more than tobacco or cannabis use among more educated and middle-aged respondents. In line with this hypothesis, respondents who reported increased cannabis use more specifically consisted of very young workers with low levels of education. This reflects the population of regular users of cannabis in France, which is mainly aged less than 30 years [27]. Moreover, while no study has specifically explored this issue in France, international epidemiological studies have revealed that cannabis use is inversely correlated with level of education [28]. In sum, our findings suggest that increased stress and impaired well-being were common risk factors for increases in all types of addiction-related habits during the early phase of the COVID-19 lockdown in France. However, other sociodemographic characteristics and individual features related to lockdown conditions were associated with increases in more specific habits, thus reflecting a specific vulnerability of some parts of the French population with regard to the different habits explored, namely caloric/salty food intake, screen use, or tobacco, alcohol, or cannabis use.
Limitations
Our study was a web-based survey performed on a convenience sample with no a priori representativeness of the French population. Although our analyses were weighted based on several basic sociodemographic parameters, we cannot exclude the possibility that important parts of the French population were overrepresented or underrepresented, which may have had an impact on our findings. For example, although illiterate people represent a limited part of the French population, we acknowledge that participating in the survey would be difficult for them without external help. Given the context, however, it would be difficult to rapidly set up a study with more thorough methodological features. Despite this, the rate of tobacco smokers in our study (24.47%) was close to that observed in the French population (25.2% in 2018 [29]). Similarly, 62.40% of our sample declared that they used alcohol; meanwhile, the rate of French adults who used alcohol at least once per year in 2018 was 87%, while the rate of adults who used alcohol at least once a week was 49% [30]. However, a gap was found for cannabis use; 5.4% of our sample reported using this substance, whereas the rate of current users in the adult French population is estimated to reach 11% [27]. This gap may result from social desirability bias, which is the tendency to underreport socially undesirable attitudes and behaviors and to overreport more desirable attributes; this bias is more pronounced with illicit substances [31].
Another limitation pertains to what is conveyed under the notion of “screen use,” which can actually involve many habits, such as video gaming, social networking, or teleworking. The interview may thus have lacked precision on this point, and interpreting the participants’ answers may thus have been more difficult. An additional limitation is that the data we analyzed only pertained to the early phase of the lockdown, and it is perfectly possible that several findings reflected short-term adjustment behaviors that may not be durably sustained over the remaining phase of the lockdown. Another limitation is that we did not explore the interrelations in the changes between habits; thus, we did not explore overlaps in terms of affected populations. Finally, the assessment of how individual habits had changed was entirely subjective with no precise quantification in either terms of amounts or time, which limits the accuracy of the data.
Comparison With Prior Work
To our knowledge, no previous study has assessed the impact of a national COVID-19 containment measure on eating habits, screen use, or substance use. The increases found in our survey were hypothesized in a recent literature report [6]; however, our contribution provides the first data supporting these assumptions.
Conclusions
The early phase of COVID-19 containment in France was associated with a substantial proportion of survey respondents reporting increased caloric/salty food intake, screen use, and tobacco, alcohol, and cannabis use. The increase was particularly large for screen use, which affected two-thirds of the sample. Furthermore, the profiles of individuals who increased their habits displayed shared features, particularly poorer well-being and increased stress; however, specificities between each type of increase also revealed some populational singularities, particularly related to gender, age category, and level of education. Thus, targeted prevention messages should be developed to address the types of habits to which subcategories of the population are more vulnerable during and after the containment period.
Abbreviations
- CHERRIES
Checklist for Reporting Results of Internet E-Surveys
- COVID-19
coronavirus disease
- ISCED
International Standard Classification of Education
- VAS
visual analog scale
- WEMWBS
Warwick–Edinburgh Mental Well-Being Scale
Appendix
CHERRIES checklist.
The questionnaire used for the survey (in English).
Flowchart demonstrating how questionnaires were selected for the analyses.
Footnotes
Conflicts of Interest: None declared.
References
- 1.Walensky RP, Del Rio C. From Mitigation to Containment of the COVID-19 Pandemic: Putting the SARS-CoV-2 Genie Back in the Bottle. JAMA. 2020 Apr 17; doi: 10.1001/jama.2020.6572. [DOI] [PubMed] [Google Scholar]
- 2.Decree n° 2020-260, 16 March, 2020, regulating the movement of persons for fighting the propagation of the COVID-19 virus. Webpage in French. Légifrance. 2020. Mar 16, [2020-05-15]. https://www.legifrance.gouv.fr/affichTexte.do?cidTexte=JORFTEXT000041728476&categorieLien=id.
- 3.Stranges S, Samaraweera P, Taggart F, Kandala N, Stewart-Brown S. Major health-related behaviours and mental well-being in the general population: the Health Survey for England. BMJ Open. 2014 Sep 19;4(9):e005878. doi: 10.1136/bmjopen-2014-005878. http://bmjopen.bmj.com/cgi/pmidlookup?view=long&pmid=25239293. [DOI] [PMC free article] [PubMed] [Google Scholar]
- 4.Lemieux A, al'Absi Mustafa. Stress psychobiology in the context of addiction medicine: from drugs of abuse to behavioral addictions. Prog Brain Res. 2016;223:43–62. doi: 10.1016/bs.pbr.2015.08.001. [DOI] [PubMed] [Google Scholar]
- 5.Sinha R. Chronic stress, drug use, and vulnerability to addiction. Ann N Y Acad Sci. 2008 Oct;1141:105–30. doi: 10.1196/annals.1441.030. http://europepmc.org/abstract/MED/18991954. [DOI] [PMC free article] [PubMed] [Google Scholar]
- 6.Marsden J, Darke S, Hall W, Hickman M, Holmes J, Humphreys K, Neale J, Tucker J, West R. Mitigating and learning from the impact of COVID-19 infection on addictive disorders. Addiction. 2020 Jun;115(6):1007–1010. doi: 10.1111/add.15080. [DOI] [PMC free article] [PubMed] [Google Scholar]
- 7.Eysenbach G. Improving the quality of Web surveys: the Checklist for Reporting Results of Internet E-Surveys (CHERRIES) J Med Internet Res. 2004 Sep 29;6(3):e34. doi: 10.2196/jmir.6.3.e34. https://www.jmir.org/2004/3/e34/ [DOI] [PMC free article] [PubMed] [Google Scholar]
- 8.Trousselard M, Steiler D, Dutheil F, Claverie D, Canini F, Fenouillet F, Naughton G, Stewart-Brown S, Franck N. Validation of the Warwick-Edinburgh Mental Well-Being Scale (WEMWBS) in French psychiatric and general populations. Psychiatry Res. 2016 Nov 30;245:282–290. doi: 10.1016/j.psychres.2016.08.050. [DOI] [PubMed] [Google Scholar]
- 9.Tennant R, Hiller L, Fishwick R, Platt S, Joseph S, Weich S, Parkinson J, Secker J, Stewart-Brown S. The Warwick-Edinburgh Mental Well-being Scale (WEMWBS): development and UK validation. Health Qual Life Outcomes. 2007 Nov 27;5(1):63. doi: 10.1186/1477-7525-5-63. https://hqlo.biomedcentral.com/articles/10.1186/1477-7525-5-63. [DOI] [PMC free article] [PubMed] [Google Scholar]
- 10.Lesage F, Chamoux A, Berjot S. Stabilité de l’échelle visuelle analogique dans l’évaluation du stress. Archives des Maladies Professionnelles et de l'Environnement. 2009 Dec;70(6):619–622. doi: 10.1016/j.admp.2009.10.016. [DOI] [Google Scholar]
- 11.Demographic Assessment 2019: Total population by age and sex on 01/01/2020, France. Webpage in French. Institut National de la Statistique et des Etudes Economiques. 2020. Jan 14, [2020-04-18]. https://www.insee.fr/fr/statistiques/1892086?sommaire=1912926.
- 12.Schipper L, Harvey L, van der Beek E M, van Dijk G. Home alone: a systematic review and meta-analysis on the effects of individual housing on body weight, food intake and visceral fat mass in rodents. Obes Rev. 2018 May;19(5):614–637. doi: 10.1111/obr.12663. [DOI] [PubMed] [Google Scholar]
- 13.Cheeta S, Irvine E, File S. Social isolation modifies nicotine's effects in animal tests of anxiety. Br J Pharmacol. 2001 Apr;132(7):1389–95. doi: 10.1038/sj.bjp.0703991. doi: 10.1038/sj.bjp.0703991. [DOI] [PMC free article] [PubMed] [Google Scholar]
- 14.Thielen R, McBride W, Lumeng L, Li T. Housing conditions alter GABAA receptor of alcohol-preferring and -nonpreferring rats. Pharmacol Biochem Behav. 1993 Nov;46(3):723–727. doi: 10.1016/0091-3057(93)90568-e. [DOI] [PubMed] [Google Scholar]
- 15.Hall W, Weier M. Lee Robins' studies of heroin use among US Vietnam veterans. Addiction. 2017 Jan;112(1):176–180. doi: 10.1111/add.13584. [DOI] [PubMed] [Google Scholar]
- 16.Camilleri G, Méjean C, Kesse-Guyot E, Andreeva V, Bellisle F, Hercberg S, Péneau S. The associations between emotional eating and consumption of energy-dense snack foods are modified by sex and depressive symptomatology. J Nutr. 2014 Aug;144(8):1264–73. doi: 10.3945/jn.114.193177. [DOI] [PubMed] [Google Scholar]
- 17.Péneau S, Ménard E, Méjean C, Bellisle F, Hercberg S. Sex and dieting modify the association between emotional eating and weight status. Am J Clin Nutr. 2013 Jun;97(6):1307–13. doi: 10.3945/ajcn.112.054916. [DOI] [PubMed] [Google Scholar]
- 18.Khalili-Mahani N, Smyrnova A, Kakinami L. To Each Stress Its Own Screen: A Cross-Sectional Survey of the Patterns of Stress and Various Screen Uses in Relation to Self-Admitted Screen Addiction. J Med Internet Res. 2019 Apr 02;21(4):e11485. doi: 10.2196/11485. https://www.jmir.org/2019/4/e11485/ [DOI] [PMC free article] [PubMed] [Google Scholar]
- 19.Kuss D, Griffiths M. Online social networking and addiction--a review of the psychological literature. Int J Environ Res Public Health. 2011 Sep;8(9):3528–52. doi: 10.3390/ijerph8093528. https://www.mdpi.com/resolver?pii=ijerph8093528. [DOI] [PMC free article] [PubMed] [Google Scholar]
- 20.Achab S, Nicolier M, Mauny F, Monnin J, Trojak B, Vandel P, Sechter D, Gorwood P, Haffen E. Massively multiplayer online role-playing games: comparing characteristics of addict vsnon-addict online recruited gamers in a French adult population. BMC Psychiatry. 2011 Aug 26;11(1) doi: 10.1186/1471-244x-11-144. [DOI] [PMC free article] [PubMed] [Google Scholar]
- 21.Festl R, Scharkow M, Quandt T. Problematic computer game use among adolescents, younger and older adults. Addiction. 2013 Mar;108(3):592–9. doi: 10.1111/add.12016. [DOI] [PubMed] [Google Scholar]
- 22.Quinones C, Kakabadse N. Self-concept clarity and compulsive Internet use: The role of preference for virtual interactions and employment status in British and North-American samples. J Behav Addict. 2015 Dec;4(4):289–98. doi: 10.1556/2006.4.2015.038. http://europepmc.org/abstract/MED/26690624. [DOI] [PMC free article] [PubMed] [Google Scholar]
- 23.Hamza A, Sharma M, Anand N, Marimuthu P, Thamilselvan P, Thakur P, Suma N, Baglari H, Singh P. Urban and rural pattern of Internet use among youth and its association with mood state. J Family Med Prim Care. 2019 Aug;8(8):2602–2606. doi: 10.4103/jfmpc.jfmpc_428_19. http://www.jfmpc.com/article.asp?issn=2249-4863;year=2019;volume=8;issue=8;spage=2602;epage=2606;aulast=Hamza. [DOI] [PMC free article] [PubMed] [Google Scholar]
- 24.Bonevski B, Regan T, Paul C, Baker AL, Bisquera A. Associations between alcohol, smoking, socioeconomic status and comorbidities: evidence from the 45 and Up Study. Drug Alcohol Rev. 2014 Mar 23;33(2):169–76. doi: 10.1111/dar.12104. [DOI] [PubMed] [Google Scholar]
- 25.Legleye S, Khlat M, Mayet A, Beck F, Falissard B, Chau N, Peretti-Watel P. From cannabis initiation to daily use: educational inequalities in consumption behaviours over three generations in France. Addiction. 2016 Oct;111(10):1856–66. doi: 10.1111/add.13461. [DOI] [PubMed] [Google Scholar]
- 26.Janssen E, Le Nézet O, Shah J, Chyderiotis S, Brissot A, Philippon A, Legleye S, Spilka S. Increasing socioeconomic disparities in tobacco smoking decline among French adolescents (2000-2017) J Public Health (Oxf) 2019 Nov 28; doi: 10.1093/pubmed/fdz135. [DOI] [PubMed] [Google Scholar]
- 27.Cannabis: Synthèse des connaissances. Observatoire français des drogues et des toxicomanies. 2017. [2017-12-27]. https://www.ofdt.fr/produits-et-addictions/de-z/cannabis/
- 28.Hasin D, Shmulewitz D, Sarvet A. Time trends in US cannabis use and cannabis use disorders overall and by sociodemographic subgroups: a narrative review and new findings. Am J Drug Alcohol Abuse. 2019;45(6):623–643. doi: 10.1080/00952990.2019.1569668. http://europepmc.org/abstract/MED/30870044. [DOI] [PMC free article] [PubMed] [Google Scholar]
- 29.Douchet MA. Use and quit rates of tobacco in France, 2019 Internet. Document in French. Observatoire FDDET. 2020. Feb, [2020-04-18]. https://www.ofdt.fr/ofdt/fr/tt_19bil.pdf.
- 30.Alcohol in France: thematic synthesis. Webpage in French. Observatoire Français des Drogues et Toxicomanies. 2018. [2020-04-18]. https://www.ofdt.fr/produits-et-addictions/de-z/alcool/
- 31.Davis CG, Thake J, Vilhena N. Social desirability biases in self-reported alcohol consumption and harms. Addict Behav. 2010 Apr;35(4):302–11. doi: 10.1016/j.addbeh.2009.11.001. [DOI] [PubMed] [Google Scholar]
Associated Data
This section collects any data citations, data availability statements, or supplementary materials included in this article.
Supplementary Materials
CHERRIES checklist.
The questionnaire used for the survey (in English).
Flowchart demonstrating how questionnaires were selected for the analyses.