Risk for transmission of severe acute respiratory syndrome coronavirus 2 (SARS-CoV-2) among close contacts of infected persons has not been well estimated. This study evaluates the risk for transmission of SARS-CoV-2 among a prospective cohort of 3410 close contacts in China exposed to 391 persons with COVID-19 infection according to different settings of exposure.
Visual Abstract. Contact Settings and Transmission Risk in Close Contacts of Patients With COVID-19.
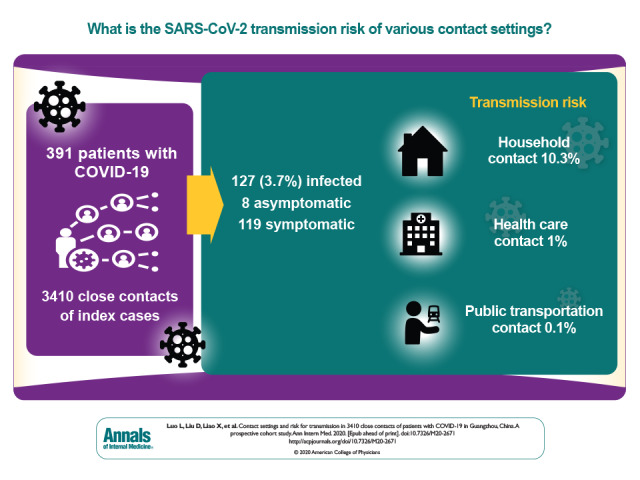
Risk for transmission of severe acute respiratory syndrome coronavirus 2 (SARS-CoV-2) among close contacts of infected persons has not been well estimated. This study evaluates the risk for transmission of SARS-CoV-2 among a prospective cohort of 3410 close contacts in China exposed to 391 persons with COVID-19 infection according to different settings of exposure.
Abstract
Background:
Risk for transmission of severe acute respiratory syndrome coronavirus 2 (SARS-CoV-2) to close contacts of infected persons has not been well estimated.
Objective:
To evaluate the risk for transmission of SARS-CoV-2 to close contacts in different settings.
Design:
Prospective cohort study.
Setting:
Close contacts of persons infected with SARS-CoV-2 in Guangzhou, China.
Participants:
3410 close contacts of 391 index cases were traced between 13 January and 6 March 2020. Data on the setting of the exposure, reverse transcriptase polymerase chain reaction testing, and clinical characteristics of index and secondary cases were collected.
Measurement: Coronavirus disease 2019 (COVID-19) cases were confirmed by guidelines issued by China. Secondary attack rates in different settings were calculated.
Results:
Among 3410 close contacts, 127 (3.7% [95% CI, 3.1% to 4.4%]) were secondarily infected. Of these 127 persons, 8 (6.3% [CI, 2.1% to 10.5%]) were asymptomatic. Of the 119 symptomatic cases, 20 (16.8%) were defined as mild, 87 (73.1%) as moderate, and 12 (10.1%) as severe or critical. Compared with the household setting (10.3%), the secondary attack rate was lower for exposures in healthcare settings (1.0%; odds ratio [OR], 0.09 [CI, 0.04 to 0.20]) and on public transportation (0.1%; OR, 0.01 [CI, 0.00 to 0.08]). The secondary attack rate increased with the severity of index cases, from 0.3% (CI, 0.0 to 1.0%) for asymptomatic to 3.3% (CI, 1.8% to 4.8%) for mild, 5.6% (CI, 4.4% to 6.8%) for moderate, and 6.2% (CI, 3.2% to 9.1%) for severe or critical cases. Index cases with expectoration were associated with higher risk for secondary infection (13.6% vs. 3.0% for index cases without expectoration; OR, 4.81 [CI, 3.35 to 6.93]).
Limitation:
There was potential recall bias regarding symptom onset among patients with COVID-19, and the symptoms and severity of index cases were not assessed at the time of exposure to contacts.
Conclusion:
Household contact was the main setting for transmission of SARS-CoV-2, and the risk for transmission of SARS-CoV-2 among close contacts increased with the severity of index cases.
Primary Funding Source:
Guangdong Province Higher Vocational Colleges and Schools Pearl River Scholar Funded Scheme.
Coronavirus disease 2019 (COVID-19) caused by severe acute respiratory syndrome coronavirus 2 (SARS-CoV-2) emerged in Wuhan, Hubei Province, China, in December 2019 and has since developed into a global pandemic (1). As of 26 May 2020, a total of 5 404 512 people have been infected, including 343 514 deaths worldwide, with 84 543 cases and 4645 deaths in China (2).
The viral, epidemiologic, and clinical characteristics of the disease have been documented (3–11). However, questions important for control of the epidemic remain (10), including the transmissibility of the virus, which patients are most likely to spread the virus, what contact setting is most likely to result in transmission, and the proportion of infected individuals who are asymptomatic.
To control the COVID-19 outbreak, China has implemented a series of measures to reduce transmission of SARS-CoV-2, including case surveillance and reporting, strengthening quarantine at ports of exit and entry, epidemiologic investigation and close contact management, treatment of patients with COVID-19 in designated hospitals, social distancing, mandatory mask wearing in public settings, financial support, and emergency material support (12). These measures were mandated during the study period.
We examined settings of COVID-19 transmission in a cohort study of 3410 close contacts of 391index cases of COVID-19 in Guangzhou, China.
Methods
Identification of Index Cases and Contact Tracing
Index cases were identified through surveillance testing, screening individuals with symptoms who presented to a health care facility, or tracing and screening close contact (Part 1 of the Supplement). During the COVID-19 outbreak period, health care facilities at all levels and of all types in China were obliged to identify COVID-19 cases and report them immediately via the online direct reporting system to Centers for Disease Control and Prevention (CDCs) in China. Upon receiving a report, the CDCs reviewed cases within 2 hours in the online direct reporting system. Once suspected cases (symptomatic, but not yet confirmed by laboratory testing), confirmed cases (symptomatic cases), and asymptomatic infected persons (asymptomatic cases) were verified and reported, the county or district CDCs completed an epidemiologic investigation of these cases within 24 hours, including contact tracing (13, 14). Close contacts are individuals who have had contact, without effective protection regardless of duration of exposure, with 1 or more persons with suspected or confirmed COVID-19 any time starting 2 days before onset of symptoms in persons with a suspected or confirmed case, or 2 days before sampling for laboratory testing of asymptomatic infected persons (14).
For close contact tracing on public transportation, a cell phone database based on the movements of the users was developed in China (12). By measuring and recording proximity events between individuals, it can immediately trace close contacts of diagnosed cases upon case confirmation (15). In this way, almost all of the close contacts of public transportation can be traced. A small of proportion of close contacts was difficult to trace owing to lack of cell phone data. Detailed information on definitions and close contact tracing is provided in Part 2 of the Supplement.
From 28 December 2019 to 5 March 2020, 3410 close contacts of 391 index cases (244 in Guangzhou and 147 in other regions) were identified and followed up by the Guangzhou CDC (GZCDC) from 13 January 2020 to 6 March 2020. The close contacts included in this study are the close contacts living in Guangzhou of these 391 index cases during the study period and do not include additional close contacts managed by other regional CDCs in China. Figure 1 shows the flowchart of COVID-19 cases and close contact management.
Figure 1. Study flow diagram.
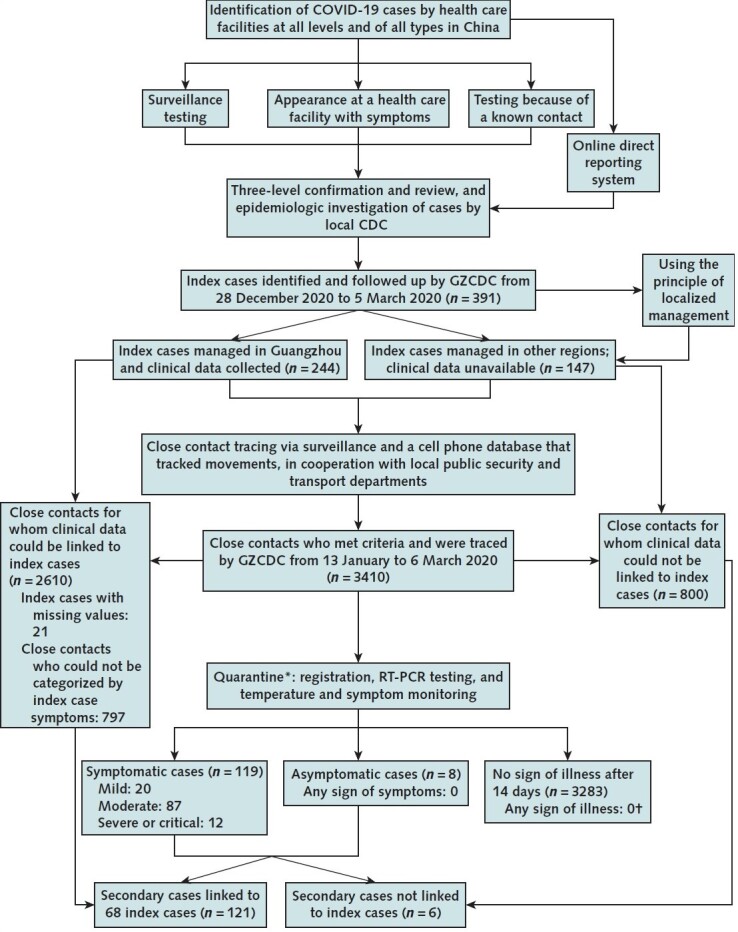
CDC = Centers for Disease Control and Prevention; COVID-19 = coronavirus disease 2019; GZCDC = Guangzhou Centers for Disease Control and Prevention; RT-PCR = reverse transcriptase polymerase chain reaction.
* Quarantine period was 14 d after the last unprotected contact with confirmed cases and infected persons.
† Followed until 6 April 2020.
Our study was based on the data from the work for an ongoing public health response to COVID-19 by GZCDC as required by the National Health Commission of China, and hence individual informed consent was waived. The study was determined not to be human subjects research and therefore was considered exempt from ethical approval after consultation with the ethics committee of GZCDC. Analytical data sets were constructed in an anonymized manner, and all analysis of personally identifiable data took place onsite at the GZCDC.
Data Collected From the Index Cases
The information collected for 244 index cases in Guangzhou included demographic characteristics (age and sex), severity, clinical symptoms at onset (fever, dry cough, expectoration, fatigue, myalgia, and diarrhea), radiologic examinations (chest CT), and blood examinations (leukocyte count, lymphocyte percentage, and neutrophilic granulocyte percentage). Clinical data on the 147 index cases from regions other than Guangzhou were unavailable, and therefore their 800 close contacts inside Guangzhou could not be categorized by severity and symptoms of the index cases. In addition, no information on symptoms for 21 index cases in Guangzhou, and thus their 797 close contacts could not be categorized by symptoms of the index cases.
Exposure Settings of Close Contacts
Upon identification, information about the setting of exposure to the index case was obtained and classified into 5 categories: household, public transportation, health care settings, entertainment venues or workplaces, and multiple settings. “Multiple settings” indicates exposure in more than 1 contact setting. Index cases were quarantined before diagnosis if they were suspected cases, and household contacts were separated from the index cases before diagnosis was made in the index cases.
Monitoring and Evaluation of Close Contacts
After identification, close contacts were quarantined for 14 days from last contact with index cases and followed up clinically after quarantine until 6 April 2020. For example, if an individual was traced on the fourth day after the last unprotected contact, this individual was required to be medically observed for 10 days. The quarantine period was extended for 337 close contacts for whom real-time fluorescence-based reverse transcriptase polymerase chain reaction (RT-PCR) testing was delayed.
During the quarantine period, monitoring of clinical symptoms and RT-PCR assay of SARS-CoV-2 nucleic acid was performed approximately every 24 hours. Specimens for RT-PCR testing were obtained from the upper (nasopharyngeal and oropharyngeal swabs) and lower respiratory (sputum) tracts by trained CDC staffs and were sent to GZCDC for testing. The RT-PCR testing was performed by qualified staff, and results were identified through open reading frame 1ab (ORF1ab) and nucleocapsid protein (N) in accordance with the protocol established by the Chinese CDC (16). Details of the laboratory processes are provided in Part 3 of the Supplement. For close contacts who tested positive on RT-PCR, radiologic and blood examinations were conducted; these included chest radiography or CT, complete blood count, coagulation profile, serum biochemical tests (renal and liver function, creatine kinase, lactate dehydrogenase, and electrolytes), myocardial enzymes, interleukin-6), serum ferritin, and procalcitonin (17).
The symptoms that were monitored mainly included fever and respiratory symptoms (for example, dry cough and expectoration). Monitoring was performed by the staff of the medical observation institution during daily in-person visits (14).
Close contacts who tested negative on RT-PCR and remained symptom-free were released after the quarantine period. Those who developed symptoms but tested negative throughout the quarantine period on RT-PCR received radiologic examinations and serologic COVID-19–specific IgM and IgG examinations. If the examinations were all negative, they were released from quarantine and followed for the development of symptoms by staff in their communities via weekly in-person visits through 6 April 2020. Close contacts who developed symptoms during the follow-up period after release from quarantine were retested.
Outcomes
The main outcome was COVID-19 infection in close contacts during the follow-up period. These included asymptomatic cases and symptomatic cases, which were defined on the basis of guidelines issued by the National Health Commission of the People's Republic of China (13, 17). Detailed definitions of these 2 outcomes are provided in Part 1 of the Supplement.
In brief, an asymptomatic case (13) was defined as an individual without clinical manifestations and with etiologic detection of SARS-CoV-2 in respiratory specimens (that is, RT-PCR–positive) or specific IgM detected in serum. After a quarantine period of 14 days, asymptomatic infected persons were followed up until 6 April 2020 to confirm whether symptoms occurred. A symptomatic case (13) was defined as a suspected case on the basis of symptoms and epidemiologic history (Part 1 of the Supplement) and 1 of the following etiologic or serologic findings: 1) a positive result for SARS-CoV-2 nucleic acid on RT-PCR; 2) a viral gene identified by gene sequencing that was highly homologous with known SARS-CoV-2; or 3) detectable SARS-CoV-2–specific IgM and IgG in serum, or at least a 4-fold increase in IgG between paired acute and convalescent sera. Symptomatic cases were categorized as mild, moderate, severe, and critical (17) (Part 1 of the Supplement).
Linkage of Secondary Cases to Index Cases
To show the difference between identifying cases through presenting symptoms versus intensive surveillance of a close contact, we attempted to pair every secondary case with their index case and compared their clinical characteristics. If a secondary case was in contact with 2 or more index cases, we linked the secondary case to the earliest index case. Secondary cases were unlikely to have been co–index cases because they did not share the same primary infection exposure as the index case during the contact tracing episode.
Statistical Analysis
The secondary attack rate of COVID-19 was estimated by dividing the number of asymptomatic or symptomatic secondary cases by the number of close contacts for that exposure setting compared with different contact exposure groups. Categorical variables were calculated as numbers (percentages). Skewed and normally distributed continuous variables were calculated as the median (interquartile range [IQR]) or mean (SD), respectively. To minimize the potential for inferential bias and to maximize the decreased statistical power due to exclusion of participants with missing covariate data, we used the multiple imputation with chained equations to impute missing covariate values, and 20 data sets were imputed (18). All variables including outcomes were included in the multiple imputation model.
Generalized estimating equations (19) taking into account clustering by index cases were performed to estimate odds ratios (ORs) and 95% CIs for associations of potential factors with the risk for SARS-CoV-2 infection:

Where Vi = working covariance matrix (), Ri (α) = working correlated matrix, and Ai = T-dimensional diagonal matrix.
Age (0 to 17 years, 18 to 44 years, 45 to 59 years, or ≥60 years), sex, exposure setting, severity of index cases, and symptoms in index cases (fever, dry cough, expectoration, fatigue, and myalgia) were included in the multivariable model.
All analyses were performed by using SAS software, version 9.4, for Windows. Statistical tests were 2-sided, and P values less than 0.05 were considered statistically significant.
Role of the Funding Source
The study was funded by the Guangdong Province Higher Vocational Colleges and Schools Pearl River Scholar Funded Scheme, the National Natural Science Foundation of China, the Construction of High-level University of Guangdong, and the Zhejiang University Special Scientific Research Fund for COVID-19 Prevention and Control. The funders had no role in study design, data collection and analysis, preparation of the manuscript, or the decision to submit the manuscript for publication.
Results
Characteristics of Close Contacts and COVID-19 Cases
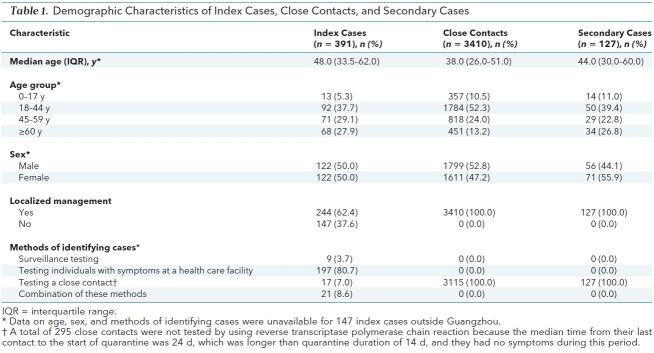
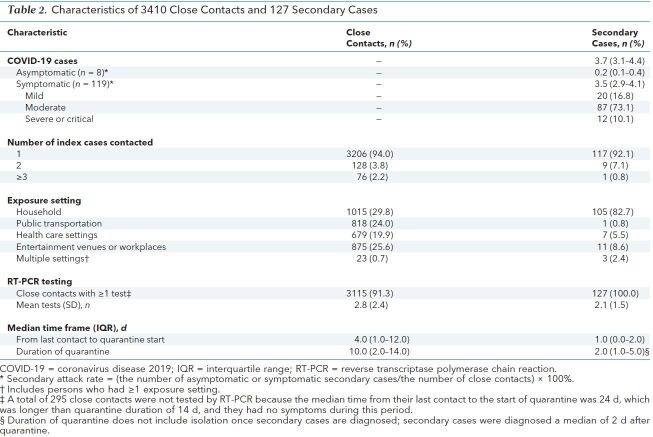
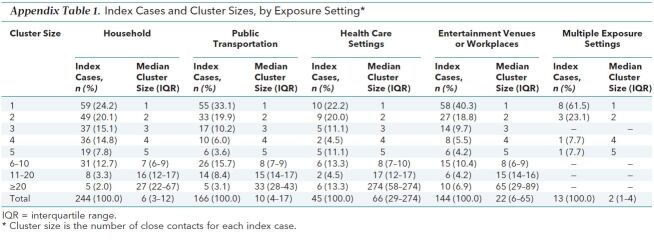
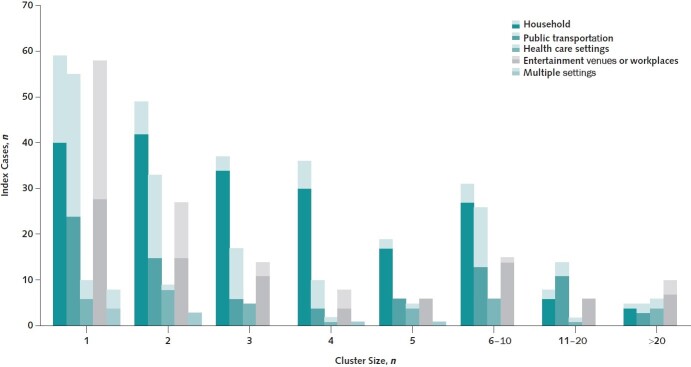
We collected data from 3410 close contacts in Guangzhou who were linked to 391 index cases (244 index cases in Guangzhou and 147 in other regions). Table 1 shows demographic characteristics of index cases, close contacts, and secondary cases. Among 3410 close contacts, 1799 (52.8%) were male, and the median age was 38.0 years (IQR, 26.0 to 51.0 years). Of these3410 close contacts, 127 (3.7% [95% CI, 3.1% to 4.4%]) were secondarily infected; 8 (0.2% [CI, 0.1% to 0.4%]) were asymptomatic and 119 (3.5% [CI, 2.9% to 4.1]) were symptomatic. Of the 119 symptomatic cases, 20 (16.8%) presented with mild symptoms, 87 (73.1%) with moderate symptoms, and 12 (10.1%) with severe or critical symptoms. Of the secondary cases, the majority (105 [82.7%]) occurred via household contact (Table 2). The basic characteristics and distribution of clusters in each exposure setting are summarized in Appendix Tables 1 and 2. The distribution of clusters according to the number of index cases is shown in Figure 2.
Table 1. Demographic Characteristics of Index Cases, Close Contacts, and Secondary Cases.
Table 2. Characteristics of 3410 Close Contacts and 127 Secondary Cases.
Appendix Table 1. Index Cases and Cluster Sizes, by Exposure Setting*.
Appendix Table 2. Distribution of Clusters, Close Contacts, and Secondary Cases, by Cluster Size and Exposure Setting*.
Figure 2. Distribution of clusters according to the number of index cases.
In each bar, the light and dark portions indicated the number of index cases outside and inside Guangzhou, respectively.
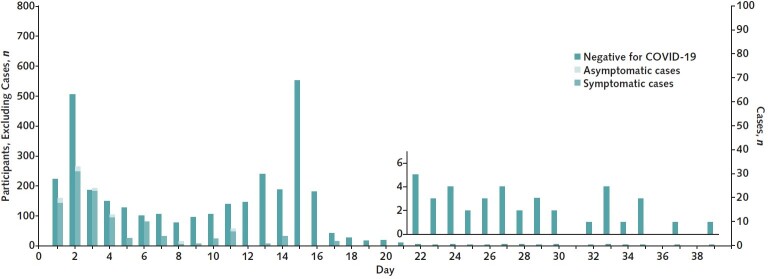
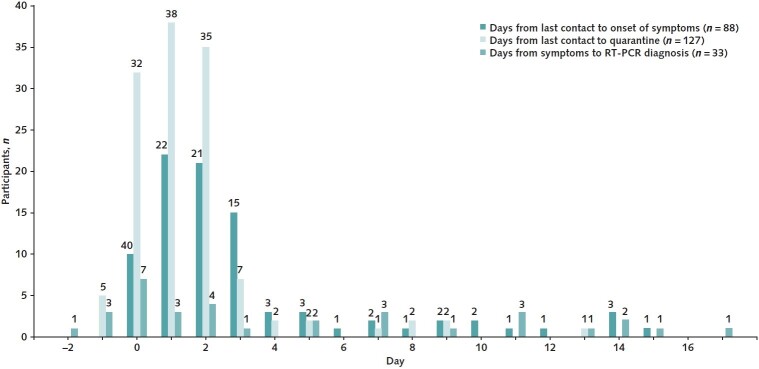
Because of the lag in identification of close contacts, the median time from last contact to the start of quarantine was 4.0 days (IQR, 1.0 to 12.0 days); thus, the 3410 close contacts were only quarantined for a median of 10.0 days (IQR, 2.0 to 14.0 days) (Table 2 and Appendix Figure 1). Furthermore, the 127 close contacts in whom asymptomatic or symptomatic cases were diagnosed ended quarantine after a median of 2.0 days (IQR, 1.0 to 5.0 days) because most of them received a diagnosis within 2 days of the start of quarantine and were transferred to designated hospitals in a timely manner. For close contacts in whom symptomatic cases were diagnosed, the median time from last contact to symptom onset was 2.0 days (IQR, 1.0 to 3.0 days) (Appendix Figure 2). All secondary cases were confirmed by RT-PCR testing, and the mean number of RT-PCR assays was 2.8 (SD, 2.4).
Appendix Figure 1. Distribution of quarantine duration among 3410 close contacts and 127 secondary cases.
Day 1 is the start of quarantine. The quarantine period was extended for 337 close contacts in whom reverse transcriptase polymerase chain reaction testing was delayed. COVID-19 = coronavirus disease 2019.
Appendix Figure 2. Distribution of days from last contact to symptoms onset and quarantine start, and days from symptoms onset to RT-PCR diagnosis among secondary cases.
For days from last contact to symptoms onset, a total of 31 symptomatic cases with symptoms before the last contact and 8 asymptomatic cases were excluded; for days from symptoms to RT-PCR diagnosis, a total of 55 secondary cases who were tested positive on RT-PCR at the first time were further excluded. RT-PCR = reverse transcriptase polymerase chain reaction.
Exposure Settings and Factors Associated With Risk for Transmission
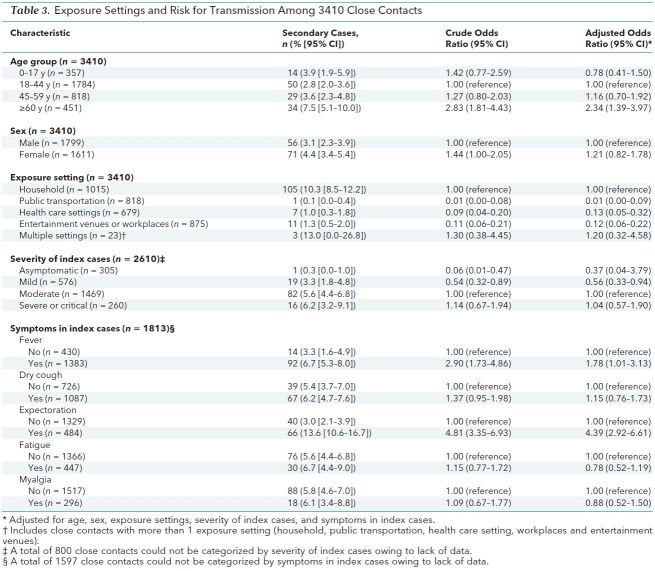
Table 3 shows the association between various factors and risk for SARS-CoV-2 infection among close contacts of index cases before and after adjustment. A higher percentage of females than males (4.4% [CI, 3.4% to 5.4%] vs. 3.1% [CI, 2.3% to 3.9%]) were infected, but this difference was not statistically significant on multivariate analysis. In terms of exposure setting, household contacts had a higher risk for secondary infection (10.3% [CI, 8.5% to 12.2%]) than did persons who were exposed in health care settings (1.0% [CI, 0.3% to 1.8%]; OR, 0.09 [CI, 0.04 to 0.20]) and those who were exposed on public transportation (0.1% [CI, 0.0% to 0.4%]; OR, 0.01 [CI, 0.00 to 0.08]).
Table 3. Exposure Settings and Risk for Transmission Among 3410 Close Contacts.
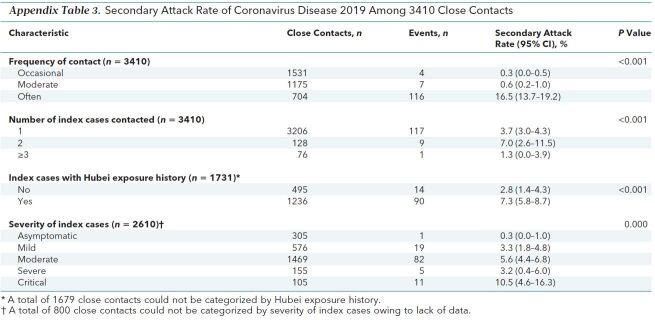
The secondary attack rate increased with the severity of index cases, from 0.3% (CI, 0.0 to 1.0%) for asymptomatic to 3.3% (CI, 1.8% to 4.8%) for mild, 5.6% (CI, 4.4% to 6.8%) for moderate, and 6.2% (CI, 3.2% to 9.1%) for severe or critical cases (P for trend < 0.001). Manifestation of certain symptoms, such as fever (6.7% [CI, 5.3 to 8.0] vs. 3.3% [CI, 1.6 to 4.9]) and expectoration (13.6% [CI, 10.6 to 16.7] vs. 3.0% [CI, 2.1 to 3.9]), in the index cases was associated with an increased risk for infection in their close contacts. The frequency of contact and number of index cases contacted were not separately assessed owing to multicollinearity with household contacts; the incidence of COVID-19 by these 2 variables is shown in Appendix Table 3.
Appendix Table 3. Secondary Attack Rate of Coronavirus Disease 2019 Among 3410 Close Contacts.
Clinical Characteristics of Index Cases and Secondary Cases
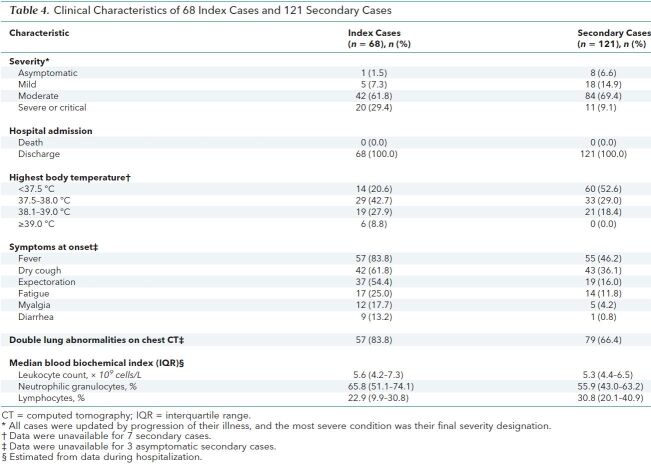
A total of 121 secondary cases were successfully linked to their 68 index cases, and 6 secondary cases were not successfully linked because their index cases were outside Guangzhou and we had no detailed information for them. Compared with their 68 index cases, the 121 secondary cases were in general clinically milder and were less likely to manifest such common symptoms as fever, cough, expectoration, fatigue, myalgia, and diarrhea (Table 4). Secondary cases were also less likely than index cases to demonstrate radiologic and laboratory alterations related to the infection (Table 4).
Table 4. Clinical Characteristics of 68 Index Cases and 121 Secondary Cases.
Discussion
We found that the secondary attack rate was less than 4% among close contacts of persons with COVID-19. Secondary infections acquired while using public transportation were rare; in contrast, 1 in 10 household contacts was found to be infected. Moreover, we found that patients with more clinically severe disease were more likely to infect their close contacts than were less severe index cases; asymptomatic cases were least likely to infect their close contacts. Manifestation of certain symptoms, such as expectoration, in index cases was also associated with an increased risk for infection in their close contacts.
The secondary attack rate of COVID-19 among household contacts was 10.3% in our study, which was consistent with secondary attack rates of 11.2% in other cities in China (20) and 10.5% in the United States (21). In China, the quarantine of household contacts started immediately in designated places by local CDCs after index cases were diagnosed. which may have resulted in a relative lower secondary attack rate among household contacts compared with published studies in other countries (21, 22). However, the risk for secondary infection via household contact was still highest compared with other contact settings because people spent more time at home, which led to more frequent and longer unprotected exposure than the other contact settings. Another explanation is that mask wearing to prevent infection was mandatory in public settings but not in households during the study period. Thus, effective measures to reduce household transmission and quarantine of household contacts are extremely important.
In addition, we found that the risk for transmission via public transportation or healthcare settings was low. Although the risk for infection in any individual who shared public transportation with an infected person is low, the large numbers of people on public transportation and the difficulty in identifying all close contacts may lead to a great number of persons being infected in this setting.
Our results showed that patients with COVID-19 who had more severe symptoms had a higher transmission capacity, whereas transmission capacity from asymptomatic cases was limited. This supports the view of the World Health Organization that asymptomatic cases were not the major drivers of the overall epidemic dynamics (12). This mechanism may be that COVID-19 cases with more severe symptoms might carry a higher viral load of SARS-CoV-2 and thus have greater transmission capacity (22). Consistent with previous studies (23–26), we also found that clinical symptoms at onset were more severe in index cases than in secondary cases. This phenomenon may be explained by selection bias and regression to the mean, reflecting the difference between identifying cases through presenting symptoms versus intensive surveillance of a close contact. The severity of symptoms in secondary cases is probably more reflective of the true severity profile of COVID-19, given the systematic identification of secondary cases.
Our study has limitations. First, some of the estimates had wide CIs, and thus some clinically important point estimates (for example, the OR of 1.37 [CI, 0.95 to 1.98] for the infectiousness of index cases with dry cough) could not be statistically distinguished from a null effect. Second, different countries implemented different measures to control the COVID-19 outbreak. The measures in China mainly included case surveillance and reporting, epidemiologic investigation and close contact management, treatment of COVID-19 cases in designated hospitals, social distancing, and mask wearing in public settings. These measures may influence the secondary attack rate among close contacts and the generalization of our results. Finally, symptoms and severity in index cases were not assessed at time of exposure to contacts, and recall bias of symptoms at onset among index cases and secondary cases may exist.
In conclusion, we found that the secondary attack rate of COVID-19 was relatively low, and household contacts were at higher risk for infection. Moreover, patients with more clinically severe cases or those with symptoms were more likely to infect their close contacts.
Supplementary Material
Footnotes
This article was published at Annals.org on 13 August 2020
* Dr. Luo, Dr. D. Liu, Mr. Liao, and Dr. Wu contributed equally.
References
- 1. World Health Organization. Statement on the second meeting of the International Health Regulations (2005) Emergency Committee regarding the outbreak of novel coronavirus (2019-nCoV). 30 January 2020. Accessed at www.who.int/news-room/detail/30-01-2020-statement-on-the-second-meeting-of-the-international-health-regulations-(2005)-emergency-committee-regarding-the-outbreak-of-novel-coronavirus-(2019-ncov) on 10 March 2020.
- 2. World Health Organization. Coronavirus disease 2019 (COVID-19). Situation report—127. 26 May 2020. Accessed at www.who.int/docs/default-source/coronaviruse/situation-reports/20200526-covid-19-sitrep-127.pdf?sfvrsn=7b6655ab_8 on 27 May 2020.
- 3. Chan JF, Yuan S, Kok KH, et al. A familial cluster of pneumonia associated with the 2019 novel coronavirus indicating person-to-person transmission: a study of a family cluster. Lancet. 2020;395:514-523. [PMID: 31986261] doi:10.1016/S0140-6736(20)30154-9 [DOI] [PMC free article] [PubMed]
- 4. Guan WJ, Ni ZY, Hu Y, et al; China Medical Treatment Expert Group for Covid-19. Clinical characteristics of coronavirus disease 2019 in China. N Engl J Med. 2020;382:1708-1720. [PMID: 32109013] doi:10.1056/NEJMoa2002032 [DOI] [PMC free article] [PubMed]
- 5. Chen N, Zhou M, Dong X, et al. Epidemiological and clinical characteristics of 99 cases of 2019 novel coronavirus pneumonia in Wuhan, China: a descriptive study. Lancet. 2020;395:507-513. [PMID: 32007143] doi:10.1016/S0140-6736(20)30211-7 [DOI] [PMC free article] [PubMed]
- 6. Zhou F, Yu T, Du R, et al. Clinical course and risk factors for mortality of adult inpatients with COVID-19 in Wuhan, China: a retrospective cohort study. Lancet. 2020;395:1054-1062. [PMID: 32171076] doi:10.1016/S0140-6736(20)30566-3 [DOI] [PMC free article] [PubMed]
- 7. Pan X, Chen D, Xia Y, et al. Asymptomatic cases in a family cluster with SARS-CoV-2 infection [Letter]. Lancet Infect Dis. 2020;20:410-411. [PMID: 32087116] doi:10.1016/S1473-3099(20)30114-6 [DOI] [PMC free article] [PubMed]
- 8. Arashiro T, Furukawa K, Nakamura A. COVID-19 in 2 persons with mild upper respiratory tract symptoms on a cruise ship, Japan. Emerg Infect Dis. 2020;26:1345-1348. [PMID: 32118533] doi:10.3201/eid2606.200452 [DOI] [PMC free article] [PubMed]
- 9. Xu Y, Li X, Zhu B, et al. Characteristics of pediatric SARS-CoV-2 infection and potential evidence for persistent fecal viral shedding. Nat Med. 2020;26:502-505. [PMID: 32284613] doi:10.1038/s41591-020-0817-4 [DOI] [PMC free article] [PubMed]
- 10. Cowling BJ, Leung GM. Epidemiological research priorities for public health control of the ongoing global novel coronavirus (2019-nCoV) outbreak. Euro Surveill. 2020;25. [PMID: 32046814] doi:10.2807/1560-7917.ES.2020.25.6.2000110 [DOI] [PMC free article] [PubMed]
- 11. Wu Z, McGoogan JM. Characteristics of and important lessons from the coronavirus disease 2019 (COVID-19) outbreak in China: summary of a report of 72 314 cases from the Chinese Center for Disease Control and Prevention. JAMA. 2020. [PMID: 32091533] doi:10.1001/jama.2020.2648 [DOI] [PubMed]
- 12. World Health Organization. Report of the WHO-China Joint Mission on Coronavirus Disease 2019 (COVID-19). 28 February 2020. Accessed at www.who.int/publications/i/item/report-of-the-who-china-joint-mission-on-coronavirus-disease-2019-(covid-19) on 10 April 2020.
- 13. National Health Commission of the People's Republic of China. Protocol for prevention and control of COVID-19 (edition 6). 11 March 2020. Accessed at http://weekly.chinacdc.cn/en/article/doi/10.46234/ccdcw2020.082 on 20 April 2020. [DOI] [PMC free article] [PubMed]
- 14. Chinese Center for Disease Control and Prevention. Guidelines for investigation and management of close contacts of COVID-19 cases. 15 March 2020. Accessed at http://weekly.chinacdc.cn/en/article/doi/10.46234/ccdcw2020.084 on 20 April 2020. [DOI] [PMC free article] [PubMed]
- 15. Ferretti L, Wymant C, Kendall M, et al. Quantifying SARS-CoV-2 transmission suggests epidemic control with digital contact tracing. Science. 2020;368. [PMID: 32234805] doi:10.1126/science.abb6936 [DOI] [PMC free article] [PubMed]
- 16. Chinese Center for Disease Control and Prevention. Technical guidelines for COVID-19 laboratory testing. 13 March 2020. Accessed at http://weekly.chinacdc.cn/en/article/doi/10.46234/ccdcw2020.085 on 10 April 2020. [DOI] [PMC free article] [PubMed]
- 17. National Health Commission of the People's Republic of China. [Chinese clinical guidance for COVID-19 pneumonia diagnosis and treatment (edition 6)] [in Chinese]. Accessed at www.nhc.gov.cn/yzygj/s7653p/202002/8334a8326dd94d329df351d7da8aefc2/files/b218cfeb1bc54639af227f922bf6b817.pdf on 6 March 2020.
- 18. Romaniuk H, Patton GC, Carlin JB. Multiple imputation in a longitudinal cohort study: a case study of sensitivity to imputation methods. Am J Epidemiol. 2014;180:920-32. [PMID: 25301814] doi:10.1093/aje/kwu224 [DOI] [PubMed]
- 19. Liang KY, Zeger SL. Longitudinal data analysis using generalized linear models. Biometrika. 1986;73:13-22. doi:10.1093/biomet/73.1.13
- 20. Bi Q, Wu Y, Mei S, et al. Epidemiology and transmission of COVID-19 in 391 cases and 1286 of their close contacts in Shenzhen, China: a retrospective cohort study. Lancet Infect Dis. 2020;20:911-919. [PMID: 32353347] doi:10.1016/S1473-3099(20)30287-5 [DOI] [PMC free article] [PubMed]
- 21. Burke RM, Midgley CM, Dratch A, et al. Active monitoring of persons exposed to patients with confirmed COVID-19 - United States, January-February 2020. MMWR Morb Mortal Wkly Rep. 2020;69:245-246. [PMID: 32134909] doi:10.15585/mmwr.mm6909e1 [DOI] [PMC free article] [PubMed]
- 22. Park SY, Kim YM, Yi S, et al. Coronavirus disease outbreak in call center, South Korea. Emerg Infect Dis. 2020;26:1666-1670. [PMID: 32324530] doi:10.3201/eid2608.201274 [DOI] [PMC free article] [PubMed]
- 23. Xu XW, Wu XX, Jiang XG, et al. Clinical findings in a group of patients infected with the 2019 novel coronavirus (SARS-Cov-2) outside of Wuhan, China: retrospective case series. BMJ. 2020;368:m606. [PMID: 32075786] doi:10.1136/bmj.m606 [DOI] [PMC free article] [PubMed]
- 24. Yang W, Cao Q, Qin L, et al. Clinical characteristics and imaging manifestations of the 2019 novel coronavirus disease (COVID-19): a multi-center study in Wenzhou city, Zhejiang, China. J Infect. 2020;80:388-393. [PMID: 32112884] doi:10.1016/j.jinf.2020.02.016 [DOI] [PMC free article] [PubMed]
- 25. Xu T, Chen C, Zhu Z, et al. Clinical features and dynamics of viral load in imported and non-imported patients with COVID-19. Int J Infect Dis. 2020;94:68-71. [PMID: 32179140] doi:10.1016/j.ijid.2020.03.022 [DOI] [PMC free article] [PubMed]
- 26. Kim KH, Tandi TE, Choi JW, et al. Middle East respiratory syndrome coronavirus (MERS-CoV) outbreak in South Korea, 2015: epidemiology, characteristics and public health implications. J Hosp Infect. 2017;95:207-213. [PMID: 28153558] doi:10.1016/j.jhin.2016.10.008 [DOI] [PMC free article] [PubMed]
Associated Data
This section collects any data citations, data availability statements, or supplementary materials included in this article.


