

Abstract
While brown adipose tissue (BAT) is well‐recognized for its ability to dissipate energy in the form of heat, recent studies suggest multifaced roles of BAT in the regulation of glucose and lipid homeostasis beyond stimulating thermogenesis. One of the functions involves interorgan communication with metabolic organs, such as the liver, through BAT‐derived secretory factors, a.k.a., batokine. However, the identity and the roles of such mediators remain insufficiently understood. Here, we employed proteomics and transcriptomics in human thermogenic adipocytes and identified previously unappreciated batokines, including phospholipid transfer protein (PLTP). We found that increased circulating levels of PLTP, via systemic or BAT‐specific overexpression, significantly improve glucose tolerance and insulin sensitivity, increased energy expenditure, and decrease the circulating levels of cholesterol, phospholipids, and sphingolipids. Such changes were accompanied by increased bile acids in the circulation, which in turn enhances glucose uptake and thermogenesis in BAT. Our data suggest that PLTP is a batokine that contributes to the regulation of systemic glucose and lipid homeostasis as a mediator of BAT‐liver interorgan communication.
Keywords: brown adipose tissue, interorgan communication, lipid homeostasis
Subject Categories: Metabolism
Phospholipid transfer protein (PLTP) released from BAT controls energy expenditure and systemic glucose/lipid homeostasis. The metabolic benefit of PLTP is mediated through a BAT‐liver interorgan communication that involves the regulation of lipoproteins and bile acids.
Introduction
Historically, brown adipose tissue (BAT) was viewed merely as a heat generation through the action of uncoupling protein 1 (UCP1), a mitochondrial protein that uncouples proton gradient across the mitochondrial membrane from ATP synthesis (Kajimura & Saito, 2014). However, emerging evidence suggests that the role of BAT is far more complex than stimulating thermogenesis. For instance, BAT serves as a significant metabolic sink for glucose, fatty acids, and branched‐chain amino acid (BCAA), and such function significantly contributes to the regulation of systemic glucose and lipid homeostasis (Bartelt et al, 2011; Kajimura et al, 2015; Chondronikola et al, 2016; Yoneshiro et al, 2019). Notably, BAT maintains active glucose uptake even in UCP1 null mice (Ikeda et al, 2017; Olsen et al, 2017), indicating that the metabolic‐sink function of BAT involves multiple mechanisms other than UCP1‐mediated thermogenesis.
A growing number of studies suggest that, besides its well‐known thermogenic role, BAT functions as a secretory organ (Villarroya et al, 2017). For example, BAT secretes vascular endothelial growth factor A (VEGFA) and nerve growth factor (NGF) that act as paracrine/autocrine factors to enhance its thermogenic activity by remodeling of the vascular bed and sympathetic innervation (Nisoli et al, 1996; Mahdaviani et al, 2016). Furthermore, BAT secretes S100b that stimulates neurite outgrowth from sympathetic neurons (Zeng et al, 2019). Besides these paracrine/autocrine factors, BAT secretes endocrine molecules: Transplantation of BAT from healthy donor mice to obese or diabetic mice leads to an improvement in insulin sensitivity and glucose homeostasis, and such action is mediated in part by the secretion of IL6 from BAT (Stanford et al, 2013; Liu et al, 2015). BAT also secretes neuregulin 4 (Nrg4) that acts on the liver to inhibit hepatic lipogenic signaling (Wang et al, 2014), whereas BAT secretes myostatin that negatively controls skeletal muscle function (Kong et al, 2018). In addition to these polypeptides, BAT releases exosomal microRNAs and lipids, such as 12,13‐diHOME, that control systemic glucose and lipid homeostasis (Lynes et al, 2017; Thomou et al, 2017).
It is conceivable that multiple BAT‐derived factors, a.k.a. batokine, including the above‐mentioned factors and uncharacterized molecules, act in concert or independently to communicate with metabolic organs to regulate systemic glucose and lipid homeostasis. Thus, the comprehension of human batokines would be significant because the reconstitution of such factors may be a therapeutically tractable strategy to ameliorate glucose intolerance, insulin resistance, or dyslipidemia. To search for previously unappreciated batokines, we employed proteomics and transcriptomics in human differentiated adipocytes. To embark this project, we took advantage of clonally derived thermogenic adipocytes that we previously isolated from adult human BAT (Shinoda et al, 2015). We subsequently characterized the metabolic function of the identified human batokines in obese mouse models.
Results
Identification of human batokines by proteomics and transcriptomics
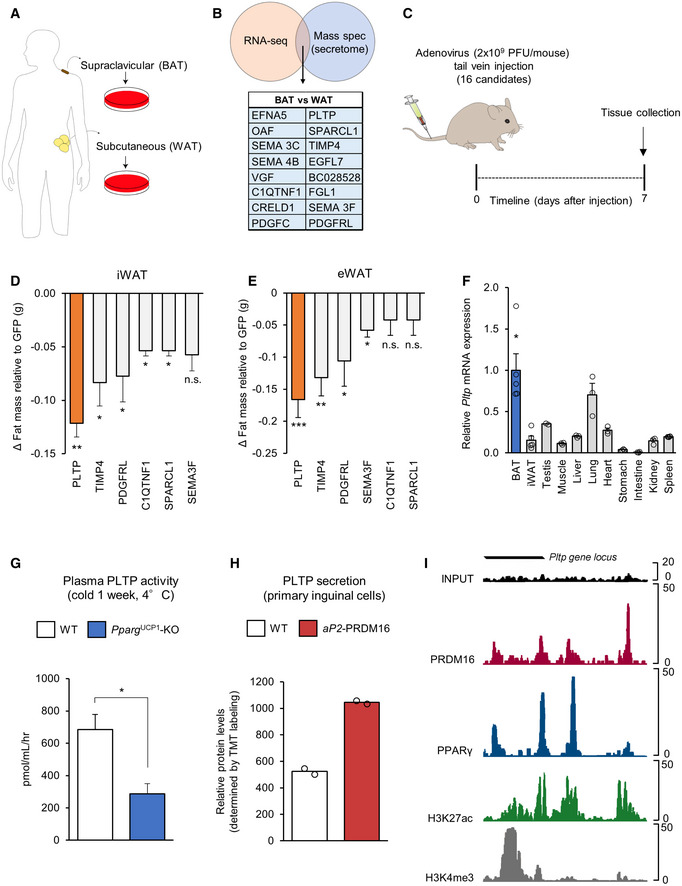
We performed proteomics analyses of culture supernatants of clonally derived human thermogenic adipocytes (beige‐like adipocytes) isolated from the supraclavicular BAT region and white adipocytes from subcutaneous white adipose tissue (WAT) (Shinoda et al, 2015) (Fig 1A). Subsequently, we combined the proteomics data to our RNA‐sequencing database to validate the results. In the analyses, we chose the candidates that were highly expressed in beige adipocytes relative to white adipocytes and contained a secretory signal peptide, while lacking the transmembrane domains. The bioinformatic analysis identified 16 highly secreted candidates (fold change ≥ 5) from human beige adipocytes (Fig 1B). The candidates included several previously unappreciated secreted factors, such as the phospholipid transfer protein (PLTP), EGF‐like domain multiple 7 (EGFL7), platelet‐derived growth factor C (PDGFC), TIMP metallopeptidase inhibitor 4 (TIMP4), cysteine‐rich EGF‐like domains 1 (CRELD1), platelet‐derived growth factor receptor like (PDGFRL), C1q and tumor necrosis factor‐related protein 1 (C1QTNF1), secreted protein acidic and cysteine‐rich‐like protein 1 (SPARCL1), ephrin A5 (EFNA5), semaphorin 3c (SEMA3C), semaphorin 3f (SEMA3F), semaphorin 4b (SEMA4B), vascular growth factor (VGF), out at first homolog (OAF), fibrinogen‐like 1 (FGL1) and the non‐annotated BC028528. The majority of the candidates (87.5%, 14/16) were highly expressed in differentiated brown adipocytes relative to stromal cells (Table EV1).
Figure 1. Identification of human batokines by proteomics and transcriptomics.
-
ASchematic illustration of the experiment. Clonal human brown and white adipocytes were subjected to RNA sequencing and mass spectrometry.
-
BBioinformatic analysis defined 16 secreted candidates (fold change ≥ 5) from brown compared to white adipocytes.
-
CSchematic illustration of the experiment. C57Bl/6 mice (11 weeks old) received adenovirus (2 × 10⁹ PFU/mouse) for each candidate via tail‐vein. GFP adenovirus was used as a control. Seven days after adenovirus infection, mice were euthanized and inguinal (iWAT) and epididymal (eWAT) white fat were weighed. n = 5 for all the candidates and control.
-
DChanges (Δg) in inguinal WAT (iWAT) mass of mice in (C). n = 5. *P < 0.05, **P < 0.01 relative to GFP by Student's t‐test. N.S., not significant.
-
EChanges (Δg) in epididymal WAT (eWAT) mass of mice in (C). n = 5. *P < 0.05, **P < 0.01, ***P < 0.001 relative to GFP by Student's t‐test. N.S., not significant.
-
FExpression of Pltp mRNA in indicated tissues. Data are shown by relative Pltp mRNA levels normalized by 18s expression. n = 3 for all tissues (except BAT and WAT n = 5, testis n = 2). *P < 0.05 Pltp expression in BAT vs other tissues (except testis and lung) by Student's t‐test.
-
GPlasma PLTP activity from control (Pparg flox/flox) and BAT‐less mice (Pparg UCP1‐KO, Ucp1‐Cre × Pparg flox/flox). Following 6‐h fasting, plasma was obtained from Pparg UCP1‐KO mice and littermate control. n = 3 for both groups. *P < 0.05 relative to control mice by Student's t‐test.
-
HPLTP protein levels in the culture conditioned medium from primary differentiated inguinal adipocytes of wild‐type (WT) and aP2‐PRDM16 mice (Svensson et al, 2016). Peptide levels were determined by quantitative proteomics. n = 2 for both groups.
-
ITranscriptional regulation of the Pltp gene by PRDM16 and PPARγ. ChIP‐seq data for PRDM16 and PPARγ were obtained from (Siersbaek et al, 2012; Harms et al, 2015), respectively.
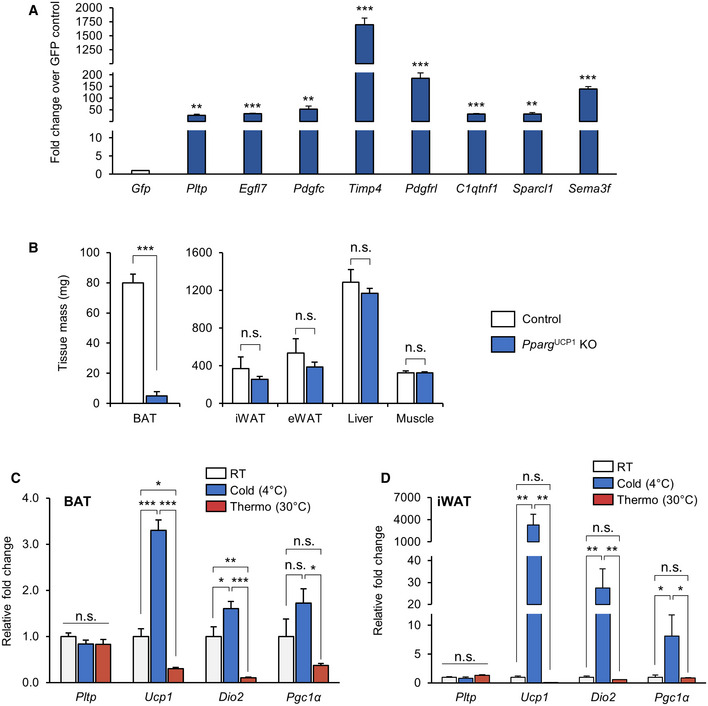
To screen the metabolic roles of these candidates in vivo, we next used a gain‐of‐function approach by injecting adenovirus (2 × 10⁹ PFU/mouse) expressing each candidate via tail‐vein to wild‐type mice. Adenovirus expressing GFP was used as a control. This method generally results in robust expression of proteins in the liver and secretion to the plasma (Fig EV1A). As a readout of the assay, we measured tissue mass of the inguinal WAT (iWAT) and epididymal WAT (eWAT) of mice that expressed each candidate in the liver at significant levels (Fig 1C). The in vivo screening identified several candidates, including PLTP, TIMP4, and PDGFRL, that significantly reduced adipose tissue weight for both iWAT (Fig 1D) and eWAT (Fig 1E) compared to the GFP control group. Among these candidates, PLTP caught our attention because of its robust effect on adipose tissue mass, and also because single nucleotide polymorphism (SNP) at the PLTP gene locus, which increases PLTP transcripts, are associated with low levels of circulating triglycerides and high levels of HDL in humans (Kathiresan et al, 2009). Recent studies also found that PLTP is secreted from human and mouse brown fat (Ali Khan et al, 2018; Deshmukh et al, 2019). Notably, BAT expresses PLTP at a very high level relative to other tissues, including the skeletal muscle, liver, heart, and intestine (Fig 1F), while previous studies also reported PLTP expression in the ovary, thymus, placenta, and lung (Albers et al, 1995; Jiang & Bruce, 1995).
Figure EV1. Expression of batokine candidates and regulation of PLTP expression.
-
AHepatic expression of batokine candidates in mice that received adenovirus expressing indicated genes. n = 5 for all groups. **P < 0.01, ***P < 0.001 relative to GFP by Student's t‐test.
-
BTissue mass of Pparg UCP1 KO mice and control mice. n = 3 for control, n = 4 for Pparg UCP1 KO. ***P < 0.001 relative to control by Student's t‐test. N.S., not significant.
-
CRelative gene expression of thermogenic genes in the interscapular BAT from C57Bl/6 mice housed at room temperature (RT), cold (4°C), or thermoneutrality (30°C) for 2 weeks. 18s was used as an internal control. n = 5 for all groups. ANOVA followed by Tukey's test. *P < 0.05, **P < 0.01, ***P < 0.001. N.S., not significant.
-
DRelative gene expression of thermogenic genes in the iWAT from C57Bl/6 mice housed at room temperature (RT) exposure to cold (4°C) and thermoneutrality (30°C) for 2 weeks. 18s was used as an internal control. n = 5 for all groups. ANOVA followed by Tukey's test. *P < 0.05, **P < 0.01. N.S., not significant.
To evaluate the contribution of BAT to the systemic levels of PLTP, we analyzed plasma PLTP activity in “BAT‐less” mice in which PPARγ was deleted selectively by UCP1‐Cre (PparγUCP1‐KO mice, Ucp1‐Cre × Pparγflox/flox), such that they lack multilocular brown adipocytes in the BAT (Yoneshiro et al, 2019). In BAT‐less mice, the interscapular BAT mass was significantly lower than that in control mice, whereas no difference was seen in the tissue mass of WAT, liver, and muscle between the groups (Fig EV1B). BAT‐less mice showed significantly lower levels of plasma PLTP activity than did littermate control mice (Pparγflox/flox; Fig 1G). In addition, high levels of PLTP protein were secreted from primary beige adipocytes derived from fat‐selective PRDM16 transgenic mice when compared to white adipocytes isolated from wild‐type control mice (Svensson et al, 2016) (Fig 1H). While a previous study suggests a compensatory increase in beige fat‐selective gene expression, such as Ucp1, in the inguinal WAT of PparγUCP1‐KO mice (Xiong et al, 2018), the possible contribution to circulating PLTP levels would be negligible because circulating PLTP levels in BAT‐less mice was reduced by 58.1%, and thus, BAT is a significant source of circulating PLTP.
Although increased PLTP activity in circulation is found in obesity and insulin resistance (Dullaart et al, 1994; Murdoch et al, 2000; Kaser et al, 2001), the regulatory mechanism of PLTP expression in physiology is less known. We found that PLTP expression in BAT and iWAT was not altered by cold exposure (Fig EV1C and D), whereas PLTP is regulated by the PRDM16‐PPARγ complex, the master regulator of brown/beige fat development (Seale et al, 2007; Kajimura et al, 2008). By analyzing the ChIP‐seq data from published studies (Siersbaek et al, 2012; Harms et al, 2015), we found that both PRDM16 and PPARγ are co‐recruited on the regulatory regions of the Pltp gene locus in which high peaks of H3K27ac and H3K4me3 (i.e., active transcription marks) were found (Fig 1I). The data are consistent with our previous transcriptome data that PLTP expression is increased by the treatment with a synthetic PPARγ agonist (rosiglitazone) in adipocytes (Ohno et al, 2012) and also by PPARα (Bouly et al, 2001; Tu & Albers, 2001).
PLTP prevents diet‐induced body‐weight gain by increasing whole‐body energy expenditure
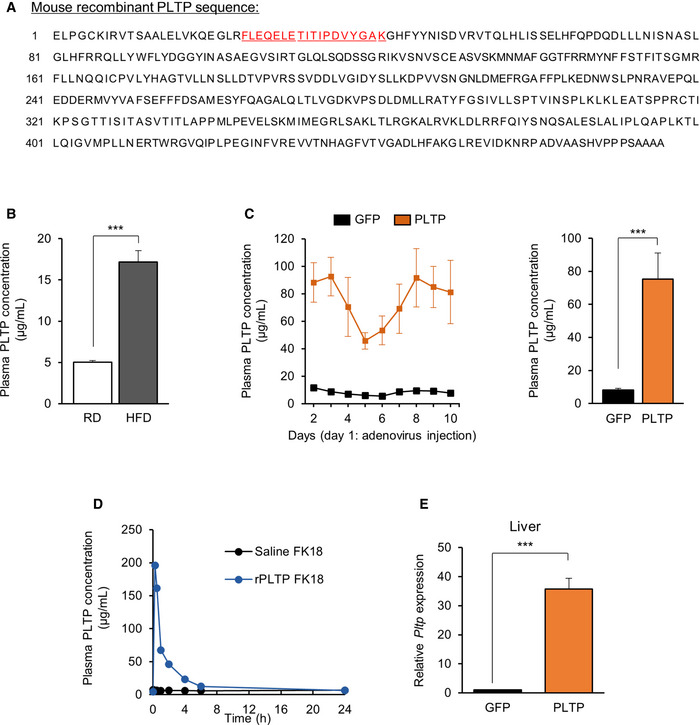
The role of PLTP in lipoprotein metabolism has been well‐appreciated (Tall et al, 1983; Albers et al, 1984; Nishida et al, 1997); however, its role in energy metabolism remains less known. The significant reduction in the WAT mass following increased PLTP expression prompted us to investigate the therapeutic potential of PLTP in obesity and insulin resistance. To explore this, we first developed a liquid chromatography‐tandem mass spectrometry (LC‐MS/MS)‐based quantification method that quantifies circulating PLTP levels (Fig EV2A). We observed higher plasma PLTP levels in obese mice on a high‐fat diet (HFD) than those in age‐matched mice on a regular chow diet (RD; Fig EV2B). The data were in accordance with previous studies showing a positive association between obesity and plasma PLTP activity (Murdoch et al, 2000; Kaser et al, 2001). Overexpression of PLTP via tail‐vain injection of adenovirus successfully increased plasma PLTP concentrations in mice on RD approximately by 9‐fold throughout the 10 days examined (GFP: 8.2 ± 0.4 μg/ml, PLTP: 75.2 ± 10.8 μg/ml, P < 0.001; Fig EV2C). On the other hand, tail‐vein injection of recombinant PLTP protein (rPLTP, 360 μg per mouse) was not able to sustain increased PLTP in the circulation, which was quickly reduced to a basal level within 4 h after rPLTP injection (Fig EV2D). Accordingly, we used adeno‐associated virus vectors (AAV) to sustain high plasma levels of PLTP on diet‐induced obese mice because AAV is considered suitable for long‐term metabolic studies with minimal side effects (Lisowski et al, 2015).
Figure EV2. Plasma PLTP levels following virally induced or recombinant PLTP administration.
-
AMouse PLTP coding sequence (https://www.ncbi.nlm.nih.gov/gene (gene ID:18830). Amino acid sequence of peptide FK18 (for mass spectrometry quantification) is highlighted.
-
BPlasma PLTP concentration of mice on regular chow diet (RD) and high‐fat diet (HFD). n = 4 for both groups. ***P < 0.001 by Student's t‐test.
-
CPlasma PLTP concentration of mice that received adenovirus expressing GFP or PLTP. PLTP protein levels were determined every day throughout 10 days. n = 4 for GFP and n = 5 for PLTP. Average bar graph of 10 days is shown in the right graph. ***P < 0.001 by Student's t‐test.
-
DPlasma PLTP concentration of rPLTP‐treated mice. PLTP protein levels were determined during 24 h following i.v. injection of rPLTP at 360 μg per mouse. n = 1 for both groups.
-
ELiver Pltp mRNA expression in mice that received AAV GFP or PLTP. Tbp was used as an internal control. n = 4 for GFP and n = 6 for PLTP. ***P < 0.001 relative to GFP by Student's t‐test.
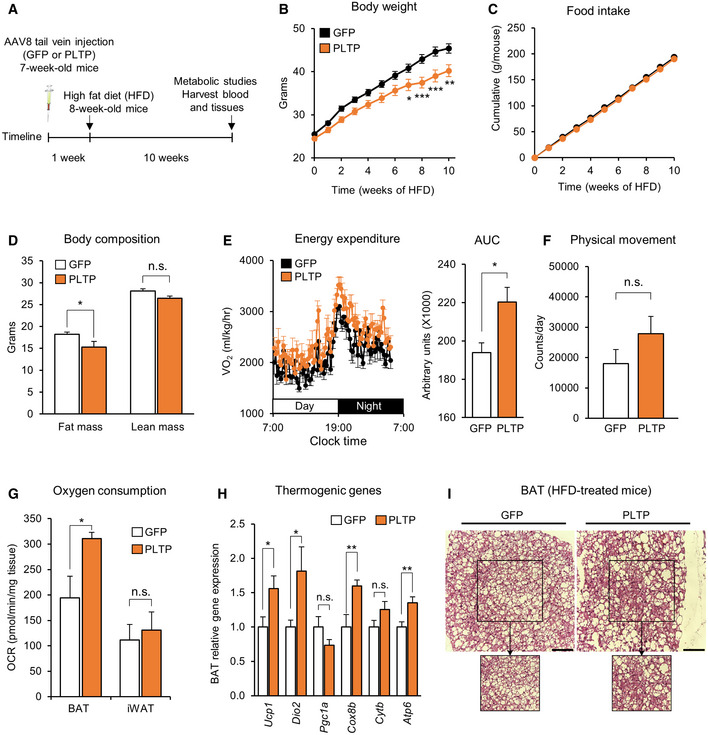
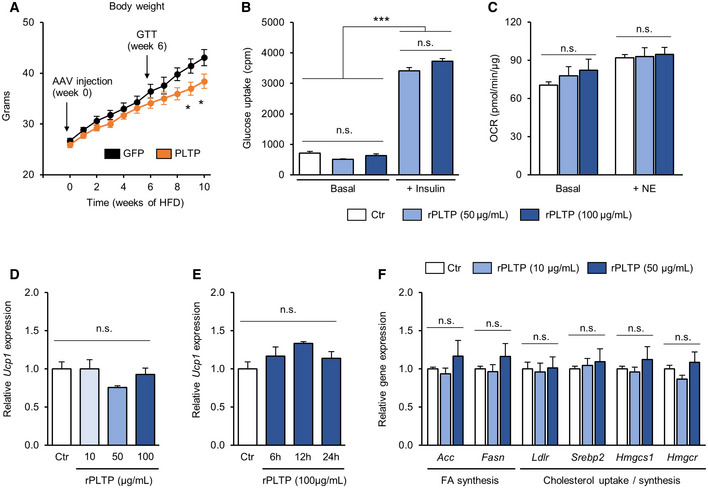
Following tail‐vein injection of AAVs expressing PLTP or GFP (5 × 10¹² GC per mouse), we confirmed a significant increase in PLTP expression in these mice (Fig EV2E). One week following the injections, mice were fed HFD for 10 weeks housed at room temperature (22°C; Fig 2A). On the HFD cohort, we found that mice with increased PLTP levels gained significantly less bodyweight than did control mice at 10 weeks of HFD and after (final weight means ± SEM: GFP, 45.4 ± 1.09 g; PLTP, 40.2 ± 1.38 g; 11.5% weight difference; Fig 2B). On the other hand, food intake was not different between PLTP and control groups (Fig 2C). Body composition analysis by MRI revealed that the body‐weight difference by PLTP expression was due to reduced fat mass by 16%, whereas there was no difference in lean mass (Fig 2D). In a separate HFD cohort, we performed whole‐body indirect calorimetry measurements at time points prior to the divergence in bodyweight (3 weeks of HFD). The analyses showed that mice with increased PLTP levels exhibited significantly higher levels of VO2 than did controls (Fig 2E). On the other hand, we observed no difference in physical movement between the groups (Fig 2F).
Figure 2. PLTP increases whole‐body energy expenditure and protects against diet‐induced body‐weight gain.
-
ASchematic illustration of the experiment. C57Bl/6 mice (7 weeks old) received AAV expressing PLTP or GFP (as control) at the viral titer of 5 × 10¹² GC/mouse via tail‐vein. High‐fat diet (HFD) started 1 week after AAV administration for both groups. Metabolic studies and euthanasia were performed after 10 weeks of HFD.
-
BChanges in bodyweight of mice in (A) during 10 weeks of HFD. n = 9 for GFP and n = 8 for PLTP (cohort 1). *P < 0.05, **P < 0.01, ***P < 0.01 relative to GFP by two‐way ANOVA repeated measures followed by Bonferroni's test.
-
CChanges in food intake of mice in (A) during 10 weeks of HFD (cohort 1). n = 9 for GFP (cage 1 = 5 mice; cage 2 = 4 mice) and n = 8 for PLTP (cage 1 = 4 mice; cage 2 = 4 mice).
-
DBody composition of mice in (A) at 10 weeks of HFD determined by EchoMRI. n = 9 for GFP and n = 8 for PLTP (cohort 1). *P < 0.05 relative to GFP by two‐way ANOVA followed by Tukey's test. N.S., not significant.
-
EWhole‐body energy expenditure of mice at 3 weeks of HFD. Area under the curve (AUC) of VO2 is shown in the right graph. n = 7 for GFP and n = 8 for PLTP (cohort 2). *P < 0.05 relative to GFP by Student's t‐test.
-
FPhysical movement of mice at 3 weeks of HFD as determined by metabolic cage analysis. n = 7 for GFP and n = 8 for PLTP (cohort 2). N.S., not significant by Student's t‐test.
-
GOCR in the interscapular BAT and iWAT of control and PLTP‐treated mice. One week after the treatment, BAT and iWAT were isolated from mice (7 weeks old) that received adenovirus for GFP or PLTP. n = 5 for both groups. *P < 0.05 relative to GFP by Student's t‐test. N.S., not significant.
-
HGene expression of indicated thermogenic genes in (A) from interscapular BAT for GFP (n = 8) and PLTP (n = 8) groups (cohort 1) except n = 7 for Ucp1 of the PLTP group. Tbp was used as an internal control. *P < 0.05, **P < 0.01 relative to GFP by Student's t‐test. N.S., not significant.
-
IH&E staining of interscapular BAT from mice in (A) at 10 weeks of HFD (cohort 1). Representative images from n = 3 mice for both groups. Scale bar, 50 μm.
The increase in energy expenditure without affecting food intake and locomotor activity leads to the hypothesis that PLTP enhances thermogenesis by brown fat. To test the hypothesis, we measured the oxygen consumption rate (OCR) in the BAT and iWAT of mice with increased PLTP and control mice (GFP). We found that PLTP significantly increased OCR in the biopsied BAT, but no in the iWAT (Fig 2G). Moreover, the change in OCR was associated with increased expression of thermogenic genes, including Ucp1, Dio2, and Cox8b, in the BAT (Fig 2H). Histologically, we found that PLTP expression reduced the lipid size of brown adipocytes in the BAT (Fig 2I), an indicator of active thermogenesis. These results suggest that increased circulating PLTP levels enhance BAT thermogenesis and whole‐body energy expenditure in vivo.
PLTP promotes BAT glucose uptake and improves systemic glucose homeostasis independent of its anti‐obesity action
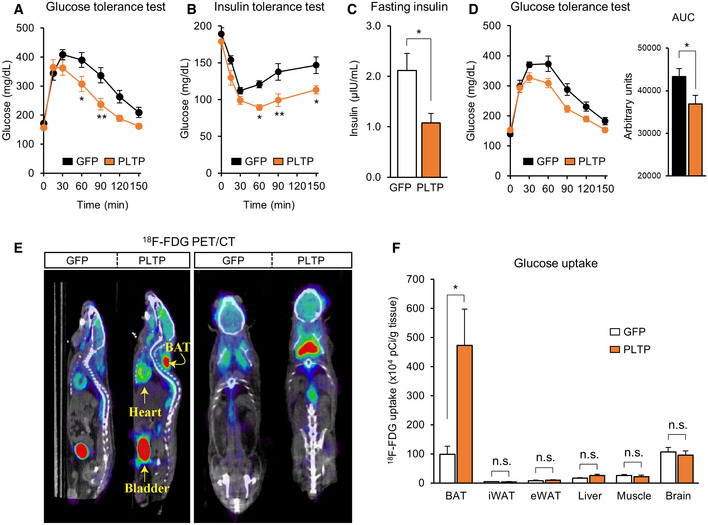
Enhanced BAT activity is associated with improved glucose homeostasis in mice and humans (Bartelt et al, 2011; Stanford et al, 2013; Chondronikola et al, 2014; Hanssen et al, 2015, 2016). Accordingly, we investigated the extent to which activated BAT thermogenesis by PLTP affects systemic glucose homeostasis. To that end, we performed glucose tolerance test (GTT) and insulin tolerance test (ITT) in mice with increased PLTP levels by tail‐vein AAV injection. GTT found that mice with increased PLTP levels exhibited significantly higher glucose tolerance than did control mice at 10 weeks of HFD (Fig 3A). Similarly, insulin tolerance was significantly higher in mice with increased PLTP levels compared to control mice at 10 weeks of HFD (Fig 3B). Importantly, fasting insulin levels were significantly lower in PLTP mice than controls (Fig 3C), indicating that systemic insulin sensitivity was improved by PLTP administration. It is important to note that this metabolic effect of PLTP was not merely a metabolic consequence of body‐weight loss because systemic glucose intolerance was already improved within 6 weeks of PLTP treatment, at a time point when the difference in bodyweight between the two groups had not yet diverged (Figs 3D and EV3A).
Figure 3. PLTP improves systemic glucose homeostasis.
-
AGlucose tolerance test of mice that received AAV control (GFP) or PLTP at 10 weeks of HFD. After 8 h of fasting, 2 g/kg bodyweight of glucose was administered. n = 9 for GFP and n = 7 for PLTP. *P < 0.05, **P < 0.01 relative to GFP by two‐way repeated‐measures ANOVA followed by Bonferroni's test.
-
BInsulin tolerance test of mice in (A) at 10 weeks of HFD. Mice were fasted for 4 h and administered insulin (0.75 U/kg bodyweight). n = 9 for GFP control and n = 7 for PLTP. *P < 0.05, **P < 0.01 relative to GFP by two‐way repeated‐measures ANOVA followed by Bonferroni's test.
-
CFasting insulin levels of mice in (A) at 10 weeks of HFD. Blood samples were harvested after 8 h of fasting. n = 5 for GFP and n = 4 for PLTP. *P < 0.05 relative to GFP by Student's t‐test.
-
DGlucose tolerance test of mice that received AAV control (GFP) or PLTP at 6 weeks of HFD. Note that no difference was found in bodyweight between the groups by two‐way repeated‐measures ANOVA followed by Bonferroni's test.. After 8 h of fasting, 2 g/kg bodyweight of glucose was administered. n = 7 for GFP control and n = 10 for PLTP. AUC of glucose is shown in the right graph. *P < 0.05 by Student's t‐test.
-
E18F‐FDG PET/CT scan images of mice that received adenovirus GFP (control) or PLTP at 14 weeks of HFD. Mice received CL316,243 at dose of 1 mg/kg of bodyweight 30 min before the PET/CT images. Representative images of n = 5 for both groups. Yellow arrows indicate anatomical references as bladder, heart, and interscapular BAT.
-
FQuantification of 18F‐FDG uptake in indicated tissues from mice in (E). After the 18F‐FDG PET/CT imaging, indicated tissues were harvested and the radioactivity was measured by scintillation counter. n = 5 for both groups. *P < 0.05 relative to GFP by Student's t‐test. N.S., not significant.
Figure EV3. The systemic vs cell‐autonomous effects of PLTP on energy metabolism.
-
ABodyweight of mice that received AAV GFP (control) or PLTP on HFD. n = 7 for GFP and n = 10 for PLTP. *P < 0.05 relative to GFP by two‐way repeated‐measures ANOVA followed by Bonferroni's test. Glucose tolerance test was performed at 6 weeks of HFD, and the result is shown in Fig. 3D.
-
BGlucose uptake in differentiated brown adipocytes treated with rPLTP. 0.1% BSA was used as a control (Ctr). A subset of cells was treated with insulin to measure insulin‐dependent glucose uptake. n = 3 for all groups. ***P < 0.001 by one‐way ANOVA followed by Tukey's test. N.S., not significant.
-
COCR in differentiated brown adipocytes treated with rPLTP. OCR was performed at a basal state (without NE stimulation) and NE‐stimulated state. n = 10 for Ctr, n = 5 both for rPLTP 50 and 100 μg/ml. One‐way ANOVA followed by Tukey's test. N.S., not significant.
-
DUcp1 mRNA levels in differentiated brown adipocytes treated with rPLTP at indicated doses for 24 h. Tbp was used as an internal control. n = 3 for all the groups. One‐way ANOVA followed by Tukey's test. N.S., not significant.
-
EUcp1 mRNA levels in differentiated adipocytes treated with rPLTP for indicated time points. Tbp was used as an internal control. n = 3 for all the groups. One‐way ANOVA followed by Tukey's test. N.S., not significant.
-
FCultured hepatocytes were treated with recombinant PLTP protein (10 or 50 μg/ml) or vehicle (DMSO) for 24 h. The effect of PLTP on indicated genes was assessed by qRT–PCR. Tbp was used as an internal control. n = 3 for all groups. One‐way ANOVA followed by Tukey's test. N.S., not significant.
To determine whether improved glucose homeostasis by PLTP is due to enhanced glucose uptake by BAT and/or other metabolic organs, we next performed 18F‐FDG PET/CT scan on HFD‐fed mice with increased PLTP. We found that 18F‐FDG uptake in the BAT was enhanced by PLTP (Fig 3E). Quantification of 18F‐FDG uptake showed that PLTP significantly increased glucose uptake in the BAT by 4.7‐fold relative to controls, whereas no difference was seen in other organs, such as the WAT, liver, muscle, and brain (Fig 3F). The results suggest that BAT is responsible for PLTP‐induced glucose uptake. Accordingly, we next investigated the mechanism by which PLTP promotes glucose uptake and thermogenesis in the BAT. Since PLTP is known to bind to ABCA1 receptor and triggers Janus kinase 2 signaling in the kidney (Oram et al, 2008) and ABCA1 receptor is expressed in brown adipocytes (Chung et al, 2011), we tested if recombinant PLTP protein acts on differentiated brown adipocytes and stimulates glucose uptake in a cell‐autonomous fashion. However, recombinant PLTP treatment in differentiated brown adipocytes increased neither glucose uptake nor oxygen consumption (Fig EV3B and C). Moreover, recombinant PLTP at varying concentrations and duration did not change Ucp1 expression in brown adipocytes (Fig EV3D and E). These data indicate that the metabolic improvement by PLTP in vivo is not due to an autocrine action of PLTP on brown adipocytes.
PLTP improves lipid homeostasis and increases bile acid secretion from the liver
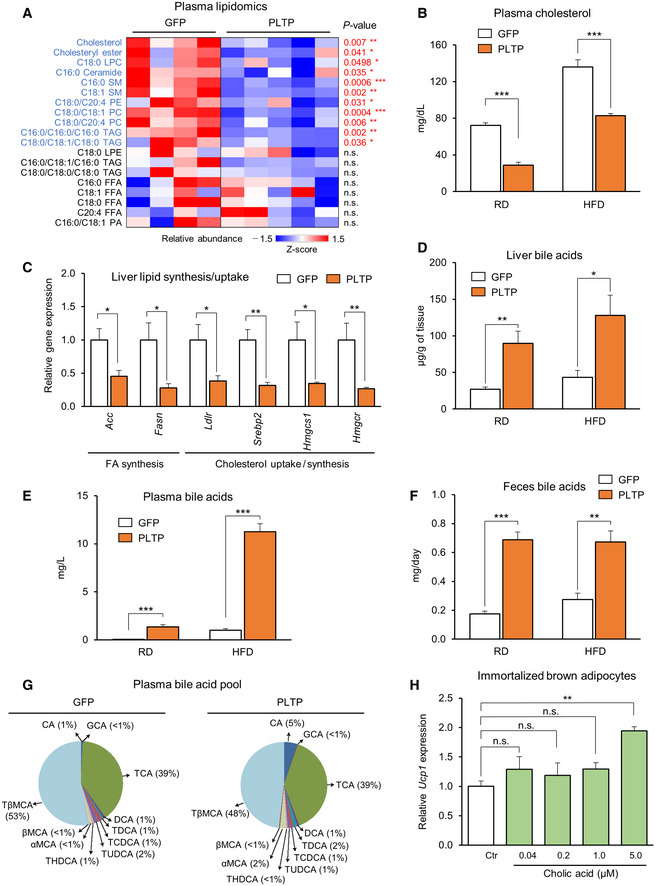
The above data led us to search for mediators in the circulation through which PLTP enhances BAT function and systemic glucose homeostasis. Previous studies reported that PLTP exerts a central role in lipid and lipoprotein metabolism (Albers et al, 2012). Thus, we employed lipidomics with liquid chromatography‐mass spectrometry (LC‐MS). The lipidomics analysis found a robust decrease in the concentrations of cholesterol, cholesterol esters, (lyso) phosphatidylcholine, ceramides, sphingomyelin, and triglycerides in plasma from mice treated with PLTP relative to controls (Fig 4A). In an independent cohort, we validated that total plasma cholesterol was significantly reduced in PLTP‐treated mice relative to controls both on RD and on HFD (Fig 4B). Of note, the reduced cholesterol level by PLTP was independent of body‐weight loss because we found no difference in the bodyweight of mice on RD between the two groups (final weight means ±SEM: GFP, 27.6 ± 0.4 g; PLTP, 27.3 ± 0.7 g). The reduced level of several lipid species was associated with reduced expression of fatty acid synthesis and cholesterol synthesis/uptake in the liver (Fig 4C). The transcriptional changes in the liver are likely through the negative feedback of increased cholesterol transport to the liver (Goldstein et al, 2006; Albers et al, 2012), rather than a cell‐autonomous action of PLTP, because rPLTP protein at the concentrations that we observed in the mouse plasma did not alter the expression of these metabolism genes in cultured hepatocytes (Fig EV3F).
Figure 4. PLTP improves lipid homeostasis and increases bile acids in vivo .
-
ALipidomics‐based quantification of indicated lipid species in mice that received tail‐vein injection of adenovirus expressing PLTP or GFP (control). Blood and tissues were harvested after 10 weeks of HFD. n = 4 for GFP and n = 5 for PLTP in mice on HFD. LPC, (lyso)phosphatidylcholine, LPE, (lyso)phosphatidylethanolamine, PA, phosphatidic acid, SM, sphingomyelin, TAG, triglycerides, FFA, free fatty acid. Statistical analysis is demonstrated (P value) relative to GFP by Student's t‐test.
-
BPlasma total cholesterol levels in mice that received adenovirus GFP (control) or PLTP. Blood and tissues were harvested 7 days after adenovirus infection. n = 8 in mice on RD and n = 7 in mice on HFD for 14 weeks. ***P < 0.001 relative to GFP by Student's t‐test.
-
CRelative mRNA levels of indicated genes in the liver of mice on HFD. Tbp was used as an internal control. n = 4 for GFP and n = 6 for PLTP. *P < 0.05, **P < 0.01 relative to GFP by Student's t‐test.
-
DBile acid levels in the liver of mice in (B). n = 8 in mice on RD and n = 6 in mice on HFD. *P < 0.05, **P < 0.01 relative to GFP by Student's t‐test.
-
EBile acid levels in the plasma of mice in (B). n = 8 in mice on RD and n = 7 in mice on HFD. ***P < 0.001 relative to GFP by Student's t‐test.
-
FBile acid levels in the feces of mice in (B). Feces were collected from mice on RD and HFD after 7 days of treatment. n = 7 in mice on RD and HFD. **P < 0.01, ***P < 0.001 relative to GFP by Student's t‐test.
-
GPlasma bile acid composition of mice in (B). Pool of samples from mice on HFD that received GFP or PLTP. n = 5 for both groups.
-
HRelative expression of Ucp1 in differentiated brown adipocytes treated with cholic acid (CA). Cells were treated with CA at indicated concentrations for 24 h. 0.1% ETOH was used as vehicle control (Ctr). n = 3. Ucp1 mRNA expression was normalized by Tbp as an internal control. **P < 0.01 relative to Ctr by one‐way ANOVA followed by Tukey's test. N.S., not significant.
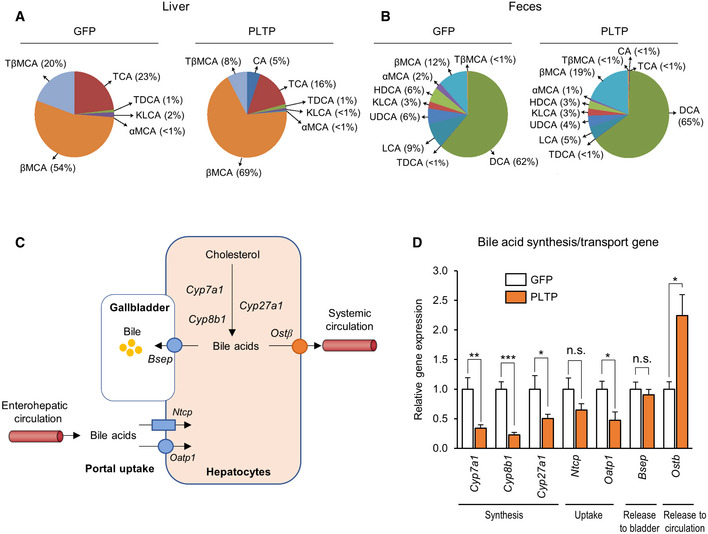
The PLTP's action on cholesterol transport to the liver suggests that PLTP serves as a mediator from the BAT to the liver. From the liver‐to‐BAT loop, bile acids are possible mediators because bile acids, synthesized in the liver and released into bile and the circulation to a lesser extent, are known to increase energy expenditure through its receptors FXR and TGR5 (Watanabe et al, 2006; Molinaro et al, 2018). Consistent with the model, we found that PLTP pharmacological treatment significantly increased total bile acid levels in the liver (Fig 4D), plasma (Fig 4E), and feces (Fig 4F) both in mice on RD and in mice on HFD. Specifically, increased PLTP altered the composition of several bile acid species in the plasma, liver, and feces by elevating primary bile acids, including cholic acid (CA; plasma bile acid pool, GFP: 0.43 μmol/l, PLTP:3.15 μmol/l; bile acid pool difference 627%; Figs 4G and EV4A and B). Furthermore, the PLTP‐induced hepatic bile acid levels were accompanied by reduced expression of the hepatic bile acid synthases/uptake genes and increased expression of the bile acid transporter Ostb that releases bile acids to the bloodstream (Fig EV4C and D). These results suggest that PLTP increases the secretion of bile acids from the liver to the circulation.
Figure EV4. The effect of PLTP on plasma bile acid composition and liver expression of bile acids synthesis genes.
-
ABile acid composition in the liver of mice that received adenovirus expressing GFP (control) or PLTP on HFD. Pooled samples of n = 5 for both groups.
-
BBile acid composition in the feces of mice in (A). Pooled samples of n = 5 for both groups.
-
CSchematic illustration of the hepatic bile acid synthesis, uptake, and secretion pathway.
-
DRelative expression of indicated genes involving in the bile acid synthesis, uptake, and secretion in the liver of mice that received GFP control and PLTP on HFD. Tbp was used as an internal control. n = 4 for GFP, n = 6 for PLTP except Ostb n = 5. *P < 0.05, **P < 0.01, ***P < 0.001 relative to GFP by Student's t‐test. N.S., not significant.
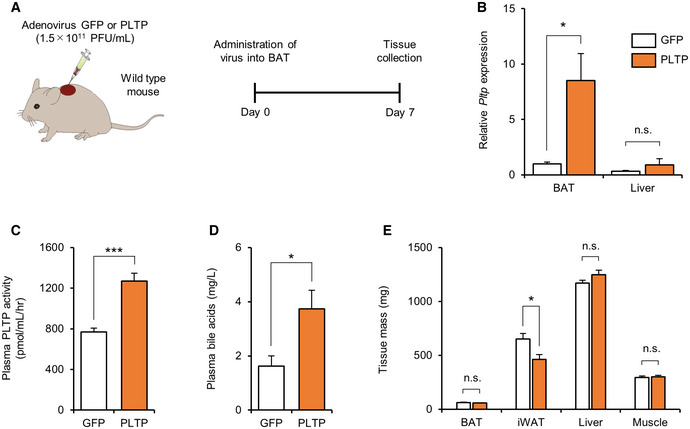
To critically evaluate the effect of BAT‐derived PTLP on systemic lipid metabolism, we next overexpressed PTLP specifically in the BAT by administering PLTP adenovirus directly into the BAT (Fig EV5A and B). We found that the BAT‐specific expression of PLTP significantly increased plasma PLTP activity by approximately twofold (Fig EV5C), which was equivalent to the levels achieved by tail‐vein injection of AAV‐PLTP. Of note, a twofold increase in circulating PLTP activity was sufficient to increase whole‐body energy expenditure and plasma bile acid levels without affecting food intake and locomotor activity in mice (see Fig 2C–F). Consistent with the observations, BAT‐specific expression of PLTP significantly increased plasma bile acid levels (Fig EV5D) and decreased iWAT mass, whereas no change was seen in the tissue mass of liver and skeletal muscle (Fig EV5E). These findings indicate that BAT‐derived PLTP can trigger the metabolic changes associated with increased PLTP in the circulation. Next, we asked if the increased circulating level of bile acids (CA) in PLTP‐treated mice activates the thermogenic program in brown adipocytes. Consistent with the previous study (Watanabe et al, 2006), we found that the CA at 5 μM, the concentration that we observed in the circulation of PLTP‐treated mice, significantly increased the expression of Ucp1 in differentiated brown adipocytes (Fig 4H). Together, these data suggest that increased bile acids in response to PLTP treatment stimulate BAT thermogenesis.
Figure EV5. The effect of BAT‐derived PLTP on plasma bile acids and adiposity.
-
ASchematic illustration of the experiment. Tissues were harvested from mice that received adenovirus expressing GFP (control) or PLTP in the BAT.
-
BThe expression of Pltp in the BAT and liver of mice in (A). Tbp was used as an internal control. n = 6 for GFP and n = 7 for PLTP. *P < 0.05 relative to GFP by Student's t‐test. N.S., not significant.
-
CPlasma PLTP activity in (A). n = 6 for GFP and n = 8 PLTP. ***P < 0.001 relative to GFP by Student's t‐test.
-
DPlasma bile acid levels in (A). n = 5 for GFP and n = 7 PLTP. *P < 0.05 relative to GFP by Student's t‐test.
-
EQuantification of indicated tissue mass in (A). n = 6 for GFP and n = 8 PLTP. *P < 0.05 relative to GFP by Student's t‐test. N.S., not significant.
Lipid transfer activity of PLTP is required for its metabolic effects
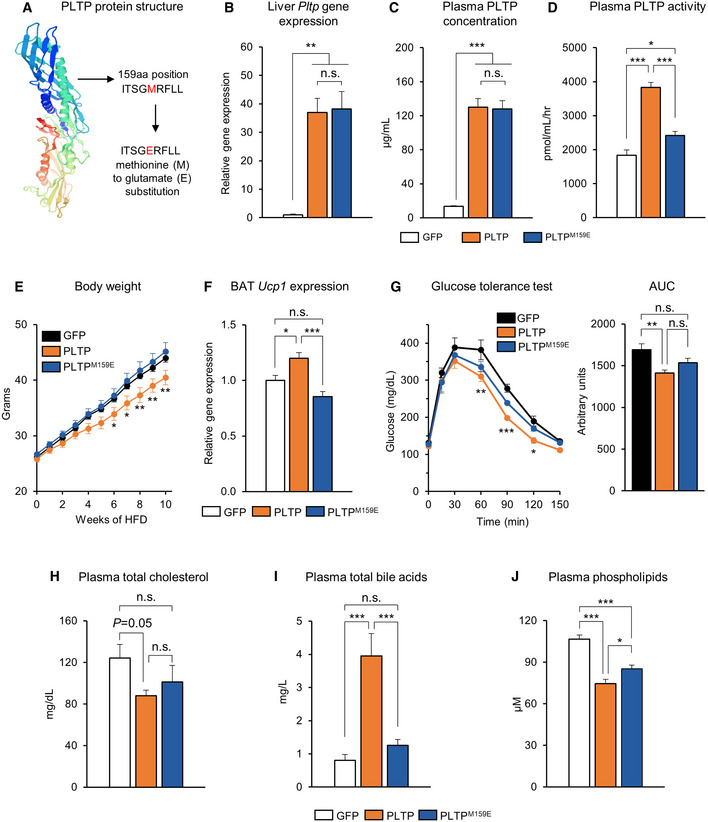
Our data suggest that PLTP's activity of lipid transfer and the reverse transport of cholesterol to the liver promotes bile acid secretion, thereby leading to an improvement in systemic lipid and glucose metabolism. To critically test the model, we asked if the PLTP's lipid transfer activity is required for the action of PLTP to control energy homeostasis. To this end, we introduced a single amino acid mutation in the mouse PLTP protein that decreased its ability to transfer cellular cholesterol and phospholipids. Following the previous study (Oram et al, 2008), we replaced methionine at the position 159 of PLTP to glutamate (PLTPM159E; Fig 5A). It is important to note that this mutation did not affect the secretion of the mutant PLTP protein despite the blunted effects on lipid transfer activity (Oram et al, 2008). We also confirmed that the wild‐type form and the mutant form of PLTP were expressed at the equivalent levels in the liver (Fig 5B) and the plasma (Fig 5C) following the tail‐vein viral administration. Whereas the wild‐type form significantly increased plasma PLTP activity by twofold, the PLTPM159E mutant failed to increase lipid transfer activity (Fig 5D). We next compared the long‐term effects of wild‐type and the mutant forms of PLTP in mice on HFD. Consistent with our results, the wild‐type form of PLTP prevented diet‐induced body‐weight gain; however, such effect was not seen in mice expressing PLTPM159E (final weight means ± SEM: GFP, 44.0 ± 0.73 g; PLTP, 40.5 ± 1.30 g, PLTPM159E 45.2 ± 1.59; 11.6% weight difference between PLTP and PLTPM159E; Fig 5E). Moreover, the mutant PLTP failed to increase the expression of Ucp1 in the BAT (Fig 5F).
Figure 5. PLTP lipid transfer activity is required for the metabolic effects of PLTP on glucose homeostasis.
-
ASchematic illustration of mutant PLTP (PLTPM159E). The point mutation of PLTP coding sequence by substitution of methionine with glutamate at 159 amino acid position.
-
BRelative expression of Pltp in liver of mice that received adenovirus GFP (control) or PLTP. n = 4 for GFP, n = 6 for PLTP and n = 6 for PLTPM159E. **P < 0.01 relative to GFP by one‐way ANOVA followed by Tukey's test. N.S., not significant.
-
CPlasma PLTP concentration in mice that received adenovirus GFP or PLTP as determined by quantitative mass spectrometry. n = 4 for GFP, n = 6 for PLTP, and n = 6 for PLTPM159E. ***P < 0.001 relative to GFP by one‐way ANOVA followed by Tukey's test. N.S., not significant.
-
DPlasma PLTP activity in mice that received adenovirus GFP or PLTP. n = 4 for GFP, n = 6 for PLTP, and n = 6 for PLTPM159E. ***P < 0.001 PLTP relative to GFP and PLTPM159E; *P < 0.05 PLTPM159E relative to GFP by one‐way ANOVA followed by Tukey's test.
-
EChanges in bodyweight of mice that received AAV control or PLTP during 10 weeks of HFD. n = 8 for GFP, n = 10 for PLTP, and n = 10 for PLTPM159E. *P < 0.05, **P < 0.01 relative to PLTPM159E by two‐way repeated‐measures ANOVA followed by Bonferroni's test.
-
FRelative Ucp1 expression in BAT of mice that received AAV GFP (control) or PLTP at 10 weeks of HFD. n = 4 for GFP, n = 5 for PLTP, and n = 4 for PLTPM159E. Tbp was used as an internal control. *P < 0.05, **P < 0.01 by one‐way ANOVA followed by Tukey's test.
-
GGlucose tolerance test of mice that received AAV GFP or PLTP at 10 weeks of HFD. n = 5 for GFP and n = 6 for both PLTP and PLTPM159E. *P < 0.05, **P < 0.01, ***P < 0.001 PLTP relative to GFP by two‐way repeated‐measures ANOVA followed by Bonferroni's test. AUC of glucose, shown in the right graph, was analyzed by one‐way ANOVA followed by Tukey's test. N.S., not significant.
-
HPlasma total cholesterol of mice that received AAV control or PLTP at 10 weeks of HFD. n = 7 for all groups. *P = 0.05 by one‐way ANOVA followed by Fisher's LSD test. N.S., not significant.
-
IPlasma bile acids in (H). n = 7 for all groups. ***P < 0.001 PLTP relative to GFP and PLTPM159E by one‐way ANOVA followed by Tukey's test.
-
JPlasma phospholipid in (H). n = 7 for all groups. ***P < 0.001 PLTP and PLTPM159E relative to GFP; *P < 0.05 PLTP relative to PLTPM159E by one‐way ANOVA followed by Fisher's LSD test.
To determine whether the effect of PLTP on glucose and lipid homeostasis is coupled with its enzymatic activity of PLTP, we further compared glucose tolerance and lipid profiling of mice that received the wild‐type and mutant forms of PLTP on HFD. We found that the mutant PLTP failed to improve glucose tolerance, although the wild‐type form of PLTP significantly increased glucose tolerance relative to GFP controls (Fig 5G). In addition, reduced circulating cholesterol levels by PLTP required its lipid transfer enzymatic activity because PLTPM159E failed to reduce total cholesterol (Fig 5H). Importantly, PLTPM159E expression did not increase the circulating bile acid levels, although the wild‐type PTLP robustly increased plasma bile acids (Fig 5I). On the other hand, PLTPM159E expression modestly reduced plasma phospholipid levels relative to GFP controls, although the effect was modest compared to the wild‐type form of PLTP (Fig 5J). Altogether, these data suggest that the lipid transfer activity of PLTP—i.e., increasing the reverse transport of cholesterol to the liver and enhancing the release of bile acids—is required for the metabolic benefits elicited by increased PLTP in vivo.
Discussion
Emerging evidence suggests that the biological role of BAT in the regulation of glucose and lipid homeostasis is more than merely stimulating thermogenesis. One of the mechanisms involves interorgan communications with peripheral metabolic organs, such as skeletal muscle and liver (Stanford et al, 2013; Wang et al, 2014; Lynes et al, 2017; Thomou et al, 2017; Villarroya et al, 2017; Kong et al, 2018). In this study, we report a previously unknown interorgan communication between BAT and liver via PLTP. We found that BAT is a major source of PLTP in the circulation and that increased PLTP levels, via BAT‐specific or tail‐vein PTLP overexpression, increased energy expenditure, decreased WAT mass, and improved systemic glucose and lipid homeostasis. PLTP‐induced systemic changes in lipid and cholesterol were accompanied by increased release of primary bile acids into the circulation, which in turn, stimulates glucose uptake and thermogenesis in the BAT (Fig 6). A recent study using aP2‐Cre conditional PLTP knockout mice reports that aP2‐Cre × Pltp KO mice exhibited a modest but significant reduction in plasma PLTP activity, high‐density lipoprotein, phospholipids, and apolipoprotein A‐I levels (Jiang et al, 2015). Hence, adipose tissue is a major regulator of circulating PLTP and cholesterol efflux, while other tissues also contribute to the circulating PLTP.
Figure 6. A summary of PLTP‐mediated metabolic changes in mice.
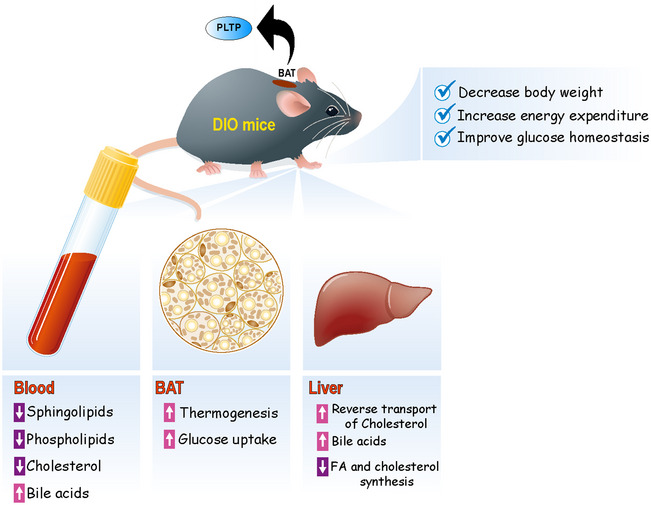
PLTP is highly expressed and secreted from brown/beige fat and positively regulated by the PRDM16‐PPARγ complex. Increased PLTP levels lead to reduced plasma levels of several sphingolipids and phospholipids lipid species, and enhanced cholesterol transport to the liver. In the liver, transported cholesterol is excluded by active synthesis and secretion of bile acids into circulation. In turn, secreted bile acids (e.g., cholic acid) in the circulation activate glucose uptake and thermogenesis in BAT. PLTP‐mediated activation of BAT thermogenesis increases whole‐body energy expenditure, prevents diet‐induced body‐weight gain, and improves systemic glucose and lipid homeostasis.
The results appear paradoxical to the observations in mice and humans in which circulating PLTP levels are high in obesity and insulin resistance (Dullaart et al, 1994; Murdoch et al, 2000; Kaser et al, 2001). It is conceivable, however, that increased PLTP levels under such conditions are an adaptive response to enhance the clearance of excess cholesterol and lipids. Several examples of such adaptive responses are found in the regulation of metabolic endocrine hormones under obese conditions: To name a few, higher circulating levels of growth and differentiation factor 15 (GDF15) are found in obese mice and humans (Dostalova et al, 2009; Kempf et al, 2012; Xiong et al, 2017), whereas pharmacological treatment with GDF15 profoundly reduces body‐weight gain and improves glucose homeostasis (Johnen et al, 2007; Macia et al, 2012; Mullican et al, 2017; Xiong et al, 2017). Another example is fibroblast growth factor 21 (FGF21) in which higher circulating FGF levels are found in obesity (Fisher et al, 2010), whereas pharmacological activation of FGF21 enhances thermogenesis and improves systemic glucose/lipid homeostasis (Kharitonenkov et al, 2005, 2007; Coskun et al, 2008; Xu et al, 2009). It is also worth noting that a previous study reports that whole‐body PLTP KO mice gained significantly less bodyweight than did control mice at 6 weeks of HFD and thereafter, such that the KO mice exhibited higher glucose tolerance and insulin sensitivity at 12 weeks of HFD, at the time point when the KO mice were smaller than control mice by ~ 10 g. The changes in glucose tolerance and insulin sensitivity in whole‐body PLTP KO mice were most likely a metabolic consequence of body‐weight loss. On the other hand, we showed that PLTP treatment significantly improved glucose tolerance, increased bile acid levels, increased whole‐body energy expenditure, and decreased plasma cholesterol levels independent of its action on bodyweight. The results indicate that improved glucose tolerance and lipid homeostasis by PLTP are not a metabolic consequence of the body‐weight loss.
Mechanistically, our data showed that the enzymatic activity of PLTP is required for its effects on body‐weight reduction, increased bile acids, and improvement in systemic glucose tolerance. These data suggest that PLTP's action on cholesterol transport and lipid species to the liver is closely linked to its metabolic benefit. In this regard, the reduction in circulating sphingolipid lipid species (e.g., ceramides) by PLTP is intriguing because they are known to cause mitochondrial dysfunction and, consequently, cardio‐metabolic diseases (Meikle & Summers, 2017; Turpin‐Nolan & Bruning, 2020). For instance, ceramides impair fatty acid oxidation by inactivating mitochondrial complexes I (Di Paola et al, 2000), II (Raichur et al, 2014), III (Gudz et al, 1997; Yu et al, 2007), and IV (Zigdon et al, 2013). In addition, ceramides antagonize insulin signaling and induce insulin resistance (Summers et al, 1998; Stratford et al, 2001; Chavez et al, 2003; Hla & Kolesnick, 2014; Turpin et al, 2014; Meikle & Summers, 2017). It is conceivable that a reduction in these lipid spices mediates a part of the metabolic improvement by PLTP.
Strategies that increase circulating HDL levels and cholesterol efflux are associated with improved glucose metabolism (Siebel et al, 2015). As an example, pharmacological inhibition of cholesteryl ester transfer protein (CETP), a key protein that promotes the transfer of cholesteryl ester from HDL to non‐HDL particles, improves insulin secretion (Siebel et al, 2013) and insulin‐stimulated glucose uptake in the muscle, liver, and heart (Briand et al, 2014). In a clinical trial, inhibition of CETP leads to glycemic improvement in diabetics and non‐diabetic patients (Barter et al, 2011). In this regard, PLTP is an intriguing batokine that improves both lipid and glucose homeostasis. PTLP facilitates the uptake of cholesterol from peripheral tissues and transportation into the liver by remodeling HDL particles (Wolfbauer et al, 1999), and our data showed that pharmacological‐induced PLTP potently improves glucose homeostasis in vivo. Notably, human GWAS studies identified a SNP located in the PLTP locus (rs7679) that increases PLTP transcripts and circulating PLTP activity. This SNP is also associated with higher HDL levels and lower triglycerides (Kathiresan et al, 2009). In light of our study, it would be intriguing to examine how the SNP in the PLTP locus influences BAT prevalence, glucose homeostasis, and insulin sensitivity in humans.
Materials and Methods
Identification of human brown fat‐enriched secreted proteins
All the batokine candidates were identified from the proteomics study in differentiated adult human brown and white adipocytes (Shinoda et al, 2015). The candidates were chosen based on the criteria that the expression of a given molecule was enriched in brown adipocytes relative to white adipocytes by five‐fold or higher with P < 0.05. These candidates were subjected to the following “ensemble” method of hidden Markov model (HMM) and artificial neural networks (ANN). Amino acid sequences of the candidate proteins obtained at UniProt (UniProt Consortium, 2018) were analyzed in HMM‐based Phobius server (Kall et al, 2007) and ANN‐based SignalP 4.1 (Nielsen, 2017). Proteins negative for both algorithms were removed from the candidates. The expression of candidates was further validated using qPCR. The secreted PLTP levels from white and aP2‐PRDM16 beige fat were analyzed in the previously published data (Svensson et al, 2016).
Animals
All animal experiments were performed following the guidelines established by the UCSF Institutional Animal Care and Use Committee. Male C57Bl/6 mice at 6–8 weeks old were obtained from the Jackson Laboratory (Stock No.000664). BAT‐less mice (Ucp1‐Cre × Pparγflox/flox) in C57BL/6 background were generated as previously described (Yoneshiro et al, 2019). The mice had free access to food and water, 12‐h light cycles, and were caged at 23°C. For gain‐of‐function experiments, male mice at 7 weeks or 11 weeks old (as indicated) received virus by tail‐vein intravenous (i.v.) with 2 × 10⁹ PFU/mouse (adenovirus—Vector Biolabs) or 5 × 10¹² GC/mouse (serotype 8—AAV8, Vector Biolabs) for PLTP and GFP as a control. BAT‐specific PLTP overexpressing in mice was achieved by injecting adenovirus PLTP or GFP control (2 × 10⁹ PFU/mouse) directly into interscapular BAT as previously described (Yoneshiro et al, 2019). The efficacy of viral infection was evaluated by qRT–PCR. For cold exposure experiments, mice were singly caged and exposed to 4°C (cold) or 30°C (thermoneutrality) for 2 weeks. BAT‐less or control mice were exposed to cold for 1 week.
Metabolic studies
One week following AAV administration, C57Bl/6 at 8‐week‐old mice were fed an HFD (D12492, Research Diets) under an ambient temperature of 22°C for 10 weeks. Body‐weight and food intake were measured every week. To measure the body composition of mice, we used body composition analyzer EchoMRI (Echo Medical Systems). For GTT experiments, mice on HFD for 6 weeks or 10 weeks were fasted for 8 h and injected intraperitoneally with glucose (2 g per kg bodyweight). For ITT experiments, mice were fasted for 4 h and injected intraperitoneally with insulin (0.75 U/kg bodyweight for mice under an HFD). Blood samples were collected at the indicated time points, and glucose levels were measured using blood glucose test strips (FreeStyle, Abbott). Blood samples (25 μl) from tail‐vein were harvested during fasting for further analysis of insulin concentration. Plasma insulin levels were determined by using a commercially available kit (Human Insulin ELISA kit Abcam, 100578) following standard procedure. To measure whole‐body energy expenditure (VO2), food intake, and locomotor activity (beam break counts), we employed a comprehensive lab animal monitoring system (CLAMS, Columbus Instruments). The VO2 measurement in thermoneutrality (30°C) was performed in mice at 2–3 weeks of HFD just before significant differences in bodyweight.
18F‐FDG‐PET/CT scan
Mice were administered with 100 μCi of 18F‐FDG via a tail‐vein injection under 2% isoflurane anesthesia. The micro‐PET/CT imaging system was applied to scan the whole mouse at the UCSF PET/CT Imaging Core Facility. Subsequently, mice were euthanized, and their interscapular BAT, inguinal WAT, epididymal WAT, liver, skeletal muscle, and brain were collected. The radioactivity in the tissues was measured against known activity standards using a gamma counter (Wizard 3; PerkinElmer) at the UCSF Imaging Facility.
Lipidomics
The plasma lipid profile in mice was analyzed by targeted lipidomics as previously described (Benjamin et al, 2013). In brief, frozen plasma (30 μl) for nonpolar lipid metabolites was extracted in 4 ml of a 2:1:1 mixture of chloroform:methanol:PBS with inclusion of internal standards C12:0 dodecylglycerol (10 nmol) and pentadecanoic acid (10 nmol). Organic and aqueous layers were separated by centrifugation at 1,000 g for 5 min, and the organic layer was collected. The aqueous layer was acidified (for metabolites such as phosphatidic acid [PA]) by adding 0.1% formic acid, followed by extraction with chloroform. The mixture was vortexed, and the organic layers were combined, dried down under N2, and dissolved in 120 μl chloroform, of which a 10 μl aliquot was analyzed by both single‐reaction monitoring (SRM)‐based LC‐MS/MS. Metabolite separation was achieved with a Luna reverse‐phase C5 column (50 × 4.6 mm, with 5‐μm‐diameter particles; Phenomenex). Mobile phase A was composed of a 95:5 ratio of water:methanol, and mobile phase B consisted of isopropanol, methanol, and water in a 60:35:5 ratio. Solvent modifiers 0.1% formic acid with 5 mM ammonium formate and 0.1% ammonium hydroxide were used to assist ion formation and to improve the LC resolution in both positive and negative ionization modes, respectively. The flow rate for each run started at 0.1 ml/min for 5 min to alleviate back pressure associated with injecting chloroform. The gradient started at 0% B and increased linearly to 100% B over the course of 45 min with a flow rate of 0.4 ml/min, followed by an isocratic gradient of 100% B for 17 min at 0.5 ml/min, before equilibrating for 8 min at 0% B with a flow rate of 0.5 ml/min. MS analysis was performed with electrospray ionization (ESI) source on an Agilent 6430 QQQ LC‐MS/MS. The capillary voltage was set to 3.0 kV, and the fragmentor voltage was set to 100 V. The drying gas temperature was 350°C, the drying gas flow rate was 10 l/min, and the nebulizer pressure was 35 psi. Representative metabolites were quantified by SRM of the transition from precursor to product ions at associated optimized collision energies. Standards were purchased to confirm the coelution and fragmentation of the standard with the metabolite of interest. These metabolites were then quantified by SRM analysis. Metabolites were quantified by integrating the area under the peak and were normalized to internal standard values, and then, levels were expressed as relative levels compared with controls.
Measurement of cholesterol, triglycerides, phospholipids, and bile acids
Plasma samples were used for the analysis of total cholesterol (Thermo Scientific Infinity™ Cholesterol Liquid Stable Reagent, Catalogue No. TR13421 and 7500‐012A), triglycerides (Thermo Scientific Infinity™ Cholesterol Liquid Stable Reagent, TR22421), and phospholipids (Phospholipid assay kit, Sigma‐Aldrich, MAK122) following the standard procedures. For the measurement of bile acids, plasma, liver, or feces samples were used for the analysis of total bile acids (Diazyme—Total Bile Acids Assay Kit) by using commercially available kits following the standard procedures. The conversion of μmole/l to mg/l was performed by using the molecular weight of cholic acid (408.57 g/mol) for the calculus. Bile acid composition was measured by high‐performance liquid chromatography‐tandem mass spectrometry as previously described (Argmann et al, 2006).
Generation of recombinant PLTP and mutant PLTP
DNA fragment encoding mouse Pltp was amplified by PCR in cDNA (OriGene Technologies) and cloned into the modified pcDNA3.3 vector (Thermo Fisher Scientific) to generate the expression vector that contained mouse PLTP (residues 18–493) that contained FLAG‐tag and His‐tag at the C‐terminal. The recombinant mouse PLTP was expressed in FreeStyle 293‐F Cells (Thermo Fisher Scientific) and purified from supernatants of the culture medium using Anti‐DYKDDDDK tag Antibody Beads (FUJIFILM Wako Pure Chemical Corporation), followed by size exclusion chromatography using a HiLoad 16/600 Superdex 200 pg column (GE healthcare). For the generation of mutant PLTPM159E, the point mutation in PLTP coding region was performed by replacing the methionine (M) to glutamate (E) in 176 PLTP amino acid sequence (159 position without signal peptide). AAVs expressing the wild‐type and mutant forms of PTLP were generated in VectorBiolabs.
Plasma PLTP concentrations and activity
To measure plasma PLTP concentration, 1 μl of plasma samples was digested by 1 μg of trypsin/Lys‐C Mix (Promega) in 0.1 M Tris–HCl buffer (pH 8) including 10% acetonitrile at 37°C overnight. The digested samples were quenched with the equivalent volume of 1% trifluoroacetic acid (TFA) in acetonitrile for normal samples. For virus dosed samples, digested samples were deactivated by 2.5‐fold of ethanol for 30 min and then mixed with 2% TFA in water. The quenched samples were injected into the liquid chromatography system (LC‐30A Nexera, Shimadzu), and tryptic peptides were separated by an InertSustain AQ‐C18 column (5 μm, 50 × 2.1 mm i.d.) at 60°C. The tryptic peptides were eluted from the analytical column by 1% acetic acid (AA) ‐ 10% AA in 62.5% methanol gradient at a flow rate of 0.4 ml/min and detected using a triple quadrupole time‐of‐flight‐tandem mass spectrometer (Triple‐TOF 5600, AB SCIEX) in high‐resolution multiple reaction monitoring (MRM‐HR) mode. The tryptic peptide of FK18 (FLEQELETITIPDVYGAK) and its stable isotope‐labeled peptide for internal standards were used to quantify PLTP concentrations as a signature peptide. Plasma PLTP concentrations were calculated using a calibration curve constructed with lyophilized human serum samples (Consera, Nissui), as a surrogate matrix of mouse plasma, spiked with recombinant PLTP. Plasma PLTP activity was determined by using the commercially available kit (Biovision, #K593‐100) following the standard procedures.
Bioinformatics
We used the following publicly available datasets to identify transcription factor binding sites near the Pltp gene (i) PRDM16 ChIP‐seq in BAT (Harms et al, 2015); (ii) PPARγ ChIP‐seq in BAT, iWAT, and eWAT (Siersbaek et al, 2012); (iii) ENCODE H3K27ac and H3K4me3 (Yue et al, 2014). Sequenced ChIP tags (fastq files) derived from the above datasets were aligned to NCBI38/mm10 genome with Bowtie2 (version 2.3.4.2) and the parameters “‐very‐sensitive”. Duplicates were removed, and mapped reads were retained for downstream analyses. Tag directories, representing each ChIP‐seq experiment, were created using HOMER's (version 4.10.3) makeTagDirectory.pl. Finally, replicate tag directories were merged for downstream analyses. For each tag directory, coverage profiles were generated using HOMER's makeUCSCfile.pl script. For PRDM16 and PPARγ ChIP‐seq, peaks were called using HOMER's findPeaks.pl script “‐style factor”, while regions were detected for H3K27ac and H3K4me3 using findPeaks.pl with the parameters “region ‐size 1000 ‐minDist 2500”. The coverage profiles and peak sets were visualized using UCSC genome browser (http://genome.ucsc.edu).
Cell culture
Immortalized human and mouse adipocytes were obtained from our previous studies (Shinoda et al, 2015). Mouse adipocyte differentiation was induced by treating confluent preadipocytes with DMEM containing 10% FBS, 0.5 mM isobutylmethylxanthine, 125 nM indomethacin, 2 μg/ml dexamethasone, 850 nM insulin, 1 nM T3, and 0.5 μM rosiglitazone. Two days after induction, cells were switched to maintenance medium containing 10% FBS, 850 nM insulin, and 1 nM T3. Mouse cells were fully differentiated 6–7 days after inducing differentiation. Immortalized human brown preadipocytes were cultured with animal component‐free medium (Stem Cell Technologies; #05449). Brown adipocyte differentiation was induced by treating confluent preadipocytes with animal component‐free adipogenic differentiation medium (Stem Cell Technologies; #05412) supplemented with T3 (1 nM) and rosiglitazone (0.5 μM). Human cells were fully differentiated 4 weeks after induction. Mouse hepatocytes Hepa 1‐6 (ATCC, #CRL‐1830) were cultured with DMEM containing 10% FBS, and confluent cells were treated with mouse recombinant PLTP for the indicated time.
In vitro glucose uptake assay
Immortalized brown adipocytes were pretreated for 6 h with 50 μg/ml or 100 μg/ml recombinant PLTP (rPLTP). After pretreatment, a subset of cells was incubated with insulin (100 nM) alone or in combination with rPLTP (100 μg/ml) for 30 min (positive control). A solution of 2‐deoxy‐d‐glucose (2‐DG, 0.1 mM) labeled with tritium (H3) 2‐DG(H3) was used for the quantification of glucose uptake. After insulin treatment, cells were washed with PBS1x and incubated with 1 ml 2‐DG(H3) for 5 min, 37°C without CO2. Immediately after 2‐DG(H3) incubation, cells were washed 2–3 times with cold PBS, and 500 μl of lysis buffer (Triton 1%) was added for cell lysis. Quantification was performed by using a scintillation counter.
Oxygen consumption
Oxygen consumption rate was measured in isolated tissues or cultured adipocytes using the Seahorse Xfe Extracellular Flux Analyzer (Agilent). For tissue respiration assays, 1 mg BAT and 1.5 mg inguinal WAT depots were placed into XF24 Islet Capture Microplates and pre‐incubated with XF assay media with pH value at 7.4. XF assay medium supplemented with 1 mM sodium pyruvate, 2 mM GlutaMaxTM‐I, and 25 mM glucose. Tissue or cells were subjected to OCR analysis with or without 1 μM norepinephrine (NE) administration.
Hematoxylin and eosin (H&E) staining
Brown adipose tissue was fixed in 4% paraformaldehyde overnight at 4°C, followed by dehydration in 50 and 70% ethanol. The fixed tissue was stored in 70% ethanol until processing. After a dehydration procedure, adipose tissue was embedded in paraffin, sectioned at a thickness of 5 μm, and stained with hematoxylin and eosin, following the standard protocol. Images were acquired with a DM2000 digital camera (Leica).
RNA preparation and quantitative RT–PCR
Total RNA was extracted from tissue or cells according to the RNeasy mini‐kit (Qiagen) protocol. cDNA was synthesized using iScript cDNA Synthesis kit (Bio‐Rad) according to the provided protocol. qRT–PCR was performed using an ABI ViiA™7 PCR cycler. The primer sequences are listed in (Table EV2).
Statistical analysis
Statistical analyses were performed using GraphPad Prism 7.0 (GraphPad Software, Inc., La Jolla, CA). All the data were represented as mean ± SEM. A two‐sample unpaired Student's t‐test was used for two‐group comparisons as the groups displayed a normal distribution and comparable variance. Multiple group comparisons were performed by using one‐ or two‐way ANOVA followed by Tukey's test, Fisher's LSD test, or Bonferroni's test, when appropriate. Two‐way repeated‐measures ANOVA followed by Bonferroni's test was used for repeated measurements. P values below 0.05 were considered significant throughout the study.
Author contributions
CHS designed, carried out the animal and cell experiments, and analyzed the data with TY. TH performed the batokines screening in vivo and analyzed the data. JT, MT, YM, and HK generated recombinant PLTP, performed metabolic studies in mice, and analyzed the data. MPJ performed proteomic studies. KI, TY, QW, YC, YO, KT and ZB performed animal studies and cell culture experiments, and analyzed the data, KS and RNP performed bioinformatics analysis. DKN, LSR, and CCW performed and analyzed lipidomics studies. HT, YY, and MW carried out bile acid assays. SK conceived the project and directed the research. CHS, TY, and SK wrote the manuscript with input from all the authors.
Conflict of interest
Daniel Nomura is a share‐holder and adviser for Frontier Medicines and Artris Therapeutics. He also received funding from Novartis and is the director of the Novartis‐Berkeley Center for Proteomics and Chemistry Technologies.
Supporting information
Expanded View Figures PDF
Table EV1
Table EV2
Source Data for Expanded View
Review Process File
Source Data for Figure 1
Source Data for Figure 2
Source Data for Figure 3
Source Data for Figure 4
Source Data for Figure 5
Acknowledgements
We thank Dr. C. Paillart for his support in the CLAMS studies, and Drs. Seo Y. and Huynh T. for PET/CT scan. This work was supported by the NIH (DK97441 and DK108822) and the Edward Mallinckrodt, Jr. Foundation to SK. CHS is supported by Sao Paulo Research Foundation (FAPESP:2016/03682‐3). KI is supported by the Manpei Suzuki Diabetes Foundation, and TY is supported by the JSPS Fellowships.
EMBO reports (2020) 21: e49828
Data availability
This study includes no data deposited in external repositories. All data are presented in the Source Data files.
References
- Albers JJ, Tollefson JH, Chen CH, Steinmetz A (1984) Isolation and characterization of human plasma lipid transfer proteins. Arteriosclerosis 4: 49–58 [DOI] [PubMed] [Google Scholar]
- Albers JJ, Wolfbauer G, Cheung MC, Day JR, Ching AF, Lok S, Tu AY (1995) Functional expression of human and mouse plasma phospholipid transfer protein: effect of recombinant and plasma PLTP on HDL subspecies. Biochim Biophys Acta 1258: 27–34 [DOI] [PubMed] [Google Scholar]
- Albers JJ, Vuletic S, Cheung MC (2012) Role of plasma phospholipid transfer protein in lipid and lipoprotein metabolism. Biochim Biophys Acta 1821: 345–357 [DOI] [PMC free article] [PubMed] [Google Scholar]
- Ali Khan A, Hansson J, Weber P, Foehr S, Krijgsveld J, Herzig S, Scheideler M (2018) Comparative secretome analyses of primary murine white and brown adipocytes reveal novel adipokines. Mol Cell Proteomics 17: 2358–2370 [DOI] [PMC free article] [PubMed] [Google Scholar]
- Argmann CA, Houten SM, Champy MF, Auwerx J (2006) Lipid and bile acid analysis. Curr Protoc Mol Biol Chapter 29 [DOI] [PubMed] [Google Scholar]
- Bartelt A, Bruns OT, Reimer R, Hohenberg H, Ittrich H, Peldschus K, Kaul MG, Tromsdorf UI, Weller H, Waurisch C et al (2011) Brown adipose tissue activity controls triglyceride clearance. Nat Med 17: 200–205 [DOI] [PubMed] [Google Scholar]
- Barter PJ, Rye KA, Tardif JC, Waters DD, Boekholdt SM, Breazna A, Kastelein JJ (2011) Effect of torcetrapib on glucose, insulin, and hemoglobin A1c in subjects in the investigation of lipid level management to understand its impact in atherosclerotic events (ILLUMINATE) trial. Circulation 124: 555–562 [DOI] [PubMed] [Google Scholar]
- Benjamin DI, Cozzo A, Ji X, Roberts LS, Louie SM, Mulvihill MM, Luo K, Nomura DK (2013) Ether lipid generating enzyme AGPS alters the balance of structural and signaling lipids to fuel cancer pathogenicity. Proc Natl Acad Sci USA 110: 14912–14917 [DOI] [PMC free article] [PubMed] [Google Scholar]
- Bouly M, Masson D, Gross B, Jiang XC, Fievet C, Castro G, Tall AR, Fruchart JC, Staels B, Lagrost L et al (2001) Induction of the phospholipid transfer protein gene accounts for the high density lipoprotein enlargement in mice treated with fenofibrate. J Biol Chem 276: 25841–25847 [DOI] [PubMed] [Google Scholar]
- Briand F, Prunet‐Marcassus B, Thieblemont Q, Costard C, Muzotte E, Sordello S, Sulpice T (2014) Raising HDL with CETP inhibitor torcetrapib improves glucose homeostasis in dyslipidemic and insulin resistant hamsters. Atherosclerosis 233: 359–362 [DOI] [PubMed] [Google Scholar]
- Chavez JA, Knotts TA, Wang LP, Li G, Dobrowsky RT, Florant GL, Summers SA (2003) A role for ceramide, but not diacylglycerol, in the antagonism of insulin signal transduction by saturated fatty acids. J Biol Chem 278: 10297–10303 [DOI] [PubMed] [Google Scholar]
- Chondronikola M, Volpi E, Borsheim E, Porter C, Annamalai P, Enerback S, Lidell ME, Saraf MK, Labbe SM, Hurren NM et al (2014) Brown adipose tissue improves whole‐body glucose homeostasis and insulin sensitivity in humans. Diabetes 63: 4089–4099 [DOI] [PMC free article] [PubMed] [Google Scholar]
- Chondronikola M, Volpi E, Borsheim E, Porter C, Saraf MK, Annamalai P, Yfanti C, Chao T, Wong D, Shinoda K et al (2016) Brown adipose tissue activation is linked to distinct systemic effects on lipid metabolism in humans. Cell Metab 23: 1200–1206 [DOI] [PMC free article] [PubMed] [Google Scholar]
- Chung S, Sawyer JK, Gebre AK, Maeda N, Parks JS (2011) Adipose tissue ATP binding cassette transporter A1 contributes to high‐density lipoprotein biogenesis in vivo . Circulation 124: 1663–1672 [DOI] [PMC free article] [PubMed] [Google Scholar]
- Coskun T, Bina HA, Schneider MA, Dunbar JD, Hu CC, Chen Y, Moller DE, Kharitonenkov A (2008) Fibroblast growth factor 21 corrects obesity in mice. Endocrinology 149: 6018–6027 [DOI] [PubMed] [Google Scholar]
- Deshmukh AS, Peijs L, Beaudry JL, Jespersen NZ, Nielsen CH, Ma T, Brunner AD, Larsen TJ, Bayarri‐Olmos R, Prabhakar BS et al (2019) Proteomics‐based comparative mapping of the secretomes of human brown and white adipocytes reveals EPDR1 as a novel batokine. Cell Metab 30: 963–975 [DOI] [PubMed] [Google Scholar]
- Di Paola M, Cocco T, Lorusso M (2000) Ceramide interaction with the respiratory chain of heart mitochondria. Biochemistry 39: 6660–6668 [DOI] [PubMed] [Google Scholar]
- Dostalova I, Roubicek T, Bartlova M, Mraz M, Lacinova Z, Haluzikova D, Kavalkova P, Matoulek M, Kasalicky M, Haluzik M (2009) Increased serum concentrations of macrophage inhibitory cytokine‐1 in patients with obesity and type 2 diabetes mellitus: the influence of very low calorie diet. Eur J Endocrinol 161: 397–404 [DOI] [PubMed] [Google Scholar]
- Dullaart RP, Sluiter WJ, Dikkeschei LD, Hoogenberg K, Van Tol A (1994) Effect of adiposity on plasma lipid transfer protein activities: a possible link between insulin resistance and high density lipoprotein metabolism. Eur J Clin Invest 24: 188–194 [DOI] [PubMed] [Google Scholar]
- Fisher FM, Chui PC, Antonellis PJ, Bina HA, Kharitonenkov A, Flier JS, Maratos‐Flier E (2010) Obesity is a fibroblast growth factor 21 (FGF21)‐resistant state. Diabetes 59: 2781–2789 [DOI] [PMC free article] [PubMed] [Google Scholar]
- Goldstein JL, DeBose‐Boyd RA, Brown MS (2006) Protein sensors for membrane sterols. Cell 124: 35–46 [DOI] [PubMed] [Google Scholar]
- Gudz TI, Tserng KY, Hoppel CL (1997) Direct inhibition of mitochondrial respiratory chain complex III by cell‐permeable ceramide. J Biol Chem 272: 24154–24158 [DOI] [PubMed] [Google Scholar]
- Hanssen MJ, Hoeks J, Brans B, van der Lans AA, Schaart G, van den Driessche JJ, Jorgensen JA, Boekschoten MV, Hesselink MK, Havekes B et al (2015) Short‐term cold acclimation improves insulin sensitivity in patients with type 2 diabetes mellitus. Nat Med 21: 863–865 [DOI] [PubMed] [Google Scholar]
- Hanssen MJ, van der Lans AA, Brans B, Hoeks J, Jardon KM, Schaart G, Mottaghy FM, Schrauwen P, van Marken Lichtenbelt WD (2016) Short‐term cold acclimation recruits brown adipose tissue in obese humans. Diabetes 65: 1179–1189 [DOI] [PubMed] [Google Scholar]
- Harms MJ, Lim HW, Ho Y, Shapira SN, Ishibashi J, Rajakumari S, Steger DJ, Lazar MA, Won KJ, Seale P (2015) PRDM16 binds MED1 and controls chromatin architecture to determine a brown fat transcriptional program. Genes Dev 29: 298–307 [DOI] [PMC free article] [PubMed] [Google Scholar]
- Hla T, Kolesnick R (2014) C16:0‐ceramide signals insulin resistance. Cell Metab 20: 703–705 [DOI] [PMC free article] [PubMed] [Google Scholar]
- Ikeda K, Kang Q, Yoneshiro T, Camporez JP, Maki H, Homma M, Shinoda K, Chen Y, Lu X, Maretich P et al (2017) UCP1‐independent signaling involving SERCA2b‐mediated calcium cycling regulates beige fat thermogenesis and systemic glucose homeostasis. Nat Med 23: 1454–1465 [DOI] [PMC free article] [PubMed] [Google Scholar]
- Jiang XC, Bruce C (1995) Regulation of murine plasma phospholipid transfer protein activity and mRNA levels by lipopolysaccharide and high cholesterol diet. J Biol Chem 270: 17133–17138 [DOI] [PubMed] [Google Scholar]
- Jiang H, Yazdanyar A, Lou B, Chen Y, Zhao X, Li R, Hoang Bui H, Kuo MS, Navab M, Qin S et al (2015) Adipocyte phospholipid transfer protein and lipoprotein metabolism. Arterioscler Thromb Vasc Biol 35: 316–322 [DOI] [PMC free article] [PubMed] [Google Scholar]
- Johnen H, Lin S, Kuffner T, Brown DA, Tsai VW, Bauskin AR, Wu L, Pankhurst G, Jiang L, Junankar S et al (2007) Tumor‐induced anorexia and weight loss are mediated by the TGF‐beta superfamily cytokine MIC‐1. Nat Med 13: 1333–1340 [DOI] [PubMed] [Google Scholar]
- Kajimura S, Seale P, Tomaru T, Erdjument‐Bromage H, Cooper MP, Ruas JL, Chin S, Tempst P, Lazar MA, Spiegelman BM (2008) Regulation of the brown and white fat gene programs through a PRDM16/CtBP transcriptional complex. Genes Dev 22: 1397–1409 [DOI] [PMC free article] [PubMed] [Google Scholar]
- Kajimura S, Saito M (2014) A new era in brown adipose tissue biology: molecular control of brown fat development and energy homeostasis. Annu Rev Physiol 76: 225–249 [DOI] [PMC free article] [PubMed] [Google Scholar]
- Kajimura S, Spiegelman BM, Seale P (2015) Brown and beige fat: physiological roles beyond heat generation. Cell Metab 22: 546–559 [DOI] [PMC free article] [PubMed] [Google Scholar]
- Kall L, Krogh A, Sonnhammer EL (2007) Advantages of combined transmembrane topology and signal peptide prediction–the Phobius web server. Nucleic Acids Res 35: W429–W432 [DOI] [PMC free article] [PubMed] [Google Scholar]
- Kaser S, Sandhofer A, Foger B, Ebenbichler CF, Igelseder B, Malaimare L, Paulweber B, Patsch JR (2001) Influence of obesity and insulin sensitivity on phospholipid transfer protein activity. Diabetologia 44: 1111–1117 [DOI] [PubMed] [Google Scholar]
- Kathiresan S, Willer CJ, Peloso GM, Demissie S, Musunuru K, Schadt EE, Kaplan L, Bennett D, Li Y, Tanaka T et al (2009) Common variants at 30 loci contribute to polygenic dyslipidemia. Nat Genet 41: 56–65 [DOI] [PMC free article] [PubMed] [Google Scholar]
- Kempf T, Guba‐Quint A, Torgerson J, Magnone MC, Haefliger C, Bobadilla M, Wollert KC (2012) Growth differentiation factor 15 predicts future insulin resistance and impaired glucose control in obese nondiabetic individuals: results from the XENDOS trial. Eur J Endocrinol 167: 671–678 [DOI] [PubMed] [Google Scholar]
- Kharitonenkov A, Shiyanova TL, Koester A, Ford AM, Micanovic R, Galbreath EJ, Sandusky GE, Hammond LJ, Moyers JS, Owens RA et al (2005) FGF‐21 as a novel metabolic regulator. J Clin Invest 115: 1627–1635 [DOI] [PMC free article] [PubMed] [Google Scholar]
- Kharitonenkov A, Wroblewski VJ, Koester A, Chen YF, Clutinger CK, Tigno XT, Hansen BC, Shanafelt AB, Etgen GJ (2007) The metabolic state of diabetic monkeys is regulated by fibroblast growth factor‐21. Endocrinology 148: 774–781 [DOI] [PubMed] [Google Scholar]
- Kong X, Yao T, Zhou P, Kazak L, Tenen D, Lyubetskaya A, Dawes BA, Tsai L, Kahn BB, Spiegelman BM et al (2018) Brown adipose tissue controls skeletal muscle function via the secretion of myostatin. Cell Metab 28: 631–643 [DOI] [PMC free article] [PubMed] [Google Scholar]
- Lisowski L, Tay SS, Alexander IE (2015) Adeno‐associated virus serotypes for gene therapeutics. Curr Opin Pharmacol 24: 59–67 [DOI] [PubMed] [Google Scholar]
- Liu X, Wang S, You Y, Meng M, Zheng Z, Dong M, Lin J, Zhao Q, Zhang C, Yuan X et al (2015) Brown adipose tissue transplantation reverses obesity in Ob/Ob mice. Endocrinology 156: 2461–2469 [DOI] [PubMed] [Google Scholar]
- Lynes MD, Leiria LO, Lundh M, Bartelt A, Shamsi F, Huang TL, Takahashi H, Hirshman MF, Schlein C, Lee A et al (2017) The cold‐induced lipokine 12,13‐diHOME promotes fatty acid transport into brown adipose tissue. Nat Med 23: 631–637 [DOI] [PMC free article] [PubMed] [Google Scholar]
- Macia L, Tsai VW, Nguyen AD, Johnen H, Kuffner T, Shi YC, Lin S, Herzog H, Brown DA, Breit SN et al (2012) Macrophage inhibitory cytokine 1 (MIC‐1/GDF15) decreases food intake, body weight and improves glucose tolerance in mice on normal & obesogenic diets. PLoS ONE 7: e34868 [DOI] [PMC free article] [PubMed] [Google Scholar]
- Mahdaviani K, Chess D, Wu Y, Shirihai O, Aprahamian TR (2016) Autocrine effect of vascular endothelial growth factor‐A is essential for mitochondrial function in brown adipocytes. Metabolism 65: 26–35 [DOI] [PMC free article] [PubMed] [Google Scholar]
- Meikle PJ, Summers SA (2017) Sphingolipids and phospholipids in insulin resistance and related metabolic disorders. Nat Rev Endocrinol 13: 79–91 [DOI] [PubMed] [Google Scholar]
- Molinaro A, Wahlstrom A, Marschall HU (2018) Role of bile acids in metabolic control. Trends Endocrinol Metab 29: 31–41 [DOI] [PubMed] [Google Scholar]
- Mullican SE, Lin‐Schmidt X, Chin CN, Chavez JA, Furman JL, Armstrong AA, Beck SC, South VJ, Dinh TQ, Cash‐Mason TD et al (2017) GFRAL is the receptor for GDF15 and the ligand promotes weight loss in mice and nonhuman primates. Nat Med 23: 1150–1157 [DOI] [PubMed] [Google Scholar]
- Murdoch SJ, Carr MC, Hokanson JE, Brunzell JD, Albers JJ (2000) PLTP activity in premenopausal women. Relationship with lipoprotein lipase, HDL, LDL, body fat, and insulin resistance. J Lipid Res 41: 237–244 [PubMed] [Google Scholar]
- Nielsen H (2017) Predicting secretory proteins with SignalP. Methods Mol Biol 1611: 59–73 [DOI] [PubMed] [Google Scholar]
- Nishida HI, Klock DG, Guo Z, Jakstys BP, Nishida T (1997) Phospholipid transfer protein can transform reconstituted discoidal HDL into vesicular structures. Biochim Biophys Acta 1349: 222–232 [DOI] [PubMed] [Google Scholar]
- Nisoli E, Tonello C, Benarese M, Liberini P, Carruba MO (1996) Expression of nerve growth factor in brown adipose tissue: implications for thermogenesis and obesity. Endocrinology 137: 495–503 [DOI] [PubMed] [Google Scholar]
- Ohno H, Shinoda K, Spiegelman BM, Kajimura S (2012) PPARgamma agonists induce a white‐to‐brown fat conversion through stabilization of PRDM16 protein. Cell Metab 15: 395–404 [DOI] [PMC free article] [PubMed] [Google Scholar]
- Olsen JM, Csikasz RI, Dehvari N, Lu L, Sandstrom A, Oberg AI, Nedergaard J, Stone‐Elander S, Bengtsson T (2017) beta3‐Adrenergically induced glucose uptake in brown adipose tissue is independent of UCP1 presence or activity: mediation through the mTOR pathway. Mol Metab 6: 611–619 [DOI] [PMC free article] [PubMed] [Google Scholar]
- Oram JF, Wolfbauer G, Tang C, Davidson WS, Albers JJ (2008) An amphipathic helical region of the N‐terminal barrel of phospholipid transfer protein is critical for ABCA1‐dependent cholesterol efflux. J Biol Chem 283: 11541–11549 [DOI] [PMC free article] [PubMed] [Google Scholar]
- Raichur S, Wang ST, Chan PW, Li Y, Ching J, Chaurasia B, Dogra S, Ohman MK, Takeda K, Sugii S et al (2014) CerS2 haploinsufficiency inhibits beta‐oxidation and confers susceptibility to diet‐induced steatohepatitis and insulin resistance. Cell Metab 20: 687–695 [DOI] [PubMed] [Google Scholar]
- Seale P, Kajimura S, Yang W, Chin S, Rohas LM, Uldry M, Tavernier G, Langin D, Spiegelman BM (2007) Transcriptional control of brown fat determination by PRDM16. Cell Metab 6: 38–54 [DOI] [PMC free article] [PubMed] [Google Scholar]
- Shinoda K, Luijten IH, Hasegawa Y, Hong H, Sonne SB, Kim M, Xue R, Chondronikola M, Cypess AM, Tseng YH et al (2015) Genetic and functional characterization of clonally derived adult human brown adipocytes. Nat Med 21: 389–394 [DOI] [PMC free article] [PubMed] [Google Scholar]
- Siebel AL, Natoli AK, Yap FY, Carey AL, Reddy‐Luthmoodoo M, Sviridov D, Weber CI, Meneses‐Lorente G, Maugeais C, Forbes JM et al (2013) Effects of high‐density lipoprotein elevation with cholesteryl ester transfer protein inhibition on insulin secretion. Circ Res 113: 167–175 [DOI] [PubMed] [Google Scholar]
- Siebel AL, Heywood SE, Kingwell BA (2015) HDL and glucose metabolism: current evidence and therapeutic potential. Front Pharmacol 6: 258 [DOI] [PMC free article] [PubMed] [Google Scholar]
- Siersbaek MS, Loft A, Aagaard MM, Nielsen R, Schmidt SF, Petrovic N, Nedergaard J, Mandrup S (2012) Genome‐wide profiling of peroxisome proliferator‐activated receptor gamma in primary epididymal, inguinal, and brown adipocytes reveals depot‐selective binding correlated with gene expression. Mol Cell Biol 32: 3452–3463 [DOI] [PMC free article] [PubMed] [Google Scholar]
- Stanford KI, Middelbeek RJ, Townsend KL, An D, Nygaard EB, Hitchcox KM, Markan KR, Nakano K, Hirshman MF, Tseng YH et al (2013) Brown adipose tissue regulates glucose homeostasis and insulin sensitivity. J Clin Invest 123: 215–223 [DOI] [PMC free article] [PubMed] [Google Scholar]
- Stratford S, DeWald DB, Summers SA (2001) Ceramide dissociates 3′‐phosphoinositide production from pleckstrin homology domain translocation. Biochem J 354: 359–368 [DOI] [PMC free article] [PubMed] [Google Scholar]
- Summers SA, Garza LA, Zhou H, Birnbaum MJ (1998) Regulation of insulin‐stimulated glucose transporter GLUT4 translocation and Akt kinase activity by ceramide. Mol Cell Biol 18: 5457–5464 [DOI] [PMC free article] [PubMed] [Google Scholar]
- Svensson KJ, Long JZ, Jedrychowski MP, Cohen P, Lo JC, Serag S, Kir S, Shinoda K, Tartaglia JA, Rao RR et al (2016) A Secreted Slit2 fragment regulates adipose tissue thermogenesis and metabolic function. Cell Metab 23: 454–466 [DOI] [PMC free article] [PubMed] [Google Scholar]
- Tall AR, Abreu E, Shuman J (1983) Separation of a plasma phospholipid transfer protein from cholesterol ester/phospholipid exchange protein. J Biol Chem 258: 2174–2180 [PubMed] [Google Scholar]
- Thomou T, Mori MA, Dreyfuss JM, Konishi M, Sakaguchi M, Wolfrum C, Rao TN, Winnay JN, Garcia‐Martin R, Grinspoon SK et al (2017) Adipose‐derived circulating miRNAs regulate gene expression in other tissues. Nature 542: 450–455 [DOI] [PMC free article] [PubMed] [Google Scholar]
- Tu AY, Albers JJ (2001) Functional analysis of the transcriptional activity of the mouse phospholipid transfer protein gene. Biochem Biophys Res Commun 287: 921–926 [DOI] [PubMed] [Google Scholar]
- Turpin SM, Nicholls HT, Willmes DM, Mourier A, Brodesser S, Wunderlich CM, Mauer J, Xu E, Hammerschmidt P, Bronneke HS et al (2014) Obesity‐induced CerS6‐dependent C16:0 ceramide production promotes weight gain and glucose intolerance. Cell Metab 20: 678–686 [DOI] [PubMed] [Google Scholar]
- Turpin‐Nolan SM, Bruning JC (2020) The role of ceramides in metabolic disorders: when size and localization matters. Nat Rev Endocrinol 16: 224–233 [DOI] [PubMed] [Google Scholar]
- UniProt Consortium T (2018) UniProt: the universal protein knowledgebase. Nucleic Acids Res 46: 2699 [DOI] [PMC free article] [PubMed] [Google Scholar]
- Villarroya F, Cereijo R, Villarroya J, Giralt M (2017) Brown adipose tissue as a secretory organ. Nat Rev Endocrinol 13: 26–35 [DOI] [PubMed] [Google Scholar]
- Wang GX, Zhao XY, Meng ZX, Kern M, Dietrich A, Chen Z, Cozacov Z, Zhou D, Okunade AL, Su X et al (2014) The brown fat‐enriched secreted factor Nrg4 preserves metabolic homeostasis through attenuation of hepatic lipogenesis. Nat Med 20: 1436–1443 [DOI] [PMC free article] [PubMed] [Google Scholar]
- Watanabe M, Houten SM, Mataki C, Christoffolete MA, Kim BW, Sato H, Messaddeq N, Harney JW, Ezaki O, Kodama T et al (2006) Bile acids induce energy expenditure by promoting intracellular thyroid hormone activation. Nature 439: 484–489 [DOI] [PubMed] [Google Scholar]
- Wolfbauer G, Albers JJ, Oram JF (1999) Phospholipid transfer protein enhances removal of cellular cholesterol and phospholipids by high‐density lipoprotein apolipoproteins. Biochim Biophys Acta 1439: 65–76 [DOI] [PubMed] [Google Scholar]
- Xiong Y, Walker K, Min X, Hale C, Tran T, Komorowski R, Yang J, Davda J, Nuanmanee N, Kemp D et al (2017) Long‐acting MIC‐1/GDF15 molecules to treat obesity: evidence from mice to monkeys. Sci Transl Med 9: eaan8732 [DOI] [PubMed] [Google Scholar]
- Xiong W, Zhao X, Villacorta L, Rom O, Garcia‐Barrio MT, Guo Y, Fan Y, Zhu T, Zhang J, Zeng R et al (2018) Brown adipocyte‐specific PPARgamma (peroxisome proliferator‐activated receptor gamma) deletion impairs perivascular adipose tissue development and enhances atherosclerosis in mice. Arterioscler Thromb Vasc Biol 38: 1738–1747 [DOI] [PMC free article] [PubMed] [Google Scholar]
- Xu J, Lloyd DJ, Hale C, Stanislaus S, Chen M, Sivits G, Vonderfecht S, Hecht R, Li YS, Lindberg RA et al (2009) Fibroblast growth factor 21 reverses hepatic steatosis, increases energy expenditure, and improves insulin sensitivity in diet‐induced obese mice. Diabetes 58: 250–259 [DOI] [PMC free article] [PubMed] [Google Scholar]
- Yoneshiro T, Wang Q, Tajima K, Matsushita M, Maki H, Igarashi K, Dai Z, White PJ, McGarrah RW, Ilkayeva OR et al (2019) BCAA catabolism in brown fat controls energy homeostasis through SLC25A44. Nature 572: 614–619 [DOI] [PMC free article] [PubMed] [Google Scholar]
- Yu J, Novgorodov SA, Chudakova D, Zhu H, Bielawska A, Bielawski J, Obeid LM, Kindy MS, Gudz TI (2007) JNK3 signaling pathway activates ceramide synthase leading to mitochondrial dysfunction. J Biol Chem 282: 25940–25949 [DOI] [PubMed] [Google Scholar]
- Yue F, Cheng Y, Breschi A, Vierstra J, Wu W, Ryba T, Sandstrom R, Ma Z, Davis C, Pope BD et al (2014) A comparative encyclopedia of DNA elements in the mouse genome. Nature 515: 355–364 [DOI] [PMC free article] [PubMed] [Google Scholar]
- Zeng X, Ye M, Resch JM, Jedrychowski MP, Hu B, Lowell BB, Ginty DD, Spiegelman BM (2019) Innervation of thermogenic adipose tissue via a calsyntenin 3beta‐S100b axis. Nature 569: 229–235 [DOI] [PMC free article] [PubMed] [Google Scholar]
- Zigdon H, Kogot‐Levin A, Park JW, Goldschmidt R, Kelly S, Merrill AH Jr, Scherz A, Pewzner‐Jung Y, Saada A, Futerman AH (2013) Ablation of ceramide synthase 2 causes chronic oxidative stress due to disruption of the mitochondrial respiratory chain. J Biol Chem 288: 4947–4956 [DOI] [PMC free article] [PubMed] [Google Scholar]
Associated Data
This section collects any data citations, data availability statements, or supplementary materials included in this article.
Supplementary Materials
Expanded View Figures PDF
Table EV1
Table EV2
Source Data for Expanded View
Review Process File
Source Data for Figure 1
Source Data for Figure 2
Source Data for Figure 3
Source Data for Figure 4
Source Data for Figure 5
Data Availability Statement
This study includes no data deposited in external repositories. All data are presented in the Source Data files.