

Abstract
Synaptic mitochondria are particularly vulnerable to physiological insults, and defects in synaptic mitochondria are linked to early pathophysiology of Alzheimer's disease (AD). Mitophagy, a cargo‐specific autophagy for elimination of dysfunctional mitochondria, constitutes a key quality control mechanism. However, how mitophagy ensures synaptic mitochondrial integrity remains largely unknown. Here, we reveal Rheb and Snapin as key players regulating mitochondrial homeostasis at synapses. Rheb initiates mitophagy to target damaged mitochondria for autophagy, whereas dynein–Snapin‐mediated retrograde transport promotes clearance of mitophagosomes from synaptic terminals. We demonstrate that synaptic accumulation of mitophagosomes is a feature in AD‐related mutant hAPP mouse brains, which is attributed to increased mitophagy initiation coupled with impaired removal of mitophagosomes from AD synapses due to defective retrograde transport. Furthermore, while deficiency in dynein–Snapin‐mediated retrograde transport recapitulates synaptic mitophagy stress and induces synaptic degeneration, elevated Snapin expression attenuates mitochondrial defects and ameliorates synapse loss in AD mouse brains. Taken together, our study provides new insights into mitophagy regulation of synaptic mitochondrial integrity, establishing a foundation for mitigating AD‐associated mitochondria deficits and synaptic damage through mitophagy enhancement.
Keywords: Alzheimer's, mitophagosome, retrograde transport, synaptic mitochondrial deficits, synaptic mitophagy
Subject Categories: Autophagy & Cell Death, Membrane & Intracellular Transport, Neuroscience
The integrity of synaptic mitochondria is maintained by a coordination of Rheb‐dependent mitophagy and dynein‐Snapin‐mediated retrograde transport.
Introduction
Neurons have high and continuous energy demands in order to maintain their proper function. Mitochondria are the main cellular energy powerhouses, supplying most of ATP by oxidative phosphorylation (OXPHOS), which is required to fuel critical neuronal functions (Sheng & Cai, 2012; Cai & Tammineni, 2016, 2017; Chamberlain & Sheng, 2019). Mitochondria also enact essential reactions of metabolism and Ca2+ signaling, as well as regulate cellular life/death decisions. Aged and malfunctioning mitochondria are defective in energy production and Ca2+ buffering, and also release reactive oxygen species (ROS) that are harmful at high concentrations. These defects compromise support in synaptic activities (Reddy et al, 2010; Reddy, 2011; Sheng & Cai, 2012; Cai & Tammineni, 2017). Thus, it is not unexpected that volumes of evidence suggest that mitochondrial dysfunction underlies cognitive impairment in neuronal aging and is one of the most notable hallmarks of age‐related neurodegenerative diseases. Importantly, the earliest features of the onset of the highly prevalent Alzheimer's disease (AD) have been linked to mitochondrial pathology—abnormal accumulation of damaged mitochondria (Gibson & Shi, 2010; Swerdlow et al, 2010; Cai & Tammineni, 2016; Reddy & Oliver, 2019). Mitochondrial quality control, then, emerges as a central problem in the most common neurodegenerative disorders and is a clear target point for early interference in disease. Mitophagy, a specialized form of autophagy, constitutes a key mitochondrial quality control mechanism involving sequestration of damaged mitochondria into autophagosomes for subsequent degradation within lysosomes (Youle & Narendra, 2011; Sheng & Cai, 2012; Cai & Tammineni, 2016; Pickles et al, 2018). Even though some unique features of mitophagy in neurons have been described, mechanistic understanding of neuronal mitophagy and its link to pathological conditions remains very limited. Autophagocytosis of mitochondria in neurons was shown to be a feature in AD patient brains (Moreira et al, 2007a,b). Mitophagic abnormalities in AD have been demonstrated in a number of recent studies (Ye et al, 2015; Du et al, 2017; Manczak et al, 2018; Reddy et al, 2018; Cummins et al, 2019; Fang et al, 2019). Moreover, mitophagy stimulation was shown to abolish AD pathology and reverse memory impairment in AD models (Du et al, 2017; Fang et al, 2019). Therefore, there is an urgent need to investigate the detailed interaction between mitophagy deregulation and AD‐linked pathological processes.
Healthy mitochondria must function at synapses for neurotransmission. It has been well established that mitochondria‐mediated ATP supply and Ca2+ buffering sustain various essential functions at synaptic sites (Manji et al, 2012; Sheng & Cai, 2012). However, the mechanism underlying mitochondrial maintenance at synaptic terminals is understudied in neurobiology. A major gap in our understanding is whether mitophagy serves as a key player to ensure mitochondrial integrity and function at synapses, crucial for the support of synaptic activities. Early deficit in synaptic mitochondria has been implicated in the development of synaptic pathology in AD (Reddy & Beal, 2008; Du et al, 2010, 2012; Reddy, 2011; Cai & Tammineni, 2017; Guo et al, 2017). Synaptic mitochondria are more susceptible to amyloid β (Aβ)‐induced damage and display early and significant accumulation of Aβ in AD brains before extensive extracellular Aβ deposition (Reddy & Beal, 2008; Du et al, 2012; Cai & Tammineni, 2017). Early‐impacted mitochondria underwent declines in respiration, complex IV activity, and Ca2+ handling capacity, as well as elevated ROS production and enhanced probability of mitochondrial permeability transition pore (MPTP) (Reddy & Beal, 2008; Reddy et al, 2010; Reddy, 2011; Du et al, 2012; Cai & Tammineni, 2017; Tonnies & Trushina, 2017). This raises an important question as to whether synaptic mitochondrial deficit is attributed to impaired mitochondrial maintenance as a result of defects in removal of damaged mitochondria from AD synapses.
In the current study, we reveal that small GTPase Ras homolog enriched in brains (Rheb) initiates mitophagy and coordinates with dynein–Snapin‐mediated retrograde transport, thus regulating the integrity of synaptic mitochondria. Rheb facilitates autophagic recruitment of damaged mitochondria to form mitophagosomes in distal axons, whereas dynein–Snapin‐mediated retrograde transport removes nascent mitophagosomes and thus reduces mitochondrial stress at synaptic terminals. Furthermore, our studies uncover that AD‐related mutant hAPP mouse brains exhibit robust presynaptic retention of mitophagosomes. Such a defect is caused by increased mitophagy initiation and impaired retrograde transport of mitophagosomes. Ablation of snapin in mouse brains mimics AD‐associated synaptic mitophagy stress accompanied by synaptic degeneration. In contrast, Snapin‐enhanced retrograde transport attenuates synaptic mitochondrial defects through promoting removal of axonal mitophagosomes, thereby ameliorating synapse loss in AD mouse brains. Therefore, our findings provide new insights into the involvement of mitophagy failure in synaptic mitochondrial deficits and thus advance our understanding of the mechanisms underlying AD‐linked synaptic deterioration, one of the earliest pathologies in stricken neurons.
Results
Rheb initiates mitophagy within axons upon mitochondrial damage
We determined whether mitophagy is critical for maintaining mitochondrial integrity in the axons of neurons. Rheb was previously reported to be associated with mitochondria and promote autophagic engulfment of mitochondria in HeLa and muscle cells (Melser et al, 2013, 2015). We first examined whether Rheb is involved in autophagic removal of damaged mitochondria within axons. We conducted time‐lapse imaging in live mature cortical neurons treated with CCCP, a mitochondrial membrane potential (Δψm) uncoupler. Under basal conditions, Rheb is mainly present in the cytoplasm of axons and displays limited association with mitochondria. Strikingly, CCCP treatment induces robust Rheb localization to depolarized mitochondria. Rheb‐associated mitochondria exhibit dominant retrograde movement along axons (anterograde, 2.51% ± 0.82%; retrograde, 29.88% ± 2.37%) (Fig 1A–C). Time‐lapse images have shown that Rheb co‐localizes and co‐migrates with mitochondria along axons treated with CCCP. Interestingly, Rheb‐tagged mitochondria exhibit high motility and move exclusively in a retrograde direction (Fig 1A and B). Consistent with our previous studies (Cai et al, 2012b; Ye et al, 2015; Lin et al, 2017), CCCP treatment remarkably reduces anterograde transport, but increases retrograde transport, of mitochondria along axons (anterograde, DMSO: 24.51% ± 2.25%; CCCP: 7.66% ± 1.42%; P < 0.001; retrograde, DMSO: 13.82% ± 1.23%; CCCP: 25.72% ± 1.65%; P < 0.001) (Fig EV1A and B). It is known that Parkin‐mediated mitophagy induction leads to decreased anterograde transport of mitochondria. This is caused by Parkin‐triggered and ubiquitin–proteasome system (UPS)‐mediated degradation of mitochondrial Rho GTPase (Miro), a component of the adaptor–motor complex essential for KIF5 motors to drive anterograde transport of mitochondria in axons (Chan & Chan, 2011; Wang et al, 2011; Liu et al, 2012; Bingol et al, 2014; Birsa et al, 2014). We hypothesize that enhanced retrograde transport could be attributed to activation of Rheb‐dependent mitophagy.
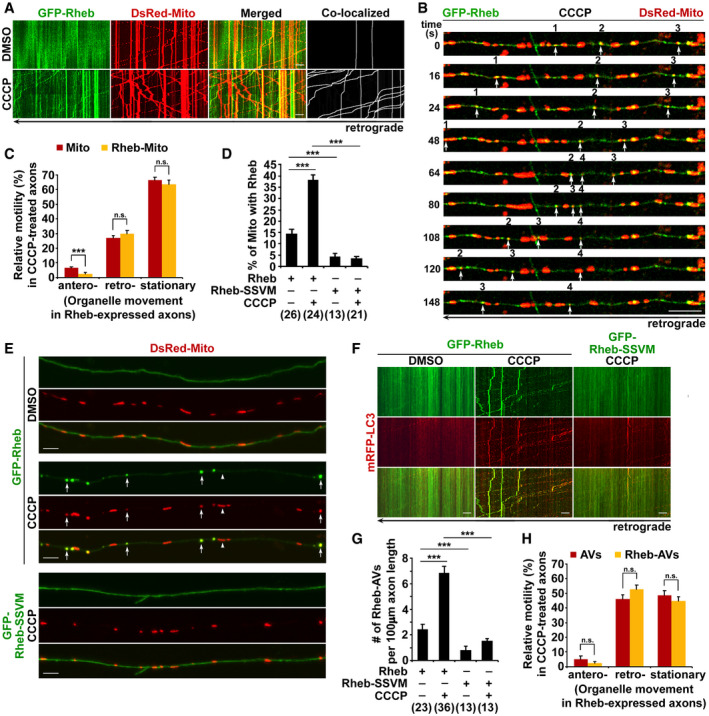
Figure 1. Rheb initiates mitophagy within axons upon mitochondrial damage.
-
A–CRepresentative dual‐channel kymographs (A) and quantitative analysis (C) showing that Rheb is recruited to mitochondria in axons and co‐migrates with mitochondria in a predominant retrograde direction upon mitochondrial membrane potential (Δψm) dissipation. The motility of mitochondria (Mito) and Rheb‐associated mitochondria (Rheb‐Mito) in axons was quantified, respectively. Vertical lines represent stationary organelles. Slanted lines or curves to the right (negative slope) represent anterograde movement; those to the left (positive slope) indicate retrograde movement. An organelle was considered stationary if it remained immotile (displacement ≤ 5 μm). Time‐lapse images (B) showing co‐localization and comigration (white arrows) of Rheb with mitochondria in a retrograde direction along axons during a 148‐s recording period. Cortical neurons were transfected with GFP‐Rheb and DsRed‐Mito at 5–7 DIV and incubated with DMSO or 10 μM CCCP for 24 h prior to imaging at 10–12 DIV.
-
D, EQuantitative analysis (D) and representative images (E) showing robust association of Rheb with depolarized mitochondria within axons treated with CCCP. Rheb‐SSVM, a farnesylation‐deficient mutant of Rheb, fails to be recruited to mitochondria upon dissipating Δψm. Mitochondria associated with Rheb were marked by white arrows. The percentages of mitochondria targeted by Rheb or Rheb‐SSVM in the presence or absence of CCCP were quantified, respectively (D).
-
F–HRepresentative dual‐channel kymographs (F) and quantitative analysis (G, H) showing that Rheb‐mediated mitophagy activation depends on Rheb recruitment to mitochondria through Rheb farnesylation. Note that Rheb, but not Rheb‐SSVM, is associated with autophagic vacuoles (AVs) within axons upon Δψm dissipation. Rheb‐associated AVs move mainly in a retrograde direction along axons. The number of Rheb‐associated AVs (Rheb‐AVs) with or without CCCP treatment and the relative motilities of AVs and Rheb‐AVs in CCCP‐treated axons were quantified, respectively (G, H).
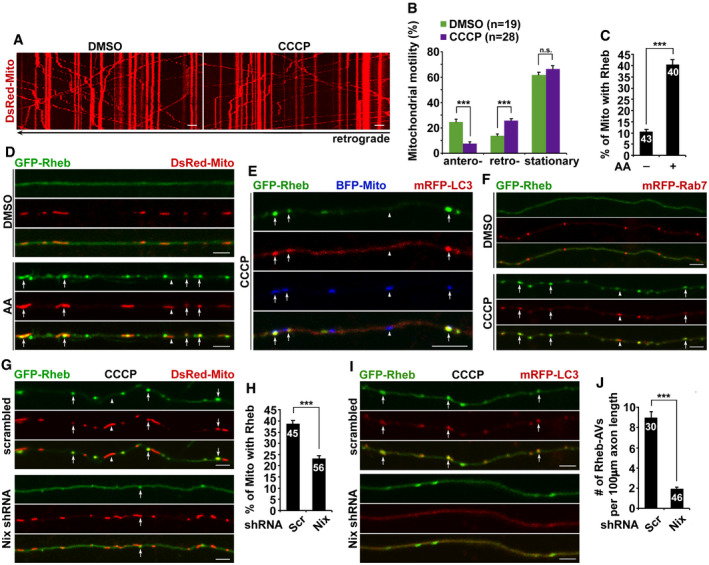
Figure EV1. Rheb mediates mitophagy initiation in axons that requires Nix.
-
A, BRepresentative kymographs (A) and quantitative analysis (B) showing that Δψm depolarization increases retrograde transport but reduces anterograde transport of mitochondria along axons. The relative motility of mitochondria in axons treated with DMSO or CCCP was quantified (B). Data were quantified from the total number of neurons (n) indicated in parentheses (B) from more than four experiments.
-
C, DQuantitative analysis (C) and representative kymographs (D) showing robust recruitment of Rheb to depolarized mitochondria within axons after treatment with antimycin A (AA). The percentage of white arrow‐indicated mitochondria that were targeted by Rheb in the presence or absence of AA was quantified (C).
-
ERepresentative triple‐channel images showing that Rheb‐associated mitochondria are targeted to autophagy after CCCP treatment. Rheb‐tagged mitochondria (marked by arrows) are positive for LC3, whereas LC3 cannot be detected on mitochondria without Rheb association.
-
FRab7, a late endosome/amphisome marker, is associated with Rheb‐targeted mitophagosomes as indicated by white arrows within axons under CCCP treatment.
-
G, HRepresentative images (G) and quantitative analysis (H) showing that Nix RNAi reduces mitochondrial recruitment of Rheb in axons upon CCCP‐induced Δψm dissipation. The percentage of mitochondria targeted by Rheb (white arrows) in axons expressing scrambled shRNA or Nix shRNA was quantified (H).
-
I, JImpaired biogenesis of mitophagosomes within CCCP‐treated axons expressing Nix shRNA. Note that Rheb‐associated mitophagosomes are markedly decreased following Nix RNAi. The number of Rheb‐targeted autophagic vacuoles (AVs) (Rheb‐AVs) labeled by white arrows in axons expressing scrambled shRNA or Nix shRNA was quantified (J).
Δψm dissipation leads to increased percentage of mitochondria targeted by Rheb (DMSO: 14.53% ± 1.21%; CCCP: 35.24% ± 1.91%, P < 0.001) (Fig 1D and E). Alternatively, we examined the effects of antimycin A (AA), a mitochondrial electron transport chain complex III inhibitor. Our previous studies have shown that a low concentration (1 μM) of AA in neurons depolarizes Δψm, which is coupled with decreased mitochondrial respiration (Cai et al, 2012b; Lin et al, 2017). In the current study, AA treatment leads to a significant increase in Rheb localization to depolarized mitochondria within axons (40.59% ± 1.98%) (Fig EV1C and D), a finding consistent with our observation in CCCP‐treated axons (Fig 1D and E). Furthermore, we did not observe enhanced mitochondrial association with Rheb‐SSVM (Rheb‐SSVM: 3.46% ± 0.87%, P < 0.001), a farnesylation‐deficient mutant of Rheb (Basso et al, 2005). Thus, our data suggest that Rheb is recruited to depolarized mitochondria in axons, which is dependent on Rheb farnesylation.
We have provided additional evidence showing that Rheb is associated with autophagic vacuoles (AVs), and CCCP treatment significantly increases the number of Rheb‐associated AVs (Rheb‐AVs) within axons (DMSO: 2.46 ± 0.35; CCCP: 6.86 ± 0.53; P < 0.001) (Fig 1F–H). Similar to AVs, these Rheb‐AVs exhibit robust retrograde movement along axons. Our triple‐channel image data further demonstrated that Rheb‐associated AVs in axons contain engulfed mitochondria, suggesting that they are mitophagosomes in nature (Fig EV1E). In contrast, the same treatment fails to increase the number of Rheb‐SSVM‐associated AVs (1.53 ± 0.19; Fig 1F and G), suggesting that Rheb localization to mitochondria is an essential step to initiate mitophagy in axons. Our data are consistent with previous studies showing that autophagosomes containing mitochondria move in a retrograde direction along axons (Maday et al, 2012; Wong & Holzbaur, 2014). This supports the possibility that mitophagy plays a role in regulating proper turnover of axonal mitochondria.
Our previous studies reported that nascent autophagosomes recruit dynein–Snapin, a motor–adaptor complex, to gain retrograde transport motility through fusion with late endosomes (LEs) to form amphisomes. Such a mechanism facilitates removal of AVs from distal axons for lysosomal degradation in the soma (Cheng et al, 2015a,b). Interestingly, Rheb‐associated mitophagosomes are mostly positive for Rab7, a LE/amphisome marker (Fig EV1F). These data suggest that newly generated mitophagosomes fuse rapidly with LEs to form amphi‐mitophagosomes, through which nascent mitophagosomes are loaded with dynein–Snapin transport machinery to enable retrograde transport motility. This result allows us to propose that Rheb‐dependent mitophagy initiation coordinates with dynein–Snapin‐mediated retrograde transport to remove damaged mitochondria from axonal terminals.
Rheb‐mediated mitophagy in axons requires Nix but not Parkin
Next, we examined whether Rheb‐associated mitophagy requires Nix, an outer mitochondrial membrane protein (Youle & Narendra, 2011; Cai & Jeong, 2020). Utilizing Nix shRNA that was previously described (Fei et al, 2004; Melser et al, 2013), we found that Nix RNAi results in markedly reduced localization of Rheb to axonal mitochondria upon Δψm dissipation (Scrambled shRNA: 38.83% ± 1.34%; Nix shRNA: 23.31% ± 1.26%; P < 0.001; Fig EV1G and H). Furthermore, Rheb‐mediated autophagic targeting of mitochondria is impaired in axons expressing Nix shRNA, as evidenced by decreased number of Rheb‐AVs (Scrambled shRNA: 8.99 ± 0.61; Nix shRNA: 1.92 ± 0.16; P < 0.001) (Fig EV1I and J). Thus, our observations collectively indicate that Nix is involved in Rheb‐mediated mitophagy initiation through facilitating Rheb association with damaged mitochondria to promote mitochondrial targeting for autophagy.
We next sought to address whether enhanced mitochondrial recruitment of Rheb promotes mitophagosome formation in axons. Strikingly, following dissipation of Δψm, axons expressing Rheb show a significant increase in the number of AVs and Mito‐AVs/mitophagosomes (Ctrl: AVs: 7.41 ± 0.69; Mito‐AVs: 3.51 ± 0.27; Rheb: AVs: 12.88 ± 0.45, P < 0.001; Mito‐AVs: 6.77 ± 0.41, P < 0.001), accompanied by increased percentage of mitochondria within AVs (Ctrl: 21.99% ± 1.88%; Rheb: 42.76% ± 2.86%; P < 0.001; Fig 2A and B). Moreover, these mitophagosomes move exclusively in a retrograde direction, which is markedly enhanced in Rheb‐expressed axons (Ctrl: 21.14% ± 3.52%; Rheb: 35.54% ± 2.90%; P < 0.001) (Fig 2A and C). This result supports our hypothesis that Rheb regulates mitophagosome biogenesis to remove damaged mitochondria from distal axons through retrograde transport.
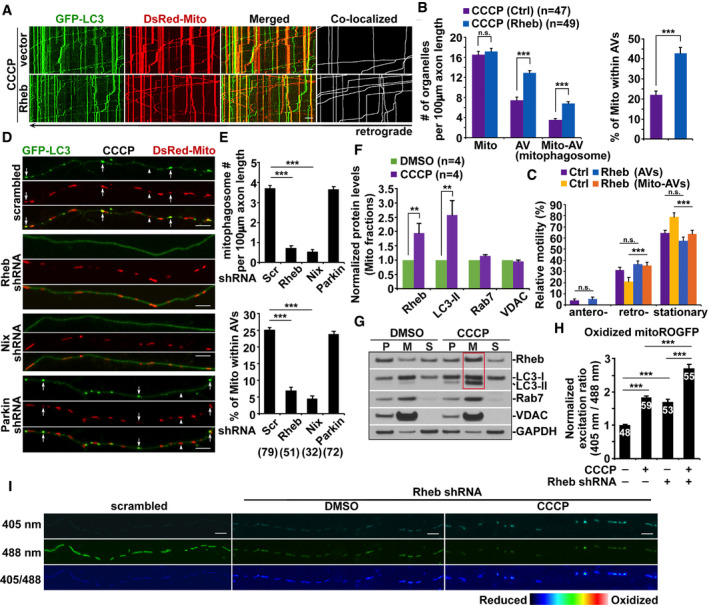
Figure 2. Rheb‐mediated mitophagy in axons requires Nix but not Parkin.
-
A–CRepresentative dual‐channel kymographs (A) and quantitative analysis (B, C) showing that overexpression of Rheb enhances mitophagy in CCCP‐treated axons. The numbers of mitochondria (Mito), AVs, and Mito‐AVs/mitophagosomes, the percentage of Mito within AVs, and the motilities of AVs and Mito‐AVs along axons with and without elevated Rheb expression were quantified, respectively (B, C).
-
D, ERepresentative images (D) and quantitative analysis (E) showing that mitophagy in axons requires Rheb and Nix, but not Parkin. The number of mitophagosomes indicated by white arrows and the percentage of Mito within AVs in CCCP‐treated axons expressing scrambled shRNA, Rheb shRNA, Nix shRNA, or Parkin shRNA were quantified, respectively (E).
-
F, GQuantitative analysis (F) and representative blots (G) showing increased mitochondrial association with Rheb and LC3‐II in mature cortical neurons upon Δψm depolarization. Cortical neurons at 14 DIV were incubated with DMSO or 10 μM CCCP for 24 h and then subjected to fractionation into post‐nuclear supernatant (P), mitochondria‐enriched membrane fraction (M), and cytosolic supernatant (S). Equal amounts of protein (20 μg) were sequentially immunoblotted with antibodies against mitophagic/autophagic proteins Rheb, LC3, and Rab7, mitochondrial protein VDAC, and cytosolic protein GAPDH on the same membranes after stripping between each antibody application. The purity of mitochondrial fractions was confirmed by enrichment of VDAC and less abundance of GAPDH, compared to post‐nuclear supernatant. Protein levels in mitochondrial fractions of CCCP‐treated neurons were normalized to those in neurons incubated with DMSO. Data were quantified from four independent repeats.
-
H, IQuantitative analysis (H) and representative images (I) showing that Rheb RNAi augments axonal retention of oxidized mitochondria upon Δψm depolarization. The fluorescence of MitoROGFP was emitted at 510 nm and excited at 405 nm or 488 nm, respectively. Ratiometric images were generated from fluorescence excited by 405 nm light relative to that excited by 488 nm light. The ratio has been false‐colored with the indicated heat map, with high intensity indicative of ROGFP fluorescence in a more oxidative level (I). Mean fluorescence intensity ratios evoked by the two excitation wavelengths at individual mitochondria in the CCCP‐treated axons expressing scrambled shRNA or Rheb shRNA were quantified and normalized to those of control neurons transfected with scrambled shRNA (H).
To gain mechanistic insights into Rheb‐mediated mitophagy, we performed a series of co‐immunoprecipitation assays. Rheb forms a complex with LC3‐II in cultured cortical neurons in the presence of CCCP (Fig EV2A). In transfected HeLa cells, the Rheb‐LC3‐II complex was detected upon treatment with CCCP, but not DMSO control. Moreover, Nix is associated with the Rheb‐LC3‐II complex (Fig EV2B and C). Our data suggest that, upon Δψm dissipation, Rheb promotes mitophagy by forming a complex with Nix and LC3‐II. Given that Parkin is not present in HeLa cells, this result indicates that such a mechanism is independent of the Parkin pathway. We further conducted imaging studies to address whether Rheb and Nix, but not Parkin, are important for targeting damaged mitochondria for autophagy in axons. After CCCP treatment, the number of mitophagosomes and the percentage of mitochondria within AVs are remarkably reduced in axons expressing Rheb shRNA and Nix shRNA, but not Parkin shRNA and scrambled shRNA (Fig 2D and E). We and others previously demonstrated the knockdown efficiency of Parkin shRNA (Cai et al, 2012b; Rojansky et al, 2016). Together with our biochemical results, these findings collectively suggest that initiation of mitophagy in axons requires Rheb and Nix, but not Parkin.
Figure EV2. Rheb is involved in mitophagy but not autophagy in axons.
-
ARheb‐LC3‐II complex was immunoprecipitated by the antibody against Rheb, but not normal IgG control, from the lysates of cortical neurons treated with CCCP.
-
BRheb‐LC3‐II complex was detected in the lysates of transfected HeLa cells treated with CCCP, but not DMSO control.
-
CImmunoprecipitation of Myc‐Rheb with LC3‐II and HA‐Nix from HeLa cell lysates with an anti‐Myc antibody or normal IgG as a control in the presence of CCCP.
-
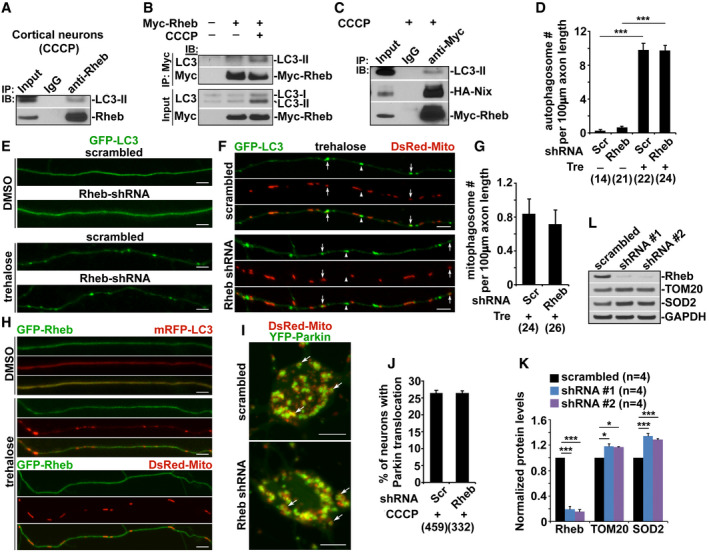
D–GRepresentative images (E, F) and quantitative analysis (D, G) showing that Rheb RNAi has no detectable effects on trehalose (Tre)‐induced autophagy in axons. The numbers of axonal autophagosomes (E) and mitophagosomes (white arrows in F) in neurons expressing scrambled shRNA or Rheb shRNA were quantified in the presence of DMSO or trehalose, respectively (D, G).
-
HRheb is enriched in cytoplasm under basal conditions and is not associated with either autophagosomes or mitochondria in axons upon trehalose treatment.
-
I, JRepresentative images (I) and quantitative analysis (J) showing that Rheb is not required for Parkin‐dependent mitophagy in the soma upon Δψm dissipation. The percentage of total neurons displaying Parkin localization to mitochondria indicated by white arrows in the soma of CCCP‐treated neurons expressing scrambled shRNA or Rheb shRNA was quantified (J).
-
K, LQuantitative analysis (K) and representative blots (L) showing knockdown efficiency of Rheb shRNA (small hairpin RNA, (shRNA) #1 and shRNA #2), and silencing effects on mitochondrial degradation respective to control (scrambled shRNA) in HEK293 cells. Data were quantified from four independent repeats.
We next determined whether the role of Rheb is specific to mitophagy, but not other forms of autophagy. We and others have shown that trehalose induces non‐selective autophagy in neurons (Kruger et al, 2012; Feng et al, 2017). Consistently, trehalose treatment markedly increases the number of AVs within axons, compared to that of control axons treated with (DMSO: 0.25 ± 0.13; Tre: 9.82 ± 0.75, P < 0.001) (Fig EV2D and E). Importantly, Rheb RNAi has no detectable impact on trehalose‐induced autophagy, as evidenced by the unaltered number of axonal AVs (9.74 ± 0.58; P > 0.05). There is no significant difference in the number of mitophagosomes within axons expressing scrambled shRNA and Rheb shRNA (Fig EV2F and G). In addition, Rheb is not associated with autophagosomes and mitochondria in axons upon autophagy induction by trehalose (Fig EV2H). Thus, these results suggest that Rheb plays a critical role in mitophagy, but not in non‐selective autophagy.
We and others have demonstrated that Parkin‐mediated mitophagy primarily occurs in the soma of neurons, where degradative lysosomes are highly enriched (Cai et al, 2010, 2012b; Devireddy et al, 2015; Xie et al, 2015; Ye et al, 2015; Maday & Holzbaur, 2016; Sung et al, 2016; Lin et al, 2017; Tammineni et al, 2017a; Cheng et al, 2018; Lee et al, 2019). We next examined whether Rheb is important for Parkin‐mediated mitophagy. We previously showed that CCCP treatment robustly activates Parkin‐mediated mitophagy, as reflected by increased Parkin translocation onto depolarized mitochondria (Cai et al, 2012a,b; Ye et al, 2015; Lin et al, 2017). Importantly, Rheb RNAi did not change the percentage of neurons showing Parkin association with mitochondria after Δψm dissipation (Fig EV2I and J), suggesting that Rheb is not involved in Parkin‐dependent mitophagy in the soma. Thus, our data are consistent with previous work that Nix‐mediated mitophagy is independent of the PINK1/Parkin pathway (Koentjoro et al, 2017).
To confirm our observations from imaging studies, we purified mitochondria‐enriched factions from cultured cortical neurons treated with DMSO or CCCP. Excitingly, relative to control neurons incubated with DMSO, CCCP‐treated neurons demonstrated a marked increase in Rheb association with depolarized mitochondria, coupled with elevated autophagy marker LC3‐II levels in mitochondria‐enriched factions (Rheb: 1.95 ± 0.35, P < 0.01; LC3‐II: 2.56 ± 0.51, P < 0.01; Fig 2F and G). These data suggest that acute mitochondrial stress induces Rheb‐associated mitophagy in neurons. We next examined whether Rheb‐dependent mitophagy is critical for mitochondrial maintenance in axons. We knocked down Rheb using Rheb‐small hairpin RNA (shRNA). Endogenous Rheb was remarkably reduced in cells expressing Rheb‐shRNA, relative to those in scrambled shRNA expressed cells (Rheb‐shRNA #1: 0.19 ± 0.04; P < 0.001; Rheb‐shRNA #2: 0.16 ± 0.03; P < 0.001; Fig EV2K and L). Interestingly, Rheb RNAi efficiently impacts mitochondrial degradation, as reflected by increased levels of mitochondrial proteins TOM20 (P < 0.05) and SOD2 (P < 0.001). We assessed oxidatively stressed mitochondria in axons using Matrix‐roGFP, RoGFP (reduction–oxidation‐sensitive GFP) in mitochondrial matrix (Waypa et al, 2010; Xie et al, 2013). Oxidized mitochondria are increased in CCCP‐treated axons, compared to those in control axons (1.83 ± 0.05, P < 0.001; Fig 2H and I). More importantly, under basal conditions, we observed significant retention of oxidatively stressed mitochondria within axons expressing Rheb‐shRNA (1.71 ± 0.07, P < 0.001), which is augmented upon Δψm dissipation (2.71 ± 0.12, P < 0.001). Therefore, our findings support the notion that Rheb‐mediated mitophagy facilitates mitophagic removal of stressed axonal mitochondria and thus plays a critical role in the maintenance of mitochondrial homeostasis in distal axons.
Presynaptic mitophagy stress in AD‐related mutant hAPP Tg mouse brains
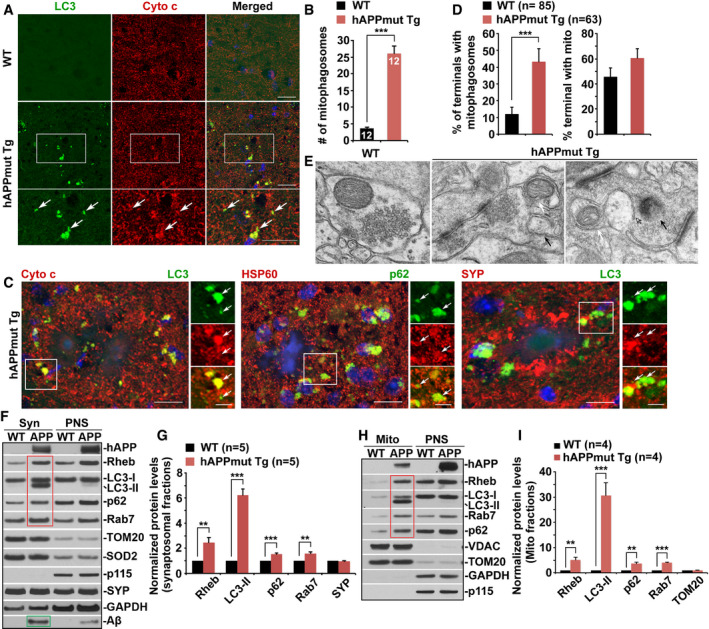
Given the involvement of Rheb in mitophagy initiation upon mitochondrial stress in the axons of WT neurons, we then assessed how Rheb‐mediated mitophagy is regulated in response to chronic mitochondrial stress under pathophysiological conditions. We performed multiple lines of experiments and examined mitophagy in the axonal terminals of AD neurons. We first conducted immunostaining in AD‐related mutant hAPP Tg mouse brains. In hippocampal mossy fibers enriched with axons and presynaptic terminals, LC3 immunostaining shows a diffuse pattern in WT mice, suggesting a non‐lipidated LC3‐I form in the cytoplasm (Fig 3A). In contrast, LC3 appears as vesicular structures in AD mouse brains. These structures represent lipidated LC3‐II associated with autophagic vacuoles (AVs). Importantly, a majority of AVs also are positive for cytochrome c (Cyto c), a mitochondrial intermembrane space protein, suggesting that these AVs represent Mito‐AVs/mitophagosomes—AVs containing engulfed mitochondria (WT: 3.67 ± 0.36; mutant hAPP: 26.08 ± 2.17, P < 0.001) (Fig 3A and B). Given the fact that Cyto c is released from damaged mitochondria into the cytoplasm, we examined mitophagic accumulation by using alternative antibodies against HSP60, a mitochondrial matrix protein, and p62, an autophagy marker. Consistently, we detected aberrant accumulation of mitophagosomes co‐labeled by HSP60 and p62 in hippocampal mossy fiber regions of AD mouse brains (WT: 3.57 ± 0.30; mutant hAPP: 32.71 ± 3.41, P < 0.001) (Fig EV3A and B). Strikingly, mitophagosomes are concentrated within swollen/dystrophic presynaptic terminals surrounding amyloid plaques that are enriched with A11 antibody‐marked soluble oligomeric Aβ (Figs 3C, and EV3C and D). Abnormal mitophagosome retention was also observed in the axons of cortical neurons cultured from mutant hAPP Tg mouse brains (Fig EV3E). Moreover, these mitophagosomes are positive for Rab7, indicating that they are mito‐amphisomes in nature resulting from mitophagosome fusion with LEs (Fig EV3F). Thus, our observations support the view that mitophagosomes aberrantly accumulate within AD synapses, which may contribute to synaptic damage.
Figure 3. Presynaptic mitophagy stress in AD‐related mutant hAPP Tg mouse brains.
-
A, BAberrant accumulation of mitophagosomes co‐labeled by antibodies against LC3 and cytochrome c (Cyto c) in the hippocampal mossy fibers of mutant hAPP Tg mouse brains. Note that mitophagosomes indicated by white arrows are not readily observed in WT mouse brains (A). The average number of mitophagosomes per section (320 μm × 320 μm) was quantified from the total number of brain slice sections (n) indicated on the top of the bars (B).
-
CClustering of mitophagosomes (white arrows) co‐labeled by antibodies against LC3 and Cyto c or p62 and HSP60 within swollen/dystrophic presynaptic terminals indicated by synaptophysin (SYP) surrounding amyloid plaques in AD mouse brains.
-
D, EQuantitative analysis (D) and representative TEM images (E) showing presynaptic retention of mitophagosome‐like structures in the hippocampal regions of mutant hAPP mouse brains. White arrow‐labeled mitophagosomes are not readily detected in WT mouse brains. Black arrows marked amphisomes or degradative autophagic vacuoles (AVd). Data were quantified from the total number of the imaging fields (n) indicated in parentheses (D).
-
F, GMitophagic accumulation at Aβ‐enriched synapses in AD mouse brains. Note that the levels of mitophagic/autophagic proteins (red box) along with Aβ (green box) are increased in synaptic fractions isolated from AD mouse brains. Equal amounts (10 μg) of synaptosomal preparations (Syn) and post‐nuclear supernatants (PNS) from WT and mutant hAPP mouse brains were sequentially immunoblotted with antibodies against hAPP/Aβ, Rheb, LC3, p62, and Rab7, as well as mitochondrial proteins TOM20 and SOD2 on the same membrane after stripping between each antibody application. The purity of synaptosomal fractions was confirmed by relative enrichment of SYP and less abundance of p115 and GAPDH (F). Relative protein levels in the synaptosomal preparations from mutant hAPP mice were compared to those in WT littermate controls. Data were quantified from five repeats (G).
-
H, IRepresentative blots (H) and quantitative analysis (I) showing increased levels of Rheb along with LC3‐II, p62, and Rab7 (red box) in mitochondrial (Mito) fractions purified from AD mouse brains. The purity of Mito fractions was confirmed by enrichment of mitochondrial proteins VDAC and TOM20 and by the absence of GAPDH and p115, relative to PNS fractions. Data were quantified from four repeats.
Figure EV3. Mitophagy stress in the axons and within the dystrophic presynaptic terminals of AD‐related mutant hAPP neurons.
-
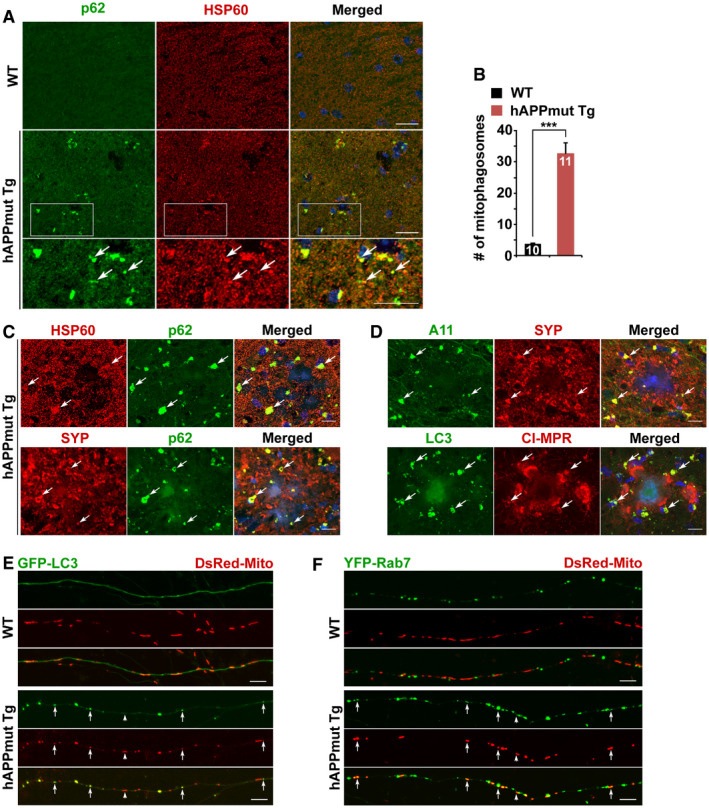
A, BRepresentative images (A) and quantitative analysis (B) showing aberrant accumulation of mitophagosomes co‐labeled by antibodies against p62 and HSP60 in the hippocampal mossy fibers of mutant hAPP Tg mouse brains. Note that mitophagosomes labeled by white arrows are not readily observed in WT mouse brains. The average number of mitophagosomes per section (320 μm × 320 μm) was quantified from the total number of brain slice sections (n) indicated on the top of the bars (B).
-
C, DRepresentative images showing that mitophagosomes labeled by antibodies against p62 and HSP60 are concentrated within dystrophic presynaptic terminals indicated by synaptophysin (SYP). Note that soluble oligomeric Aβ marked by A11 antibody is enriched within swollen axonal terminals surrounding amyloid plaques in the hippocampal regions of mutant hAPP Tg mouse brains. Accumulated mitophagosomes (white arrows) are mito‐amphisomes in nature that are positive for cation‐independent mannose 6‐phosphate receptor (CI‐MPR), a late endosome (LE) marker.
-
EAbnormal accumulation of mitophagosomes within the axons of mutant hAPP Tg neurons. Note that a significant portion of mitochondria in mutant hAPP axons are retained within LC3‐marked autophagic vacuoles (AVs). Mitophagosomes indicated by white arrows are not readily detected within WT axons.
-
FMitochondria were trapped within Rab7‐labeled amphisomes as mito‐amphisomes (white arrows) within mutant hAPP Tg axons.
Using transmission electron microscopy (TEM), we next assessed synaptic mitophagy at the ultrastructural level. Consistent with our light imaging data, we frequently detected mitophagosome‐like structures at the hippocampal synapses in AD mouse brains (Fig 3E). Most of these are mito‐amphisomes and are not readily observed in WT mouse brains. The percentage of presynaptic terminals containing mitophagosomes is markedly increased in AD mice, relative to that in WT littermate controls (WT: 12.11% ± 3.82%; mutant hAPP: 43.23% ± 7.91%, P < 0.001; Fig 3D). Meanwhile, synaptic mitochondrial density did not show a significant difference (WT: 45.82% ± 6.86%; mutant hAPP: 60.75% ± 7.52%, P > 0.05). To confirm these data, we purified synapse‐enriched synaptosomes (Syn) using Percoll gradient centrifugations as previously described (DiGiovanni et al, 2012; Sepuri et al, 2017; Tammineni et al, 2017b; Ye et al, 2017). AD mice exhibit increased levels of LC3‐II (6.24 ± 0.50, P < 0.001), p62/SQSTM1 (1.52 ± 0.09, P < 0.001), and Rab7 (1.57 ± 0.16, P < 0.01) along with Rheb (2.45 ± 0.38, P < 0.01), but not synaptophysin (SYP) and mitochondrial protein SOD2, compared to those of WT controls (Fig 3F and G). Soluble Aβ is enriched in the synaptosomal fractions from AD mouse brains. AD‐associated synaptic mitophagy stress could be caused by enhanced mitophagy activation or impaired mitophagosome removal through retrograde transport. We next tested Rheb‐dependent mitophagy in AD mouse brains. Relative to WT controls, Rheb is markedly elevated in mitochondria‐enriched fractions (Mito) purified from AD mouse brains along with significantly increased levels of LC3‐II, p62, and Rab7 (Rheb: 5.05 ± 1.18, P < 0.01; LC3‐II: 30.65 ± 5.11, P < 0.001; p62: 3.65 ± 0.62, P < 0.01; Rab7: 3.93 ± 0.34, P < 0.001) (Fig 3H and I), suggesting robust activation of Rheb‐related mitophagy in AD neurons. Therefore, our light imaging and TEM observations combined with biochemical results consistently indicate mitophagy stress at AD synapses.
Increased mitophagy initiation coupled with defective retrograde transport in AD axons
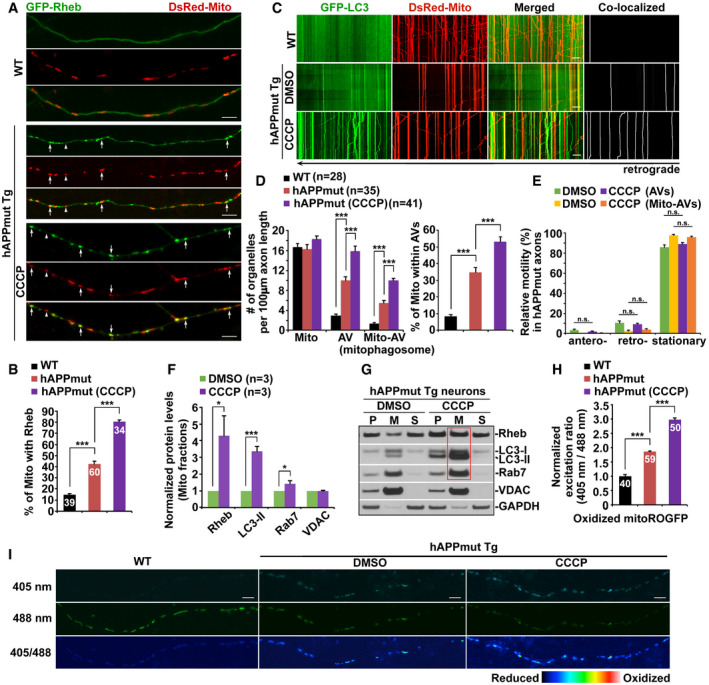
We next performed multiple lines of experiments to dissect the underlying mechanisms of synaptic mitophagy stress in AD neurons. We first determined whether mitophagy is efficiently initiated upon acute Δψm dissipation in cortical neurons derived from mutant hAPP Tg mouse brains. We observed increased Rheb targeting to mitochondria in AD axons, which is further enhanced following dissipating Δψm (WT: 14.53% ± 1.21%; mutant hAPP: 42.69% ± 2.13%; P < 0.001; with CCCP: 80.61% ± 1.41%; P < 0.001) (Fig 4A and B). Given that retrograde transport promotes efficient removal of newly formed mitophagosomes from distal axons, we next examined whether AD‐linked synaptic mitophagy stress is the result of impaired retrograde transport. Indeed, retrograde movement of mitophagosomes is markedly reduced (2.40% ± 0.96%), coupled with increased mitophagic accumulation within AD axons (number: 5.50 ± 0.48; percentage of Mito within AVs: 34.82% ± 2.97%; Fig 4C–E). Moreover, CCCP treatment exacerbates mitophagic accumulation as a result of defective retrograde transport (retrograde: 2.89% ± 0.70%; number: 10.00 ± 0.44; percentage: 50.73% ± 2.13%), suggesting that mitophagy stress at AD synapses is likely attributed to defects in retrograde transport and thus impaired removal of mitophagosomes from axonal terminals.
Figure 4. Increased mitophagy initiation coupled with defective retrograde transport in AD axons.
-
A, BRepresentative images (A) and quantitative analysis (B) showing increased mitochondrial association with Rheb in AD axons, relative to that of WT littermate controls. Note that CCCP treatment enhances Rheb localization to mitochondria. The percentages of white arrow‐marked mitochondria that were targeted by Rheb in WT and mutant hAPP axons in the absence and presence of CCCP were quantified, respectively (B).
-
C–ERepresentative dual‐channel kymographs (C) and quantitative analysis (D, E) showing defective retrograde transport and mitophagic accumulation within AD axons. Relative motility of AVs and Mito‐AVs/mitophagosomes, the numbers of Mito, AVs, and Mito‐AVs, and the percentage of mitochondria within AVs in WT or mutant hAPP axons with and without CCCP were quantified, respectively (D, E).
-
F, GQuantitative analysis (F) and representative blots (G) showing that Δψm depolarization augments mitophagy activation in cortical neurons cultured from AD mouse brains. Note increased localization of Rheb along with LC3‐II and Rab7 to mitochondria in mutant hAPP Tg neurons after CCCP treatment (red box). Data were quantified from three independent repeats. P: post‐nuclear supernatants; M: mitochondria‐enriched membrane fractions; S: cytosolic supernatants.
-
H, IQuantitative analysis (H) and representative images (I) showing abnormal accumulation of oxidatively damaged mitochondria in AD axons, which is exacerbated after dissipating Δψm. Mean fluorescence intensity ratios evoked by the two excitation wavelengths (405 and 488 nm) at individual mitochondria in mutant hAPP axons with and without CCCP treatment were quantified and normalized to those of WT controls (H).
Consistently, after CCCP treatment, AD neurons exhibit additional increase in mitochondrial recruitment of Rheb, accompanied with elevated mitochondrial association with LC3‐II and Rab7 (Rheb: 4.31 ± 1.18, P < 0.05; LC3‐II: 3.37 ± 0.29, P < 0.001; Rab7: 1.44 ± 0.16, P < 0.05; Fig 4F and G), indicating augmentation of Rheb‐dependent mitophagy. Combined with a marked increase of Rheb in synaptosomal fractions and synaptic mitophagic accumulation in AD mouse brains (Fig 3), these data consistently indicate that Rheb‐mediated mitophagy is markedly activated at AD synapses. More importantly, relative to WT controls, we found accumulation of oxidatively stressed mitochondria in AD axons, which is augmented after CCCP treatment (1.86 ± 0.03, CCCP: 2.98 ± 0.05; P < 0.001) (Fig 4H and I). These data indicate that mitophagy failure in AD axons impairs removal of damaged mitochondria, thereby exacerbating mitochondrial defects.
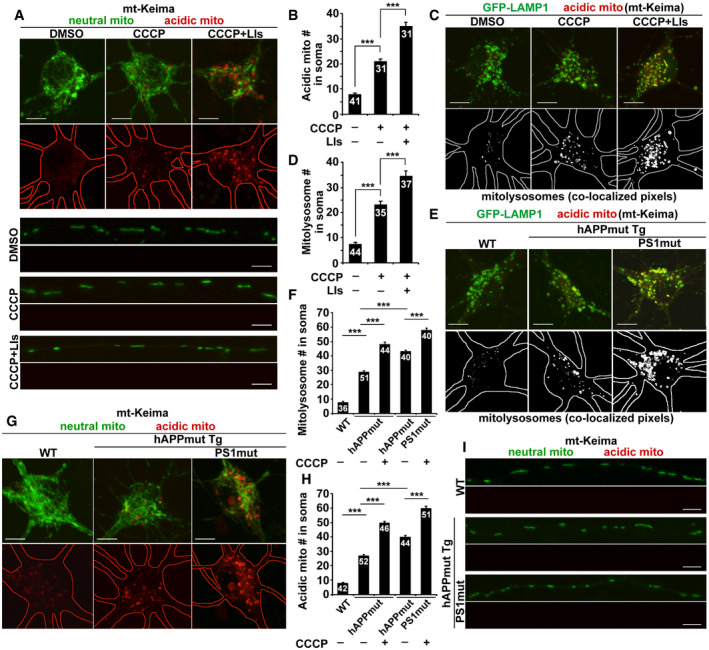
Mitophagy is a lysosome‐dependent pathway, and alterations in the lysosomal system have been implicated in AD (Nixon, 2013; Menzies et al, 2015). Thus, we next determined the lysosomal impact on mitophagy in the axons of WT and AD neurons. To examine the distribution of mitochondria within acidic lysosomal organelles, we utilized mt‐Keima, a ratiometric pH‐sensitive fluorescent probe, which targets to the mitochondrial matrix (Katayama et al, 2011). A short wavelength (440 nm) is predominant for excitation in a neutral environment (neutral mito), whereas a long wavelength (586 nm) is predominant in an acidic environment (acidic mito). We found that acidic mitochondria are exclusively located in the soma of neurons (Fig EV4A and B). The number of acidic mitochondria was elevated in the presence of CCCP, and additional increase was shown in the soma of neurons treated with CCCP and lysosomal inhibitors (LIs) (DMSO: 7.83 ± 0.55; CCCP: 21.16 ± 0.73; CCCP+LIs: 35.23 ± 1.41; P < 0.001). We failed to detect acidic mitochondria in axons under these conditions (Fig EV4A). Our observations are consistent with previous studies showing that acidic mitochondria, visualized by mt‐Keima, are mostly detected in the soma, but not in axons (Bingol et al, 2014; Puri et al, 2019). Furthermore, we confirmed a strong co‐localization of these acidic mitochondria with somatic lysosomes marked by LAMP1, suggesting that they are mitolysosomes in nature. Consistently, treatments with CCCP or CCCP and LIs lead to a significant increase in the number of mitolysosomes (Fig EV4C and D). These findings collectively support the notion that mitophagic clearance mainly occurs in the soma, where mature lysosomes are mainly located.
Figure EV4. Lysosomal impact on mitophagy in the soma but not in the axons of AD neurons.
-
A, BRepresentative images (A) and quantitative analysis (B) showing that acidic mitochondria are present in the soma but not in the axons of neurons. Cortical neurons were transfected with mt‐Keima, followed by treatment with DMSO, CCCP, or CCCP and lysosomal inhibitors (LIs) prior to live‐cell imaging. mt‐Keima is a ratiometric pH‐sensitive fluorescent probe that targets to the mitochondrial matrix. A short wavelength (440 nm) is predominant for excitation in a neutral environment (neutral mito), whereas a long wavelength (586 nm) is predominant in an acidic environment (acidic mito). Note increased numbers of acidic mitochondria in the soma treated with CCCP or CCCP and LIs, but not in axons under these conditions. The number of acidic mitochondria (mito) in the soma of neurons was quantified (B).
-
C, DImaging of mt‐Keima and GFP‐LAMP1 shows that acidic mitochondria are mostly retained within LAMP1‐marked lysosomes in the soma (C). The number of mitolysosomes co‐labeled by LAMP1 and mt‐Keima was quantified in the soma of neurons treated with DMSO, CCCP, or CCCP with LIs (D).
-
E, FRepresentative images (E) and quantitative analysis (F) showing aberrant accumulation of mitolysosomes in the soma. The number of mitolysosomes was quantified in the soma of WT neurons, mutant hAPP neurons, or mutant hAPP neurons expressing mutant PS1 with or without CCCP treatment (F). Note that aberrant accumulation of mitolysosomes is enhanced in AD neurons co‐expressing mutant hAPP and mutant PS1 in the presence or absence of CCCP.
-
G–IThe presence of acidic mitochondria in the soma but not in the axons of AD neurons expressing mutant hAPP or mutant hAPP with mutant PS1. The number of acidic mitochondria in the soma of AD neurons was quantified in the presence or absence of CCCP (H).
We next examined whether mitolysosomes accumulate in AD neurons. Compared to WT neurons derived from littermate controls, mitolysosomes are retained in the soma of mutant hAPP neurons. Lysosomal defects have been indicated in APP/PS1 Tg and PS1KO mice and cells (Lee et al, 2010; Neely Kayala et al, 2012; Zhang et al, 2012; Hung & Livesey, 2018). To further address the impact of lysosomal deficiency on mitophagy in AD neurons, we transfected mutant hAPP neurons with familial AD (FAD)‐associated mutations PS1L286E (Kulic et al, 2000). Mitolysosomal retention is enhanced in mutant hAPP neurons co‐expressing mutant PS1L286E (WT: 7.83 ± 0.54; hAPPmut: 28.98 ± 0.67; hAPPmut with PS1mut: 43.27 ± 0.72; P < 0.001; Fig EV4E and F). Δψm dissipation further augments such retention in these AD neurons (hAPPmut: 48.36 ± 1.21; hAPPmut with PS1mut: 58.08 ± 1.19; P < 0.001). Importantly, while these results are consistent with increased retention of acidic mitochondria in the soma (Fig EV4G and H), acidic mitochondria cannot be detected within the axons of these AD neurons with or without mutant PS1 expression or in the presence or absence of CCCP (Fig EV4I). Therefore, these results suggest that lysosomal deficiency has no direct impact on mitophagy stress in the axons of AD neurons.
Deficiency in Snapin‐mediated retrograde transport recapitulates presynaptic mitophagy stress and leads to synaptic defects in mouse brains
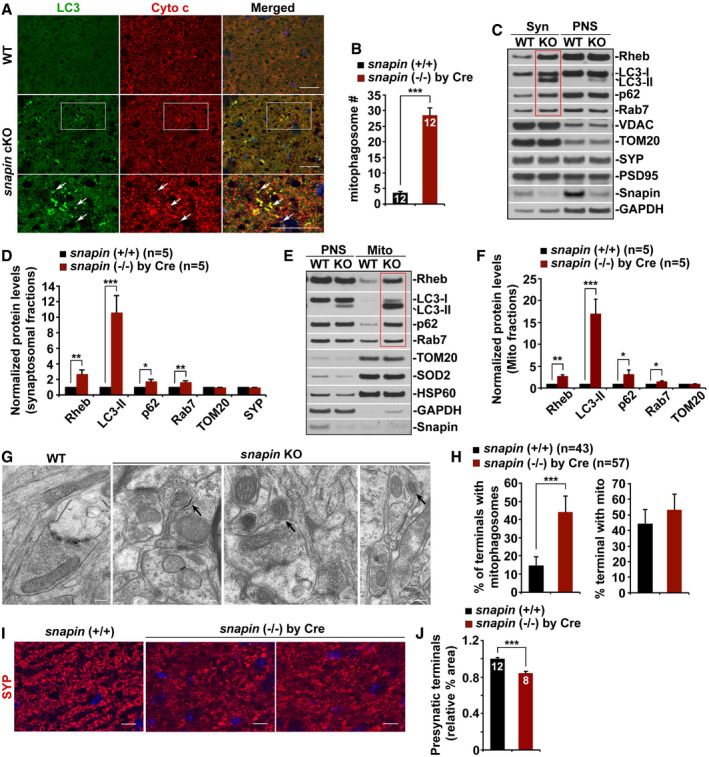
Our previous studies revealed that dynein–Snapin, the motor–adaptor complex, mediates retrograde transport of AVs to reduce autophagic accumulation in distal axons (Cheng et al, 2015a,b; Tammineni & Cai, 2017; Tammineni et al, 2017b). We examined whether dynein–Snapin‐mediated retrograde transport is involved in the removal of mitophagosomes from axonal terminals. We found increased mitophagosome clusters in the hippocampal mossy fibers of snapin‐deficient mice (WT: 3.64 ± 0.41; snapin cKO: 28.55 ± 2.36, P < 0.001) (Fig 5A and B). In purified Syn and Mito fractions from conditional snapin‐KO mouse brains, we detected synaptic retention of Rheb‐associated mitophagosomes, as reflected by increased levels of Rheb along with LC3‐II, p62, and Rab7 (Syn: Rheb: 2.68 ± 0.49, P < 0.01; LC3‐II: 10.64 ± 2.15, P < 0.001; p62: 1.73 ± 0.28, P < 0.05; Rab7: 1.62 ± 0.19, P < 0.01; Mito: Rheb: 2.68 ± 0.40, P < 0.01; LC3‐II: 17.00 ± 3.39, P < 0.001; p62: 3.20 ± 0.86, P < 0.05; Rab7: 1.53 ± 0.13, P < 0.05) (Fig 5C–F). These results indicate that defects in Snapin‐mediated retrograde transport induce synaptic mitophagic accumulation, mimicking mitophagy stress at AD synapses. Consistent with our light imaging study from AD mouse brains, the result from TEM analysis showed marked mitophagosome accumulation at hippocampal synapses in snapin‐mutant mice. These mitophagosomes represent mito‐amphisome‐like structures (WT: 14.58% ± 4.76%; snapin cKO: 44.13% ± 8.80%, P < 0.001; Fig 5G and H). Furthermore, the density of presynaptic terminals labeled by synaptophysin (SYP) is significantly reduced in the hippocampal mossy fiber regions of snapin cKO mice (0.84 ± 0.02, P < 0.001; Fig 5I and J). Thus, our data suggest that Snapin‐mediated retrograde transport promotes mitophagic removal of defective mitochondria from distal axons, and such a mechanism is critical for synaptic maintenance.
Figure 5. Deficiency in Snapin‐mediated retrograde transport recapitulates presynaptic mitophagy stress and leads to synaptic defects in mouse brains.
-
A, BRepresentative images (A) and quantitative analysis (B) showing aberrant accumulation of mitophagosomes labeled by LC3 and Cyto c antibodies in the hippocampal mossy fibers of snapin cKO mouse brains. Note that white arrow‐labeled mitophagosomes are not readily observed in WT mouse brains. The average number of mitophagosomes per section (320 μm × 320 μm) was quantified.
-
C, DRepresentative blots (C) and quantitative analysis (D) showing aberrant mitophagic retention at synaptic terminals in snapin‐mutant mouse brains. The levels of Rheb along with LC3‐II, p62, and Rab7 are significantly elevated in the synaptosomal fractions (Syn) purified from snapin‐deficient mouse brains, relative to those of WT littermate controls (red box). Equal amounts (10 μg) of Syn and post‐nuclear supernatants (PNS) from WT and snapin‐mutant mouse brains were sequentially immunoblotted with antibodies against Snapin, mitophagic/autophagic proteins, and mitochondrial proteins VDAC and TOM20 on the same membrane after stripping between each antibody application. The purity of synaptosomal fractions was confirmed by relative enrichment of synaptophysin (SYP) and PSD95 and less abundance of GAPDH. Data were quantified from five independent repeats.
-
E, FRepresentative blots (E) and quantitative analysis (F) showing mitophagic accumulation in the brains of snapin conditional KO (cKO) mice by crossing with Thy1‐cre Tg mice. Note increased levels of Rheb along with LC3‐II, p62, and Rab7 in mitochondrial (Mito) fractions isolated from snapin‐deficient mouse brains (red box), relative to those of WT littermate controls. Data were quantified from five independent repeats. PNS: post‐nuclear supernatants.
-
G, HRepresentative TEM images (G) and quantitative analysis (H) showing abnormal presynaptic retention of mitophagosome‐like structures in the hippocampal regions of snapin‐deficient mouse brains. Mitophagosomes, indicated by black arrows, are not readily detected in WT mouse brains. Data were quantified from the total number of the imaging fields (n) indicated in parentheses (H).
-
I, JRepresentative images (I) and quantitative analysis (J) showing that deletion of snapin in mouse brains induces synaptic damage. Note that the density of presynaptic terminals in the hippocampal mossy fibers revealed by SYP immunostaining is significantly reduced in snapin‐mutant mice crossed with CamKII‐cre Tg mice at the age of 8 months, relative to that of WT littermate controls.
Snapin‐enhanced retrograde transport reduces mitophagic accumulation and attenuates mitochondrial defects in mutant hAPP Tg axons
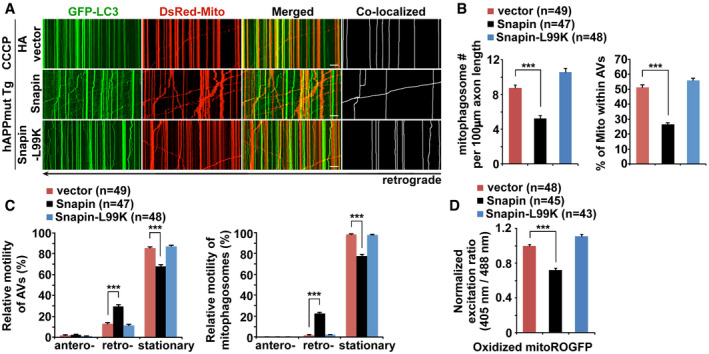
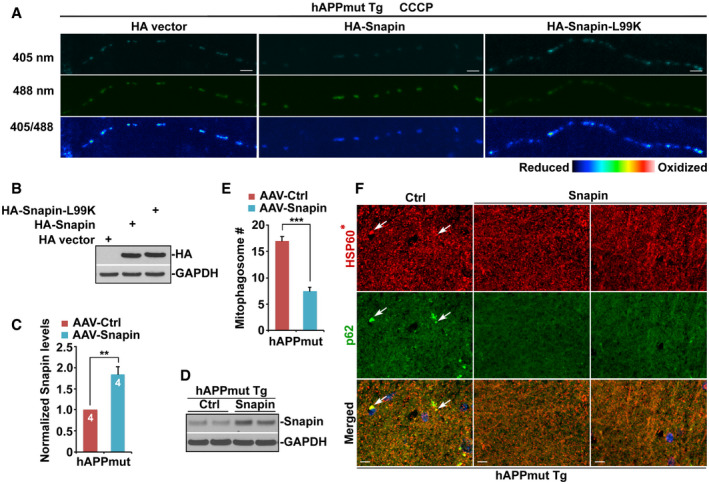
Given that defective retrograde transport impairs synaptic removal of mitophagosomes, we next determined whether Snapin‐enhanced retrograde transport reduces mitophagy stress in AD axons. Excitingly, upon dissipating Δψm, AD neurons expressing Snapin display a significant increase in retrograde transport of mitophagosomes (Snapin: 22.38% ± 1.53%, P < 0.001), accompanied with decreases in mitophagosomal accumulation (Snapin: 5.25 ± 0.30, P < 0.001) and percentage of mitochondria within AVs (Snapin: 26.46% ± 1.07%, P < 0.001) (Fig 6A–C). Importantly, such a rescue effect cannot be detected in AD axons expressing Snapin‐L99K, a dynein motor binding‐deficient mutant of Snapin, suggesting that reduced mitophagy stress in AD axons is specifically attributed to Snapin‐enhanced retrograde transport. Moreover, increased mitophagic removal of stressed mitochondria in AD axons with overexpression of Snapin, but not Snapin‐L99K, ameliorates axonal mitochondrial defect, as reflected by a marked reduction of oxidatively damaged mitochondria (0.72 ± 0.02, P < 0.001) (Figs 6D and EV5A). Moreover, the expression levels of Snapin and Snapin‐L99K are similar in transfected cells (Fig EV5B).
Figure 6. Snapin‐enhanced retrograde transport reduces mitophagic accumulation and attenuates mitochondrial defects in mutant hAPP Tg axons.
-
A–CRepresentative dual‐channel kymographs (A) and quantitative analysis (B, C) showing that overexpression of Snapin, but not Snapin‐L99K, a Snapin mutant deficient in dynein motor binding, enhances retrograde transport of mitophagosomes and reduces mitophagic accumulation within AD axons incubated with CCCP.
-
DMean fluorescence intensity ratios evoked by 405 and 488 nm excitation wavelengths at individual mitochondria in mutant hAPP axons expressing Snapin or Snapin‐L99K were quantified and normalized to those of mutant hAPP controls. Note that oxidatively stressed mitochondria are reduced within AD axons expressing Snapin after CCCP treatment.
Figure EV5. Overexpression of Snapin reduces mitochondrial stress in the axons of mutant hAPP neurons.
-
ARepresentative images showing oxidatively stressed mitochondria within mutant hAPP axons expressing Snapin, Snapin‐L99K, or vector control after CCCP treatment.
-
BThe expression levels of Snapin and Snapin‐L99K in HEK293 cells. GAPDH is a loading control.
-
C, DQuantitative analysis (C) and representative blots (D) showing elevated Snapin expression in the hippocampus of mutant hAPP Tg mouse brains after AAV injection. A total of 10 μg of hippocampal homogenates from mutant hAPP mice transduced with AAV‐mCherry or AAV‐mCherry‐Snapin were sequentially immunoblotted on the same membrane after stripping between each antibody application. Relative protein levels were normalized by GAPDH and to that of control mutant hAPP mice injected with AAV‐mCherry. Data were analyzed from four pairs of mice.
-
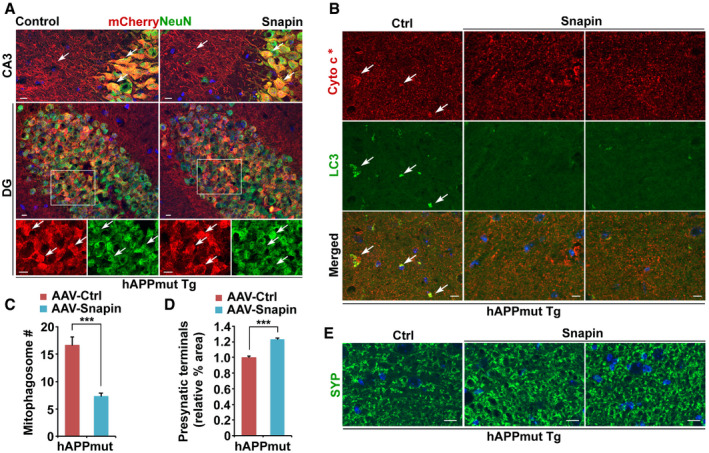
E, FQuantitative analysis (E) and representative images (F) showing reduced mitophagic accumulation in the hippocampal mossy fiber regions of AD mice transduced with AAV‐mCherry‐Snapin. Note a significant reduction of white arrow‐marked mitophagosomes that were co‐labeled by HSP60 and p62 in mutant hAPP Tg mouse brains with overexpression of Snapin. HSP60*: Color is converted to red for better contrast (F). Data were quantified from a total number of 15–20 imaging slice sections of three pairs of mutant hAPP Tg mice with AAV injection.
Overexpression of Snapin ameliorates mitophagy stress and mitigates synapse loss in mutant hAPP Tg mouse brains
We hypothesized that Snapin‐enhanced mitophagy and attenuation of mitochondrial deficit mitigate AD‐associated synaptic damage. To test this hypothesis, we infected mutant hAPP Tg mouse brains at the age of 2–3 months with AAV‐mCherry or AAV‐mCherry‐IRES‐Snapin by bilateral injection into the hippocampus, an established in vivo delivery procedure (Nagahara et al, 2009, 2013; Polito et al, 2014; Xiao et al, 2015; Xie et al, 2015; Ye et al, 2017). The majority of neurons in the hippocampal CA3 and dentate gyrus and their processes in hippocampal mossy fibers were infected (Fig 7A). Snapin expression was verified by Western blot analysis, which revealed increased Snapin levels in the hippocampus of Snapin‐injected AD mice at the age of 7 months (1.85 ± 0.18, P < 0.01) (Fig EV5C and D). Interestingly, AD mouse brains transduced with AAV‐Snapin exhibit reduced mitophagosome accumulation in the hippocampal mossy fiber areas, compared to that in control AD mice expressing AAV‐mCherry (Ctrl: 18.69 ± 1.30; Snapin: 7.07 ± 0.59; P < 0.001; Fig 7B and C). Immunostaining using antibodies against HSP60 and p62 showed a similar result (Ctrl: 17.02 ± 0.91; Snapin: 7.51 ± 0.65; P < 0.001; Fig EV5E and F). Our data suggest that Snapin‐enhanced retrograde transport ameliorates AD‐linked distal mitophagy stress. Synapse loss at early disease stages in this mouse line has been well established from previous studies (Mucke et al, 2000; Nagahara et al, 2009, 2013; Ye et al, 2017). Strikingly, AAV‐Snapin transduction leads to increased density of presynaptic terminals in the hippocampal mossy fibers of AD mice, compared to that of control mice (1.23 ± 0.01, P < 0.001; Fig 7D and E). Thus, these in vitro and in vivo beneficial effects consistently support our hypothesis that enhanced mitophagic removal of defective mitochondria through retrograde transport attenuates synaptic mitochondrial deficits and thus mitigates synaptic defects in AD brains.
Figure 7. Overexpression of Snapin ameliorates mitophagy stress and mitigates synapse loss in mutant hAPP Tg mouse brains.
-
ARepresentative images showing gene delivery into the hippocampus of AD mice injected with AAV‐mCherry or AAV‐mCherry‐Snapin. mCherry fluorescence indicated by white arrows is present in the soma and processes of transduced neurons in the hippocampal CA3 and dentate gyrus (DG) of mutant hAPP mouse brains. NeuN, a neuronal nuclear marker, indicates neurons.
-
B, CAttenuation of mitophagic accumulation in the hippocampal mossy fibers of AD mice transduced with AAV‐mCherry‐Snapin. Note a marked reduction of mitophagosomes (white arrows) in mutant hAPP Tg mouse brains with elevated Snapin expression (C). Cyto c*: color is converted to red for better contrast (B).
-
D, EQuantitative analysis (D) and representative images (E) showing increased density of presynaptic terminals in the hippocampal mossy fibers of AD mice infected with AAV‐mCherry‐Snapin. Blue indicates the signal of DAPI staining. The percentage area of synaptophysin (SYP)‐labeled presynaptic terminals was quantified and normalized to that of control AD mice injected with AAV‐mCherry (D).
Discussion
Synaptic mitochondria play a pivotal role in sustaining synaptic activities, but are more vulnerable to cumulative changes induced by deleterious factors such as Aβ. Synaptic stress is an early pathological feature of AD, and mitochondrial deficit has been proposed as a key player in synaptic damage in AD (Reddy & Beal, 2008; Reddy et al, 2010; Reddy, 2011; Du et al, 2012; Cai & Tammineni, 2017; Tonnies & Trushina, 2017). However, critical understanding of the mitochondrial quality control mechanism at nerve terminals remains very limited. Our study provides the first indication that Rheb and Snapin serve as key players in mitophagy‐mediated regulation of mitochondrial integrity at synapses, and mitophagy failure is involved in synaptic mitochondrial deficits and synaptic deterioration associated with AD.
Recent studies have shown mitophagic abnormalities in AD, particularly in the PINK1/Parkin pathway (Ye et al, 2015; Du et al, 2017; Manczak et al, 2018; Reddy et al, 2018; Cummins et al, 2019; Fang et al, 2019). For instance, our studies have revealed that Parkin‐mediated mitophagy is induced at early disease stages in the brains of AD patients and mouse models, but cytosolic depletion of Parkin over disease progression leads to defective mitophagy and aberrant accumulation of damaged mitochondria in AD neurons (Ye et al, 2015). Defects in Parkin‐mediated mitophagy were also reported in neuroblastoma cells and the Caenorhabditis elegans nervous system under tauopathy conditions (Cummins et al, 2019). While AD brains display reduced levels of PINK1 and TERT (Manczak et al, 2018; Reddy et al, 2018), PINK1 overexpression was shown to ameliorate cognitive dysfunction in AD mice by promoting the clearance of damaged mitochondria (Du et al, 2017). A recent study further demonstrated that the basal level of mitophagy is also reduced in AD brains (Fang et al, 2019). Importantly, enhancement of PINK‐1‐dependent mitophagy abolishes AD pathology and reverses memory deficits in AD models. These studies collectively suggest a critical role of PINK1/Parkin‐mediated mitophagy in AD pathophysiology. Damaged mitochondria recruit Parkin to initiate mitophagy for subsequent degradation within lysosomes (Youle & Narendra, 2011; Pickrell & Youle, 2015; Pickles et al, 2018). We and others have shown that Parkin‐mediated mitophagy primarily occurs in the neuronal soma, where degradative lysosomes are highly enriched (Cai et al, 2010, 2012b; Devireddy et al, 2015; Xie et al, 2015; Ye et al, 2015; Maday & Holzbaur, 2016; Sung et al, 2016; Lin et al, 2017; Tammineni et al, 2017a; Cheng et al, 2018; Lee et al, 2019). This raises the possibility that alternative mechanism(s) must function to efficiently remove constantly damaged mitochondria from axonal terminals to maintain mitochondrial homeostasis under disease‐associated chronic stress conditions. In the current study, we uncover a new mechanism of mitochondrial quality control in axons which involves Rheb‐dependent mitophagy initiation and dynein–Snapin‐mediated retrograde transport. Such a mechanism is essential for the maintenance of synaptic mitochondrial integrity. Moreover, we hypothesize that increased mitophagy initiation along with defects in retrograde transport leads to mitophagic accumulation and mitochondrial stress, thereby exacerbating synaptic deficits in AD neurons. Excitingly, Snapin‐enhanced retrograde transport alleviates mitochondrial defects and mitigates synapse loss in AD mouse brains. Thus, in line with previous understandings of PINK1/Parkin‐mediated mitophagy in the soma, our current work not only advances our understanding of the mechanism underlying mitochondrial maintenance through mitophagy at synaptic terminals, but also provides new insights into the critical role of mitophagy dysfunction in AD‐linked synaptic mitochondrial deficits and synaptic damage.
Rheb is well established as an activator of mammalian target of rapamycin (mTOR), a kinase with diverse cellular function (Manning & Cantley, 2003; Groenewoud & Zwartkruis, 2013). A growing body of evidence suggests that Rheb is involved in multiple cellular processes including protein synthesis (Tyagi et al, 2015; Nnah et al, 2019). Rheb was also reported to regulate BACE1 levels and thus APP processing (Shahani et al, 2014, 2017). Rheb was shown to protect against neurodegeneration and mediate axonal regrowth in dopaminergic neurons, attributable to activation of the neurotrophic signaling pathway (Kim et al, 2012). The role of Rheb in mitophagy has recently been described in HeLa, muscle, and macrophage cells, and is independent of that in Rheb‐mediated mTOR activation (Melser et al, 2013; Yang et al, 2014; Kang et al, 2016). In particular, in response to increased mitochondrial energetics, Rheb initiates mitophagy through association with mitochondrial outer membrane, and then its physical interaction with LC3‐II on mitochondria mediates autophagic recruitment (Melser et al, 2013). However, the outstanding questions remain: Whether mitochondrial damage, but not increased mitochondrial respiration, activates Rheb‐associated mitophagy, and whether this mechanism is involved in mitochondrial quality control in healthy and diseased neurons. Addressing these questions will also advance our understanding of the mechanisms underlying AD‐linked mitochondrial pathology and synaptic deterioration. The current study reveals that Rheb senses Δψm depolarization to initiate mitophagy in distal axons under both physiological and pathophysiological conditions. Rheb‐associated mitophagy initiation within axons requires Nix, but is independent of the Parkin‐mediated pathway in the soma of neurons (Figs 2, and EV1 and EV2). Moreover, Rheb is important for mitophagy, but not other forms of autophagy (Fig EV2E–H). Rheb loss of function impairs mitochondrial maintenance within axons, as reflected by abnormal retention of oxidatively stressed mitochondria (Fig 2H and I). Furthermore, Rheb effectively responds to AD‐linked chronic mitochondrial stress conditions by mediating the targeting of stressed mitochondria for autophagy at AD synapses (Fig 4). Therefore, we reveal, for the first time, that Rheb‐mediated mitophagy plays a critical role in the quality control of mitochondria within the axons of healthy and diseased neurons.
Our previous studies reported a critical role of Snapin, a dynein motor adaptor, in the regulation of LE retrograde axonal transport and autophagy function in neurons (Cai et al, 2010; Cai & Sheng, 2011). Snapin interacts with the dynein intermediate chain (DIC), enabling dynein motor recruitment to LEs for long‐distance retrograde transport. It has been established that autophagosomes are robustly generated in distal axons and move in a retrograde direction for lysosomal clearance in the soma (Maday et al, 2012; Cheng et al, 2015a,b; Maday & Holzbaur, 2016). Our work further shows that nascent autophagosomes recruit dynein–Snapin transport machinery to gain retrograde transport motility through fusion with LEs to form amphisomes. Such a mechanism facilitates autophagic clearance within lysosomes in the soma (Cheng et al, 2015a,b). In the current study, we provide new evidence showing that Rheb‐dependent mitophagy initiation coordinates with dynein–Snapin‐mediated retrograde transport to promote removal of mitophagosomes and thus reduces mitochondrial stress in distal axons, a process critical for synaptic mitochondrial maintenance. Interestingly, our results suggest that newly generated mitophagosomes fuse rapidly with LEs to form amphi‐mitophagosomes, allowing mitophagosomes to load dynein–Snapin transport machinery and enabling their retrograde transport motility (Figs 2 and EV1). Moreover, we propose that defects in dynein–Snapin‐mediated retrograde transport exacerbate mitophagic accumulation at AD synapses. We have previously demonstrated that soluble oligomeric Aβ1–42 disrupts dynein motor‐Snapin coupling and thus impairs dynein motor recruitment to AVs, leading to defective AV retrograde transport in AD axons (Tammineni & Cai, 2017; Tammineni et al, 2017b; Winckler et al, 2018). Mitophagosomes are concentrated in AD synapses enriched with oligomeric Aβ (Figs 3F and EV3C). Therefore, this supports the view that impaired retrograde transport of mitophagosomes is likely attributed to soluble oligomeric Aβ‐mediated disruption of dynein–Snapin coupling. Consistently, elevated Snapin expression restores retrograde transport and enhances axonal removal of mitophagosomes, thereby reducing mitochondrial stress at AD synapses (Figs 6 and EV5A). We have shown that, while defects in Snapin‐mediated retrograde transport recapitulate synaptic mitophagy stress as we observed in AD neurons, snapin deficiency in mouse brains leads to synaptic degeneration (Fig 5). Moreover, Snapin‐enhanced retrograde transport ameliorates synaptic loss in AD mouse brains infected with AAV‐Snapin (Fig 7). Collectively, these results indicate that mitophagy‐mediated quality control of synaptic mitochondria is essential for synaptic maintenance. Thus, in addition to Aβ‐induced mitochondrial damage, our findings allow us to propose that AD‐linked synaptic mitochondrial deficit is attributed to impaired mitochondrial maintenance at synaptic terminals due to mitophagy failure.
It is well established that proteolytically active lysosomes are highly enriched in the soma of neurons (Cai et al, 2010, 2012b; Gowrishankar et al, 2015; Xie et al, 2015; Maday & Holzbaur, 2016; Tammineni et al, 2017a; Cheng et al, 2018; Yap et al, 2018; Lee et al, 2019). We and others have shown that impaired lysosomal proteolysis results in lysosomal accumulation of undigested substrates, including autophagy cargoes, in the neuronal soma (Cai et al, 2010, 2012b; Xie et al, 2015; Maday & Holzbaur, 2016; Tammineni et al, 2017a; Cheng et al, 2018; Lee et al, 2019). Consistent with somatic localization of mature lysosomes in neurons, previous studies reported that acidic mitochondria can be detected in the soma, but not in the axons of neurons (Bingol et al, 2014; Puri et al, 2019). In the current study, our observations further support the notion that, upon mitochondrial damage, mitophagic clearance within lysosomes mainly occurs in the soma (Fig EV4A–D). Therefore, efficient retrograde transport plays a critical role in removing newly generated mitophagosomes from distal axons for lysosomal degradation in the soma, thereby reducing mitophagic stress at synaptic terminals. Lysosomal deficiency has been implicated as one of the main cell defects in AD brains (Nixon, 2013; Menzies et al, 2015). We found that AD neurons displayed aberrant accumulation of mitolysosomes in the soma, but not within axons in the presence or absence of Δψm dissipation (Fig EV4E–I). Our previous work revealed that Parkin‐mediated mitophagy is induced in the soma of AD neurons. Moreover, lysosomal proteolysis of autophagic substrates is impaired as a result of lysosomal protease deficiency in these AD neurons (Ye et al, 2015; Tammineni et al, 2017a). Thus, mitolysosomal retention in the soma of AD neurons could be attributed to Parkin‐mediated mitophagy induction and defects in lysosomal proteolysis. Therefore, our results indicate that lysosomal dysfunction has no direct impact on mitophagy regulation at synaptic terminals, further supporting the view that mitophagy stress at AD synapses is caused by increased mitophagy initiation and defective retrograde transport of mitophagosomes.
In summary, malfunctioning mitochondria not only fail to sustain synaptic activities but also augment oxidative damage and Aβ‐mediated toxicity at synaptic terminals. Our study provides new insights into the mechanism of neuronal mitophagy to maintain the integrity and function of synaptic mitochondria, thereby conceptually advancing current knowledge as to how mitophagy failure and defects in mitochondrial maintenance exacerbate synaptic mitochondrial deficits and thus augment synapse damage in AD. Elucidation of this pathological mechanism has a broad neurobiological impact because mitochondrial defects, synaptic pathology, and impaired axonal transport are the defining features of AD and other major neurodegenerative diseases. Our study provides molecular and cellular target for potential therapeutic approaches aimed at enhancing mitophagy to mitigate synaptic dysfunction in AD.
Materials and Methods
Materials
pMXs‐EGFP‐Rheb‐IP and pMXs‐EGFP‐Rheb SSVM‐IP were from S. Yamanaka, pRK5‐Myc‐Rheb was from K. Guan, and Matrix‐roGFP was from P. Schumacker. pLKO.1 Rheb shRNA #1, pLKO.1 Rheb shRNA #2, and pLKO.1 scrambled shRNA were from D. Sabatini. pLKO.1 Nix shRNA was from J. Gordon. pFUChW Parkin shRNA and pFUChW non‐targeting shRNA were from D. Chan. pcDNA3.1 PS1L286V and PS1L286E were from X. Xu. pEBFP2‐Mito‐7 was from M. Davidson. Snapin and pMT‐mKeima‐Red plasmids and polyclonal antibody were obtained from Z.H. Sheng. The constructs encoding Snapin, Snapin‐L99K, DsRed‐Mito, GFP‐LC3B, YFP‐Rab7, YFP‐Parkin, GFP‐LAMP1, and AAV2/9‐mCherry and AAV2/9‐mCherry‐Snapin constructs were prepared as previously described (Cai et al, 2010, 2012b; Ye & Cai, 2014; Ye et al, 2015, 2017; Feng et al, 2017; Tammineni et al, 2017b). Sources of antibodies and reagents are as follows: polyclonal antibodies against LC3 (Cat. 2775), Rheb (Cat. 13879), and HSP60 (Cat. 12165) (Cell Signaling Technology), p62/SQSTM1 (Cat. PM045) (MBL), SOD2 (Cat. HPA001814) (Sigma), synaptophysin (Cat. sc‐9116) and TOM20 (Cat. sc‐11415) (Santa Cruz), NeuN (Cat. ABN78) (Millipore/CHEMICON), Oligomer A11 (Cat. AHB0052) (Thermo Scientific); monoclonal antibodies against Rab7 (Cat. R8779) (Sigma), p62/SQSTM1 (Cat. H00008878‐M01) (Abnova), Myc (Cat. #2276) (Cell Signaling Technology), HA (Cat. MMS‐101P) (Covance), CI‐MPR (Cat. 86f7) (Developmental Studies Hybridoma Bank), PSD95 (Cat. 05‐494) (Upstate), Parkin (Cat. sc‐32282) (Santa Cruz), synaptophysin (Cat. MAB5258‐1) and GAPDH (Cat. CB1001) (Millipore/CHEMICON), p115 (Cat. 612261) and cytochrome c (Cat. 556432) (BD Biosciences), mCherry (Cat. 632543) (Clontech), VDAC (Cat. ab14734) (Abcam); β Amyloid (6E10) (Cat. SIG‐39320) (BioLegend); Alexa Fluor 488 (anti‐mouse: Cat. A‐11017; anti‐rabbit: Cat. A‐11070)‐, 546 (anti‐mouse: Cat. A‐11018; anti‐rabbit: Cat. A‐11071)‐, and 647 (anti‐mouse: Cat. A‐21235; anti‐rabbit: Cat. A‐21246)‐conjugated secondary antibodies (Invitrogen); and CCCP (Cat. 215911), Z‐VAD‐FMK (Cat. 219007), antimycin A (Cat. A8674), trehalose (Cat. T0167), and DMSO (Cat. 116743) (Sigma).
Mouse lines and animal care
snapin flox mice were provided by Z.H. Sheng (National Institute of Neurologic Disorders and Stroke, NIH, Bethesda, MD). CaMKIIα‐tTA and tet‐APPswe/ind mice were obtained from H. Cai (National Institute on Aging, NIH, Bethesda, MD). Mutant hAPPswe/ind Tg (J20) mice (C57BL/6J) (Mucke et al, 2000), CamKII‐cre mice, and Thy1‐cre Tg mice were purchased from the Jackson Laboratory and crossed with snapin flox mice, respectively. All animal procedures were carried out following the Rutgers Institutional Animal Care and USE COMMITTEE (IACUC). The animal facilities at Rutgers University are fully AAALAC‐accredited.
Preparation of synapse‐enriched fractions
Synaptosomal preparations from the brains of WT and mutant hAPP Tg mice or snapin conditional KO mice were collected using Percoll gradient centrifugation as described in the protocol (Leenders et al, 2004). Cortex tissues were homogenized in ice‐cold sucrose buffer [5 mM HEPES, 1 mM EDTA, 0.32 M sucrose and protease inhibitors (Roche, Indianapolis, IN), pH 7.4]. Homogenates were centrifuged at 1,000 g for 10 min, and the supernatant was gathered and overlaid on Percoll gradients that has 2 ml of 10% Percoll gradient layered over 15, 23, and 40% Percoll gradients. The gradient was then separated by centrifugation for 5 min at 32,500 g. The synaptosomal fraction was collected from the 15%/23% Percoll layers and combined with 5 ml the sucrose buffer. The mixture was then centrifuged at 15,000 g for 15 min and resuspended in the sucrose buffer. Protein quantification was performed by BCA assay (Pierce Chemical Co./Thermo scientific). 10 μg of protein from synaptosome (Syn) and post‐nuclear supernatant (PNS) homogenates were resolved by 4–12% Bis‐Tris for sequential Western blots on the same membranes after stripping between each application of antibody. For multiple detection with different antibodies, blots were first stripped in a solution of 62.5 mM Tris–HCl, pH 7.5, 20 mM dithiothreitol, and 1% SDS for 15 min at 50°C with agitation and then washed with TBS/0.1% Tween‐20 for 2 × 15 min (Leenders et al, 2004; Cai et al, 2010; Ye et al, 2017).
Preparation of mitochondria‐enriched fractions
Mitochondria‐enriched membrane was prepared as previously described (Ye et al, 2015). Briefly, WT or mutant hAPP Tg or snapin conditional KO mouse brains were homogenized in ice‐cold Isolation Buffer (IB) [10 mM Tris–HCl, 1 mM EGTA, 1 mM EDTA, 0.25 M sucrose and protease inhibitors (Roche), pH7.4]. For membrane fractionation of cultured neurons, WT or mutant hAPP Tg cortical neurons were plated in 100‐mm dishes at a density of 5 × 10⁶ and treated with DMSO or 10 μM CCCP at DIV14–17. After washing once with PBS, cells were harvested and suspended in ice‐cold IB Buffer. Cells were then homogenized 20 times by passing through a 25‐gauge needle using a 1‐ml syringe on ice. Following centrifugation of homogenates from mouse brains or cells at 1,000 g for 10 min at 4°C, the supernatant was saved as post‐nuclear supernatant (P). The supernatant was further centrifuged at 15,000 g for 10 min to separate the mitochondria‐enriched fraction (M) from the cytosol‐enriched fraction (S). Protein concentration of mitochondria‐enriched membrane fractions was determined by BCA protein assay (Pierce Chemical Co./Thermo scientific) using BSA standards. The same amount of protein (20 μg) from each fraction was resolved by 4–12% Bis‐Tris PAGE for sequential Western blots on the same membranes after stripping between each application of antibody.
HEK293 and HeLa cell culture and transfection
HEK293 and HeLa cell lines (ATCC) were incubated with high glucose Dulbecco's modified Eagle's medium (DMEM) containing sodium pyruvate and l‐glutamine, supplemented with 10% fetal bovine serum (FBS) and penicillin–streptomycin (Invitrogen). Lipofectamine 2000 was used for transient transfection of cells. 100 μl of Opti‐MEM (Invitrogen) and 5 μl of Lipofectamine 2000 (Invitrogen) per 35 mm dish were pre‐incubated at room temperature (RT) for 5 min and then mixed with 100 μl of Opti‐MEM containing DNA plasmids (2–3 μg per 35 mm dish) and incubated for 20 min at RT to allow complex formation. The entire mixture was added directly to cultured cells. Following transfection, cells were cultured for an additional 1–2 days before harvesting for biochemical analysis.
Immunoprecipitation
Equal amounts of 1,000 μg cortical neuron lysates treated with CCCP or 800 μg transfected HeLa cell lysates with and without CCCP treatment were incubated with anti‐Rheb antibody or anti‐Myc antibody or anti‐normal IgG in 200 μl of TBS with 0.1% Triton X‐100, 10 mM EDTA, and protease inhibitors, and incubated on a rotator at 4°C for overnight. 2.5 mg Protein A‐Sepharose CL‐4B resin (GE Healthcare) was added to each sample, and the incubation continued for an additional 3 h followed by three washes with TBS with 0.1% Triton X‐100. Immobilized protein complexes were processed for 4–12% Bis‐Tris PAGE and immunoblotting on the same membranes after stripping between each application of the antibody.
Tissue preparation and immunohistochemistry
Animals were anesthetized with 2.5% avertin (0.35 ml per mouse) and transcardially perfused with fixation buffer (4% paraformaldehyde in PBS, pH 7.4). Brains were dissected out and post‐fixed in fixation buffer overnight and then placed in 30% sucrose at 4°C. 10‐μm‐thick coronal sections were collected consecutively to the level of the hippocampus and used to study co‐localization of various markers. After incubation with blocking buffer (5% goat serum, 0.3% Triton X‐100, 3% BSA, 1% glycine in PBS) at RT for 1 h, the sections were incubated with primary antibodies at 4°C overnight, followed by incubating with secondary fluorescence antibodies at 1:600 dilution at RT for 1 h. After fluorescence immunolabeling, the sections were stained with DAPI and washed three times in PBS. The sections were then mounted with anti‐fading medium (Vector Laboratories, H‐5000) for imaging. Confocal images were obtained using an Olympus FV1000 oil immersion 40× objective with sequential‐acquisition setting. Eight to ten sections were taken from top‐to‐bottom of the specimen, and brightest point projections were made.
Transmission electron microscopy
Hippocampi from WT and mutant hAPP Tg or snapin cKO mice were cut into small specimens (one dimension < 1 mm) and fixed in Trumps fixative (Electron Microscopy Sciences) for 2 h at RT. The sections were then washed by 0.1 M cacodylate buffer, and post‐fixed in 1% osmium tetroxide, followed by dehydrating in ethanol, and embedding using the EM bed 812 kit (Electron Microscopy Sciences) according to a stand procedure. Images were acquired on an electron microscope (1200EX; JEOL) (Electron Imaging Facility in the Department of pathology and Laboratory Medicine, Robert Wood Johnson Medical School). For quantitative studies, the number of mitochondria and the number of mitochondria within autophagic vacuole (AV)‐like organelles at presynaptic terminals were counted from electron micrographs, respectively. Mitophagosomes were characterized by mitochondria within double‐membrane structures (AVi) or surrounded by structures (AVd or amphisome) containing partially degraded cytoplasmic components, vesicles, or high electron dense materials (Nixon, 2005; Cai et al, 2010; Klionsky et al, 2016; Tammineni et al, 2017b). Quantification analysis was performed blindly to condition.
Transfection of cultured cortical neurons
Cortices were dissected from E18‐19 mouse embryos as described (Cai et al, 2010, 2012b; Ye et al, 2015, 2017; Tammineni et al, 2017b). Cortical neurons were dissociated by papain (Worthington) and plated at a density of 200,000 cells per cm2 on polyornithine‐ and fibronectin‐coated coverslips. Neurons were grown overnight in plating medium (5% FBS, insulin, glutamate, G5 and 1 × B27) supplemented with 100× l‐glutamine in Neurobasal medium (Invitrogen). Starting at DIV2, cultures were maintained in conditioned medium with half‐feed changes of neuronal feed (1 × B27 in Neurobasal medium) every 3 days. Neurons were treated with DMSO, 10 μM CCCP, 10 μM CCCP and 5 μM E64D/5 μM pepstatin A, or 1 μM antimycin A (AA) for 24 h, or transfected with various constructs at DIV5‐7 using Lipofectamine 2000 (Invitrogen) followed by time‐lapse imaging 10–12 days after transfection.
Image acquisition and quantification
Confocal images were obtained using an Olympus FV1000 oil immersion 60× objective with sequential‐acquisition setting. For fluorescent quantification, images were acquired using the same settings below saturation at a resolution of 1,024 × 1,024 pixels (8 bit). Eight to ten sections were taken from top‐to‐bottom of the specimen, and brightest point projections were made. Co‐localization and morphometric measurements were performed using NIH ImageJ. Measured data were imported into Excel software for analysis. The thresholds in all images were set to similar levels. Data were obtained from at least three independent experiments, and the number of cells used for quantification was indicated in the figures. All statistical analyses were performed using Student's t‐test and are presented as mean ± SEM.
For live‐cell imaging, cells were transferred to Tyrode's solution containing 10 mM HEPES, 10 mM glucose, 1.2 mM CaCl2, 1.2 mM MgCl2, 3 mM KCl, and 145 mM NaCl, pH 7.4. Temperature was maintained at 37°C with an air stream incubator. Cells were visualized with a 60× oil immersion lens (1.3 numerical aperture) on an Olympus FV1000 confocal microscope, using 488 nm excitation for GFP or YFP, 543 nm for DsRed, or 405 for DAPI. Time‐lapse sequences of 1,024 × 1,024 pixels (8 bit) were collected at 5‐s intervals with 1% intensity of the argon laser to minimize laser‐induced bleaching and damage to cells, and maximum pinhole opening. Time‐lapse images were captured by a total of 100 frames. All recordings started 6 min after the coverslip was placed in the chamber. The stacks of representative images were imported into NIH ImageJ. A membranous organelle was considered stopped if it remained stationary for the entire recording period; a motile one was counted only if the displacement was at least 5 μm.
For analyzing the motility of mitochondria, mitophagosomes, or mito‐amphisomes in live neurons, we selected axons for time‐lapse imaging and measuring motility because axons, but not dendrites, have a uniform microtubule organization and polarity. Axonal processes were selected as we previously reported (Cai et al, 2010, 2012b; Ye & Cai, 2014; Ye et al, 2015, 2017; Tammineni et al, 2017a,b). Briefly, axons in live images were distinguished from dendrites based on known morphological characteristics: greater length, thin and uniform diameter, and sparse branching. Only those that appeared to be single axons and separate from other processes in the field were chosen for recording axonal transport. Regions where crossing or fasciculation occurred were excluded from analysis.
Kymographs were used to trace axonal anterograde or retrograde movement of membranous organelles and to count stationary ones as described previously (Cai et al, 2010, 2012b; Ye & Cai, 2014; Ye et al, 2015, 2017; Tammineni et al, 2017a,b) with extra plug‐ins for ImageJ (NIH). Briefly, we used the “Straighten” plugin to straighten curved axons and the “Grouped ZProjector” to z‐axially project re‐sliced time‐lapse images. The height of the kymographs represents recording time (100 s unless otherwise noted), while the width represents the length (μm) of the axon imaged. Counts were averaged from 100 frames for each time‐lapse image to ensure accuracy of stationary and motile events. Measurements are presented as mean ± SEM. Statistical analyses were performed using unpaired Student's t‐tests.
Quantification of the density of presynaptic terminals was performed in the hippocampal mossy fiber regions using synaptophysin (SYP) fluorescence as previously reported (Mucke et al, 2000; Nagahara et al, 2013; Ye et al, 2017). Sampled sections consisted of 320 μm × 320 μm images acquired with an Olympus Confocal Microscope at 2,048 × 2,048 pixel resolution with a 40× objective lens. The number of pixels containing SYP immunoreactivity was measured per unit area above a minimum threshold intensity determined with the thresholding function of NIH ImageJ: Histograms of pixel brightness reflecting a bimodal distribution of background peak (mode) and a smaller signal peak (SYP fluorescence), with a 1.5 SD above background (mode), were generated. The area occupied by SYP‐labeled presynaptic terminals was quantified and expressed as a percentage of the total image area as described previously (Mucke et al, 2000; Nagahara et al, 2013; Ye et al, 2017). To ensure objective assessments and reliability of results, brain sections from mice to be compared in any given experiment were blind‐coded and processed in parallel. Codes were broken after the analysis was complete.
Determine oxidized mitochondria in live neurons
MitoROGFP (Addgene plasmid 49437) was used to measure mitochondrial oxidation in live neurons (Waypa et al, 2010; Xie et al, 2013). Neurons expressing MitoROGFP were excited at 405 nm or 488 nm with a sequential line scanning method. The emission was configured and detected at 510 nm. Images were processed using FV1000 software, ImageJ, and Adobe Photoshop CS3 (Adobe systems). To compare the intensities of the soma and axons of neurons between two excitation wavelengths (405 and 488 nm), the same ROIs were chosen to obtain intensity values for both excitation wavelengths. The 405/488 ratios in each experiment were normalized to the values of WT or mutant hAPP Tg neurons in the presence or absence of CCCP.
Determine acidic mitochondria in live neurons
Live‐cell imaging was performed in WT or mutant hAPP cortical neurons expressing mt‐Keima alone or mt‐Keima with other different constructs after treatment with DMSO, CCCP, or CCCP with lysosomal inhibitors (LIs) pepstatin A (5 μM) and E64D (5 μM). Neurons were visualized with an FV3000 oil immersion 60× objective with two sequential excitation lasers at 440 nm (green, healthy mitochondria at neutral pH) and 586 nm (red, damaged mitochondria engulfed by lysosomes under acidic pH) and an emission spectrum from 590 to 680 nm (Katayama et al, 2011; Bingol et al, 2014; Puri et al, 2019). Images were sequentially acquired from top to bottom with Z‐step (0.5 μm) at a resolution of 1,024 × 1,024 pixels, 8 bit, and stacked using Z‐projection (maximum intensity). Images were imported into ImageJ (NIH), and the background was removed using the built‐in plugin “remove background” prior to quantification.
In vivo gene delivery
The AAV2/9‐mCherry and AAV2/9‐mCherry‐Snapin constructs were kindly provided by Z.‐H. Sheng and as described previously (Xie et al, 2015; Ye et al, 2017). The AAV2/9‐mCherry‐Snapin construct contains an IRES segment between mouse Snapin and mCherry sequences, resulting in separate expression of mouse Snapin and mCherry. The AAV2/9‐mCherry and AAV2/9‐mCherry‐Snapin viruses were produced by Vector BioLabs. Adult mutant hAPP Tg mice at 2–3 months of age were injected into the hippocampal dentate gyrus (AP, −2 mm; L, −1.5 mm; DV, +1.75 mm) of both cerebral hemispheres according to the stereotaxic atlas of Paxinos and Franklin (2001) using 4–8 × 10⁹ total viral particles per side and analyzed 5–8 months after injection.
Author contributions
SH, YYJ, PS, and QC designed the project. SH, YYJ, PS, XS, and QC conducted experiments and data analysis. QC is the senior author who conceived and designed the project and wrote the manuscript.
Conflict of interest
The authors declare that they have no conflict of interest.
Supporting information
Expanded View Figures PDF
Review Process File
Acknowledgements
We thank members of the Cai Lab for technical assistance and constructive discussion; Y. Zuo and J. Cheung for critical reading; Z‐H. Sheng for snapin‐mutant mouse lines and Snapin and pMT‐mKeima‐Red plasmids; H. Cai for CaMKIIα‐tTA and tet‐APPswe/ind mice; K. Guan for pRK5‐Myc‐Rheb; S. Yamanaka for pMXs‐EGFP‐Rheb‐IP and pMXs‐EGFP‐Rheb SSVM‐IP; P. Schumacker for mitoROGFP; D. Sabatini for pLKO.1 Rheb shRNA #1 & #2 and pLKO.1 scrambled shRNA; J. Gordon for pLKO.1 Nix shRNA; X. Xu for pcDNA3.1 PS1L286V and PS1L286E; D. Chan for pFUChW Parkin shRNA and pFUChW non‐targeting shRNA; M. Davidson for pEBFP2‐Mito‐7; and R. Patel at EM facility in the Department of Pathology and Laboratory Medicine, Robert Wood Johnson Medical School for technical help. This work was supported by National Institutes of Health grants R01NS089737, R01GM135326, and R21NS102780 (Q.C.).
EMBO Reports (2020) 21: e49801
Data availability
We have not generated data that require deposition in a public database.
References
- Basso AD, Mirza A, Liu G, Long BJ, Bishop WR, Kirschmeier P (2005) The farnesyl transferase inhibitor (FTI) SCH66336 (lonafarnib) inhibits Rheb farnesylation and mTOR signaling. Role in FTI enhancement of taxane and tamoxifen anti‐tumor activity. J Biol Chem 280: 31101–31108 [DOI] [PubMed] [Google Scholar]
- Bingol B, Tea JS, Phu L, Reichelt M, Bakalarski CE, Song Q, Foreman O, Kirkpatrick DS, Sheng M (2014) The mitochondrial deubiquitinase USP30 opposes parkin‐mediated mitophagy. Nature 510: 370–375 [DOI] [PubMed] [Google Scholar]
- Birsa N, Norkett R, Wauer T, Mevissen TE, Wu HC, Foltynie T, Bhatia K, Hirst WD, Komander D, Plun‐Favreau H et al (2014) Lysine 27 ubiquitination of the mitochondrial transport protein Miro is dependent on serine 65 of the Parkin ubiquitin ligase. J Biol Chem 289: 14569–14582 [DOI] [PMC free article] [PubMed] [Google Scholar]
- Cai Q, Lu L, Tian JH, Zhu YB, Qiao H, Sheng ZH (2010) Snapin‐regulated late endosomal transport is critical for efficient autophagy‐lysosomal function in neurons. Neuron 68: 73–86 [DOI] [PMC free article] [PubMed] [Google Scholar]
- Cai Q, Sheng ZH (2011) Uncovering the role of Snapin in regulating autophagy‐lysosomal function. Autophagy 7: 445–447 [DOI] [PMC free article] [PubMed] [Google Scholar]
- Cai Q, Zakaria HM, Sheng ZH (2012a) Long time‐lapse imaging reveals unique features of PARK2/Parkin‐mediated mitophagy in mature cortical neurons. Autophagy 8: 976–978 [DOI] [PMC free article] [PubMed] [Google Scholar]
- Cai Q, Zakaria HM, Simone A, Sheng ZH (2012b) Spatial parkin translocation and degradation of damaged mitochondria via mitophagy in live cortical neurons. Curr Biol 22: 545–552 [DOI] [PMC free article] [PubMed] [Google Scholar]
- Cai Q, Tammineni P (2016) Alterations in mitochondrial quality control in Alzheimer's disease. Front Cell Neurosci 10: 24 [DOI] [PMC free article] [PubMed] [Google Scholar]
- Cai Q, Tammineni P (2017) Mitochondrial aspects of synaptic dysfunction in Alzheimer's disease. J Alzheimers Dis 57: 1087–1103 [DOI] [PMC free article] [PubMed] [Google Scholar]
- Cai Q, Jeong YY (2020) Mitophagy in Alzheimer's disease and other age‐related neurodegenerative diseases. Cells 9: 150 [DOI] [PMC free article] [PubMed] [Google Scholar]
- Chamberlain KA, Sheng ZH (2019) Mechanisms for the maintenance and regulation of axonal energy supply. J Neurosci Res 97: 897–913 [DOI] [PMC free article] [PubMed] [Google Scholar]
- Chan NC, Chan DC (2011) Parkin uses the UPS to ship off dysfunctional mitochondria. Autophagy 7: 771–772 [DOI] [PMC free article] [PubMed] [Google Scholar]
- Cheng XT, Zhou B, Lin MY, Cai Q, Sheng ZH (2015a) Axonal autophagosomes recruit dynein for retrograde transport through fusion with late endosomes. J Cell Biol 209: 377–386 [DOI] [PMC free article] [PubMed] [Google Scholar]
- Cheng XT, Zhou B, Lin MY, Cai Q, Sheng ZH (2015b) Axonal autophagosomes use the ride‐on service for retrograde transport toward the soma. Autophagy 11: 1434–1436 [DOI] [PMC free article] [PubMed] [Google Scholar]
- Cheng XT, Xie YX, Zhou B, Huang N, Farfel‐Becker T, Sheng ZH (2018) Characterization of LAMP1‐labeled nondegradative lysosomal and endocytic compartments in neurons. J Cell Biol 217: 3127–3139 [DOI] [PMC free article] [PubMed] [Google Scholar]
- Cummins N, Tweedie A, Zuryn S, Bertran‐Gonzalez J, Gotz J (2019) Disease‐associated tau impairs mitophagy by inhibiting Parkin translocation to mitochondria. EMBO J 38: e99360 [DOI] [PMC free article] [PubMed] [Google Scholar]
- Devireddy S, Liu A, Lampe T, Hollenbeck PJ (2015) The organization of mitochondrial quality control and life cycle in the nervous system in vivo in the absence of PINK1. J Neurosci 35: 9391–9401 [DOI] [PMC free article] [PubMed] [Google Scholar]
- DiGiovanni J, Sun T, Sheng ZH (2012) Characterizing synaptic vesicle proteins using synaptosomal fractions and cultured hippocampal neurons. Curr Protoc Neurosci Chapter 2: Unit 2 7 1‐22 [DOI] [PMC free article] [PubMed] [Google Scholar]
- Du H, Guo L, Yan S, Sosunov AA, McKhann GM, Yan SS (2010) Early deficits in synaptic mitochondria in an Alzheimer's disease mouse model. Proc Natl Acad Sci USA 107: 18670–18675 [DOI] [PMC free article] [PubMed] [Google Scholar]
- Du H, Guo L, Yan SS (2012) Synaptic mitochondrial pathology in Alzheimer's disease. Antioxid Redox Signal 16: 1467–1475 [DOI] [PMC free article] [PubMed] [Google Scholar]
- Du F, Yu Q, Yan S, Hu G, Lue LF, Walker DG, Wu L, Yan SF, Tieu K, Yan SS (2017) PINK1 signalling rescues amyloid pathology and mitochondrial dysfunction in Alzheimer's disease. Brain 140: 3233–3251 [DOI] [PMC free article] [PubMed] [Google Scholar]
- Fang EF, Hou Y, Palikaras K, Adriaanse BA, Kerr JS, Yang B, Lautrup S, Hasan‐Olive MM, Caponio D, Dan X et al (2019) Mitophagy inhibits amyloid‐beta and tau pathology and reverses cognitive deficits in models of Alzheimer's disease. Nat Neurosci 22: 401–412 [DOI] [PMC free article] [PubMed] [Google Scholar]
- Fei P, Wang W, Kim SH, Wang S, Burns TF, Sax JK, Buzzai M, Dicker DT, McKenna WG, Bernhard EJ et al (2004) Bnip3L is induced by p53 under hypoxia, and its knockdown promotes tumor growth. Cancer Cell 6: 597–609 [DOI] [PubMed] [Google Scholar]
- Feng T, Tammineni P, Agrawal C, Jeong YY, Cai Q (2017) Autophagy‐mediated regulation of BACE1 protein trafficking and degradation. J Biol Chem 292: 1679–1690 [DOI] [PMC free article] [PubMed] [Google Scholar]
- Gibson GE, Shi Q (2010) A mitocentric view of Alzheimer's disease suggests multi‐faceted treatments. J Alzheimers Dis 20(Suppl 2): S591–S607 [DOI] [PMC free article] [PubMed] [Google Scholar]
- Gowrishankar S, Yuan P, Wu Y, Schrag M, Paradise S, Grutzendler J, De Camilli P, Ferguson SM (2015) Massive accumulation of luminal protease‐deficient axonal lysosomes at Alzheimer's disease amyloid plaques. Proc Natl Acad Sci USA 112: E3699–E3708 [DOI] [PMC free article] [PubMed] [Google Scholar]
- Groenewoud MJ, Zwartkruis FJ (2013) Rheb and Rags come together at the lysosome to activate mTORC1. Biochem Soc Trans 41: 951–955 [DOI] [PubMed] [Google Scholar]
- Guo L, Tian J, Du H (2017) Mitochondrial dysfunction and synaptic transmission failure in Alzheimer's disease. J Alzheimers Dis 57: 1071–1086 [DOI] [PMC free article] [PubMed] [Google Scholar]
- Hung COY, Livesey FJ (2018) Altered gamma‐secretase processing of APP disrupts lysosome and autophagosome function in monogenic Alzheimer's disease. Cell Rep 25: 3647–3660 e3642 [DOI] [PMC free article] [PubMed] [Google Scholar]
- Kang C, Yeo D, Ji LL (2016) Muscle immobilization activates mitophagy and disrupts mitochondrial dynamics in mice. Acta Physiol (Oxf) 218: 188–197 [DOI] [PubMed] [Google Scholar]
- Katayama H, Kogure T, Mizushima N, Yoshimori T, Miyawaki A (2011) A sensitive and quantitative technique for detecting autophagic events based on lysosomal delivery. Chem Biol 18: 1042–1052 [DOI] [PubMed] [Google Scholar]
- Kim SR, Kareva T, Yarygina O, Kholodilov N, Burke RE (2012) AAV transduction of dopamine neurons with constitutively active Rheb protects from neurodegeneration and mediates axon regrowth. Mol Ther 20: 275–286 [DOI] [PMC free article] [PubMed] [Google Scholar]
- Klionsky DJ, Abdelmohsen K, Abe A, Abedin MJ, Abeliovich H, Acevedo Arozena A, Adachi H, Adams CM, Adams PD, Adeli K et al (2016) Guidelines for the use and interpretation of assays for monitoring autophagy. Autophagy 12: 1–222 [DOI] [PMC free article] [PubMed] [Google Scholar]
- Koentjoro B, Park JS, Sue CM (2017) Nix restores mitophagy and mitochondrial function to protect against PINK1/Parkin‐related Parkinson's disease. Sci Rep 7: 44373 [DOI] [PMC free article] [PubMed] [Google Scholar]
- Kruger U, Wang Y, Kumar S, Mandelkow EM (2012) Autophagic degradation of tau in primary neurons and its enhancement by trehalose. Neurobiol Aging 33: 2291–2305 [DOI] [PubMed] [Google Scholar]
- Kulic L, Walter J, Multhaup G, Teplow DB, Baumeister R, Romig H, Capell A, Steiner H, Haass C (2000) Separation of presenilin function in amyloid beta‐peptide generation and endoproteolysis of Notch. Proc Natl Acad Sci USA 97: 5913–5918 [DOI] [PMC free article] [PubMed] [Google Scholar]
- Lee JH, Yu WH, Kumar A, Lee S, Mohan PS, Peterhoff CM, Wolfe DM, Martinez‐Vicente M, Massey AC, Sovak G et al (2010) Lysosomal proteolysis and autophagy require presenilin 1 and are disrupted by Alzheimer‐related PS1 mutations. Cell 141: 1146–1158 [DOI] [PMC free article] [PubMed] [Google Scholar]
- Lee JH, Rao MV, Yang DS, Stavrides P, Im E, Pensalfini A, Huo C, Sarkar P, Yoshimori T, Nixon RA (2019) Transgenic expression of a ratiometric autophagy probe specifically in neurons enables the interrogation of brain autophagy in vivo . Autophagy 15: 543–557 [DOI] [PMC free article] [PubMed] [Google Scholar]
- Leenders M, Gerwin C, Sheng ZH (2004) Multidisciplinary approaches for characterizing synaptic vesicle proteins. Curr Protoc Neurosci Chapter 2: Unit 2 7 [DOI] [PubMed] [Google Scholar]
- Lin MY, Cheng XT, Tammineni P, Xie Y, Zhou B, Cai Q, Sheng ZH (2017) Releasing syntaphilin removes stressed mitochondria from axons independent of mitophagy under pathophysiological conditions. Neuron 94: 595–610 e596 [DOI] [PMC free article] [PubMed] [Google Scholar]
- Liu S, Sawada T, Lee S, Yu W, Silverio G, Alapatt P, Millan I, Shen A, Saxton W, Kanao T et al (2012) Parkinson's disease‐associated kinase PINK1 regulates Miro protein level and axonal transport of mitochondria. PLoS Genet 8: e1002537 [DOI] [PMC free article] [PubMed] [Google Scholar]
- Maday S, Wallace KE, Holzbaur EL (2012) Autophagosomes initiate distally and mature during transport toward the cell soma in primary neurons. J Cell Biol 196: 407–417 [DOI] [PMC free article] [PubMed] [Google Scholar]
- Maday S, Holzbaur EL (2016) Compartment‐specific regulation of autophagy in primary neurons. J Neurosci 36: 5933–5945 [DOI] [PMC free article] [PubMed] [Google Scholar]
- Manczak M, Kandimalla R, Yin X, Reddy PH (2018) Hippocampal mutant APP and amyloid beta‐induced cognitive decline, dendritic spine loss, defective autophagy, mitophagy and mitochondrial abnormalities in a mouse model of Alzheimer's disease. Hum Mol Genet 27: 1332–1342 [DOI] [PMC free article] [PubMed] [Google Scholar]
- Manji H, Kato T, Di Prospero NA, Ness S, Beal MF, Krams M, Chen G (2012) Impaired mitochondrial function in psychiatric disorders. Nat Rev Neurosci 13: 293–307 [DOI] [PubMed] [Google Scholar]
- Manning BD, Cantley LC (2003) United at last: the tuberous sclerosis complex gene products connect the phosphoinositide 3‐kinase/Akt pathway to mammalian target of rapamycin (mTOR) signalling. Biochem Soc Trans 31: 573–578 [DOI] [PubMed] [Google Scholar]
- Melser S, Chatelain EH, Lavie J, Mahfouf W, Jose C, Obre E, Goorden S, Priault M, Elgersma Y, Rezvani HR et al (2013) Rheb regulates mitophagy induced by mitochondrial energetic status. Cell Metab 17: 719–730 [DOI] [PubMed] [Google Scholar]
- Melser S, Lavie J, Benard G (2015) Mitochondrial degradation and energy metabolism. Biochim Biophys Acta 1853: 2812–2821 [DOI] [PubMed] [Google Scholar]
- Menzies FM, Fleming A, Rubinsztein DC (2015) Compromised autophagy and neurodegenerative diseases. Nat Rev Neurosci 16: 345–357 [DOI] [PubMed] [Google Scholar]
- Moreira PI, Siedlak SL, Wang X, Santos MS, Oliveira CR, Tabaton M, Nunomura A, Szweda LI, Aliev G, Smith MA et al (2007a) Autophagocytosis of mitochondria is prominent in Alzheimer disease. J Neuropathol Exp Neurol 66: 525–532 [DOI] [PubMed] [Google Scholar]
- Moreira PI, Siedlak SL, Wang X, Santos MS, Oliveira CR, Tabaton M, Nunomura A, Szweda LI, Aliev G, Smith MA et al (2007b) Increased autophagic degradation of mitochondria in Alzheimer disease. Autophagy 3: 614–615 [DOI] [PubMed] [Google Scholar]
- Mucke L, Masliah E, Yu GQ, Mallory M, Rockenstein EM, Tatsuno G, Hu K, Kholodenko D, Johnson‐Wood K, McConlogue L (2000) High‐level neuronal expression of abeta 1‐42 in wild‐type human amyloid protein precursor transgenic mice: synaptotoxicity without plaque formation. J Neurosci 20: 4050–4058 [DOI] [PMC free article] [PubMed] [Google Scholar]
- Nagahara AH, Merrill DA, Coppola G, Tsukada S, Schroeder BE, Shaked GM, Wang L, Blesch A, Kim A, Conner JM et al (2009) Neuroprotective effects of brain‐derived neurotrophic factor in rodent and primate models of Alzheimer's disease. Nat Med 15: 331–337 [DOI] [PMC free article] [PubMed] [Google Scholar]
- Nagahara AH, Mateling M, Kovacs I, Wang L, Eggert S, Rockenstein E, Koo EH, Masliah E, Tuszynski MH (2013) Early BDNF treatment ameliorates cell loss in the entorhinal cortex of APP transgenic mice. J Neurosci 33: 15596–15602 [DOI] [PMC free article] [PubMed] [Google Scholar]
- Neely Kayala KM, Dickinson GD, Minassian A, Walls KC, Green KN, Laferla FM (2012) Presenilin‐null cells have altered two‐pore calcium channel expression and lysosomal calcium: implications for lysosomal function. Brain Res 1489: 8–16 [DOI] [PMC free article] [PubMed] [Google Scholar]
- Nixon RA (2005) Endosome function and dysfunction in Alzheimer's disease and other neurodegenerative diseases. Neurobiol Aging 26: 373–382 [DOI] [PubMed] [Google Scholar]
- Nixon RA (2013) The role of autophagy in neurodegenerative disease. Nat Med 19: 983–997 [DOI] [PubMed] [Google Scholar]
- Nnah IC, Wang B, Saqcena C, Weber GF, Bonder EM, Bagley D, De Cegli R, Napolitano G, Medina DL, Ballabio A et al (2019) TFEB‐driven endocytosis coordinates MTORC1 signaling and autophagy. Autophagy 15: 151–164 [DOI] [PMC free article] [PubMed] [Google Scholar]
- Paxinos G, Franklin KBJ (2001) The mouse brain in stereotaxic coordinates, 2nd edn San Diego, CA: Academic Press; [Google Scholar]
- Pickles S, Vigie P, Youle RJ (2018) Mitophagy and quality control mechanisms in mitochondrial maintenance. Curr Biol 28: R170–R185 [DOI] [PMC free article] [PubMed] [Google Scholar]
- Pickrell AM, Youle RJ (2015) The roles of PINK1, parkin, and mitochondrial fidelity in Parkinson's disease. Neuron 85: 257–273 [DOI] [PMC free article] [PubMed] [Google Scholar]
- Polito VA, Li H, Martini‐Stoica H, Wang B, Yang L, Xu Y, Swartzlander DB, Palmieri M, di Ronza A, Lee VM et al (2014) Selective clearance of aberrant tau proteins and rescue of neurotoxicity by transcription factor EB. EMBO Mol Med 6: 1142–1160 [DOI] [PMC free article] [PubMed] [Google Scholar]
- Puri R, Cheng XT, Lin MY, Huang N, Sheng ZH (2019) Mul1 restrains Parkin‐mediated mitophagy in mature neurons by maintaining ER‐mitochondrial contacts. Nat Commun 10: 3645 [DOI] [PMC free article] [PubMed] [Google Scholar]
- Reddy PH, Beal MF (2008) Amyloid beta, mitochondrial dysfunction and synaptic damage: implications for cognitive decline in aging and Alzheimer's disease. Trends Mol Med 14: 45–53 [DOI] [PMC free article] [PubMed] [Google Scholar]
- Reddy PH, Manczak M, Mao P, Calkins MJ, Reddy AP, Shirendeb U (2010) Amyloid‐beta and mitochondria in aging and Alzheimer's disease: implications for synaptic damage and cognitive decline. J Alzheimers Dis 20(Suppl 2): S499–S512 [DOI] [PMC free article] [PubMed] [Google Scholar]
- Reddy PH (2011) Abnormal tau, mitochondrial dysfunction, impaired axonal transport of mitochondria, and synaptic deprivation in Alzheimer's disease. Brain Res 1415: 136–148 [DOI] [PMC free article] [PubMed] [Google Scholar]
- Reddy PH, Yin X, Manczak M, Kumar S, Pradeepkiran JA, Vijayan M, Reddy AP (2018) Mutant APP and amyloid beta‐induced defective autophagy, mitophagy, mitochondrial structural and functional changes and synaptic damage in hippocampal neurons from Alzheimer's disease. Hum Mol Genet 27: 2502–2516 [DOI] [PMC free article] [PubMed] [Google Scholar]
- Reddy PH, Oliver DM (2019) Amyloid beta and phosphorylated tau‐induced defective autophagy and mitophagy in Alzheimer's disease. Cells 8: 488 [DOI] [PMC free article] [PubMed] [Google Scholar]
- Rojansky R, Cha MY, Chan DC (2016) Elimination of paternal mitochondria in mouse embryos occurs through autophagic degradation dependent on PARKIN and MUL1. Elife 5: e17896 [DOI] [PMC free article] [PubMed] [Google Scholar]
- Sepuri NBV, Tammineni P, Mohammed F, Paripati A (2017) Nuclear transcription factors in the mitochondria: a new paradigm in fine‐tuning mitochondrial metabolism. Handb Exp Pharmacol 240: 3–20 [DOI] [PubMed] [Google Scholar]
- Shahani N, Pryor W, Swarnkar S, Kholodilov N, Thinakaran G, Burke RE, Subramaniam S (2014) Rheb GTPase regulates beta‐secretase levels and amyloid beta generation. J Biol Chem 289: 5799–5808 [DOI] [PMC free article] [PubMed] [Google Scholar]
- Shahani N, Huang WC, Varnum M, Page DT, Subramaniam S (2017) Forebrain depletion of Rheb GTPase elicits spatial memory deficits in mice. Neurobiol Aging 50: 134–143 [DOI] [PMC free article] [PubMed] [Google Scholar]
- Sheng ZH, Cai Q (2012) Mitochondrial transport in neurons: impact on synaptic homeostasis and neurodegeneration. Nat Rev Neurosci 13: 77–93 [DOI] [PMC free article] [PubMed] [Google Scholar]
- Sung H, Tandarich LC, Nguyen K, Hollenbeck PJ (2016) Compartmentalized regulation of Parkin‐mediated mitochondrial quality control in the drosophila nervous system in vivo . J Neurosci 36: 7375–7391 [DOI] [PMC free article] [PubMed] [Google Scholar]
- Swerdlow RH, Burns JM, Khan SM (2010) The Alzheimer's disease mitochondrial cascade hypothesis. J Alzheimers Dis 20(Suppl 2): S265–S279 [DOI] [PMC free article] [PubMed] [Google Scholar]
- Tammineni P, Cai Q (2017) Defective retrograde transport impairs autophagic clearance in Alzheimer disease neurons. Autophagy 13: 982–984 [DOI] [PMC free article] [PubMed] [Google Scholar]
- Tammineni P, Jeong YY, Feng T, Aikal D, Cai Q (2017a) Impaired axonal retrograde trafficking of the retromer complex augments lysosomal deficits in Alzheimer's disease neurons. Hum Mol Genet 26: 4352–4366 [DOI] [PMC free article] [PubMed] [Google Scholar]
- Tammineni P, Ye X, Feng T, Aikal D, Cai Q (2017b) Impaired retrograde transport of axonal autophagosomes contributes to autophagic stress in Alzheimer's disease neurons. Elife 6: e21776 [DOI] [PMC free article] [PubMed] [Google Scholar]
- Tonnies E, Trushina E (2017) Oxidative stress, synaptic dysfunction, and Alzheimer's disease. J Alzheimers Dis 57: 1105–1121 [DOI] [PMC free article] [PubMed] [Google Scholar]
- Tyagi R, Shahani N, Gorgen L, Ferretti M, Pryor W, Chen PY, Swarnkar S, Worley PF, Karbstein K, Snyder SH et al (2015) Rheb inhibits protein synthesis by activating the PERK‐eIF2alpha signaling cascade. Cell Rep 10: 684–693 [DOI] [PMC free article] [PubMed] [Google Scholar]
- Wang X, Winter D, Ashrafi G, Schlehe J, Wong YL, Selkoe D, Rice S, Steen J, LaVoie MJ, Schwarz TL (2011) PINK1 and Parkin target Miro for phosphorylation and degradation to arrest mitochondrial motility. Cell 147: 893–906 [DOI] [PMC free article] [PubMed] [Google Scholar]
- Waypa GB, Marks JD, Guzy R, Mungai PT, Schriewer J, Dokic D, Schumacker PT (2010) Hypoxia triggers subcellular compartmental redox signaling in vascular smooth muscle cells. Circ Res 106: 526–535 [DOI] [PMC free article] [PubMed] [Google Scholar]
- Winckler B, Faundez V, Maday S, Cai Q, Guimas Almeida C, Zhang H (2018) The endolysosomal system and proteostasis: from development to degeneration. J Neurosci 38: 9364–9374 [DOI] [PMC free article] [PubMed] [Google Scholar]
- Wong YC, Holzbaur EL (2014) The regulation of autophagosome dynamics by huntingtin and HAP1 is disrupted by expression of mutant huntingtin, leading to defective cargo degradation. J Neurosci 34: 1293–1305 [DOI] [PMC free article] [PubMed] [Google Scholar]
- Xiao Q, Yan P, Ma X, Liu H, Perez R, Zhu A, Gonzales E, Tripoli DL, Czerniewski L, Ballabio A et al (2015) Neuronal‐targeted TFEB accelerates lysosomal degradation of APP, reducing abeta generation and amyloid plaque pathogenesis. J Neurosci 35: 12137–12151 [DOI] [PMC free article] [PubMed] [Google Scholar]
- Xie H, Guan J, Borrelli LA, Xu J, Serrano‐Pozo A, Bacskai BJ (2013) Mitochondrial alterations near amyloid plaques in an Alzheimer's disease mouse model. J Neurosci 33: 17042–17051 [DOI] [PMC free article] [PubMed] [Google Scholar]
- Xie Y, Zhou B, Lin MY, Wang S, Foust KD, Sheng ZH (2015) Endolysosomal deficits augment mitochondria pathology in spinal motor neurons of asymptomatic fALS mice. Neuron 87: 355–370 [DOI] [PMC free article] [PubMed] [Google Scholar]
- Yang S, Xia C, Li S, Du L, Zhang L, Zhou R (2014) Defective mitophagy driven by dysregulation of rheb and KIF5B contributes to mitochondrial reactive oxygen species (ROS)‐induced nod‐like receptor 3 (NLRP3) dependent proinflammatory response and aggravates lipotoxicity. Redox Biol 3: 63–71 [DOI] [PMC free article] [PubMed] [Google Scholar]
- Yap CC, Digilio L, McMahon LP, Garcia ADR, Winckler B (2018) Degradation of dendritic cargos requires Rab7‐dependent transport to somatic lysosomes. J Cell Biol 217: 3141–3159 [DOI] [PMC free article] [PubMed] [Google Scholar]
- Ye X, Cai Q (2014) Snapin‐mediated BACE1 retrograde transport is essential for its degradation in lysosomes and regulation of APP processing in neurons. Cell Rep 6: 24–31 [DOI] [PMC free article] [PubMed] [Google Scholar]
- Ye X, Sun X, Starovoytov V, Cai Q (2015) Parkin‐mediated mitophagy in mutant hAPP neurons and Alzheimer's disease patient brains. Hum Mol Genet 24: 2938–2951 [DOI] [PMC free article] [PubMed] [Google Scholar]
- Ye X, Feng T, Tammineni P, Chang Q, Jeong YY, Margolis DJ, Cai H, Kusnecov A, Cai Q (2017) Regulation of synaptic amyloid‐beta generation through BACE1 retrograde transport in a mouse model of Alzheimer's disease. J Neurosci 37: 2639–2655 [DOI] [PMC free article] [PubMed] [Google Scholar]
- Youle RJ, Narendra DP (2011) Mechanisms of mitophagy. Nat Rev Mol Cell Biol 12: 9–14 [DOI] [PMC free article] [PubMed] [Google Scholar]
- Zhang X, Garbett K, Veeraraghavalu K, Wilburn B, Gilmore R, Mirnics K, Sisodia SS (2012) A role for presenilins in autophagy revisited: normal acidification of lysosomes in cells lacking PSEN1 and PSEN2. J Neurosci 32: 8633–8648 [DOI] [PMC free article] [PubMed] [Google Scholar]
Associated Data
This section collects any data citations, data availability statements, or supplementary materials included in this article.
Supplementary Materials
Expanded View Figures PDF
Review Process File
Data Availability Statement
We have not generated data that require deposition in a public database.