

Summary
Background
Primary prevention of overweight is to be preferred above secondary prevention, which has shown moderate effectiveness.
Objective
To develop and internally validate a dynamic prediction model to identify young children in the general population, applicable at every age between birth and age 6, at high risk of future overweight (age 8).
Methods
Data were used from the Prevention and Incidence of Asthma and Mite Allergy birth cohort, born in 1996 to 1997, in the Netherlands. Participants for whom data on the outcome overweight at age 8 and at least three body mass index SD scores (BMI SDS) at the age of ≥3 months and ≤6 years were available, were included (N = 2265). The outcome of the prediction model is overweight (yes/no) at age 8 (range 7.4‐10.5 years), defined according to the sex‐ and age‐specific BMI cut‐offs of the International Obesity Task Force.
Results
After backward selection in a Generalized Estimating Equations analysis, the prediction model included the baseline predictors maternal BMI, paternal BMI, paternal education, birthweight, sex, ethnicity and indoor smoke exposure; and the longitudinal predictors BMI SDS, and the linear and quadratic terms of the growth curve describing a child's BMI SDS development over time, as well as the longitudinal predictors' interactions with age. The area under the curve of the model after internal validation was 0.845 and Nagelkerke R 2 was 0.351.
Conclusions
A dynamic prediction model for overweight was developed with a good predictive ability using easily obtainable predictor information. External validation is needed to confirm that the model has potential for use in practice.
Keywords: cohort study, dynamic prediction model, future overweight, general population, primordial prevention, young children
Abbreviations
- AUC
area under the curve
- BMI
body mass index
- CBS
Statistics Netherlands
- EPODE
Ensemble Prévenons l'Obésité Des Enfants
- EPV
events per variable
- GEE
Generalized Estimating Equations
- IOTF
International Obesity Task Force
- LMS
lambda mu sigma
- MICE
Multivariate Imputation by Chained Equations
- NPV
negative predictive value
- PCHC
Preventive Child Health Care
- PIAMA
Prevention and Incidence of Asthma and Mite Allergy
- PPV
positive predictive value
- ProCOR
Prediction Of Child CardiOmetabolic Risk
- SDS
SD score
- SES
socioeconomic status
- WHO
World Health Organization
1. BACKGROUND
Overweight and obesity are important global health problems. The World Health Organization estimated that the percentage of children aged 5 to 19 who were overweight had increased from 4% in 1975 to 18% in 2016 worldwide. 1 In the Netherlands, an increase in overweight was also seen: in 2009, 13% to 15% of all Dutch children were overweight, which is a two‐ or threefold increase of the 1980 prevalence rates. 2 Children with overweight or obesity are more likely to have cardiovascular risk factors (such as high blood pressure, dyslipidaemia and hyperinsulinemia) and psychological problems, and are more likely to be overweight as adults.3, 4, 5 In turn, overweight and obesity in adulthood have been associated with mental and physical diseases such as diabetes mellitus type 2, cardiovascular diseases, certain types of cancer and depression, and are estimated to be the cause of 4.8% of all deaths worldwide.6, 7
Due to the tracking of overweight from childhood into adulthood, the adverse effects of overweight and obesity on an individual's (future) health, and the difficulty of changing one's lifestyle, with people often reverting to their old habits causing weight fluctuations resulting in even poorer health, 8 primary prevention is to be preferred. Primary prevention strategies using universal approaches, that is, community‐based interventions, such as the Ensemble Prévenons l'Obésité Des Enfants approach have shown their merits. 9
Primary prevention targeted at individual young children at high risk of future overweight could be a valuable addition to the universal prevention. Ideally, children would be monitored over time and being offered a primary preventive intervention whenever they appear to be at increased risk of future overweight. This would require a dynamic prediction model, enabling the identification of children at increased risk and updating a child's risk estimate each time new information becomes available.
Therefore, we aimed to develop, and internally validate, a dynamic prediction model that can identify young children at high risk of future overweight by using both time‐independent (data available soon after birth) and time‐dependent (growth data till age 6) information. The model will be able to provide risk estimations at every age between birth and age 6, as studies have shown that overweight adolescents had the most rapid gain in body mass index SD score (BMI SDS) between ages 2 and 6, 10 and that BMI SDS changes in this time period are the most predictive for cardiometabolic risk at young adulthood. 11 Also, a literature review by Stocks et al. showed that weight gain at age 0 to 2 was associated with body size at age 5 to 13. 12 The current study is part of the Prediction Of Child CardiOmetabolic Risk (ProCOR) project. 13
2. METHODS
2.1. Study design and population
For this study, we used data from the ongoing Prevention and Incidence of Asthma and Mite Allergy (PIAMA) birth cohort. Pregnant women (N = 4146) were recruited from the general population through 52 antenatal clinics in three different regions (North: provinces Groningen, Friesland, Drenthe; Central: Utrecht, Gelderland; West: Rotterdam) of the Netherlands. Their children (N = 3963) were born in 1996 to 1997. 14 Data were obtained through questionnaires and through growth assessments, recorded during the study's clinical examinations or by the Dutch Preventive Child Health Care (PCHC) organizations.
The questionnaires, completed by the parents during pregnancy, at child age 3 months, and then annually from the age of 1 up to 8 years, provided information on child and family characteristics, lifestyle, environment and health. 14 Additional home visits and clinical examinations were conducted in subgroups at the child's ages of 1, 4 and 8 years. 14 At the age of 18 years, 3047 children were still in the study and asked for permission to retrieve their growth data registered by the PCHC organizations. We received 1537 written informed consents and were able to retrieve PCHC growth data for 1444 of these children.
For the current study, we excluded 361 participants who did not have at least three BMI SDS measurements (minimum needed for estimating a quadratic growth curve, a longitudinal candidate predictor) available at the age of ≥3 months and ≤6 years. Of the remaining 3602 participants, another 1337 were excluded as information on the outcome (overweight at the age of 8) was missing, leaving a population for analysis of N = 2265. See Figure 1 for the flow chart.
FIGURE 1.
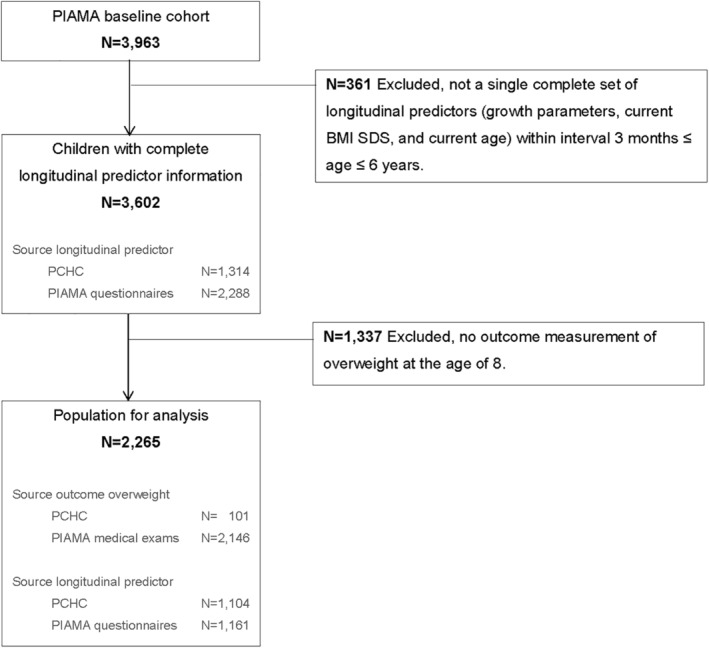
Flow chart of the selection of population for analysis
The aimed setting for the implementation of the prediction model developed in this paper is the Well‐Child Clinics. In the Netherlands, Well‐Child Clinics are part of the Dutch PCHC. The Dutch PCHC is organized nationally, and monitors and promotes optimal growth and development of children. If needed, PCHC professionals refer directly to general practitioners or paediatricians. PCHC is offered free of charge to all children from birth until the age of 19 years and has a high reach (minimum of 90%‐95% of all children 15 ). The care for children is organized along a standard set of consultations: 15 check‐ups between birth and age 4, 3 at school age 4 to 12, and another 2 in adolescence between age 12 and 18. 15 The check‐ups include routine measurements of a child's weight and height according to protocol. The timely identification of children with increased risk of future health problems is an important part of the care provided by PCHC to children. 15 This, combined with the fact that PCHC records the results from visits in children's digital medical files, makes PCHC a very suitable setting for the implementation of a dynamic prediction model.
2.2. Outcome
The outcome is overweight, including obesity, (yes vs no) at the average age of 8 years (range 7.4‐10.5 years), defined according to the sex‐ and age‐ (monthly) specific BMI cut‐offs of the International Obesity Task Force (IOTF) from 2012. 16 We consider the outcome of overweight at age 8 to be relevant, since there is already a considerable correlation between BMI at young adulthood and BMI at age 8. 17
BMI in kg/m2 was calculated from the weight and height of the child measured without shoes and clothes on (except for underwear) by trained research staff of the PIAMA study. Weight was measured to the nearest 0.1 kg on a calibrated scale and height was measured to the nearest 0.1 cm. 18 In case no BMI measurement was available for the 8 year PIAMA medical examination, BMI (measured by a professional according to a similar protocol as for the PIAMA medical examination) was obtained from PCHC reports: selecting the BMI measurement reported by PCHC that fell within the age range of ≥7.4 and ≤10.5 years, where 7.4 is the minimum age as occurred in the PIAMA medical examination data and 10.5 is the maximum age (set by us to limit the possibility that some children had reached puberty). If multiple BMI measurements were reported by PCHC within this age range, the one measured closest to the mean PIAMA medical examination age of 8.2 years was selected.
2.3. Candidate predictors
Based on previous research, availability of data within the study, and availability and feasibility in PCHC, the following baseline candidate predictors were selected: (a) maternal BMI18, 19, 20, 21, 22, 23 in kg/m2, calculated from the mother's weight before pregnancy and height as reported in the 1‐year PIAMA questionnaire; (b) paternal BMI,18, 19, 21, 22, 23 calculated from the father's weight and height as reported in the 8‐year PIAMA questionnaire (first available BMI measurement) as a proxy for paternal BMI before pregnancy, which was not available; (c) maternal and (d) paternal highest attained educational level (as proxy for socioeconomic status [SES]),18, 19, 20, 21, 22 assessed in the 1‐year PIAMA questionnaire and categorized into low (ie, primary school, lower vocational or lower secondary education), intermediate (ie, intermediate vocational education or intermediate/higher secondary education), and high (ie, higher vocational education or university); (e) maternal smoking during pregnancy,18, 19, 20, 21, 22, 23 assessed in the PIAMA pregnancy questionnaire and dichotomized into: the mother still smoked at 4 weeks after the start of the pregnancy vs the mother did not smoke or stopped smoking before being 4 weeks pregnant; (f) maternal weight gain during pregnancy20, 21, 22 in kilograms, obtained from the reported weight gain during pregnancy in the 1‐year PIAMA questionnaire and, if missing, from the 14‐year PIAMA questionnaire (N = 39, 1.1% of valid values of the variable in PIAMA cohort); (g) whether the child was born by means of caesarean section18, 20, 22 (yes vs no), (h) gestational age at birth18, 22 in weeks, calculated from the reported due date and birth date, (i) birthweight18, 19, 20, 22, 23 in kg, (j) and sex of the child18, 23 (girl vs boy), all obtained from the 3‐month PIAMA questionnaire; (k) ethnicity of the child18, 19, 21 was based on country of birth of the mother and the father, as reported in the 2‐year PIAMA questionnaire, according to the definition of Statistics Netherlands and was categorized into three groups: Dutch, Western (Non‐Dutch), and non‐Western; (l) information on breastfeeding,18, 19, 20, 21 obtained from the 3‐month (and if missing the 1‐year) PIAMA questionnaire and dichotomized into ever vs never been breastfed; (m) the number of older siblings,18, 20, 22 assessed in the 3‐month PIAMA questionnaire and dichotomized into presence of older siblings in the household (yes vs no); (n) information on indoor smoking, 18 obtained from the 3‐month PIAMA questionnaire and dichotomized into smoking indoors occurred once a week or more vs never or less than once a week.
Regarding the longitudinal predictors, BMI of the child was calculated from the child's weight and length/height as obtained from the records of the PCHC organizations. Cole's LMS‐method24, 25, 26 was used to convert BMI into BMI SDS. 27 The sex‐ and age‐dependent BMI values from the Fifth Dutch Growth Study 2 were used as reference standard. 27 Age of the child in years at time of the BMI SDS measurement was calculated from the date of birth and the date of the BMI SDS measurement. If there was no date available, the recorded age was used. In case a child had no complete PCHC information on all the longitudinal candidate predictors (BMI SDS, age, and growth curve parameters) at any time point within the age range of ≥3 months and ≤6 years, we used weight and length/height data from the 3‐month, 1‐, 2‐, 3‐, 4‐, 5‐ and 6‐year PIAMA questionnaires and converted them into BMI SDS values (as described above for PCHC data).
The growth curve of a specific time point describes a child's BMI SDS development from the first measurement after birth up till his or her current age. Differences in growth between boys and girls were thus accounted for by the use of age and sex specific BMI SDS values. Growth curve parameters were calculated according to the growth curve parameters method described in our previous study. 28 Based on the results of this study, 28 a quadratic function seemed to be the most appropriate and was chosen to describe the growth curves. In short, the growth curve parameters were derived by performing a linear regression analysis for each child separately in a long structured dataset with the child's BMI SDS measurements, from the first available measurement after birth up to and including the current BMI SDS measurement at time of risk prediction (with the latter not exceeding the age of 6.0 years), as dependent variable and the corresponding age and the quadratic function of age as independent variables. For each BMI SDS measurement between ages 3 months and 6 years, the corresponding growth curve parameters were calculated based on this and all previous BMI SDS measurements. Thus, the growth curve parameters were updated each time a new BMI SDS measurement was performed (and therefore the growth curve parameters can also be considered to be longitudinal predictors). The start of risk prediction was reset at age 3 months due to the need of multiple BMI SDS measurements for growth curve estimation, which could be available for children at this age.
Possible non‐linearity of the relationship between the continuous candidate predictors and the outcome was assessed with univariable models, that is, by examining if the associations were better described by a cubic spline function than a linear function. Based on results of these analyses, the spline variables of maternal BMI and of the child's current BMI SDS measurement were also considered to be candidate predictors (see Supporting Information Text S1 for more information on spline variables). Interactions of the longitudinal candidate predictors current BMI SDS measurement (original and spline variable) and the two growth curve parameters with current age were also considered to be candidate predictors. By including these interactions, the regression coefficients of the BMI SDS and growth curve parameters are allowed to vary for different ages at risk assessment while the regression coefficients for the other predictors remain constant. This way, instead of having multiple models for different ages at risk assessment, only a single prediction model is needed to generate age‐specific risk estimations.
Altogether, 14 (fixed) baseline variables measured after birth (plus three additional dummy variables, due to 3 variables with 3 categories), 4 longitudinal variables on the child's growth over time, 2 spline variables, and 4 interactions were selected as candidate predictors. With a total of 27 candidate predictors, the number of events per variable (EPV) in this study was 11.26 (304/27), which falls within the advised minimum of 10EPV. 29
2.4. Missing Data
The percentage of missing values in the baseline predictors ranged from 0.0% for sex to 11.4% for paternal BMI (Table 1). All missing values were imputed using multiple imputation according to the Multivariate Imputation by Chained Equations procedure 30 in Statistical Package for the Social Sciences (SPSS). We used a wide structured dataset, predictive mean matching, and 50 iterations to generate 22 imputed datasets. The number of imputed datasets was set equal to the percentage of incomplete cases for the baseline candidate predictors.
TABLE 1.
Baseline candidate predictors and information on growth parameters of the children (N = 2265) included in the analyses
| Original dataset (N = 2265) | Number of missing values | |
|---|---|---|
| Baseline candidate predictors | ||
| Maternal BMI (kg/m2) | 22.3 (18.4; 31.4) | 157 (6.9%) |
| Paternal BMI (kg/m2) | 25.0 (20.2; 32.5) | 259 (11.4%) |
| Maternal educational level | 4 (0.2%) | |
| Low | 452 (20.0%) | |
| Intermediate | 954 (42.2%) | |
| High | 855 (37.8%) | |
| Paternal educational | 23 (1.0%) | |
| Low | 517 (23.1%) | |
| Intermediate | 793 (35.4%) | |
| High | 932 (41.6%) | |
| Maternal smoking during pregnancy | 18 (0.8%) | |
| Mother did not smoke or stopped before being 4 weeks pregnant | 1884 (83.8%) | |
| Mother still smoked ≥4 weeks after start of pregnancy | 363 (16.2%) | |
| Maternal weight gain during pregnancy (kg) | 13.6 (5.1) | 81 (3.6%) |
| Caesarean section | 23 (1.0%) | |
| No caesarean section | 2044 (91.2%) | |
| Caesarean section | 198 (8.8%) | |
| Gestational age (weeks) | 40.1 (35.7; 42.1) | 6 (0.3%) |
| Birthweight (kg) | 3.5 (0.5) | 6 (0.3%) |
| Sex | 0 (0.0%) | |
| Boys | 1130 (49.9%) | |
| Girls | 1135 (50.1%) | |
| Ethnicity | 55 (2.4%) | |
| Dutch | 2038 (92.2%) | |
| Western | 102 (4.6%) | |
| Non‐Western | 70 (3.2%) | |
| Breastfeeding | 14 (0.6%) | |
| Never been breastfed | 358 (15.9%) | |
| Ever been breastfed | 1893 (84.1%) | |
| Presence of older siblings in household | 2 (0.1%) | |
| No | 1131 (50.0%) | |
| Yes | 1132 (50.0%) | |
| Indoor smoke exposure | 2 (0.1%) | |
| Never or less than once a week | 1685 (74.5%) | |
| Once a week or more | 578 (25.5%) | |
| Growth measurements (no missing values, due to inclusion criteria) | ||
| At time of prediction (3 months ≤ age ≤ 6 years) | ||
| Number of children | 2265 | |
| Specified per age range | ||
| 3 months ≤ age < 6 months | 1002 | |
| 6 months ≤ age < 1.5 years | 1085 | |
| 1.5 years ≤ age < 2.5 years | 1740 | |
| 2.5 years ≤ age < 3.5 years | 1808 | |
| 3.5 years ≤ age < 4.5 years | 1815 | |
| 4.5 years ≤ age < 5.5 years | 1022 | |
| 5.5 years ≤ age ≤ 6 years | 748 | |
| Source of growth measurements (individuals) | ||
| PCHC organizations | 1104 (48.7%) | |
| PIAMA questionnaires | 1161 (51.3%) | |
| Number of measurements | 15 274 | |
| Specified per age range | ||
| 3 months ≤ age < 6 months | 2351 | |
| 6 months ≤ age < 1.5 years | 4985 | |
| 1.5 years ≤ age < 2.5 years | 2192 | |
| 2.5 years ≤ age < 3.5 years | 2126 | |
| 3.5 years ≤ age < 4.5 years | 1839 | |
| 4.5 years ≤ age < 5.5 years | 1031 | |
| 5.5 years ≤ age ≤ 6 years | 750 | |
| Source of growth measurements (measurements) | ||
| PCHC organizations | 11 789 (77.2%) | |
| PIAMA questionnaires | 3485 (22.8%) | |
| BMI SDS measurement (SDS) | 0.0 (1.0) | |
| Overweight (IOTF) | ||
| No overweight | 6281 (91.1%) | |
| Child was overweight | 612 (8.9%) | |
| Missing values, due to age <2 years a | 8381 (54.9%) | |
| Growth curve linear term (SDS/y) | 0.4 (8.9) | |
| Growth curve quadratic term (SDS/y2) | −0.9 (17.0) | |
| At time of outcome (7.39 ≤ age ≤ 10.5 years) | ||
| Number of children | 2265 | |
| Number of measurements | 2265 | |
| Age (years) | 8.1 (7.6; 9.7) | |
| BMI SDS measurement (SDS) | −0.1 (1.0) | |
| BMI (kg/m2) | 16.1 (13.5; 21.7) | |
| Overweight | ||
| Not overweight | 1961 (86.6%) | |
| Overweight | 304 (13.4%) | |
| Source of BMI‐outcome measurement | ||
| PIAMA medical examination | 2164 (95.5%) | |
| PCHC organizations | 101 (4.5%) |
Note: The descriptive values are expressed as the mean (SD), median (95% range) or number N (valid %).
Abbreviations: BMI, body mass index; IOTF, International Obesity Task Force; PCHC, Preventive Child Health Care; PIAMA, Prevention and Incidence of Asthma and Mite Allergy; SDS, SD score.
IOTF overweight cut‐offs are only defined for age 2 onwards. Missing value percentages of overweight were calculated as a percentage of the number of measurements.
2.5. Statistical analysis
A full model was fitted by performing a Generalized Estimating Equations analysis with an independent correlation structure in a long structured dataset. This procedure is also known as a ‘pooled logistic regression model’ and provides the same regression coefficients as a logistic regression analysis, but with increased standard errors. The latter is necessary to take into account that children contributed to the model multiple times. The full model included all 27 candidate predictors (baseline and longitudinal candidate predictors, spline variables and interactions) as independent variables and overweight at age 8 as outcome.
To obtain our final prediction model, we performed a manual backward selection on the full model using a P‐value <.157 (Akaike information criterion) 31 as criterion for variable selection. The backward selection procedure is the preferred automated predictor selection procedure 31 and helped us to get a model with the best combination of predictive quality and number of variables. The Akaike information criterion, that is, a less strict P‐value of .157, ‘accounts for model fit while penalizing for the number of parameters being estimated’. 31 Categorical variables were assessed for exclusion based on the dummy variable with the lowest pooled P‐value. Similarly, interactions with multiple variables representing the same subject (ie, variable and matching spline variable; or variable and quadratic variable) were all simultaneously included or excluded from the model and were assessed for exclusion based on the interaction term with the lowest pooled P‐value.
The prediction model was internally validated in the imputed datasets with 250 bootstrap samples to adjust for overfitting and optimism as recommended by the Transparent Reporting of a multivariable model for Individual Prognosis or Diagnosis (TRIPOD) statement. 31 See Supporting Information Text S1 ‘Elaboration on Methods; Internal Validation’ for more detailed information on this procedure. After internal validation, the model was updated: the regression coefficients were multiplied by the shrinkage factor and subsequently the intercept of the prediction model was also adjusted for optimism.
Performance of the prediction model in terms of explained variance and discrimination before and after validation was reported as the pooled (median 32 ) Nagelkerke R 2‐ and area under the curve (AUC)‐value from the 22 imputed datasets. Additional to the AUC of the model for all ages at time of risk prediction combined, the AUC was also assessed for specific age ranges separately. The overall and age‐specific AUC's were calculated in the 22 imputed datasets using the linear predictor of the updated prediction model, the pooled (median 32 ) AUC estimates were reported. Moreover, the overall and age‐specific AUC's were also assessed separately for children with and without (current) overweight at time of risk prediction.
For each child (and age) the mean 32 of the updated linear predictors of the 22 imputed datasets was calculated and transformed into the (pooled) predicted risk, which was then used to determine the model's sensitivity, specificity, positive predictive value (PPV), negative predictive value (NPV), and number and percentage of predictions by the model in which children were classified as being at risk according to different cut‐off values for predicted risk.
See Supporting Information Text S1 ‘Elaboration on Methods’ for more detailed information on methods (baseline candidate predictors: ethnicity of the child; spline variables; imputation model; statistical analysis; internal validation). All analyses were performed using the Statistical Package for the Social Sciences version 25.0 for Windows (SPSS Inc., Chicago, IL) and R for Windows version 3.4.1 (The R Foundation).
3. RESULTS
3.1. Population characteristics
Table 1 shows the descriptive values of the baseline predictors for the included children. Of the 2265 children, 49.9% were boys; and the majority was of Dutch ethnicity (92.2%), had a mother with an intermediate educational level (42.2%), and a father with a high educational level (41.6%).
Table 1 also shows the descriptive values for the growth measurements of the children at the age of risk prediction and at the age of outcome assessment. For the 2265 participants, a total of 15 274 growth measurements were available for each of the longitudinal predictors (BMI SDS, age, and the growth curve parameters). The age range of 6 months to 1.5 years contained most of these measurements 4985 (32.6%). The median age at outcome assessment was 8.1 years (95% range of 7.6‐9.7), at which a total of 304 (13.4%) participants was classified as being overweight. See Table S1 for the descriptive values of the growth measurements specified for separate age ranges at time of risk prediction.
3.2. The overweight prediction model
The prediction model obtained after backward selection included the following baseline predictors: maternal BMI (including spline), paternal BMI, paternal educational level, birthweight, sex, ethnicity and indoor smoke exposure. The following longitudinal predictors were included in the prediction model: current BMI SDS (including spline), the linear and quadratic parameters of the growth curve, and the interactions of BMI SDS (including spline) and the linear and quadratic growth curve parameters with age. Table 2 shows the regression coefficients, 95% confidence intervals, and P‐values of the predictors before internal validation; and the adjusted regression coefficients of the prediction model after internal validation (the shrinkage factor was 0.99).
TABLE 2.
Prediction model to predict overweight at age 8 in children aged 3 months to 6 years
| Before internal validation | After internal validation | ||||
|---|---|---|---|---|---|
| Coefficient | 95% CI | P‐value | Coefficient | ||
| Intercept | −18.001 | −23.210 | −12.793 | .000 | −17.867 |
| Baseline predictors | |||||
| Maternal BMI (kg/m2) | 0.411 | 0.196 | 0.625 | .000 | 0.407 |
| Spline variable maternal BMI | −0.267 | −0.502 | −0.033 | .026 | −0.265 |
| Paternal BMI (kg/m2) | 0.184 | 0.132 | 0.236 | .000 | 0.183 |
| Paternal educational level | |||||
| Low | Reference | Reference | Reference | Reference | Reference |
| Intermediate | −0.293 | −0.698 | 0.113 | .157 | −0.290 |
| High | −0.447 | −0.875 | −0.018 | .041 | −0.443 |
| Birthweight (kg) | 0.413 | 0.084 | 0.742 | .014 | 0.410 |
| Sex | |||||
| Boy | Reference | Reference | Reference | Reference | Reference |
| Girl | 0.241 | −0.088 | 0.571 | .151 | 0.239 |
| Ethnicity | |||||
| Dutch | Reference | Reference | Reference | Reference | Reference |
| Western | 0.454 | −0.362 | 1.270 | .276 | 0.450 |
| Non‐Western | 0.804 | −0.106 | 1.713 | .083 | 0.797 |
| Indoor smoke exposure | |||||
| Occurred never or less than once a week | Reference | Reference | Reference | Reference | Reference |
| Occurred once a week or more | 0.495 | 0.133 | 0.858 | .007 | 0.491 |
| Longitudinal predictors | |||||
| Age (years) | −0.044 | −0.148 | 0.060 | .407 | −0.044 |
| BMI SDS measurement (SDS) | 0.173 | −0.315 | 0.662 | .487 | 0.172 |
| Spline variable BMI SDS measurement (SDS) | 0.330 | −0.110 | 0.769 | .141 | 0.327 |
| Growth curve (linear) (SDS/y) | −0.096 | −0.144 | −0.049 | .000 | −0.096 |
| Growth curve (quadratic) (SDS/y2) | −0.010 | −0.030 | 0.010 | .319 | −0.010 |
| Interactions of longitudinal predictors with age | |||||
| Age (years) | |||||
| *BMI SDS measurement (SDS) | 0.132 | −0.021 | 0.286 | .092 | 0.131 |
| *Spline variable BMI SDS measurement (SDS) | 0.052 | −0.092 | 0.196 | .481 | 0.051 |
| *Growth curve (linear) (SDS/y) | 0.009 | −0.031 | 0.048 | .671 | 0.009 |
| *Growth curve (quadratic) (SDS/y2) | −0.115 | −0.210 | −0.019 | .018 | −0.114 |
Note: Values are expressed as the pooled regression coefficient, 95% confidence interval (95% CI) and P‐values of the intercept and predictors in the prediction model developed in a multiple (N = 22) imputed dataset. Analyses were based on 15 274 measurements of 2265 children, of whom 304 had overweight at age 8.
Abbreviations: BMI, body mass index; SDS, SD score.
Indicates the multiplication of the particular variable by Age (years), resulting in the interaction variable.
The model's predicted probability of being overweight at the age of 8 can be calculated as: 1/(1 + e− LP), where the linear predictor (LP) is calculated as: −17.867 + 0.407 * maternal BMI − 0.265 * spline variable maternal BMI + 0.183 * paternal BMI − 0.290 * intermediate paternal educational level − 0.443 * high paternal educational level + 0.410 * birthweight + 0.239 * girl sex + 0.450 * Western ethnicity + 0.797 * non‐Western ethnicity + 0.491 * indoor smoke exposure occurred once a week or more − 0.044 * age + 0.172 * BMI SDS + 0.327 * spline BMI SDS − 0.096 * growth curve linear term − 0.010 * growth curve quadratic term + 0.131 * interaction age and BMI SDS + 0.051 * interaction age and spline BMI SDS + 0.009 * interaction age and growth curve linear term − 0.114 * interaction age and growth curve quadratic term.
Table 3 illustrates how a prediction tool based on this model would work. Four example cases are shown with the necessary input for risk estimation and the corresponding output of such a tool. The growth curves for these example cases are shown in Figure 2. The first child has a 6.3% predicted risk of overweight at the age of 8. In contrast, the estimated risk for the third child was 93.3% due to less favourable predictor characteristics.
TABLE 3.
Example cases of risk prediction, as calculated with the developed prediction model
| Input | Case 1 | Case 2 | Case 3 | Case 4 |
|---|---|---|---|---|
| Baseline predictors | ||||
| Maternal BMI (kg/m2) | 23 | 20 | 23 | 31 |
| Paternal BMI (kg/m2) | 21 | 23 | 25 | 38 |
| Paternal educational level | High | Intermediate | Intermediate | Low |
| Birthweight (kg) | 3.6 | 3.9 | 4.0 | 3.6 |
| Sex | Boy | Boy | Girl | Girl |
| Ethnicity | Dutch | Dutch | Dutch | Dutch |
| Indoor smoke exposure | Occurred never or less than once a week | Occurred never or less than once a week | Occurred never or less than once a week | Occurred once a week or more |
| Longitudinal predictors | ||||
| Age (years) | 3.9 | 2.0 | 2.0 | 4.0 |
| BMI SDS measurement (SDS) | 0.3 | 1.6 | 2.5 | 0.2 |
| Growth curve (linear) (SDS/y) | −0.2 | 0.0 | 1.3 | 0.3 |
| Growth curve (quadratic) (SDS/y2) | 0.1 | 0.1 | −0.3 | 0.0 |
| Output | ||||
| Predicted risk | 2.9% | 7.2% | 52.1% | 85.8% |
Abbreviations: BMI, body mass index; SDS, SD score.
An excel tool to predict the risk of overweight for an individual according to this study's prediction model is available upon reasonable request to the corresponding author.
FIGURE 2.
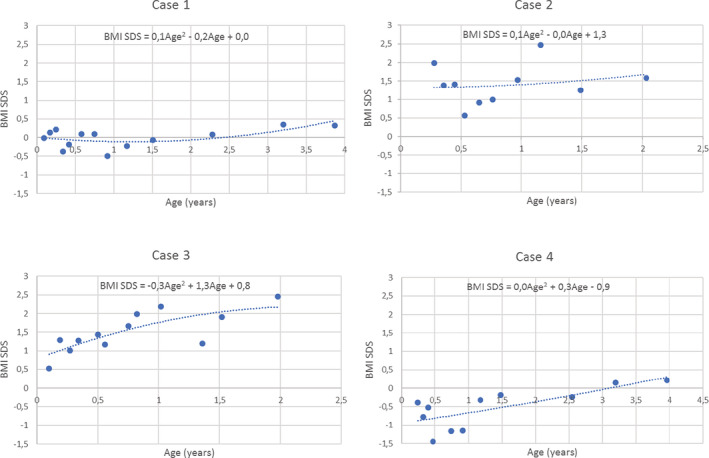
Growth curves, showing the development in body mass index SD score over time for four example cases
3.3. Performance of the prediction model
Discriminative ability and explained variance of the prediction model are shown in Table 4. Before internal validation the overall AUC was 0.847. For separate age ranges the AUC ranged from 0.822 for age range 1.5 to 2.5 years to 0.942 for age range 5.5 to 6 years. After internal validation, the overall AUC was 0.845. The explained variance, Nagelkerke R 2, was 0.355 before and 0.351 after internal validation.
TABLE 4.
Discriminative ability and explained variance of the prediction model
| Discriminative ability (age specific) | Whole study population | Currently no overweight | Currently overweight |
|---|---|---|---|
| Age at time of prediction | AUC | AUC | AUC |
| 3 months ≤ age < 6 months | 0.850 | – a | – a |
| 6 months ≤ age < 1.5 years | 0.835 | – a | – a |
| 1.5 years ≤ age < 2.5 years | 0.822 | 0.792 | 0.878 |
| 2.5 years ≤ age < 3.5 years | 0.841 | 0.805 | 0.772 |
| 3.5 years ≤ age < 4.5 years | 0.862 | 0.816 | 0.777 |
| 4.5 years ≤ age < 5.5 years | 0.855 | 0.791 | 0.783 |
| 5.5 years ≤ age ≤ 6 years | 0.942 | 0.910 | 0.770 |
| Overall (3 months ≤ age ≤ 6 years) | 0.847 | 0.814 | 0.802 |
| Results internal validation (overall) | Whole study population | Whole study population | |
| AUC | R 2 | ||
| Validity before validation | 0.847 | 0.355 | |
| Validity after validation | 0.845 | 0.351 |
Note: Values are expressed as the pooled (median) area under the curve (AUC) and Nagelkerke R 2 of the prediction model in the multiple (N = 22) imputed dataset. The number of measurements that the overall results are based on: whole study population 15 274 (2265 children); currently no overweight 6281 (2165 children); currently overweight 612 (354 children).The range of measurements that the age range specific results are based on: whole study population 750 to 4985 (748‐1815 children); currently no overweight population 668 to 1960 (667‐1673 children); currently overweight 82 to 166 (82‐155 children).
No data as International Obesity Task Force overweight cut‐offs are only defined for age 2 onwards.
The model's performance in terms of numbers classified as at risk, sensitivity, specificity, PPV and NPV for different cut‐offs of the predicted risk is shown in Table S2. For example: if a 15% cut‐off for predicted risk is chosen to distinguish between children ‘at risk’ and ‘not at risk’ of being overweight at the age of 8, one would classify 25.2% (N = 3842) of all children as being ‘at risk’; of these ‘at risk’ children 32.0% would have overweight at time of prediction. The sensitivity corresponding to the 15% cut‐off indicates that of all children who will be overweight at the age of 8, 71.9% will be correctly classified by the model as ‘at risk’. The specificity shows that of all children who will not be overweight, 81.5% will be correctly classified by the model as ‘not at risk’. The PPV indicates that 35.8% of all children classified by the model as ‘at risk’ will indeed be overweight at age 8, and the NPV indicates that 95.3% of all children classified as ‘not at risk’ will indeed not be overweight at age 8. Based on the 15% cut‐off, example cases 3 and 4 from Table 3 would be identified as being ‘at risk’. Different cut‐offs for children with and without current overweight might also be considered, see Table S3 for the performance of the model stratified for these two groups. The pooled predicted risk was also used to make a calibration plot of the prediction model after internal validation, shown in Supporting Information Figure S1.
4. DISCUSSION
4.1. Principal findings
In this paper, we described the development and internal validation of a dynamic prediction model that can identify young children of the general population (at every age from birth to 6 years) at high risk of future overweight to enable targeted primary prevention of overweight in children. The following predictors were included in the final model: maternal BMI, paternal BMI, paternal educational level, birthweight, sex, ethnicity, indoor smoke exposure, current BMI SDS, the linear and quadratic parameters of the growth curve as well as the interactions of current BMI SDS and the linear and quadratic growth curve parameters with age. The model had a good performance with an AUC of 0.845 after internal validation, similar to the AUC of 0.847 before validation. The AUC for age range 5.5 to 6 years was highest, which is to be expected since there is only a small period of time between time of risk prediction and outcome at age 8. However, the performance of the model for the younger age ranges was already good with AUC values ranging from 0.822 to 0.862.
4.2. Strengths and limitations
The most important strength of the present study is that a dynamic prediction model was developed. The dynamic model provides risk estimations which can be updated each time new growth information becomes available in practice. This way the risk can be monitored over time and a reduction or increase in the risk estimates between PCHC visits can be taken into account by the PCHC professionals in advising the parents.
Another strength of our study was that the data collection was not influenced by knowledge of the aims of this study. The PIAMA and PCHC data were gathered prospectively without the aim to build a prediction model. Moreover, in the PIAMA study, the outcome data were measured by fieldworkers who had no access to the predictor data. Also, limitations should be mentioned. The most important limitation is that the non‐Western population was underrepresented in our study. However, ethnicity remained in the final model, thus likely contributing to the generalizability of this model for children of non‐Western descent. Furthermore, 1698 PIAMA participants were excluded due to missing values for the outcome or predictor growth measurements. Differences in baseline predictors between the in‐ and excluded population, seem to mainly reflect lower parental educational level in the excluded population, where 28.6% and 30.0% of the participants had a low maternal and paternal educational level compared to 20.0% and 23.1% in the included group (see Supporting Information Table S4). However, we do not expect that the associations between the predictors and outcome would have been very different if we could have included all participants and therefore the generalizability of the model is still expected to be good (See Supporting Information Text S1 ‘Sensitivity analysis’).
Paternal BMI at age 8 was used as a proxy for paternal BMI at birth. However, paternal BMI at age 8 is probably a better indicator of the lifestyle behaviour a child will have been exposed to over the first 8 years of his/her life within the household compared to paternal BMI at child birth. Therefore, it could be that the predictor paternal BMI came out stronger than the actual baseline measurement would have. However, a previous study by Steur et al., using the PIAMA‐cohort for the development of a prediction model for overweight at age 8 using only baseline predictors around birth, also used paternal BMI at age 8 as a proxy for paternal BMI at birth. 18 They concluded from a sensitivity analysis with simulations for paternal BMI at birth that the model would hardly have differed if paternal BMI at birth was used instead of paternal BMI at age 8. 18
For the outcome ‘overweight at age 8’, the medical examination data was complemented with PCHC data when missing. We do not expect a systematic difference in BMI between the two sources as measurements from both sources were taken by professionals according to similar protocols. For predictor growth information, PCHC data was used to develop the model and complemented with PIAMA questionnaire data (22.8%) if missing. We expect the differences between BMI (SDS) from PCHC and PIAMA questionnaires to be similar to the observed differences between the PIAMA medical examination and questionnaire data, that is, a tendency to underreport BMI by parents of children with a high BMI and to over report BMI by parents of children with a low BMI. 33 The mean difference in measured and reported BMI was 0.7 kg/m2 (SD 1.1) for children in the fourth measured BMI quartile; and 0.3 kg/m2 (SD 0.8), −0.1 kg/m2 (SD 0.8) and −0.4 kg/m2 (SD 0.9) for children in the third, second and first measured BMI quartile. 33 Therefore, it cannot be excluded that overall the prediction model might overestimate the predicted risk of children slightly.
Finally, we cannot exclude the possibility that some children might have reached puberty at timing of outcome, as there is no data available on this. We set an age limit for the outcome at 10.5 years to prevent that children had reached puberty as much as possible, while also being able to include as many participants as possible by not setting the maximum age too low. According to the Dutch Center for Child and Youth Health Care (NCJ), puberty in girls starts on an average age of 10.5 years (range 9‐12 years) and in boys on an average age of 11 years (range 9‐13 years). 34 In our study 91% of the participants were younger than age 9 at the time of outcome measurement, implying that only a very small number of children in our study might have reached puberty. It is very unlikely that the data of this small number of children would have impacted our results significantly.
4.3. Findings in relation to other studies
A systematic review by Ziauddeen et al. 23 on prediction models for childhood overweight and obesity identified eight prediction models. Seven predictors were included in two or more models: gender, weight gain between 0 and 1 year categorized and continuous, birthweight, maternal BMI, maternal smoking during pregnancy and paternal BMI. 23 Congruent with this review our model also includes the predictors sex, birthweight, maternal BMI, and paternal BMI. Similar information as in the predictor weight gain 0 to 1 year, that is, growth information, is included in our model through the inclusion of longitudinal growth curve predictors. Although the candidate predictor maternal smoking during pregnancy did not remain in our final prediction model, the model does include information on indoor smoke exposure in the child's home. None of the studies included in the review considered any other smoking variable than maternal (pre‐)pregnancy smoking for model development, except for the study by Steur et al. which is also based on PIAMA data and whose model included the predictor indoor smoke exposure. Additional predictors that are included in our model were current weight status (BMI SDS), ethnicity of the child and paternal educational level.
The review by Ziauddeen reported that the AUC's of the included prediction models ranged from 0.64 to 0.91 for the derivation AUC's and from 0.64 to 0.93 for the validation AUCs. 23 Compared to these results, the performance of the prediction model in the present study seems to be quite good: the only models with higher AUC's were in the study by Santorelli et al, who predicted obesity at age 1 (derivation AUC 0.91 and validation AUC 0.89) 23 and in the study by Redsell et al, who predicted obesity at age 5 (recalibrated model, validation AUC 0.93). 23
None of the prediction models included in the review were developed to make repeated risk assessments at a wide age range, whereas our model was developed to do so for age 0 to 6 years. Most models included in the review were developed to make a risk assessment at a certain age. If a model or tool could assess risk at a range of ages, the range was usually small, for example, 60 to 64 months (Pei et al. 35 ), 6 to 12 months (Weng et al. 36 ) or 4.5 to 13.5 months (Santorelli et al. 37 ), with the latter being a tool using 3 separate equations (for subintervals 4.5‐7.5, 7.5‐10.5, and 10.5‐13.5) to cover the whole age range.
4.4. Meaning of the study
Internal validation showed that our developed prediction model had a good performance with an AUC of 0.845. External validation and implementation research should further confirm the usefulness of the model in practice. The prediction model enables PCHC professionals to distinguish between children at low and at high risk of future overweight. This gives them the possibility to spend more time on personalized advice for the high‐risk children and skip some of the ‘one size fits all’ overweight prevention advice when talking to parents of low risk children. PCHC professionals can decide at which predicted risk estimation(s) they want to take action. To determine a cut‐off for a certain action, for example, offering an extra consult or intervention, one needs to find a cut‐off with the optimal balance in its consequences. First, it is important to be aware that the number of children/families that will have to be offered an intervention, based on the cut‐off, should be feasible with respect to finances, manpower, time availability, etc. Secondly, one should consider the number of children identified as ‘at risk’, who will not actually be overweight in the future. These children will unnecessarily be offered an advice, extra consultation or intervention. Although this is unlikely to be harmful, it will increase costs and pose a burden on these families. At last, there is the number of children being misclassified as ‘not at risk’ who will be overweight in the future to consider. These are the children who should have been offered an intervention, but were not. These missed children may require health care (and bring related costs) later in life through the development of overweight and subsequent morbidity, such as cardiometabolic diseases. Part of these problems may be solved by repeating risk assessments in the children with a slightly increased risk, and only offer interventions if the risk is increasing over time. Finally, we should be aware that training in risk communication with parents and children is essential for professionals who use the results of the model, where the risk of stigmatization should be taken into account.
4.5. Unanswered questions and future research
As previously described, children from a non‐Western ethnicity were underrepresented in this cohort and it might therefore be interesting for future research to determine the model's validity in non‐Western populations and to update it accordingly if necessary. Future research might also look into the added value of including maternal educational level (or other SES proxy) in addition to or instead of paternal educational level for younger populations, which probably include more highly educated and working mothers. Therefore, the education of mothers is likely to be a better proxy for family SES now compared to educational level of women in 1996 to 1997. External validation studies by independent researchers assessing the performance of the updated model in other cohorts would provide more insight into its clinical relevance and an implementation study of the model (with decisions on cut‐off values and risk communication) could be carried out in order to assess its added value for preventive public health professionals and any aspects for improvement of the (usability) of the model. Based on external validation and implementation evaluation, the tool could be optimized further. In addition, multiple versions of the model with fewer variables could be developed or models allowing for handling of missing values in practice in individual cases, to enable risk prediction in cases with incomplete predictor data. Finally, studies researching the effectiveness of the use of the model in PCHC on the prevention of overweight would be desired, which would also require (the use of) effective interventions for overweight prevention in children.
In conclusion, a dynamic prediction model for overweight to be used in childhood was developed using easily obtainable predictor information. The predictive quality of the model is good with an AUC of 0.845 after internal validation. External validation is needed to confirm that the model has potential for use in practice.
CONFLICT OF INTEREST
No conflict of interest was declared.
AUTHOR CONTRIBUTIONS
M.L.A.d.K. initiated the study and is the Principal Investigator; M.L.A.d.K. and A.H.W. conceived the study design. M.L.A.d.K. obtained funds for the ProCOR project. M.W. performed the analyses, supervised by J.W.R.T. and M.W.H. M.W. drafted the first version of the manuscript, with help from A.H.W., M.H., J.W.R.T., H.R., M.W.H. and M.L.A.d.K. A.H.W., U.G. and G.H.K. are principal investigators of the PIAMA birth cohort. The final manuscript was critically revised and approved by all authors.
Supporting information
Data S1: Supporting Information.
ACKNOWLEDGEMENTS
This study is part of a larger project, ProCOR, aiming to develop prediction and decision tools for childhood overweight and cardiometabolic risk factors, funded by The Netherlands Organization for Health Research and Development (ZonMw grant no. 200500006). The funding body had no role in designing the study nor in the collection, analysis, or interpretation of data or in writing the manuscript. The PIAMA study has been funded by the Netherlands Organization for Health Research and Development; the Netherlands Organization for Scientific Research; the Netherlands Asthma Fund; the Netherlands Ministry of Spatial Planning, Housing and the Environment; and the Netherlands Ministry of Health, Welfare and Sport.
The authors gratefully acknowledge the contribution of the children and parents participating in the PIAMA study. We thank Ada Wolse, Marjan Tewis and Marieke Oldenwening for their contribution to the data collection and data management. Also, we are very grateful to the following PCHC organizations for their contribution to the PCHC growth data retrieval: GGD Drenthe, GGD Flevoland, GGD Fryslân, GGD Gelderland Zuid, GGD Noord‐ en Oost‐Gelderland, Veiligheids‐ en Gezondheidsregio Gelderland‐Midden, GGD Groningen, GGD Limburg Noord, GGD Brabant‐Zuidoost, GGD Hart voor Brabant, GGD West‐Brabant, GGD Amsterdam, GGD Gooi en Vechtstreek (Jeugd en Gezin Gooi en Vechtstreek), GGD Hollands Noorden, GGD Kennemerland, GGD IJsselland, GGD Twente, GGD Regio Utrecht, Gemeente Utrecht, GGD Zeeland, Dienst Gezondheid en Jeugd Zuid‐Holland Zuid, Rivas Zorggroep, GGD Haaglanden, JGZ Zuid‐Holland West, GGD Hollands Midden, CJG Rijnmond.
The ProCOR project had set up a stakeholders group with participation of Preventive Child Healthcare physicians (AJN) and nurses (V&VN), paediatricians, general practitioners, dieticians, epidemiologists, programmers, employees of the Netherlands Center of Child Health (NCJ), parents, managers and policy makers. We thank the stakeholders group for their active role in several phases of the ProCOR project (advising on candidate predictors [criteria]; deciding on critical success factors for the models implementation in PCHC and subsequent medical decision‐making) and the interpretation of the intermediate results.
Welten M, Wijga AH, Hamoen M, et al. Dynamic prediction model to identify young children at high risk of future overweight: Development and internal validation in a cohort study. Pediatric Obesity. 2020;15:e12647 10.1111/ijpo.12647
Funding information Netherlands Ministry of Health, Welfare and Sport; Netherlands Ministry of Spatial Planning, Housing and the Environment; Netherlands Asthma Fund; Netherlands Organization for Scientific Research; The Netherlands Organization for Health Research and Development, Grant/Award Number: 200500006
REFERENCES
- 1. World Health Organization . Obesity and Overweight. World Health Organization (WHO). http://www.who.int/en/news-room/fact-sheets/detail/obesity-and-overweight. Accessed May 28, 2018.
- 2. Schönbeck Y, Talma H, van Dommelen P, et al. Increase in prevalence of overweight in Dutch children and adolescents: a comparison of nationwide growth studies in 1980, 1997 and 2009. PLoS One. 2011;6(11):e27608. [DOI] [PMC free article] [PubMed] [Google Scholar]
- 3. Singh AS, Mulder C, Twisk JW, van Mechelen W, Chinapaw MJ. Tracking of childhood overweight into adulthood: a systematic review of the literature. Obes Rev. 2008;9(5):474‐488. [DOI] [PubMed] [Google Scholar]
- 4. Reilly JJ, Methven E, McDowell ZC, et al. Health consequences of obesity. Arch Dis Child. 2003;88(9):748‐752. [DOI] [PMC free article] [PubMed] [Google Scholar]
- 5. Thompson DR, Obarzanek E, Franko DL, et al. Childhood overweight and cardiovascular disease risk factors: the National Heart, Lung, and Blood Institute growth and health study. J Pediatr. 2007;150(1):18‐25. [DOI] [PMC free article] [PubMed] [Google Scholar]
- 6. World Health Organization . Global Health Risks: Mortality and Burden of Disease Attributable to Selected Major Risks. Geneva, Switzerland: World Health Organization; 2009. [Google Scholar]
- 7. Williams EP, Mesidor M, Winters K, Dubbert PM, Wyatt SB. Overweight and obesity: prevalence, consequences, and causes of a growing public health problem. Curr Obes Rep. 2015;4(3):363‐370. [DOI] [PubMed] [Google Scholar]
- 8. Montani JP, Viecelli AK, Prevot A, Dulloo AG. Weight cycling during growth and beyond as a risk factor for later cardiovascular diseases: the 'repeated overshoot’ theory. Int J Obes. 2006;30(Suppl 4):S58‐S66. [DOI] [PubMed] [Google Scholar]
- 9. Borys JM, Le Bodo Y, Jebb SA, et al. EPODE approach for childhood obesity prevention: methods, progress and international development. Obes Rev. 2012;13(4):299‐315. [DOI] [PMC free article] [PubMed] [Google Scholar]
- 10. Geserick M, Vogel M, Gausche R, et al. Acceleration of BMI in early childhood and risk of sustained obesity. N Engl J Med. 2018;379(14):1303‐1312. [DOI] [PubMed] [Google Scholar]
- 11. De Kroon ML, Renders CM, Van Wouwe JP, Van Buuren S, Hirasing RA. The Terneuzen birth cohort: BMI change between 2 and 6 years is most predictive of adult cardiometabolic risk. PLoS One. 2010;5(11):e13966. [DOI] [PMC free article] [PubMed] [Google Scholar]
- 12. Stocks T, Renders CM, Bulk‐Bunschoten AM, Hirasing RA, van Buuren S, Seidell JC. Body size and growth in 0‐ to 4‐year‐old children and the relation to body size in primary school age. Obes Rev. 2011;12(8):637‐652. [DOI] [PubMed] [Google Scholar]
- 13. de Kroon ML, Wijga A, Vergouwe Y, et al. Prediction of preadolescent overweight and poor cardiometabolic outcome in children up to 6 years of age: research protocol. JMIR Res Protoc. 2016;5(2):e85. [DOI] [PMC free article] [PubMed] [Google Scholar]
- 14. Wijga AH, Kerkhof M, Gehring U, et al. Cohort profile: the Prevention and Incidence of Asthma and Mite Allergy (PIAMA) birth cohort. Int J Epidemiol. 2014;43(2):527‐535. [DOI] [PubMed] [Google Scholar]
- 15. NCJ – Nederlands Centrum Jeugdgezondheid (the Dutch Center for Youth Health Care) . Landelijk Professioneel Kader. Uitvoering Basispakket Jeugdgezondheidszorg (JGZ). Utrecht, Netherlands: NCJ – Nederlands Centrum Jeugdgezondheid; 2018. [Google Scholar]
- 16. Cole TJ, Lobstein T. Extended international (IOTF) body mass index cut‐offs for thinness, overweight and obesity. Pediatr Obes. 2012;7(4):284‐294. [DOI] [PubMed] [Google Scholar]
- 17. De Kroon ML, Renders CM, Van Wouwe JP, Van Buuren S, Hirasing RA. The Terneuzen birth cohort: BMI changes between 2 and 6 years correlate strongest with adult overweight. PLoS One. 2010;5(2):e9155. [DOI] [PMC free article] [PubMed] [Google Scholar]
- 18. Steur M, Smit HA, Schipper CM, et al. Predicting the risk of newborn children to become overweight later in childhood: the PIAMA birth cohort study. Int J Pediatr Obes. 2011;6(2–2):e170‐e178. [DOI] [PubMed] [Google Scholar]
- 19. Monasta L, Batty GD, Cattaneo A, et al. Early‐life determinants of overweight and obesity: a review of systematic reviews. Obes Rev. 2010;11(10):695‐708. [DOI] [PubMed] [Google Scholar]
- 20. Weng SF, Redsell SA, Swift JA, Yang M, Glazebrook CP. Systematic review and meta‐analyses of risk factors for childhood overweight identifiable during infancy. Arch Dis Child. 2012;97(12):1019‐1026. [DOI] [PMC free article] [PubMed] [Google Scholar]
- 21. Levine RS, Dahly DL, Rudolf MC. Identifying infants at risk of becoming obese: can we and should we? Public Health. 2012;126(2):123‐128. [DOI] [PubMed] [Google Scholar]
- 22. Baidal JAW, Locks LM, Cheng ER, Blake‐Lamb TL, Perkins ME, Taveras EM. Risk factors for childhood obesity in the first 1,000 days: a systematic review. Am J Prev Med. 2016;50(6):761‐779. [DOI] [PubMed] [Google Scholar]
- 23. Ziauddeen N, Roderick PJ, Macklon NS, Alwan NA. Predicting childhood overweight and obesity using maternal and early life risk factors: a systematic review. Obes Rev. 2018;19(3):302‐312. [DOI] [PMC free article] [PubMed] [Google Scholar]
- 24. Cole TJ, Bellizzi MC, Flegal KM, Dietz WH. Establishing a standard definition for child overweight and obesity worldwide: international survey. BMJ. 2000;320(7244):1240‐1243. [DOI] [PMC free article] [PubMed] [Google Scholar]
- 25. Cole TJ, Freeman JV, Preece MA. Body mass index reference curves for the UK, 1990. Arch Dis Child. 1995;73(1):25‐29. [DOI] [PMC free article] [PubMed] [Google Scholar]
- 26. Flegal KM, Cole TJ. Construction of LMS parameters for the Centers for Disease Control and Prevention 2000. Growth charts. Natl Health Stat Rep 2013(63):1–3. [PubMed] [Google Scholar]
- 27. van Dommelen P, van Buuren S. Documentatie Berekening Standaarddeviatiescore. Leiden, Netherlands: TNO; 2011. [Google Scholar]
- 28. Welten M, de Kroon ML, Renders CM, et al. Repeatedly measured predictors: a comparison of methods for prediction modeling. Diagn Progn Res. 2018;2(1):5. [DOI] [PMC free article] [PubMed] [Google Scholar]
- 29. Steyerberg EW. Clinical Prediction Models: A Practical Approach to Development, Validation, and Updating. Basel, Switzerland: Springer International Publishing; 2019. [Google Scholar]
- 30. Azur MJ, Stuart EA, Frangakis C, Leaf PJ. Multiple imputation by chained equations: what is it and how does it work? Int J Methods Psychiatr Res. 2011;20(1):40‐49. [DOI] [PMC free article] [PubMed] [Google Scholar]
- 31. Moons KG, Altman DG, Reitsma JB, et al. Transparent reporting of a multivariable prediction model for individual prognosis or diagnosis (TRIPOD): explanation and elaboration. Ann Intern Med. 2015;162(1):W1‐W73. [DOI] [PubMed] [Google Scholar]
- 32. Marshall A, Altman DG, Holder RL, Royston P. Combining estimates of interest in prognostic modelling studies after multiple imputation: current practice and guidelines. BMC Med Res Methodol. 2009;9:57. [DOI] [PMC free article] [PubMed] [Google Scholar]
- 33. Scholtens S, Brunekreef B, Visscher TL, et al. Reported versus measured body weight and height of 4‐year‐old children and the prevalence of overweight. Eur J Public Health. 2007;17(4):369‐374. [DOI] [PubMed] [Google Scholar]
- 34. Maris S, Vlugt van der I, Deurloo J, Lanting C. JGZ‐richtlijn Seksuele Ontwikkeling 2014; Handelen bij Normale, Afwijkende en Zorgwekkende Seksuele Ontwikkeling. Utrecht, Netherlands: NCJ – Nederlands Centrum Jeugdgezondheid (the Dutch Center for Child and Youth Health Care); 2014. [Google Scholar]
- 35. Pei Z, Flexeder C, Fuertes E, et al. Early life risk factors of being overweight at 10 years of age: results of the German birth cohorts GINIplus and LISAplus. Eur J Clin Nutr. 2013;67(8):855‐862. [DOI] [PMC free article] [PubMed] [Google Scholar]
- 36. Weng SF, Redsell SA, Nathan D, Swift JA, Yang M, Glazebrook C. Estimating overweight risk in childhood from predictors during infancy. Pediatrics. 2013;132(2):e414‐e421. [DOI] [PubMed] [Google Scholar]
- 37. Santorelli G, Petherick ES, Wright J, et al. Developing prediction equations and a mobile phone application to identify infants at risk of obesity. PLoS One. 2013;8(8):e71183. [DOI] [PMC free article] [PubMed] [Google Scholar]
Associated Data
This section collects any data citations, data availability statements, or supplementary materials included in this article.
Supplementary Materials
Data S1: Supporting Information.