

Abstract
The theory of alternate stable states provides an explanation for rapid ecosystem degradation, yielding important implications for ecosystem conservation and restoration. However, utilizing this theory to initiate transitions from degraded to desired ecosystem states remains a significant challenge. Applications of the alternative stable states framework may currently be impeded by a mismatch between local‐scale driving processes and landscape‐scale emergent system transitions. We show how nucleation theory provides an elegant bridge between local‐scale positive feedback mechanisms and landscape‐scale transitions between alternate stable ecosystem states. Geometrical principles can be used to derive a critical patch radius: a spatially explicit, local description of an unstable equilibrium point. This insight can be used to derive an optimal patch size that minimizes the cost of restoration, and to provide a framework to measure the resilience of desired ecosystem states to the synergistic effects of disturbance and environmental change.
Keywords: alternative stable states, critical patch size, critical radius, hysteresis, nucleation, plant–soil feedbacks, positive feedbacks, spatial dynamics
Introduction
Over the last decades, the concept of alternate stable states has become a leading framework for understanding abrupt changes in ecosystem structure and function due to anthropogenic disturbance. Ecological systems may exhibit alternative stable states when ecological processes create reinforcing positive feedbacks (Scheffer et al. 2001, Suding et al. 2004, Bever et al. 2012, Kéfi et al. 2016). Empirically confirming the existence of alternate stable states is challenging (Knowlton 2004, Schröder et al. 2005, Mason et al. 2007). However, when an alternative state exists, ecosystems are vulnerable to abrupt transitions when perturbations push systems beyond critical thresholds (Scheffer and Carpenter 2003, Scheffer et al. 2012). Of particular concern are transitions that result in degraded ecosystems. Once a system has transitioned to such an alternative state, positive feedbacks can inhibit recovery to the original state (Fig. 1; Suding et al. 2004, Kéfi et al. 2016). Specifically, transitions between alternate stable states are characterized by hysteretic dynamics (e.g., Carpenter 2001), and as a result restorative practices that simply try to recreate historic environmental conditions may be insufficient (Suding et al. 2004, Byers et al. 2006). In this case, re‐establishing functional ecosystems requires overcoming resistance thresholds. Despite the conceptual utility presented by the alternate stable states framework, it has offered few tangible strategies that lower resistance thresholds. Therefore, intentionally shifting a degraded landscape toward a desired alternative stable state remains a considerable challenge.
Fig. 1.
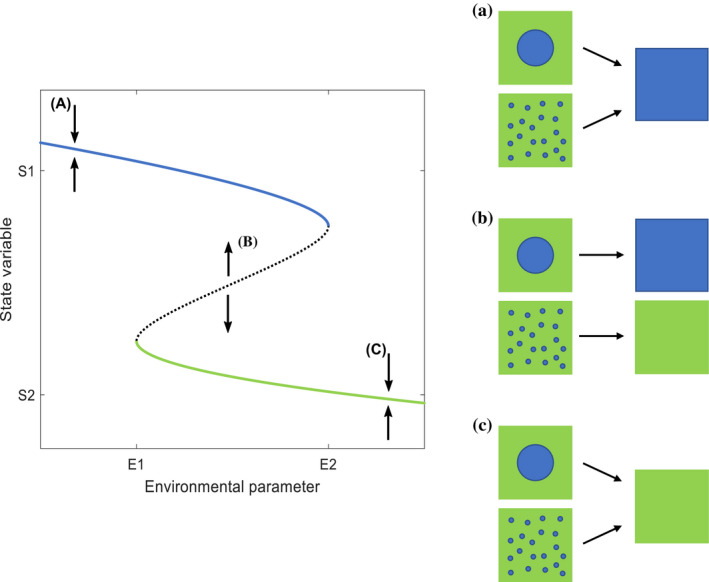
The challenge created by transitions between alternative stable states is often presented generically as a dependence of a state variable on an environmental parameter (e.g., Suding et al. 2004). In the left‐side panel, solid lines represent stable equilibria and the dotted line represents unstable equilibria. For low values of the environmental parameter, represented here by the blue line, the system will be stably maintained at the high value equilibrium. If the environment is perturbed past E2, then the system collapses to a lower equilibrium, represented by the green line. Recovery in a mean field model requires reducing the environment below E1, which can be difficult. However, when the positive feedback dynamic generating the alternative stable states occurs at a local scale, it is possible that the spatial configuration of a state patch can facilitate system recovery. The panels on the right illustrate this potential. Where one equilibrium is possible [e.g., (a) and (c)], the system of mixed states will go to that equilibria regardless of the spatial configuration of the state patches. However, for intermediate values of the environmental parameter where two stable equilibria are possible, represented by point (b), a system will go to high or low equilibria values depending upon the initial proportion of the two patch types and the structure of those patch types. The single critical patch size of blue state is more likely to nucleate the transition to blue equilibrium.
Application of the alternative stable states framework may be impeded by the mismatch between the spatial scales of conceptualization and implementation. Traditional applications of the alternative stable states models assume mean field dynamics: well‐mixed systems where abrupt changes are driven by ecosystem‐scale processes. However, in many ecosystems, the processes that generate positive feedback occur at relatively small spatial scales (Wilson and Agnew 1992, Rietkerk et al. 2004). These local‐scale positive feedbacks can qualitatively differ from mean field dynamics (Durrett and Levin 1994, Molofsky et al. 2001, Molofsky and Bever 2002, Eppstein et al. 2006, Vandermeer and Yitbarek 2012). This may fundamentally alter the nature of resistance thresholds and, therefore, the likelihood of transition between alternative stable states. Consistent with this expectation, previous studies have demonstrated that state transitions differ between mean‐field and spatially explicit model systems (Bel et al. 2012, van de Leemput et al. 2015, 2018). We suggest that these changes in transition behavior can be understood through the analysis of patch size dynamics.
Specifically, one can consider perturbing a degraded ecosystem by introducing a single patch of the desired state (Figs. 1 and 2). Here, the desired patch is also an alternate stable state for the ecosystem as a whole. The subsequent dynamics of this patch will be determined by local‐scale positive feedback. On one hand, it is possible that the patch will decrease in size at accelerating rates, and eventually disappear. On the other hand, it is possible that the patch will increase in size, until it covers the entire ecosystem. This deterministic spread of the desired state may occur even when its overall abundance is below the threshold level for the system as a whole. In this latter case, the introduced patch functions as a nucleus that initiates a process of autocatalytic expansion of the desired state into the degraded landscape, where the autocatalytic process is driven by a local‐scale positive feedback. In this paper, we refer to this phenomenon as nucleation. From our definition of nucleation, it follows that we specifically focus on ecosystems that exhibit alternate stable states that are spatially uniform, and result from a positive feedback that occurs on a local scale. In this, nucleation theory provides an elegant bridge between local‐scale positive feedback mechanisms and landscape‐scale transitions between alternate stable ecosystem states that can be strategically leveraged to lower resistance thresholds and promote ecological recovery.
Fig. 2.
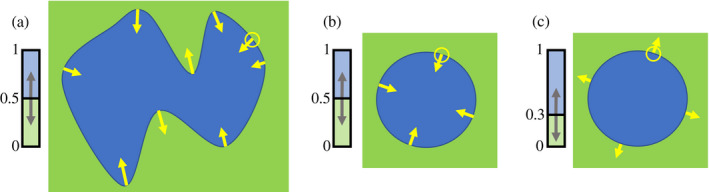
The qualitative dynamics of local‐scale positive feedback is represented. Blue denotes one of the alternative stable states. The shape and size of the blue state are depicted as a blue patch, with the critical proportion of the blue state depicted in relationship to the green state, represented by the green square. The yellow circle represents the local interaction neighborhood, that is the area over which the positive feedback dynamic is generated. The yellow arrows describe the direction of change over time for a particular point on the edge of the patch. In the case of the majority rule (i.e., when the critical proportion is equal to 0.5) concave edges expand and convex edges contract. This results in irregular shapes in (a) becoming more circular as presented in (b). Circular patches can only contract in the case of majority rule (b). However, these patches can expand when the critical proportion is lower than 0.5, as presented in (c), thereby initiating nucleation. Patches expand because their perceived proportion at the edge of the patch is greater than the critical proportion.
Our definition comprises a specific application of nucleation theory that was originally developed in physical chemistry. This theory describes phase transitions of materials, such as droplets forming through condensation of a vapor, or solids forming through crystallization of a liquid (e.g., Lothe and Pound 1962, Oxtoby 1992). In these processes, droplets or crystals can expand when they exceed a critical size, above which further growth reduces the total free energy in the system (Oxtoby 1992). Previous ecological studies have employed nucleation concepts to address a range of topics from theoretical inquiries, to applied ecological challenges. For instance, theoretical investigations have used nucleation theory to describe the effects of patch size on plant competition and invasion dynamics (Gandhi et al. 1999, Korniss and Caraco 2005, Allstadt et al. 2007). These examples, however, are relegated to demographic pressure and competitive dominance, with less emphasis on positive feedback dynamics described by nucleation theory. Similarly, studies that seek out nucleation theory to address restoration barriers also tend to focus on vegetation patch size and demographic pressure. These studies advocate focal areas of recovery, or “restoration islands.” In this, they seek to identify the minimum patch size needed to promote patch integrity and successful demographic dispersal needed for ecosystem recovery over time (Corbin and Holl 2012, Corbin et al. 2016). Like the theoretical applications of nucleation theory in ecology, these applied techniques focus on patch size and shifting demographic concentrations, with little attention given to local positive feedback mechanisms. Therefore, the process of nucleation is yet to be generically described and empirically tested in an ecological context.
Our aim is to unite the frameworks of alternate stable states and nucleation theory as a useful means to engage ecological theory and facilitate ecosystem recovery. We define the necessary conditions for nucleation to occur in ecological systems and differentiate it from other related types of dynamical processes such as the modulation of resource availability by ecosystem engineers. We then describe these conditions within a tangible qualitative model that we use to identify the critical patch size necessary to initiate transitions in ecological systems through the process of nucleation. Here we include a description of the potential for nucleation across a variety of systems. Finally, we discuss the differences between nucleation dynamics and mean field models with respect to alternative stable states, highlighting implications for ecological resilience and the prospects and challenges for nucleation‐facilitated restoration of degraded ecosystems. By focusing on local interactions that can initialize an autocatalytic process that spreads in space, application of nucleation theory provides a promising way forward to boost our knowledge of how to restore ecosystems that have experienced a catastrophic ecosystem shift between alternative stable states.
Conditions for Nucleation in Ecological Systems
Nucleation requires that an introduced patch: (1) generates local‐scale positive feedback, (2) diffusively spreads through local‐scale dispersal, and (3) produces continuous habitable space in at least two dimensions. The introduced patch may be comprised of a single type of organism, or two or more different types of organisms whose interactions aggregate the local‐scale positive feedback. These characteristics distinguish nucleation from other ecological concepts that drive ecosystem change, including biological actors such as ecosystem engineers. We illustrate this difference by drawing upon the classic example of the beaver. Beavers have become an iconic symbol of how an organism can drive landscape‐level change (Jones et al. 1994, Wright et al. 2002, Wright and Jones 2006). However, they do not initiate nucleation for several reasons. First, although it is well known that beavers do create habitats that benefit themselves, a positive feedback process, they also exert strong negative density dependence through local‐scale resource depletion. This zone of depleted resources centered around the beaver dam inhibits continuous spread, thereby violating the second criteria for nucleation. Lastly, the beaver’s exploitable environment is in a single dimension, the linear habitat of the stream or river. As such, classic ecosystem engineers like the beaver do not create a habitat patch that fulfills the three conditions for nucleation.
These three conditions highlight that nucleation is a spatial process resulting from local‐scale positive feedback dynamics. We can explain how these positive feedbacks link nucleation to the alternate stable states framework, specifically as they relate to the unstable equilibrium. A key feature of the alternate stable state framework, the unstable equilibrium separates the basins of attraction of the two stable states. Here, a stable state’s basin of attraction refers to the set of ecosystem states that will develop autogenically toward this state (Lewontin 1969). For a given environmental condition, a transition towards an alternate stable state may be triggered by a perturbation that moves the system from one basin of attraction to another (Scheffer et al. 2001). Alternatively, a gradual change in environmental conditions may change the position of the unstable equilibrium point, and hence the sizes of the basins of attraction. With sufficient change, the basin of attraction of one stable state may vanish completely, triggering the transition towards the alternate stable state (Scheffer et al. 2001). Given the importance of the position of the unstable equilibrium, unification of the alternative stable states’ framework with nucleation requires a proper definition of the unstable equilibrium point that is both spatially explicit, and at the local spatial scale at which nucleation occurs. The definition of the critical patch size fulfills these requirements.
To demonstrate, we consider a simple two‐plant species competition framework in which interspecific competition is stronger than intraspecific competition. In well‐mixed systems, these interactions can create positive feedback that will exclude one of the plant species (e.g., Neuhauser and Pacala 1999). Which plant species gets excluded depends on initial conditions, meaning that both monocultures are alternative stable states. The basins of attraction of these states are then separated by an unstable equilibrium (e.g., Bolker et al. 2003). When the position of this unstable equilibrium is set at equal proportions, 0.5–0.5, that is to say, both plants occupy half the system, the mean field dynamics follow a simple majority rule. However, these mean field dynamics do not accurately describe the interactions in space. For example, individual plants will only interact with a limited number of other plants, such as within their root zone or the extent of their canopy. From here, we refer to this zone of interaction surrounding each plant as the local interaction neighborhood. If competition between the two plant species occurs at the scale of this local interaction neighborhood, then positive feedback occurs locally as well. This will generate monotypic patches out of an initially random spatial arrangement. The interiors of monospecific patches are fixed at the locally dominant state, but edges of patches can be dynamic (Molofsky et al. 2001, Molofsky and Bever 2002). The direction of net movement of the edge will depend upon its curvature. This is because the curvature determines the perceived proportion, that is the relative number of patch members that occur within the local interaction neighborhood. In the simple case of majority rule, edges will move in the direction of concave to convex resulting in circular patches (Fig. 2a). Subsequently, with majority rule, circular patches always collapse to extinction (Fig. 2b).
However, two factors can modify this outcome: the position of the system’s unstable equilibrium, and the size of the local interaction neighborhood. If the position of the system’s unstable equilibrium occurs at unequal proportions, this means that the unstable equilibrium proportion for one plant species is larger than 0.5, whereas for the other plant species, it is smaller than 0.5. From here, we refer to a species’ proportion associated with the unstable equilibrium point as the critical proportion. Importantly, a species with a critical proportion below 0.5 can potentially initiate nucleation. Successful nucleation requires that the perceived proportion at the edge of the patch is greater than the critical proportion. When this condition for the perceived proportion for nucleation is met, circular patches will expand or collapse depending on patch size relative to the size of the local interaction neighborhood (Fig. 2c). In this way, the mean field description of the unstable equilibrium translates to a critical patch size of a circular patch in a spatial context (Fig. 3, Box 1). Patches larger than the critical patch size will expand, whereas patches smaller than the critical patch size will collapse (Fig. 3, Box 1). For circular patches, the critical patch size is characterized by a critical patch radius, which can be easily obtained from geometrical principles (Fig. 3, Box 1). These insights robustly predict that the critical patch size needed to catalyze autogenic spread increases as the critical proportion approaches 0.5–0.5, and with increasing size of the local interaction neighborhood (Fig. 3, Box 1). Given these conditions, we can identify systems in which nucleation may apply and describe the specific mechanisms with the potential to drive nucleation dynamics.
Fig. 3.
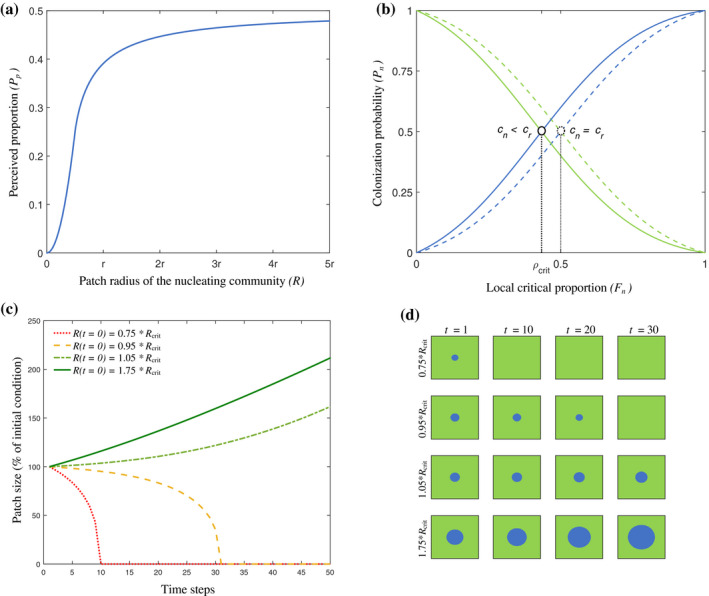
Illustration of nucleation theory as mathematically described in Box 1. (a) As patch size determines edge curvature, and edge curvature determines the perceived proportion, there is a direct relationship between patch size and perceived proportion. (b) Communities structured by positive feedbacks (Box 1; Eqs. 2 and 3), Molofsky et al. 2001, Molofsky and Bever 2002) are characterized by an unstable internal equilibrium. In case of a simple majority rule (dashed lines, an = ar = b = 0.5, cn = 0.5, cr = 0.5), circular patches will go extinct, as the perceived density will never exceed 0.5 (a). However, when the internal equilibrium is shifted to a lower critical proportion for the patch (full lines, an = ar = b = 0.5, cn = 0.3, cr = 0.7) there is a critical radius above which patches will expand. (c) Numerical simulations showing patch dynamics, starting from different initial sizes. Patches with a radius below the critical radius go extinct, whereas patches above the critical radius expand. (d) Snapshots of the numerical simulations of nucleation shown in panel (c).
Box 1. A qualitative nucleation model for ecology.
Nucleation across a variety of systems can be described by a relatively simple mathematical model. Standard trigonomic identities (e.g., Allstadt et al. 2007) can relate the size of a patch to its perceived proportion at the patch edge. Here, perceived proportion, , refers to the relative number of patch members that occur within the local interaction neighborhood. Therefore, the size of the local interaction neighborhood describes the relevant interaction scale for the patch. We assume that both patches and local interaction neighborhoods are circular with radii R and r, respectively. As such, the perceived proportion can be described by
| (1a) |
| (1b) |
When the patch is much larger than the local interaction neighborhood, the intersection between the patch edge and the local interaction neighborhood approaches a straight line. Hence, the perceived proportion asymptotically approaches 0.5 with increasing patch size. However, Eq. 1 reveal that for small patch sizes, the perceived proportion depends substantially on patch size. Differences in perceived proportion can drive the outcome of competition in communities structured by local‐scale positive feedbacks (Molofsky et al. 2001, Molofsky and Bever 2002, Eppstein et al. 2006). Here, we consider that such positive feedbacks may arise from positive effects of the patch and resident communities on their own fitness (Molofsky et al. 2001):
| (2a) |
| (2b) |
here Hn and Hr indicate fitness of the patch and resident community, and Fn and Fj indicate their proportions within the local interaction neighborhood. Parameters a and b determine the strength of positive density dependence. The parameters cn and cr determine the critical threshold densities above which communities reinforce their own growth. In a spatial context, colonization of a location by the patch is then given by (Molofsky et al. 2001)
| (3) |
For this model, there is an unstable equilibrium point, which defines the critical proportion for the patch. This critical proportion can be written as
| (4) |
Eq. 4 shows that for an = ar, when cn = cr, and the equilibrium point will shift to lower values for , meaning that it can induce nucleation, when ci < cr. When assuming that the mechanisms generating local positive feedback develop over faster timescales than dispersal and colonization, Eqs. (3) and (4) indicate deterministically which species will occupy a location in the next generation (e.g., Colasanti and Grime 1993). Combining the above insights, we can derive a critical radial patch size, Rcrit, at which the perceived proportion at the patch edge exceeds the critical proportion needed to exclude the resident community at this location. Under these conditions nucleation occurs and the patch expands in space. When the critical proportion is below 25%, the perceived proportion at the edge of a patch with the critical radius is described by Eq. 1a. Under these conditions, the critical radius Rcrit is described by
| (5) |
in which is the critical proportion. If we combine Eqs. 4 and 5, we can write the critical radius as a function of the competition model parameters:
| (6) |
When the critical proportion is above 25%, the perceived proportion at the edge of a patch with the critical radius is described by Eq. 1b. As this equation includes inverse trigonometric functions, the above procedure does not yield a general, analytic expression for R crit (although approximate expressions for specific conditions, such as r << R crit may be obtained; Allstadt et al. 2007). However, for a given ecological parameter setting, one can obtain (Eq. 4), and setting = , the corresponding value for R crit can be easily obtained numerically (Fig. 3a). For example, for the parameter set an = ar = b = 0.5, cn = 0.3, cr = 0.7, we obtain = 0.433, which yields R crit = 1.607r. Further study of this system using deterministic numerical simulations confirms that the patch is excluded when introduced in patches smaller than this critical size. In contrast, the patch expands in space when it is introduced in patches exceeding the critical size. Consistent with nucleation, we find that when the initial patch approaches the critical radius R crit the patch edge is nearly stable, leading to a (initially) slow exclusion process when R is slightly smaller than R crit, and a (initially) slow expansion process when R is slightly larger than R crit. Therefore, we expect that patch sizes needed for recovering systems can be estimated from the size of the local interaction neighborhood, r.
A Nucleation Case Study: Positive Plant–Soil Feedback
Positive plant–soil feedback is a likely mechanism driving nucleation in terrestrial ecosystems. These feedbacks can be generated between plants that differ in their mutualistic fungal associations (Bever et al. 2012). For instance, in forest systems, most tree species associate with either arbuscular mycorrhizal fungi (AM) fungi or ecto‐mycorrhizal (EM) fungi. Because the densities of these two fungal guilds change with tree community composition, trees that associate with AM fungi will do better when germinating near other trees that host these fungi as compared to trees that associate with EM fungi, and vice versa (Kadowaki et al. 2018). This positive feedback dynamic can result in alternative stable states of AM or EM dominated forests (e.g., McGuire 2007, Corrales et al. 2016, Lu and Hedin 2019). As mycorrhizal fungi disperse locally, the benefits of sharing a fungal guild occur on a local scale (Dickie et al. 2005, McGuire 2007) relative to the large continuous landscapes that they occupy. This system, then, meets the three criteria for nucleation in that it demonstrates local‐scale positive feedback, local dispersal and creating spatially continuous habitable space in two dimensions. Therefore, patches of EM trees or AM trees with their respective mycorrhizal fungi could potentially initiate nucleation. To date, we do not have empirical estimates of the unstable equilibrium point, which is needed to infer a critical patch size for this system.
Positive plant–soil feedback can be also be generated between plants that benefit from mycorrhizal fungi and those that do not (Stinson et al. 2006, Vogelsang and Bever 2009). This dynamic can drive transitions between high quality and degraded states in grasslands. Native grasslands of the central plains of North America are dominated by late‐successional plant species that are highly dependent upon beneficial AM fungi (Wilson and Hartnett 1998, Koziol and Bever 2015). Following large‐scale disturbance such as those related to agricultural practices, degraded grasslands are dominated by non‐native and early successional native plant species that do not rely on AM fungi (Koziol and Bever 2015, Bauer et al. 2017). Positive plant–soil feedback can be generated when the more responsive plants to AM fungi are also the best hosts for these fungi (Bever 1999, Umbanhowar and McCann 2005); experimental work confirms this pattern in this grassland system (Bauer et al. 2015, Koziol and Bever 2019). Consistent with this dynamic, degraded grasslands can be resistant to the reestablishment of late‐successional native plant species because of the disruption of these mutualisms. However, restoration success can be improved by reintroduction of responsive late‐successional plant species paired with the AM fungi with which they grow best (Middleton et al. 2015, Koziol and Bever 2017, Koziol et al. 2018). This grassland example also meets the criteria for nucleation in that: (1) there is positive feedback at a local scale, that is, the extent of the rooting zone of grassland plant species (Middleton and Bever 2012, Koziol and Bever 2019); (2) the plant and fungal species disperse locally (Middleton and Bever 2012, Middleton et al. 2015); and (3) North American grasslands frequently consist of a mosaic of monotypic patches in either early successional or later successional stages, suggesting that either type can create and maintain continuous habitable space (e.g., Collins 1990).
As noted above, reintroduction of late successional species into degraded grasslands might be accelerated through nucleation, in cases where the critical proportion is below 0.5 (Fig. 3, see also Boxes 1 and 2). Indeed, greenhouse studies suggest that a critical proportion of late‐successional plant species is as low as 0.1 (Koziol and Bever 2019). In cases where the critical proportion is below 0.25, the critical radius is described by (Box 1)
Box 2. Using nucleation to overcome barriers to restoration.
Ecosystem restoration efforts are typically constrained by funding resources and/or the availability of suitable propagule sources (Clewell and Rieger 1997). However, theory suggests that recovery of ecosystems that have degraded to an alternative stable state will require substantial efforts due to hysteretic dynamics (Suding et al. 2004). Here we illustrate how utilizing nucleation to reintroduce desired species or communities may solve both issues simultaneously. Using the model presented in Box 1, we represent the extent of environmental stress experienced with the parameter ai. Lower values of ai represent higher levels of stress, and thus the higher the threshold the desired species or community needs to surpass for successful (re‐)invasion of the ecosystem. In a degraded system that experiences high levels of environmental stress, restoration efforts may combine reduction in environmental stress with the (re‐)introduction of desired species. Effective restoration may be achieved by striking an optimal balance between both types of efforts (Byers et al. 2006). Utilizing nucleation can drastically increase the efficiency of restoration, as critical thresholds only need to be exceeded at the patch scale rather than the landscape scale. Specifically, patches of sufficient size will expand over the landscape through an autocatalytic process. When the desired species or community is introduced as a patch, much smaller reductions in stress levels are needed to ensure recovery to the desired state as compared to introducing the same number of propagules randomly in space (Fig. 5b). The larger the patch, the smaller the required reduction in environmental stress, although this effect saturates relatively quickly with increasing patch size (Fig. 5b,c). This relatively quickly saturating effect can be understood by the relationship between patch size and the perceived proportion, which increases steeply between R = 0.25r and R = r (Fig. 5a). In contrast, the number of propagules needed to introduce a patch within a degraded ecosystem increases monotonically (and quadratically) with patch size radius (Fig. 5c). The optimal restoration strategy will also depend on site‐specific cost of reducing stress and the cost functions for the number of propagules introduced, which may be nonlinear themselves (e.g., Byers et al. 2006, Epanchin‐Niell and Hastings 2010). However, these considerations reveal a robust prediction, in that successful intervention (i.e., minimizing the cumulative effort to reduce stress and introduce patches) can be achieved when introducing patches of intermediate size (Fig. 5c).
in which is the critical proportion of late successional plant species, and is the radius of the local interaction neighborhood. Based on grassland species root systems and observations of beneficial AM fungi spread in this system, we estimate the interaction radius at ~0.5 to 2 m (Middleton and Bever 2012, Middleton et al. 2015), which suggests a range for the critical radius between = 0.16 and m. These estimates highlight the feasibility of introducing late successional patches (e.g., through microcosm transplants) that are large enough to initiate nucleation; however, the predictions of rates of spread based on patch size have not yet been fully tested.
Potential for Nucleation Dynamics in Other Systems
Previous studies suggest that the necessary conditions for nucleation may be met in a variety of ecosystems (Table 1). These systems range from the aforementioned grasslands and forests, but also include salt marsh, temperate bogs and estuaries. These studies vary in the degree to which they test the patch size dynamics. We include examples that collectively demonstrate a diversity of local positive feedback mechanisms capable of catalyzing nucleation. Additionally, we highlight the surprising ways in which nucleation may structure ecosystems through organism behavior and across spatial scales.
Table 1.
The potential for nucleation in different types of systems. Positive feedback mechanisms describe general processes related to autogenic spread. The critical patch size was identified to the extent that there is evidence for one in the literature. Measures of nucleation include variables from the literature that were either suggested or used to measure success. Specific research needs for the given systems are identified.
| Habitat | Organism(s) | Positive feedback mechanism | Critical patch size estimate | Measures of nucleation | Research needs | References |
|---|---|---|---|---|---|---|
| Grassland | Plant–microbe | Biological mutualism | Unknown | Patch expansion, plant growth, density, species richness | Determine critical radius for grassland type which may also depend on plant‐microbe host combination. Explore field implementation, survival and spread of the nucleator. | Middleton et al. (2015); Koziol and Bever (2019) |
| Forest | Plant–microbe | Biological mutualism | Unknown | Patch expansion, plant growth, density, species richness | Determine critical radius for forest type which may also depend on plant‐microbe host combination. Explore field implementation, survival and spread of the nucleator. | Dickie et al. (2005); McGuire (2007) |
| Temperate bog | Sphagnum sp. | Biotic manipulation of abiotic factors | Yes | Patch expansion, plant growth, diversity, shifts in hydraulic properties | Potential other plants as nucleators. In addition to hydrology, further exploration of how nucleators manipulate other abiotic factors such as nutrient dynamics. | Robroek et al. (2007); Robroek et al. (2009b ) |
| Salt marsh | Spartina alterniflora and Geukensia demissa association | Biological association, potential mutualism | Yes | Patch expansion, plant growth, shoot density, presence of mussels | Refinement of the critical radius with and without associated muscles are warranted and should also be examined with regards to abiotic stress factors such as drought severity and salinity. | Silliman et al. (2015); Angelini et al. (2016); Derksen‐Hooijberg et al. (2018) |
| Estuary | Zostera sp. | Biotic manipulation of abiotic factors | Yes | Patch expansion, increased biomass, sediment and nutrient accrual | Determine the critical radius. Because Zostera sp. may be particularly sensitive to stress gradients it is important to understand anthropogenic disturbances may affect the critical radius. | Moore and Hovel (2010); Maxwell et al. (2017) |
| Invasive in North America | Lymantria dispar | Allee effect | Unknown | Patch expansion | To prevent invasive organism expansion, identify the critical radius and need patch reduction efforts. | Taylor and Hastings (2004); Vercken et al. (2011) |
| Forest | Animal dispersal, asymmetric competition between trees and grasses | Unknown | Unknown | Patch expansion, plant growth, density, species richness | Refinement of the positive feedback mechanism and the associated organisms. These mechanisms should be examined with the three conditions of nucleation in mind to confirm the potential mechanism of nucleation. | Corbin and Holl (2012); Corbin et al. (2016) |
A dynamic example of potential nucleation can be seen in salt marsh systems along the east coast of the United States. These systems are traditionally structured by Spartina alterniflora, a wetland plant that promotes benthic invertebrate diversity, sediment deposition, nutrient retention and organic matter accumulation (Craft et al. 2003). However, climate‐related drought stress followed by increased salinity has resulted in denuded mudflats (Angelini et al. 2016), or monocultures of long‐lived, salt‐tolerant perennials that exclude important plant species that structure these landscapes (Angelini and Silliman 2012). The resilience and recovery of these salt marsh systems may depend on the facultative relationship between S. alterniflora and the mussel Geukensia demissa. Although S. alterniflora enhances settlement substrate and provides nutritional resources for G. demissa, this mussel can increase soil water storage and reduce porewater salinity stress (Silliman et al. 2015, Angelini et al. 2016, Derksen‐Hooijberg et al. 2018). When both are present, the local positive feedback generated by S. alterniflora and G. demissa can result in drought‐resistant patches (Silliman et al. 2015, Angelini et al. 2016, Derksen‐Hooijberg et al. 2018), and when initiated together, can result in clonal outgrowth of S. alterniflora (Silliman et al. 2015, Derksen‐Hooijberg et al. 2018). As gleaned from the conditions for nucleation, it may be that these benefits are only realized when patches reach a critical size. Angelini and Silliman (2012)showed that small patches of S. alterniflora (<1 m2) were further degraded under drought stress, and large patches (>20 m2) were able to persist despite biotic inhibition. In turn, large patches were then able to recover and expand when drought conditions were relaxed (Angelini and Silliman 2012). Although further studies are needed, large patches may enable the positive feedback generated by S. alterniflora and G. demissa to overcome drought and salinity thresholds, initiating nucleation. Although these findings highlight the importance of patch size, the difference between small and larger patches was quite large. Further work identifying the critical patch size at which S. alterniflora is both resilient and capable of regenerating should be explored if nucleation is to be used as a viable means to mediate recovery.
Indications of nucleation dynamics can also be found within temperate bogs. These ecological systems have been subjected to anthropogenic disturbances including drainage for fuel and farmland. Remnant bogs are typically comprised of a mosaic of wetter, lower productive areas called hollows, and dryer, more productive areas called hummocks (Belyea and Clymo 2001, Eppinga et al., 2008, Eppinga et al., 2009a , b ). Rewetting of degraded bogs may restore hollow vegetation including species such as Sphagnum cuspidatum and S. fallax but this strategy has proven rather ineffective in restoring hummock vegetation including species such as S. rubellum and S. fuscum (Robroek et al. 2009a ). In temperate bogs in Ireland and Estonia, Robroek et al. (2009c ) tested the viability of these hummock species when introduced as circular transplants of different sizes within a matrix of bog vegetation dominated by other species. They found that small transplants (patch radius r = 0.035 m) substantially declined in the 3 yr following transplantation, whereas larger transplants (patch radius r = 0.07 m) increased in size (Robroek et al. 2009b ). Additional measurements suggest that within the larger transplants, hummock vegetation is able to modify the local microhydrology in a way that favors its own growth (Robroek et al., 2007, 2009b ). This notion is consistent with a wider range of observations suggesting positive feedbacks between local abiotic conditions and the growth of different bog vegetation types (see Eppinga et al. 2009b for a review). As the recovery of temperate bogs requires the presence of viable hummocks and hollows, nucleation through the introduction of appropriately sized hummock transplants provides a promising mechanism to reinstate the underlining characteristics of these systems (Robroek et al. 2009a ).
The previous examples focused on positive feedback mechanisms involving plant species, but similar mechanisms can operate with other organisms, such as animal species experiencing Allee effects (Allee 1931, Courchamp et al. 1999). Although the implications of Allee effects are thoroughly understood for well‐mixed populations, as described by mean field dynamics, their implications for spatially distributed populations are less well understood (Vercken et al. 2011). The European gypsy moth Lymantria dispar has become invasive in the eastern United States. In this nonnative range, mate‐finding failure below a critical population density threshold has been identified as a main mechanism inducing an Allee effect within invasive gypsy moth populations (Robinet et al. 2008, Tobin et al. 2009). Vercken et al. (2011) found that persistence of gypsy moth populations was positively associated with invaded area patch size; an effect that could be separated from attendant effects of location and gypsy moth density. More generally, for invasive species experiencing Allee effects, it has been suggested that preventing nucleation, that is, reducing patches to a size below the critical patch size rather than complete eradication, provides a means to maximize the effectiveness of an eradication effort (Taylor and Hastings 2004, 2005).
The gypsy moth example illustrates that nucleation dynamics can occur at the landscape scale. It is possible that systems experiencing alternative stable states at a landscape scale may in turn exhibit nucleation dynamics at very large scales. For example, localized ecological interactions in coffee plantations can have landscape‐scale consequences. Here insect predators have been shown to exhibit hysteresis at the level of control of coffee pests (Perfecto et al. 2014, Vandermeer et al. 2014). In this system, control of coffee rust is provided by a predatory fungus (the white halo fungus), which also consumes the green coffee scale. The green coffee scale is mutualistically tended by ants. This mutualism initiates a positive feedback that generates alternative stable states of high and low coffee rust levels, even though all four species are present in both stable states (Vandermeer et al. 2014). Because these dynamics are mediated by relatively mobile insects and aerially dispersed fungi, the spatial scale of the trophic dynamics generating the positive feedback can be large. As such, the relevant scale to consider nucleation processes may be on the regional scale. Landscape modeling may be necessary to test whether pest outbreaks on a few neighboring coffee farms could trigger a nucleation event that flip coffee farms from low to high pest levels across a region. Such a finding could open up strategies for managing coffee rust outbreaks on a regional scale through the initiation of nucleation to reverse outbreaks.
Inferences from Nucleation Dynamics for Ecological Systems
For ecological systems that are amenable to nucleation, we note qualitative differences in their potential dynamics from what is expected from mean field models of alternate stable states. In this, nucleation is relevant to both the resilience to collapse of the desired state and ecosystem recovery. In particular, nucleation dynamics will interact with different regions of mean field hysteresis to alter ecosystem response to environmental forcing (Fig. 4). Environmental forcing can shift the basin of attraction, thereby altering the unstable equilibrium point between alternative stable states. This will have subsequent effects on both the critical proportion and critical patch size of a system. Specifically, as we identified a critical proportion of less than 0.5 is necessary for nucleation, environmental forcing that alters the critical proportion will have important implications for the outcomes of alternative stable states. With this understanding, we can identify a region in which nucleation accelerates ecosystem collapse relative to that expected by mean field dynamics, and a region in which nucleation will accelerate restoration (Fig. 4). We discuss the implications of these issues separately, as well as how nucleation may inform efforts to identify spatial indicators of resilience.
Fig. 4.
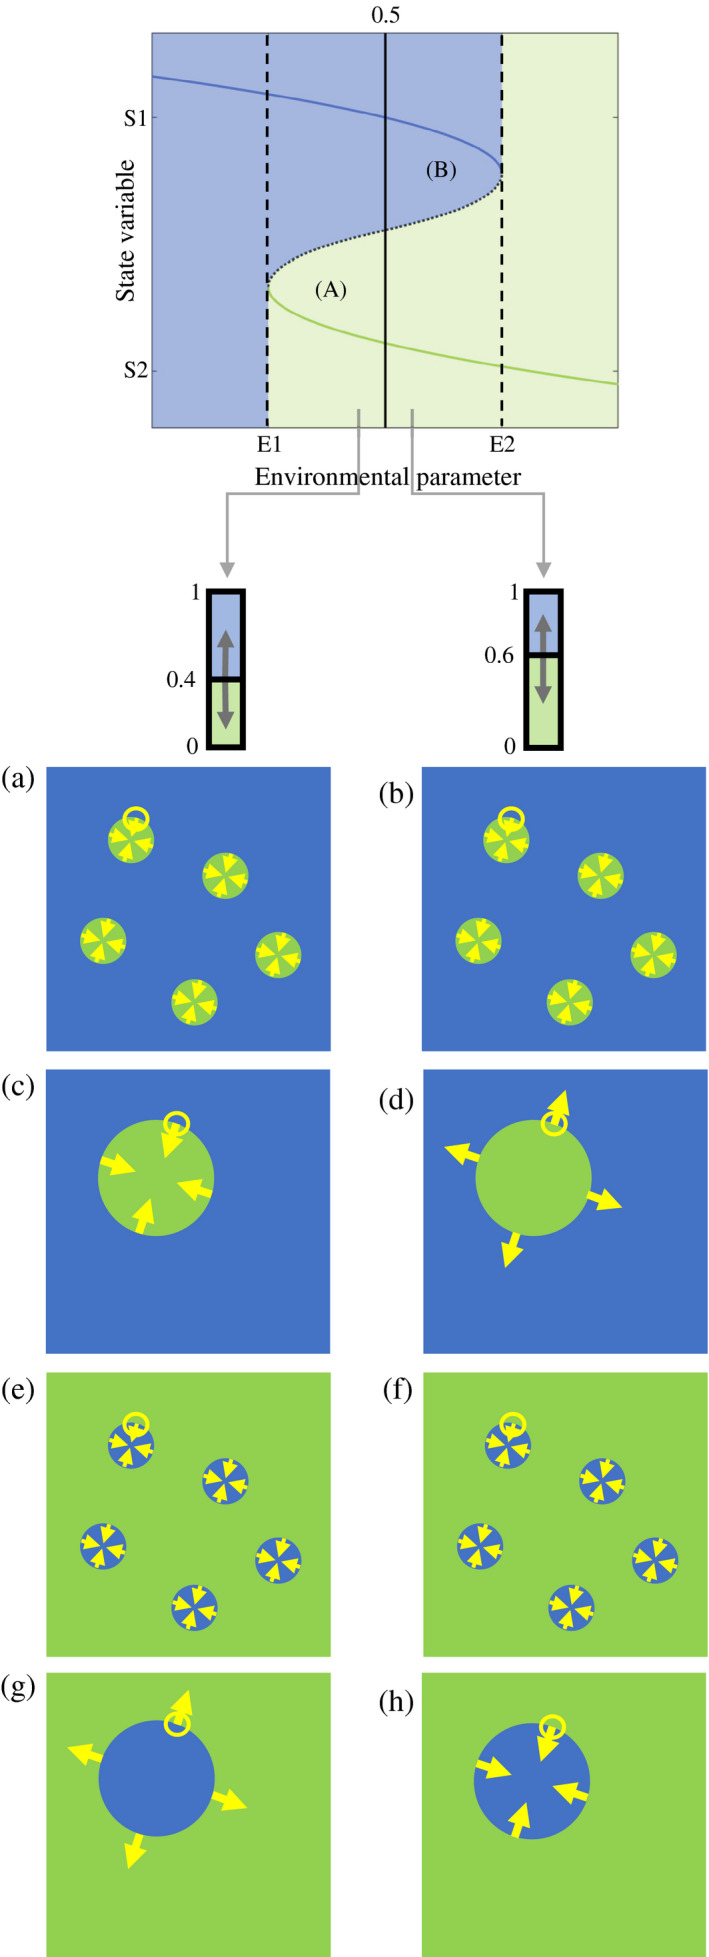
In regions of alternative stable states, shown in the panels on the left, nucleation may promote ecosystem collapse [region (B)], or facilitate ecosystem recovery [region (A)]. These outcomes associated with these two regions depend on whether environmental forcing pushes the system above or below the critical proportion of 0.5, and the spatial dynamics of the disturbance. In this figure we consider the critical proportion from the perspective of the blue state. When the blue state is dominant and the critical proportion remains below 0.5 in the presence of environmental forcing, the blue state will quickly recover from both small (a) and large (c) patches of disturbance, here represented by the green state. However, should environmental forcing increase the critical proportion for the blue state above 0.5, the resilience of the blue state will depend on the patch size of the disturbance. Although the blue state can still recover from small patches of disturbance (b), it will collapse when the disturbance is large (d). When the green state is dominant, recovery of the blue state is only possible when the critical proportion is below 0.5 and disturbance generated by the blue state is large (g). However, if environmental forcing raises the critical proportion of the blue state above 0.5, large patches of the blue state will no longer be able to initiate ecosystem recovery and the system will collapse back to the green state (h). In this latter case (h), recovery is only possible if environmental conditions are mitigated such that the critical proportion returns to below 0.5.
Nucleation and ecosystem resilience
Nucleation dynamics provides a mechanistic reason to expect a synergism at the risk of catastrophic collapse induced by environmental forcing and anthropogenic disturbance. In mean field theory, environmental forcing can gradually decrease the basin of attraction of the current ecosystem state (Fig. 1; Scheffer et al. 2001). Under the suitable environmental conditions for the current state, its basin of attraction may be substantially larger than that of the alternative stable state (Fig. 1). Nucleation predicts that landscapes whose critical proportion is less than 0.5 will be more resilient to disturbance, here defined as forced reversal of states. A corollary of this result is that in the absence of disturbance, landscapes of nucleating patches will tend to be dominated by the state with the lowest critical proportion and the smallest critical patch size. Consistent with this expectation, we have estimated that late successional grassland communities, which eventually dominate the central plains of North America, have a small critical patch size. We illustrate the high resilience of such a system to disturbance in Fig. 4. If local positive feedback dynamics are sensitive to environmental forcing, then the critical proportion of the dominant state will increase. A landscape governed by a continuous expanse of the original dominant state will be resilient to this environmental forcing even as the critical proportion increases past 0.5 (Fig. 4a–c). However, once the critical proportion is greater than 0.5, the collapse of the system will depend upon the geometric arrangement of that disturbance. Specifically, large patches of disturbance can initiate nucleation that will lead to collapse of the dominant state (Fig. 4d). This patch size dependence has been previously noted in spatially explicit simulations (van de Leemput et al. 2018). Our work identifies a mechanistic reason for this result.
We see evidence of this mechanism at work in the central plains of North America where elevated CO2, combined with anthropogenic fire suppression may disproportionately advantage woody plant species (Morgan et al. 2007, Bond and Midgley 2012, Ratajczak et al. 2014, Miller et al. 2017), and as a result, increase the critical proportion of late successional grassland communities. Once established, these woody plant species can create heterogenous patches across the landscape at the expense of grassland species (Ratajczak et al. 2017b ). Reinstating historical fire regimes to reverse woody plant encroachment are often met with mixed results. This has been attributed in part to woody plant patch dynamics that promote resilience of the degraded state (Ratajczak et al., 2017a , b ). Although a critical patch size for woody encroachment in these grasslands has not been identified, it is important to note that Ratajczak et al. (2017b ) observed both an acceleration of woody plant encroachment and the persistence of several large woody patches after fire was reinstated to the landscape. This suggests that a critical patch size may have facilitated woody plant establishment and persistence. Further work quantifying patch size disturbance in relationship to ecosystem resilience may help inform intervention strategies.
Nucleation and spatial indicators of resilience
Given the pivotal role that geometry plays in dictating nucleation events, nucleation may also inform current efforts to identify spatial indicators for ecosystem resilience (Dai et al. 2013, van de Leemput et al. 2015, Van Belzen et al. 2017, van de Leemput et al. 2018). Specifically, because of its relationship to the unstable equilibrium, the critical patch size provides a measure of the basin of attraction of the current equilibrium. These spatial indicators can be exhibited in several ways. For instance, as environmental forcing on the current state increases, smaller and smaller patches can initiate nucleation and eventually, the alternate stable state will establish over the entire landscape. Spatial indicators of resilience can also be exhibited by changes in behavior of a fixed‐size patch. Under increasing environmental stress, a fixed‐size patch of a current state will approach its critical patch size. As we showed that patches closer to the critical patch size persist longer (Box 1), it follows that under environmental forcing patches may continue to recover for a while but, that patch recovery time will increase with increasing environmental perturbation. This phenomenon is described as the critical slowing down (Dakos et al. 2008) and has been inferred in previous model studies (Herman and Shnerb 2017, van de Leemput et al. 2018) and experiments (Van Belzen et al. 2017). Nucleation theory enables quantitative predictions of how recovery time not only depends on the current environmental conditions, but also on the specific size of the disturbance considered (Fig. 4; Box 1). Although these predictions only apply to systems that fulfill the requirements for nucleation, they may apply to systems with spatial feedbacks where patches are still small and far apart (Box 3).
Box 3. Nucleation in ecological systems with interacting patches.
In the current study, we focus on the role of nucleation ecological systems with two alternate stable states that are spatially uniform. In these systems, the positive feedback occurs at a local scale, such as the local interaction neighborhoods of plant species. Additionally, the edge of a nucleating patch comprises a transient state between one stable state and another. Previous studies suggest that in other ecosystems, patchy landscapes are stable states themselves that can be maintained over time (Rietkerk et al. 2004, Rietkerk and van de Koppel 2008, Bastiaansen et al. 2018). In these systems, the local positive feedback emerges from spatial transport processes, such as the flow of water towards vegetation in dryland ecosystems (Klausmeier 1999, Von Hardenberg et al. 2001, Rietkerk et al. 2002), or around vegetation in erosion‐prone intertidal systems (Van Wesenbeeck et al. 2008, Weerman et al. 2010). The result of such transport‐related feedback mechanisms, however, is that it also induces effects farther away, such as depletion of resources or increased abiotic stress outside of patches. These impacts occurring farther away may eventually limit patch expansion (Rietkerk et al. 2004, Siteur et al. 2014). In addition, with an increasing number of patches on the landscape, longer‐range effects also create interactions between patches that affect patch dynamics and persistence (Siteur et al. 2014, Bertolini et al. 2019, Bastiaansen et al. 2020). The described nucleation process may still be relevant for these types of systems when they reside in a state with relatively few patches that are far apart. Under such conditions, there may still be a critical patch size above which the scale‐dependent feedback initiates persistence and growth of patches (Reijers et al. 2019).
Nucleation can facilitate restoration
In addition to its theoretical applications, nucleation also offers new insights into approaches for recovering systems following catastrophic collapse. Current restoration strategies often fail to address resistance thresholds of the degraded system and as a result, these strategies may not initiate a successful recovery process (Suding et al. 2004, Perring et al. 2015). Promoting nucleation is an appealing restoration strategy because it addresses the systemic attributes of alternative stable states while providing an accelerated predictable trajectory towards ecological recovery (Fig. 5, Box 2). Utilizing nucleation in a restoration context requires concentrating positive feedback dynamics at a size larger than critical patch size. In systems where the target site is characterized by low environmental stress, smaller patches may be suitable to catalyze nucleation (Fig. 5, Box 2). Conversely, as the environmental stress of the restoration target increases, larger patches are needed (Fig. 5, Box 2). However, regardless of the environmental conditions, introduction of the desired state in the form of a patch that exceeds the critical patch size constitutes an efficient restoration strategy. This effectiveness stems from the fact that after the introduction effort, the desired recovery process constitutes an autogenic spread process to dominance at the landscape scale. One requirement for nucleation to occur is that the critical proportion of the desired state is below 0.5 (Fig. 4), which may require additional measures that change current environmental conditions (Fig. 4g, h). From nucleation theory described above, it follows that larger patches will require smaller changes in environmental conditions (Fig. 5, Box 2). The financial costs associated with introducing the desired state will increase with the patch size, and the costs of changing environmental conditions will increase with the magnitude of change created. This means that for a particular restoration project, an optimal strategy (i.e., the introduction of patches of a particular size) can be developed that minimizes total costs (Fig. 5, Box 2). Regardless of the specific patch size used, however, it should be emphasized that especially for large‐scale systems the required magnitude of change for nucleation is much smaller than the necessary change as expected from mean field theory (Fig. 5, Box 2).
Fig. 5.
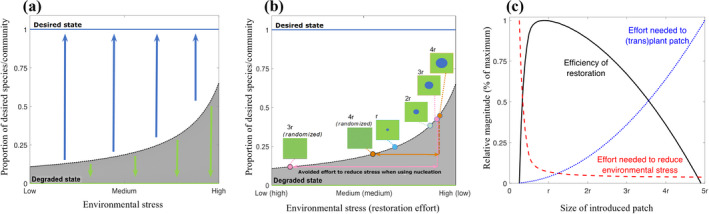
Illustrating the use of nucleation theory in ecosystem restoration as described in Box 2. (a) The model introduced in Box 1 can be parameterized to represent an environmental stress gradient, with higher stress levels increasing the restoration barrier that needs to be overcome (parameter an decreases from 5 (low environmental stress) to 0 (high environmental stress) along the x‐axis; other parameters as in Fig. 3). (b) For a given amount of propagules introduced, the environmental stress level needs to be reduced less if these propagules are introduced in a circular patch, as compared to distributing these propagules randomly. Note that randomly distributing the propagules forming a patch of radius r or 2r does not lead to recovery along the environmental stress gradient shown. (c) Although effective restoration strategies will depend on site‐specific costs associated with reducing environmental stress, and introducing propagules, nucleation theory robustly predicts that introducing patches of intermediate sizes comprise the most effective strategy. In the graph, the effort needed to reduce environmental stress (red dashed line) is rescaled, by setting the effort needed when introducing a patch of r/4 (which requires increasing parameter ai from 0 to 9.55) to 1. Similarly, the effort needed to introduce the amount of propagules (blue dotted line) is rescaled, by setting the effort needed when introducing a patch of 5r (i.e., covering an area of 25r 2) to 1. For simplicity, we define a metric for restoration efficiency as: 1‐EffortSTRESS‐EffortINTRO, rescaling the optimal solution to a value of 1 (black line).
Future Directions and Research Needs
Nucleation provides a promising means to incorporate local‐scale positive feedback and patch dynamics into the alternate stable states framework with the potential to inform ecological theory, ecosystem conservation, and restoration. However, nucleation is only relevant to systems that meet the three conditions we identified: local‐scale positive feedback, local dispersal, and diffusive spread in multiple dimensions. Confirming these conditions for candidate systems and defining their mechanistic components as related to nucleation, are major research goals.
Field observations can be used to identify candidate ecosystems for nucleation. When conditions for nucleation are met, systems are likely to exhibit extensive patches in divergent states, with relatively sharp boundaries between them (Fig. 5, Wilson and Agnew 1992, van de Koppel et al. 2001, Molofsky et al. 2001, Scheffer and Carpenter 2003, Eppinga et al. 2009b ). Although such observations are consistent with the presence of a local positive feedback, patchy ecosystem states can also be the result of other mechanisms that are not necessarily linked to alternate stable states (Box 3, van de Koppel and Crain 2006). To decipher between such systems, one could experimentally test for the occurrence of local positive feedback. For example, the plant–soil feedback approach discussed above provides a means to use pot experiments as a test for the existence of an unstable equilibrium point, and the critical proportions of plant species at this equilibrium (Bever et al. 1997, Bauer et al. 2015). This approach can be generalized to other types of competitive interactions (Eppinga et al. ). Another experimental approach would be to test for the divergence of ecosystem states. Here, one could implement experimental units at different initial proportions to test whether their trajectories diverge over the course of the experiment (Gilpin et al. 1986, Drake 1991, Chase 2003, Scheffer and Carpenter 2003, Koziol and Bever 2019). This type of approach is not new, but given the attention in the literature to alternate stable states and its potential implications, the number of performed experiments of this type seems relatively rare which, was also the case for the candidate systems identified in this study (Table 1, Schröder et al. 2005).
In addition, predictions about nucleation would require an understanding of the spatial geometry that dictates local positive feedback dynamics. This includes the local interaction neighborhood and critical patch size. Empirical quantification of the local interaction neighborhood is both challenging and demanding (Ruckelshaus et al. 1997, Stoll and Weiner 2000, Eppstein and Molofsky 2007, Middleton et al. 2015). However, the work presented here suggests that this step can be circumvented within the context of ecological restoration research. Based on the type of organisms involved, reasonable estimates for interaction neighborhoods can be readily made (e.g., 100–101 cm for mosses and small plants such as Arabidopsis thaliana, 101– 102 cm for grasses, and 102–104 cm for large trees; Schneider et al. 2006, van de Koppel and Crain 2006, Robroek et al. 2009b , Johnson et al. 2012). As we demonstrated with the plant–soil feedback example, even a broad estimate of the local interaction neighborhood, together with an estimate of the critical proportion, provides a useful range for the system’s critical patch size for nucleation. Thus, a strong experimental test for nucleation would be to introduce patches of varying sizes into a degraded ecosystem. Given an estimated radius of the local interaction neighborhood r, introducing patches with radii ranging from R = 0.2r to R = 2r, almost completely covers the theoretically relevant range for nucleation studies (Table 2). In such experiments, including a range of smaller‐sized patches is important, as the strongest change in patch curvature occurs between 0.2r to 0.5r (Fig. 3, Table 2). If nucleation occurs, patches below the critical patch size will decrease over time, whereas patches above the critical patch size will increase. As the latter type of outcome would entail a successful restoration strategy, this type of experiment would be of direct practical value. Importantly, one could also manipulate the curvature of noncircular patch to test rates of movement on the boarder akin to predictions in Fig. 2. This would further our understanding about the geometrical underpinnings of nucleation.
Table 2.
Given the proportion of an introduced community within the local interaction neighborhood at the patch edge, we can predict the patch radius, R. Proportions characterizing the introduced community are representative of a critical proportion that would catalyze nucleation. This provides a theoretically relevant range of patch sizes for nucleation studies.
| Proportion of the introduced community within the local interaction neighborhood at patch edge | Required patch radius R as a function of the size of the local interaction neighborhood r |
|---|---|
| 0.05 | 0.22r |
| 0.1 | 0.32r |
| 0.15 | 0.39r |
| 0.2 | 0.45r |
| 0.25 | 0.5r |
| 0.3 | 0.58r |
| 0.35 | 0.75r |
| 0.4 | 1.09r |
| 0.45 | 2.13r |
The proposed approach is in an expansion of previous studies showing divergent dynamics of small versus large patches (Robroek et al. 2009b , Vercken et al. 2011, Angelini and Silliman 2012, Silliman et al. 2015, Maxwell et al. 2017), which provides a critical test of nucleation processes. However, the number of patch sizes considered in these previous studies was rather limited as compared to the set proposed in Table 2, and not explicitly linked to an estimated spatial scale of operation for local positive feedback. In other words, the smaller the initial size difference between diverging patches, the stronger the evidence for a critical patch size, which could provide a key to efficient restoration strategies (Table 1, Fig. 5, Box 2). A final empirical test of nucleation could then be obtained by monitoring the persistence of the introduced state at the center of the introduced patches. If the introduced patch is truly an alternate stable state of the system, it should be able to maintain itself for many generations (e.g., Schröder et al. 2005).
Conclusion: The Promise of Nucleation
Uniting nucleation with alterative stable states theory provides a promising means to address ecosystem recovery impeded by a failure to overcome hysteresis (Suding et al. 2004, Perring et al. 2015). As anthropogenic demands and climate change continue to pressure ecosystems, strategies for predictable recovery are needed to ensure viable, functioning systems. Nucleation theory provides a framework to understand transitions between alternative stable states for systems characterized by local‐scale positive feedback. The identified conditions for nucleation are likely met within a variety of ecological systems. For these systems, geometric analyses of spatial dynamics can be used to derive the critical patch size for initiation of nucleation and spatial spread. Additionally, we have argued that for systems in which positive feedbacks operate on a local scale, the process of nucleation can short circuit restoration barriers and facilitate rapid recovery. Nucleation links deterministic spatial dynamics to alternative stable states theory while at the same time offering up a viable blueprint for ecosystem recovery and monitoring ecosystem resilience in a changing world.
Acknowledgments
We would like to thank Johan van de Koppel and one anonymous reviewer for their comments that greatly strengthened the quality and clarity of this manuscript. We would also like to thank our support from National Science Foundation grants DEB 1556664, DEB 1738041, and EPSCoR no. 0079054.
Michaels, T. , M. B., Eppinga , and J. D., Bever . 2020. A nucleation framework for transition between alternate states: short‐circuiting barriers to ecosystem recovery. Ecology 101(9):e03099 10.1002/ecy.3099
Corresponding Editor: Brett McClintock.
Literature Cited
- Allee, W. C. 1931. Animal aggregations, a study in general sociology. The University of Chicago Press, Chicago, Illinois, USA. [Google Scholar]
- Allstadt, A. , Caraco T., and Korniss G.. 2007. Ecological invasion: spatial clustering and the critical radius. Evolutionary Ecology Research 9:375–394. [Google Scholar]
- Angelini, C. , Griffin J. N., van de Koppel J., Lamers L. P., Smolders A. J., Derksen‐Hooijberg M., van der Heide T., and Silliman B. R.. 2016. A keystone mutualism underpins resilience of a coastal ecosystem to drought. Nature Communications 7:12473. [DOI] [PMC free article] [PubMed] [Google Scholar]
- Angelini, C. , and Silliman B. R.. 2012. Patch size‐dependent community recovery after massive disturbance. Ecology 93:101–110. [DOI] [PubMed] [Google Scholar]
- Bastiaansen, R. , Doelman A., Eppinga M. B., and Rietkerk M.. 2020. The effect of climate change on the resilience of ecosystems with adaptive spatial pattern formation. Ecology Letters 23:414–429. [DOI] [PMC free article] [PubMed] [Google Scholar]
- Bastiaansen, R. , Jaïbi O., Deblauwe V., Eppinga M. B., Siteur K., Siero E., Mermoz S., Bouvet A., Doelman A., and Rietkerk M.. 2018. Multistability of model and real dryland ecosystems through spatial self‐organization. Proceedings of the National Academy of Sciences 115:11256–11261. [DOI] [PMC free article] [PubMed] [Google Scholar]
- Bauer, J. T. , Koziol L., and Bever J. D.. 2017. Ecology of floristic quality assessment: testing for correlations between coefficients of conservatism, species traits and mycorrhizal responsiveness. AoB Plants 10:plx073. [DOI] [PMC free article] [PubMed] [Google Scholar]
- Bauer, J. T. , Mack K. M. L., and Bever J. D.. 2015. Plant–soil feedbacks as drivers of succession: evidence from remnant and restored tallgrass prairies. Ecosphere 6:1–12. [Google Scholar]
- Bel, G. , Hagberg A., and Meron E.. 2012. Gradual regime shifts in spatially extended ecosystems. Theoretical Ecology 5:591–604. [Google Scholar]
- Belyea, L. R. , and Clymo R. S.. 2001. Feedback control of the rate of peat formation. Proceedings of the Royal Society Series B 268:1315–1321. [DOI] [PMC free article] [PubMed] [Google Scholar]
- Bertolini, C. , Cornelissen B., Capelle J., van de Koppel J., and Bouma T. J.. 2019. Putting self‐organization to the test: labyrinthine patterns as optimal solution for persistence. Oikos 128:1805–1815. [Google Scholar]
- Bever, J. D. 1999. Dynamics within mutualism and the maintenance of diversity: inference from a model of interguild frequency dependence. Ecology Letters 2:52–61. [Google Scholar]
- Bever, J. D. , Platt T. G., and Morton E. R.. 2012. Microbial population and community dynamics on plant roots and their feedbacks on plant communities. Annual Review of Microbiology 66:265–283. [DOI] [PMC free article] [PubMed] [Google Scholar]
- Bever, J. D. , Westover K. M., and Antonovics J.. 1997. Incorporating the soil community into plant population dynamics: the utility of the feedback approach. Journal of Ecology 85:561–573. [Google Scholar]
- Bolker, B. M. , Pacala S. W., and Neuhauser C.. 2003. Spatial dynamics in model plant communities: what do we really know? American Naturalist 162:135–148. [DOI] [PubMed] [Google Scholar]
- Bond, W. J. , and Midgley G. F.. 2012. Carbon dioxide and the uneasy interactions of trees and savannah grasses. Philosophical Transactions of the Royal Society B 367:601–612. [DOI] [PMC free article] [PubMed] [Google Scholar]
- Byers, J. E. , Cuddington K., Jones C. G., Talley T. S., Hastings A., Lambrinos J. G., Crooks J. A., and Wilson W. G.. 2006. Using ecosystem engineers to restore ecological systems. Trends in Ecology & Evolution 21:493–500. [DOI] [PubMed] [Google Scholar]
- Carpenter, S. R. 2001. Alternate states of ecosystems: evidence and its implications Pages 357–383 in Press M. C., Huntly N. J., and Levin S., editors. Ecology: achievement and challenge. Blackwell Press, Oxford, UK. [Google Scholar]
- Chase, J. M. 2003. Experimental evidence for alternative stable equilibria in a benthic pond food web. Ecology Letters 6:733–741. [Google Scholar]
- Clewell, A. , and Rieger J. P.. 1997. What practitioners need from restoration ecologists. Restoration Ecology 5:350–354. [Google Scholar]
- Colasanti, R. L. , and Grime J. P.. 1993. Resource dynamics and vegetation processes: a deterministic model using two‐dimensional cellular automata. Functional Ecology 7:169–176. [Google Scholar]
- Collins, S. L. 1990. Patterns of community structure during succession in tallgrass prairie. Bulletin of the Torrey Botanical Club 117:397–408. [Google Scholar]
- Corbin, J. D. , and Holl K. D.. 2012. Applied nucleation as a forest restoration strategy. Forest Ecology and Management 265:37–46. [Google Scholar]
- Corbin, J. D. , Robinson G. R., Hafkemeyer L. M., and Handel S. N.. 2016. A long‐term evaluation of applied nucleation as a strategy to facilitate forest restoration. Ecological Applications 26:104–114. [DOI] [PubMed] [Google Scholar]
- Corrales, A. , Mangan S. A., Turner B. L., and Dalling J. W.. 2016. An ectomycorrhizal nitrogen economy facilitates monodominance in a neotropical forest. Ecology Letters 19:383–392. [DOI] [PubMed] [Google Scholar]
- Courchamp, F. , Clutton‐Brock T., and Grenfell B.. 1999. Inverse density dependence and the Allee effect. Trends in Ecology & Evolution 14:405–410. [DOI] [PubMed] [Google Scholar]
- Craft, C. , Megonigal P., Broome S., Stevenson J., Freese R., Cornell J., Zheng L., and Sacco J.. 2003. The pace of ecosystem development of constructed Spartina alterniflora marshes. Ecological Applications 13:1417–1432. [Google Scholar]
- Dai, L. , Korolev K. S., and Gore J.. 2013. Slower recovery in space before collapse of connected populations. Nature 496:355–358. [DOI] [PMC free article] [PubMed] [Google Scholar]
- Dakos, V. , Scheffer M., van Nes E. H., Brovkin V., Petoukhov V., and Held H.. 2008. Slowing down as an early warning signal for abrupt climate change. Proceedings of the National Academy of Sciences 105:14308–14312. [DOI] [PMC free article] [PubMed] [Google Scholar]
- Derksen‐Hooijberg, M. , Angelini C., Lamers L. P. M., Borst A., Smolders A., Hoogveld J. R. H., de Paoli H., van de Koppel J., Silliman B. R., and van der Heide T.. 2018. Mutualistic interactions amplify saltmarsh restoration success. Journal of Applied Ecology 55:405–414. [Google Scholar]
- Dickie, I. A. , Schnitzer S. A., Reich P. B., and Hobbie S. E.. 2005. Spatially disjunct effects of co‐occurring competition and facilitation. Ecology Letters 8:1191–1200. [DOI] [PubMed] [Google Scholar]
- Drake, J. A. 1991. Community‐assembly mechanics and the structure of an experimental species ensemble. American Naturalist 137:1–26. [Google Scholar]
- Durrett, R. , and Levin S.. 1994. The importance of being discrete (and spatial). Theoretical Population Biology 46:363–394. [DOI] [PubMed] [Google Scholar]
- Epanchin‐Niell, R. S. , and Hastings A.. 2010. Controlling established invaders: integrating economics and spread dynamics to determine optimal management. Ecology Letters 13:528–541. [DOI] [PubMed] [Google Scholar]
- Eppinga, M. B. , Baudena M., Johnson D. J., Jiang J., Mack K. M. L., Strand A. E., and Bever J. D.. 2018. Frequency‐dependent feedback constrains plant community coexistence. Nature Ecology and Evolution 2:1403–1407. [DOI] [PubMed] [Google Scholar]
- Eppinga, M. B. , De Ruiter P. C., Wassen M. J., and Rietkerk M.. 2009a. Nutrients and hydrology indicate the driving mechanisms of peatland surface patterning. American Naturalist 173:803–818. [DOI] [PubMed] [Google Scholar]
- Eppinga, M. B. , Rietkerk M., Borren W., Lapshina E. D., Bleuten W., and Wassen M. J.. 2008. Regular surface patterning of peatlands: confronting theory with field data. Ecosystems 11:520–536. [Google Scholar]
- Eppinga, M. B. , Rietkerk M., Wassen M. J., and De Ruiter P. C.. 2009b. Linking habitat modification to catastrophic shifts and vegetation patterns in bogs. Plant Ecology 200:53–68. [Google Scholar]
- Eppstein, M. J. , Bever J. D., and Molofsky J.. 2006. Spatio‐temporal community dynamics induced by frequency dependent interactions. Ecological Modelling 197:133–147. [Google Scholar]
- Eppstein, M. J. , and Molofsky J.. 2007. Invasiveness in plant communities with feedbacks. Ecology Letters 10:253–263. [DOI] [PubMed] [Google Scholar]
- Gandhi, A. , Levin S., and Orszag S.. 1999. Nucleation and relaxation from meta‐stability in spatial ecological models. Journal of Theoretical Biology 200:121–146. [DOI] [PubMed] [Google Scholar]
- Gilpin, M. E. , Carpenter M. P., and Powerantz M. J.. 1986. The assembly laboratory community: Multi species competition in Drosophila Pages 23–40 in Diamond J. and Case J. J.editors. Community ecology. Harper and Row, New York, New York, USA. [Google Scholar]
- Herman, D. , and Shnerb N.. 2017. Front propagation and effect of memory in stochastic desertification models with an absorbing state. Journal of Statistical Mechanics—Theory And Experiment 8:83404. [Google Scholar]
- Johnson, D. J. , Beaulieu W. T., Bever J. D., and Clay K.. 2012. Conspecific negative density dependence and forest diversity. Science 336:904–907. [DOI] [PubMed] [Google Scholar]
- Jones, C. G. , Lawton J. H., and Shachak M.. 1994. Organisms as ecosystem engineers. Oikos 69:373–386. [Google Scholar]
- Kadowaki, K. , Yamamoto S., Sato H., Tanabe A. S., Hidaka A., and Toju H.. 2018. Mycorrhizal fungi mediate the direction and strength of plant–soil feedbacks differently between arbuscular mycorrhizal and ectomycorrhizal communities. Communications Biology 1:196. [DOI] [PMC free article] [PubMed] [Google Scholar]
- Kéfi, S. , Holmgren M., and Scheffer M.. 2016. When can positive interactions cause alternative stable states in ecosystems? Functional Ecology 30:88–97. [Google Scholar]
- Klausmeier, C. A. 1999. Regular and irregular patterns in semiarid vegetation. Science 284:1826–1828. [DOI] [PubMed] [Google Scholar]
- Knowlton, N. 2004. Multiple “stable” states and the conservation of marine ecosystems. Progress in Oceanography 60:387–396. [Google Scholar]
- Korniss, G. , and Caraco T.. 2005. Spatial dynamics of invasion: the geometry of introduced species. Journal of Theoretical Biology 233:137–150. [DOI] [PubMed] [Google Scholar]
- Koziol, L. , and Bever J. D.. 2015. Mycorrhizal response trades off with plant growth rate and increases with plant successional status. Ecology 96:1768–1774. [DOI] [PubMed] [Google Scholar]
- Koziol, L. , and Bever J. D.. 2017. The missing link in grassland restoration: arbuscular mycorrhizal fungi inoculation increases plant diversity and accelerates succession. Journal of Applied Ecology 54:1301–1309. [Google Scholar]
- Koziol, L. , and Bever J. D.. 2019. Mycorrhizal feedbacks generate positive frequency dependence accelerating grassland succession. Journal of Ecology 107:622–632. [Google Scholar]
- Koziol, L. , Schultz P. A., House G. L., Bauer J. T., Middleton E. L., and Bever J. D.. 2018. The plant microbiome and native plant restoration: the example of native mycorrhizal fungi. BioScience 68:996–1006. [Google Scholar]
- Lewontin, R. C. 1969. The meaning of stability. Brookhaven Symposia in Biology 22:13–24. [PubMed] [Google Scholar]
- Lothe, J. , and Pound G. M.. 1962. Reconsiderations of nucleation theory. Journal of Chemical Physics 36:2080–2085. [Google Scholar]
- Lu, M. , and Hedin L. O.. 2019. Global plant–symbiont organization and emergence of biogeochemical cycles resolved by evolution‐based trait modelling. Nature Ecology & Evolution 3:239–250. [DOI] [PubMed] [Google Scholar]
- Mason, N. W. H. 2007. Are alternative stable states more likely in high stress environments? Logic and available evidence do not support Didham et al. Oikos 116:353–357. [Google Scholar]
- Maxwell, P. S. et al. 2017. The fundamental role of ecological feedback mechanisms for the adaptive management of seagrass ecosystems—a review. Biological Reviews 92:1521–1538. [DOI] [PubMed] [Google Scholar]
- McGuire, K. L. 2007. Common ectomycorrhizal networks may maintain monodominance in a tropical rain forest. Ecology 88:567–574. [DOI] [PubMed] [Google Scholar]
- Middleton, E. L. , and Bever J. D.. 2012. Inoculation with a native soil community advances succession in a grassland restoration. Restoration Ecology 20:218–226. [Google Scholar]
- Middleton, E. L. , Richardson S., Koziol L., Palmer C. E., Yermakov Z., Henning J. A., Schultz P. A., and Bever J. D.. 2015. Locally adapted arbuscular mycorrhizal fungi improve vigor and resistance to herbivory of native prairie plant species. Ecosphere 6:1–16. [Google Scholar]
- Miller, J. E. D. , Damschen E. I., Ratajczak Z., and Özdoğan M.. 2017. Holding the line: three decades of prescribed fires halt but do not reverse woody encroachment in grasslands. Landscape Ecology 32:2297–2310. [Google Scholar]
- Molofsky, J. , and Bever J. D.. 2002. A novel theory to explain species diversity in landscapes: positive frequency dependence and habitat suitability. Proceedings of the Royal Society B 269:2389–2393. [DOI] [PMC free article] [PubMed] [Google Scholar]
- Molofsky, J. , Bever J. D., and Antonovics J.. 2001. Coexistence under positive frequency dependence. Proceedings of the Royal Society of London B 268:273–277. [DOI] [PMC free article] [PubMed] [Google Scholar]
- Moore, E. C. , and Hovel K. A.. 2010. Relative influence of habitat complexity and proximity to patch edges on seagrass epifaunal communities. Oikos 119:1299–1311. [Google Scholar]
- Morgan, J. A. , Milchunas D. G., LeCain D. R., West M., and Mosier A. R.. 2007. Carbon dioxide enrichment alters plant community structure and accelerates shrub growth in the shortgrass steppe. Proceedings of the National Academy of Sciences 104:14724–14729. [DOI] [PMC free article] [PubMed] [Google Scholar]
- Neuhauser, C. , and Pacala S. W.. 1999. An explicitly spatial version of the Lotka‐Volterra model with interspecific competition. Annals of Applied Probability 9:1226–1259. [Google Scholar]
- Oxtoby, D. W. 1992. Homogeneous nucleation: theory and experiment. Journal of Physics: Condensed Matter 4:7627. [Google Scholar]
- Perfecto, I. , Vandermeer J., and Philpott S. M.. 2014. Complex ecological interactions in the coffee agroecosystem. Annual Review of Ecology, Evolution, and Systematics 45:137–158. [Google Scholar]
- Perring, M. P. , Standish R. J., Price J. N., Craig M. D., Erickson T. E., Ruthrof K. X., Whiteley A. S., Valentine L. E., and Hobbs R. J.. 2015. Advances in restoration ecology: rising to the challenges of the coming decades. Ecosphere 6:1–25. [Google Scholar]
- Ratajczak, Z. , D'Odorico P., Collins S. L., Bestelmeyer B. T., Isbell F. I., and Nippert J. B.. 2017a. The interactive effects of press/pulse intensity and duration on regime shifts at multiple scales. Ecological Monographs 87:198–218. [Google Scholar]
- Ratajczak, Z. , D'Odorico P., Nippert J. B., Collins S. L., Brunsell N. A., and Ravi S.. 2017b. Changes in spatial variance during a grassland to shrubland state transition. Journal of Ecology 105:750–760. [Google Scholar]
- Ratajczak, Z. , Nippert J. B., Briggs J. M., and Blair J. M.. 2014. Fire dynamics distinguish grasslands, shrublands and woodlands as alternative attractors in the Central Great Plains of North America. Journal of Ecology 102:1374–1385. [Google Scholar]
- Reijers, V. C. , Cruijsen P. M. J. M., Hoetjes S. C. S., van den Akker M., Heusinkveld J. H. T., van de Koppel J., Lamers L. P. M., Olff H., and van der Heide T.. 2019. Loss of spatial structure after temporary herbivore absence in a high‐productivity reed marsh. Journal of Applied Ecology 56:1817–1826. [Google Scholar]
- Rietkerk, M. , Boerlijst M. C., van Langevelde F., HilleRisLambers R., van de Koppel J., Kumar L., Prins H. H. T., and de Roos A. M.. 2002. Self‐organization of vegetation in arid ecosystems. American Naturalist 160:524–530. [DOI] [PubMed] [Google Scholar]
- Rietkerk, M. , Dekker S. C., De Ruiter P. C., and van de Koppel J.. 2004. Self‐organized patchiness and catastrophic shifts in ecosystems. Science 305:1926–1929. [DOI] [PubMed] [Google Scholar]
- Rietkerk, M. , and van de Koppel J.. 2008. Regular pattern formation in real ecosystems. Trends in Ecology & Evolution 23:169–175. [DOI] [PubMed] [Google Scholar]
- Robinet, C. , Lance D. R., Thorpe K. W., Onufrieva K. S., Tobin P. C., and Liebhold A. M.. 2008. Dispersion in time and space affect mating success and Allee effects in invading gypsy moth populations. Journal of Animal Ecology 77:966–973. [DOI] [PubMed] [Google Scholar]
- Robroek, B. , Eppinga M. B., Limpens J., Wassen M. J., and Schouten M. G. C.. 2009a. Bog restoration in the Netherlands: more than just a dream. Landschap 26:17–26. [Google Scholar]
- Robroek, B. J. , van Ruijven J., Schouten M. G., Breeuwer A., Crushell P. H., Berendse F., and Limpens J.. 2009b. Sphagnum re‐introduction in degraded peatlands: the effects of aggregation, species identity and water table. Basic and Applied Ecology 10:697–706. [Google Scholar]
- Robroek, B. J. M. , Limpens J., Breeuwer A., Crushell P. H., and Schouten M. G. C.. 2007. Interspecific competition between Sphagnum mosses at different water tables. Functional Ecology 21:805–812. [Google Scholar]
- Robroek, B. J. M. , van Ruijven J., Schouten M. G. C., Breeuwer A., Crushell P. H., Berendse F., and Limpens J.. 2009c. Sphagnum re‐introduction in degraded peatlands: The effects of aggregation, species identity and water table. Basic and Applied Ecology 10:697–706. [Google Scholar]
- Ruckelshaus, M. , Hartway C., and Kareiva P.. 1997. Assessing the data requirements of spatially explicit dispersal models. Conservation Biology 11:1298–1306. [Google Scholar]
- Scheffer, M. , and Carpenter S. R.. 2003. Catastrophic regime shifts in ecosystems: linking theory to observation. Trends in Ecology & Evolution 18:648–656. [Google Scholar]
- Scheffer, M. , Carpenter S., Foley J. A., Folke C., and Walker B.. 2001. Catastrophic shifts in ecosystems. Nature 413:591–596. [DOI] [PubMed] [Google Scholar]
- Scheffer, M. , Carpenter S. R., Lenton T. M., Bascompte J., Brock W., Dakos V., van de Koppel J., Van de Leemput I. A., Levin S. A., and Van Nes E. H.. 2012. Anticipating critical transitions. Science 338:344–348. [DOI] [PubMed] [Google Scholar]
- Schneider, M. K. , Law R., and Illian J. B.. 2006. Quantification of neighbourhood‐dependent plant growth by Bayesian hierarchical modelling. Journal of Ecology 94:310–321. [Google Scholar]
- Schröder, A. , Persson L., and De Roos A. M.. 2005. Direct experimental evidence for alternative stable states: a review. Oikos 110:3–19. [Google Scholar]
- Silliman, B. R. , Schrack E., He Q., Cope R., Santoni A., van der Heide T., Jacobi R., Jacobi M., and van de Koppel J.. 2015. Facilitation shifts paradigms and can amplify coastal restoration efforts. Proceedings of the National Academy of Sciences 112:14295–14300. [DOI] [PMC free article] [PubMed] [Google Scholar]
- Siteur, K. , Siero E., Eppinga M. B., Rademacher J. D. M., Doelman A., and Rietkerk M.. 2014. Beyond Turing: The response of patterned ecosystems to environmental change. Ecological Complexity 20:81–96. [Google Scholar]
- Stinson, K. A. , Campbell S. A., Powell J. R., Wolfe B. E., Callaway R. M., Thelen G. C., Hallett S. G., Prati D., and Klironomos J. N.. 2006. Invasive plant suppresses the growth of native tree seedlings by disrupting belowground mutualisms. PLoS Biology 4:e140. [DOI] [PMC free article] [PubMed] [Google Scholar]
- Stoll, P. , and Weiner J.. 2000. A neighborhood view of interactions among individual plants Pages 217–240 in Dieckmann U., Law R., and Metz J., editors. The geometry of ecological interactions: simplifying spatial complexity. Cambridge University Press, Cambridge, UK. [Google Scholar]
- Suding, K. N. , Gross K. L., and Houseman G. R.. 2004. Alternative states and positive feedbacks in restoration ecology. Trends in Ecology & Evolution 19:46–53. [DOI] [PubMed] [Google Scholar]
- Taylor, C. M. , and Hastings A.. 2004. Finding optimal control strategies for invasive species: a density‐structured model for Spartina alterniflora . Journal of Applied Ecology 41:1049–1057. [Google Scholar]
- Taylor, C. M. , and Hastings A.. 2005. Allee effects in biological invasions. Ecology Letters 8:895–908. [Google Scholar]
- Tobin, P. C. , Robinet C., Johnson D. M., Whitmire S. L., Bjørnstad O. N., and Liebhold A. M.. 2009. The role of Allee effects in gypsy moth, Lymantria dispar (L.), invasions. Population Ecology 51:373–384. [Google Scholar]
- Umbanhowar, J. , and McCann K.. 2005. Simple rules for the coexistence and competitive dominance of plants mediated by mycorrhizal fungi. Ecology Letters 8:247–252. [Google Scholar]
- Van Belzen, J. , van de Koppel J., Kirwan M. L., Van Der Wal D., Herman P. J. M., Dakos V., Kéfi S., Scheffer M., Guntenspergen G. R., and Bouma T. J.. 2017. Vegetation recovery in tidal marshes reveals critical slowing down under increased inundation. Nature Communications 8:15811. [DOI] [PMC free article] [PubMed] [Google Scholar]
- van de Koppel, J. , and Crain C. M.. 2006. Scale‐dependent inhibition drives regular tussock spacing in a freshwater marsh. American Naturalist 168:136–147. [DOI] [PubMed] [Google Scholar]
- van de Koppel, J. , Herman P. M. J., Thoolen P., and Heip C. H. R.. 2001. Do alternate stable states occur in natural ecosystems? Evidence from a tidal flat. Ecology 82:3449–3461. [Google Scholar]
- van de Leemput, I. A. , Dakos V., Scheffer M., and van Nes E. H.. 2018. Slow recovery from local disturbances as an indicator for loss of ecosystem resilience. Ecosystems 21:141–152. [DOI] [PMC free article] [PubMed] [Google Scholar]
- van de Leemput, I. A. , van Nes E. H., and Scheffer M.. 2015. Resilience of alternative states in spatially extended ecosystems. PLoS ONE 10:e0116859. [DOI] [PMC free article] [PubMed] [Google Scholar]
- Vandermeer, J. , Jackson D., and Perfecto I.. 2014. Qualitative dynamics of the coffee rust epidemic: educating intuition with theoretical ecology. BioScience 64:210–218. [Google Scholar]
- Vandermeer, J. , and Yitbarek S.. 2012. Self‐organized spatial pattern determines biodiversity in spatial competition. Journal of Theoretical Biology 300:48–56. [DOI] [PubMed] [Google Scholar]
- Vercken, E. , Kramer A., Tobin P., and Drake J.. 2011. Critical patch size generated by Allee effect in gypsy moth, Lymantria dispar (L.). Ecology Letters 14:179–186. [DOI] [PMC free article] [PubMed] [Google Scholar]
- Vogelsang, K. M. , and Bever J. D.. 2009. Mycorrhizal densities decline in association with nonnative plants and contribute to plant invasion. Ecology 90:399–407. [DOI] [PubMed] [Google Scholar]
- von Hardenberg, J. , Meron E., Shachak M., and Zarmi Y.. 2001. Diversity of vegetation patterns and desertification. Physical Review Letters 87:198101. [DOI] [PubMed] [Google Scholar]
- Weerman, E. J. , Van de Koppel J., Eppinga M. B., Montserrat F., Liu Q., and Herman P. M. J.. 2010. Spatial self‐organization on intertidal mudflats through biophysical stress divergence. American Naturalist 176:15–32. [DOI] [PubMed] [Google Scholar]
- Van Wesenbeeck, B. K. , van der Koppel J., Herman P. M. J., and Bouma T. J.. 2008. Does scale‐dependent feedback explain spatial complexity in salt‐marsh ecosystems? Oikos 117:152–159. [Google Scholar]
- Wilson, G. W. , and Hartnett D. C.. 1998. Interspecific variation in plant responses to mycorrhizal colonization in tallgrass prairie. American Journal of Botany 85:1732–1738. [PubMed] [Google Scholar]
- Wilson, J. B. , and Agnew A. D.. 1992. Positive‐feedback switches in plant communities. Advances in Ecological Research 23:263–336. [Google Scholar]
- Wright, J. P. , and Jones C. G.. 2006. The concept of organisms as ecosystem engineers ten years on: progress, limitations, and challenges. BioScience 56:203–209. [Google Scholar]
- Wright, J. P. , Jones C. G., and Flecker A. S.. 2002. An ecosystem engineer, the beaver, increases species richness at the landscape scale. Oecologia 132:96–101. [DOI] [PubMed] [Google Scholar]