Abstract
Nutrient sensing by the mTOR complex 1 (mTORC1) requires its translocation to the lysosomal membrane. Upon amino acids removal, mTORC1 becomes cytosolic and inactive, yet its precise subcellular localization and the mechanism of inhibition remain elusive. Here, we identified Aster‐C as a negative regulator of mTORC1 signaling. Aster‐C earmarked a special rough ER subdomain where it sequestered mTOR together with the GATOR2 complex to prevent mTORC1 activation during nutrient starvation. Amino acids stimulated rapid disassociation of mTORC1 from Aster‐C concurrently with assembly of COP I vesicles which escorted mTORC1 to the lysosomal membrane. Consequently, ablation of Aster‐C led to spontaneous activation of mTORC1 and dissociation of TSC2 from lysosomes, whereas inhibition of COP I vesicle biogenesis or actin dynamics prevented mTORC1 activation. Together, these findings identified Aster‐C as a missing link between lysosomal trafficking and mTORC1 activation by revealing an unexpected role of COP I vesicles in mTORC1 signaling.
Keywords: ARF1, COP I, GRAMD1C, lysosomes, mTORC1
Subject Categories: Membrane & Intracellular Transport, Metabolism, Signal Transduction
This study identifies Aster‐C as a negative regulator of mTORC1 by sequestering mTOR and the GATOR2 complex on rough ER during nutrient starvation. Upon amino acids stimulation, Aster‐C releases the mTORC1 complex which is assorted by COP I vesicles to lysosomal surface for activation.

Introduction
The mechanistic target of rapamycin (mTOR) regulates eukaryotic cell growth and metabolism by sensing changes in environmental cues, including amino acids, glucose, cholesterol, growth factors, and various forms of stress (Yuan et al, 2013). Although how mTORC1 senses and integrates these diverse inputs remains poorly understood, its interaction with both Rag GTPases and vacuolar‐type H+‐ATPase (v‐ATPase) play essential roles in sensing amino acids. Accordingly, the Rag GTPases recruit mTORC1 from an undefined subcellular location to the lysosomal membrane in response to amino acid stimulation, triggering its activation in a Ragulator and v‐ATPase‐dependent manner (Shaw, 2008). Upon removal of amino acids, mTORC1 is rapidly released from Rag GTPases, causing it to become cytosolic and inactive. This “on and off” process is tightly regulated by a growing family of positive and negative regulators of mTORC1 signaling, including the GATOR complexes and a number of GATOR interacting proteins (Saxton & Sabatini, 2017). In contrast to the “on” process, the molecular mechanisms underlying the “off” process remain poorly understood, including the precise subcellular localization of mTOR after its dissociation from lysosomes (Betz & Hall, 2013). Likewise, little is known about the mechanic force involved in the shuttling of the mTOR protein between the cytoplasm and lysosomes.
Aster‐C, also known as GRAMD1C (GRAM Domain Containing 1C), is a member of a highly conserved family of proteins that contain both a GRAM domain and a steroidogenic acute regulatory protein‐related lipid transfer (StART) domain (Fig EV1A) (Besprozvannaya et al, 2018). The GRAM domain containing proteins are known to regulate organelle contacts, whereas the StART domain is implicated in redistribution of phospholipids to different organelles in yeast (Gatta et al, 2015). The GRAMD family of proteins is highly conserved from yeast to humans, suggesting an important functional role. The yeast orthologue of Aster‐C, known as Ltc1, was recently reported to be an ER‐resident protein that regulates sterol transport and organelle contacts (Besprozvannaya et al, 2018), but the function of mammalian GRAMD proteins remains elusive. A recent paper also showed that the Aster family members, including A, B, and C isoforms are involved in lipid trafficking with a high specificity for cholesterol (Besprozvannaya et al, 2018). Aster‐B was specifically required for transport of HDL cholesterol from the plasma membrane to the endoplasmic reticulum (Sandhu et al, 2018). While we were characterizing proteins with a StART domain for their lipid transporter activity, we unexpectedly identified a key role of Aster‐C as a negative regulator of mTORC1 during nutrient starvation, and revealed a surprising role of COP I vesicles in lysosomal trafficking and activation of mTORC1 in mammalian cells.
Figure EV1. Aster‐C deficiency increases cell size and proliferation.
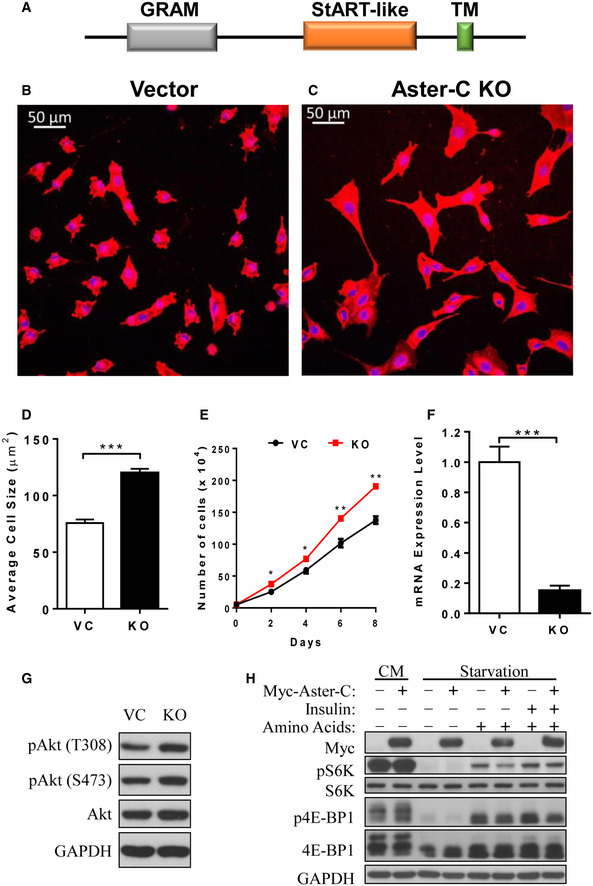
-
ASchematic representation of Aster‐C protein domains.
-
B, CConfocal imaging analysis depicting C2C12‐vector control (Vector, B) and Aster‐C KO (C) cells stained with CellMask™ Deep Red plasma membrane dye for cell size analysis. Cells were stained and analyzed 4 h after seeding. Scale bars, 50 μm.
-
DQuantification of cell size from B and C (n = 100 cells per group). Data are represented as mean ± SD. ***P < 0.001 by Student's t test.
-
ECell proliferation rate analysis of vector and Aster‐C KO C2C12 cells. Data are represented as mean ± SD (n = 3 biological replicates). *P < 0.05 and **P < 0.01 by Student's t test.
-
FReal‐time RT‐PCR analysis of Aster‐C gene expression in vector control and Aster‐C KO C2C12 cells. Data are represented as mean ± SD (n = 3 biological replicates). ***P < 0.001 by Student's t test.
-
GWestern blot analysis of phosphorylation of Akt in Vector and Aster‐C KO C2C12 cells.
-
HWestern blot analysis of mTORC1 activity in HEK293T cells transiently over‐expressing Myc tagged Aster‐C in complete medium (CM), or in response to nutrient starvation and AA and/or insulin stimulation.
Results
Aster‐C deficiency leads to hyper‐activation of mTORC1 and defective autophagy
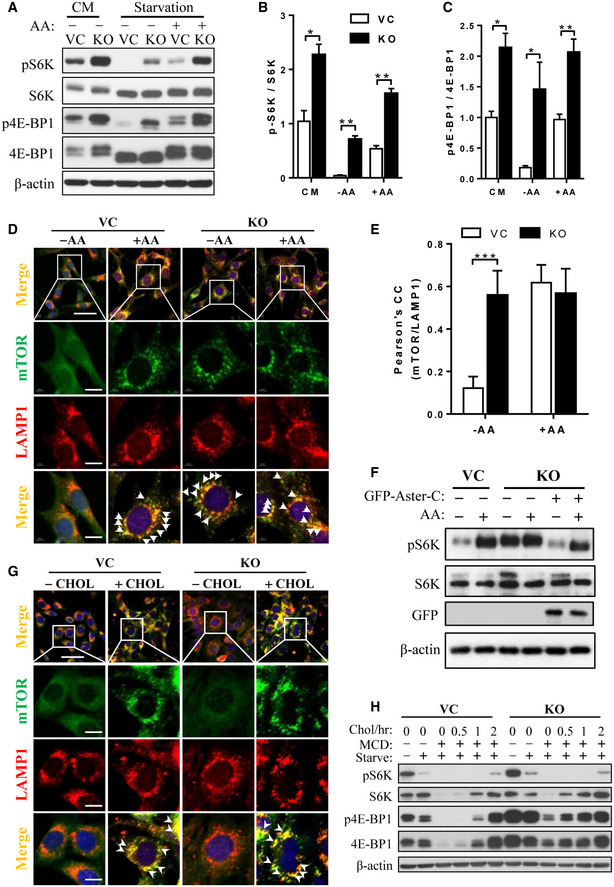
Using CRISPR/Cas9‐mediated gene editing technique, we generated stable C2C12 cells deficient in Aster‐C expression to investigate its function in lipid trafficking. The deletion of Aster‐C, which was confirmed by RT‐PCR analysis (Fig EV1F), leads to mTORC1 hyper‐activation, as evidenced by increased phosphorylation levels of both S6K and 4E‐BP1, the downstream targets of mTORC1 signaling (Fig 1A, quantified in Fig 1B and C). Surprisingly, ablation of Aster‐C also led to constitutive activation of mTORC1 and resistance to nutrient starvation (Fig 1A and F). The hyper‐activation of mTORC1 was prevented by restoration of Aster‐C expression in the Aster‐C KO cells (Fig 1F). Consistent with the findings, Aster‐C deficiency also significantly increased cellular size and growth rate (Fig EV1B–E).
Figure 1. Aster‐C deficiency leads to hyper‐activation of mTORC1.
-
AWestern blot analysis of mTORC1 activity in C2C12‐Vector (VC) and Aster‐C KO (KO) cells in complete medium (CM) and in response to nutrient starvation or stimulation with amino acids for 30 min.
-
B, CStatistical analysis of phosphorylated levels of S6K (B) and 4E‐BP1 (C) in C2C12‐Vector and Aster‐C KO cells in CM, under nutrient starvation (−AA) and in response to stimulation with amino acids (+AA) using ImageJ software. Data are represented as mean ± SD (n = 3 biological replicates). *P < 0.05, **P < 0.01 by Student's t test.
-
DImmunostaining of endogenous mTOR and LAMP1 in C2C12‐Vector and Aster‐C KO cells under nutrient starvation (−AA) and in response to AA stimulation (+AA). LAMP1 was immunostained as a lysosome marker. Arrows highlight the co‐localization of mTOR with LAMP1. Scale bar, 40 μm (Row 1) and 10 μm (Rows 2, 3, 4).
-
EStatistical analysis of the Pearson's correlation coefficient of mTOR and LAMP1 in Fig 1D (n = 12–15 cells per group). Data are represented as mean ± SD. ***P < 0.001 by one‐way ANOVA.
-
FWestern blot analysis of mTORC1 activity in Aster‐C KO cells stably re‐expressing exogenous GFP‐Aster‐C under nutrient starvation and AA stimulation. Aster‐C KO cells were transfected with GFP‐Aster‐C and selected with G418 for 2 weeks.
-
GImmunostaining of endogenous mTOR and LAMP1 in C2C12‐Vector and Aster‐C KO cells under cholesterol depletion by treatment with 0.5% MCD for 2 h (−CHOL) or cholesterol (50 μM) re‐stimulation for 1 h (+CHOL). Arrows highlight the co‐localization of mTOR with LAMP1. Scale bar, 40 μm (Row 1) and 10 μm (Rows 2, 3, 4).
-
HWestern blot analysis of mTORC1 activity in C2C12‐Vector and Aster‐C KO cells in CM, under starvation, cholesterol depletion by treatment with 0.5% MCD for 2 h or cholesterol (50 μM) re‐stimulation for the indicated time.
The mTORC1 complex plays a pivotal role in regulating autophagy in response to changes in nutritional status. We reasoned that constitutive activation of mTORC1 would impair cellular energy homeostasis in Aster‐C‐deficient cells. Indeed, Aster‐C deficiency significantly inhibited autophagic degradation of lipids during starvation, leading to massive accumulation of lipid droplets in the lysosomes (Fig EV2A, green, highlighted by arrows). Accordingly, treatment with rapamycin completely mitigated lysosomal lipids accumulation (Fig EV2A). The defect is likely caused by defective lysosomal degradation of autophagic cargos as a consequence of hyper‐activation of mTORC1, which is supported by the results from lysosomal proteolytic degradation analysis (Fig EV2B). In support of this notion, Aster‐C deficiency also led to accumulation of LC3‐II during starvation (Fig EV2C). A recent study demonstrated that mTORC1 directly inhibits AMPK signaling (Ling et al, 2020). Consistent with the hyper‐activation of mTORC1 in Aster‐C KO cells, the phosphorylation level of ULK1 at S555, a key phosphorylation site by AMPK (Egan et al, 2011a,b), is significantly lower in Aster‐C KO cells during nutrient starvation (Fig EV2C). Since ULK1 at S555 phosphorylation is required for autophagic initiation, the results suggest that hyper‐activation of mTORC1 also caused defective autophagy in Aster‐C KO cells.
Figure EV2. Aster‐C deficiency causes lipid droplets accumulation in lysosomes.
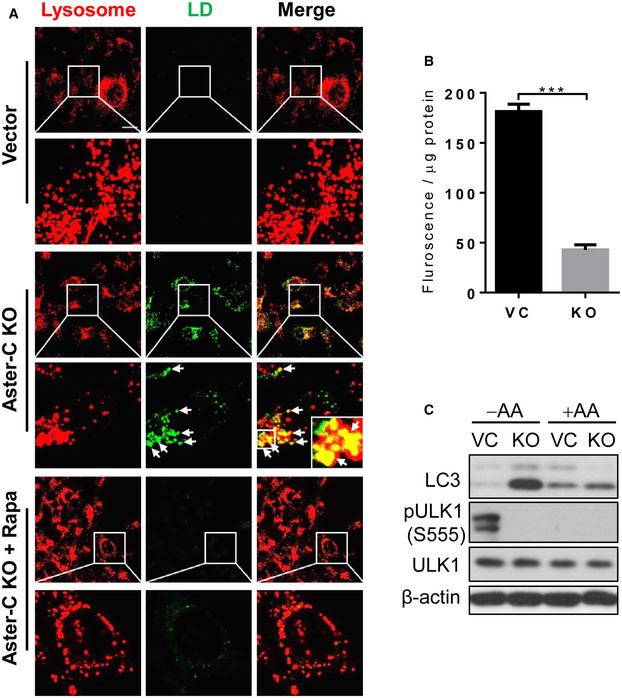
- Confocal image analysis of lipid droplets in C2C12‐vector control (Vector) and Aster‐C KO cells stained with LysoTracker Red under nutrient starvation in the presence or absence of rapamycin (Rapa) treatment. Lipid droplets were stained using BODIPY™ 650/665‐X according to the manufacturer's instruction. Arrows highlight the accumulation of lipid droplets in the lysosomes. Scale bar, 20 μm.
- Lysosomal proteolytic degradation assay in C2C12‐Vector and Aster‐C KO cells under nutrient starvation using DQ‐red‐BSA as described in Materials and Methods. Data are represented as mean ± SD (n = 3 biological replicates). ***P < 0.001 by Student's t test.
- Western blot analysis of LC3 and phosphorylated ULK1 (S555) level in C2C12‐Vector and Aster‐C KO cells in response to nutrient starvation and AA stimulation.
Aster‐C coordinates with TSC2 to prevent lysosomal association and trafficking of mTORC1 during nutrient starvation
As a hallmark of mTORC1 activation, mTOR becomes punctated and translocated to the lysosomal membrane in response to amino acid stimulation (Sancak et al, 2010). Consistent with this notion, we showed that mTOR protein exhibited as a homogenous and cytoplasmic pattern during starvation, but quickly became punctated and co‐localized with the lysosomes in response to amino acids, as shown by the results from confocal imaging analysis of immunofluorescence‐stained endogenous mTOR and LAMP1, a lysosome marker (Fig 1D, arrows indicate the co‐localization of mTOR and LAMP1, and Pearson's correlation coefficient of mTOR and LAMP1 was quantified in Fig 1E). The results were further confirmed in live C2C12 cells transiently expressing YFP‐mTOR and stained with LysoTracker Red (Fig EV3A, arrows indicate the co‐localization of mTOR and lysosomes, and the Pearson's correlation coefficient of mTOR and lysosomes was quantified in Fig EV3B). In contrast, ablation of Aster‐C caused spontaneous mTORC1 puncta formation and lysosomal association in nutrient‐starved C2C12 cells (Figs 1D and EV3A, quantified in Figs 1E and EV3B, respectively), further confirming that mTORC1 was constitutively activated.
Figure EV3. Aster‐C deficiency renders mTORC1 constitutively activated in live C2C12 cells.
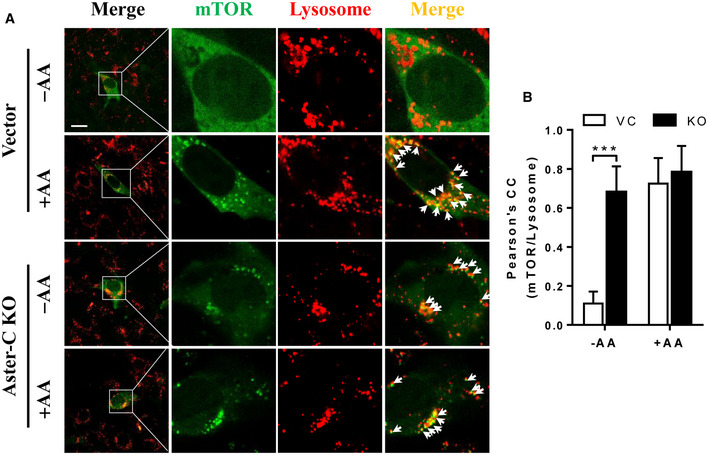
- Confocal imaging analysis depicting YFP‐mTOR (green) and lysosomes (red) in live C2C12 Aster‐C KO and Vector cells transiently transfected with YFP‐mTOR under nutrient starvation (−AA) and in response to AA stimulation (+AA). Arrows highlight co‐localization of mTOR with lysosomes. Scale bar, 20 μm.
- Statistical analysis of the Pearson's correlation coefficient of mTOR and lysosomes in A (n = 10–15 cells per group). Data are represented as mean ± SD. ***P < 0.001 by one‐way ANOVA.
The Aster family of proteins were recently shown to play an important role in cholesterol trafficking from the plasma membrane to the ER (Besprozvannaya et al, 2018). Since lysosomal cholesterol is required for mTORC1 activation (Castellano et al, 2017), and the ER‐lysosome contact sites are signaling hubs that enable cholesterol sensing by mTORC1 (Lim et al, 2019), we next investigated whether Aster‐C regulates mTORC1 activation through its projected role in ER cholesterol trafficking (Sandhu et al, 2018). Remarkably, Aster‐C‐deficient cells remained sensitive to the cholesterol depletion by methyl‐β‐cyclodextrin (MCD) and cholesterol stimulation, as indicated by the immunofluorescence analysis of mTOR and LAMP1 (Fig 1G, arrows indicate the co‐localization of mTOR and LAMP1), suggesting that the effect of Aster‐C on mTORC1 activation is independent from its potential role in cholesterol trafficking. This notion is further supported by our observation that Aster‐C deficient cells were more sensitive to cholesterol‐stimulated mTORC1 activation, as evidenced by increased phosphorylation levels of both S6K and 4E‐BP1 (Fig 1H). Aster‐C deficiency also led to increased Akt phosphorylation (Fig EV1G), which is likely caused by hyper‐growth of the Aster‐C‐deficient cells (Fig EV1E). However, overexpression of Aster‐C did not significantly inhibit mTORC1 signaling (Fig EV1H), suggesting that Aster‐C is a negative regulator but not an inhibitor of mTORC1 signaling.
The phenotype of Aster‐C‐deficient cells shares remarkable similarity with that of cells deficient in tuberous sclerosis complex 2 (TSC2), an essential inhibitor of mTORC1 signaling (Demetriades et al, 2014; Menon et al, 2014). TSC2 deficiency caused hyper‐activation of mTORC1 by preventing the release of mTORC1 from the lysosomes upon amino acid withdrawal (Demetriades et al, 2014). We next determined a role of Aster‐C in regulating the release of the TSC2 complex in response to amino acid stimulation by confocal imaging analysis of C2C12 cells immunostained with antibodies to endogenous TSC2 and LAMP1. As shown in Fig EV4A, TSC2 co‐localized well with LAMP1 during amino acid starvation, but quickly dissociated from lysosomes in response to amino acid stimulation in C2C12 vector control cells. In contrast, Aster‐C deficiency prevented lysosomal association of TSC2 upon amino acid starvation (Fig EV4A, quantified by Pearson's correlation coefficient of TSC2 and LAMP1 in Fig EV4B), further confirming that mTORC1 was hyper‐activated by Aster‐C deficiency. Consistent with the findings, the phosphorylation level of TSC2 was also significantly higher in Aster‐C KO cells both under amino acid starvation and re‐stimulation (Fig EV4C). However, Aster‐C did not directly interact with TSC2, as evidenced by results from co‐IP analysis when either Aster‐C or TSC2 was used as the “bait” in HEK293T cells transiently expressing FLAG‐tagged Aster‐C (Fig EV4D and E), suggesting Aster‐C indirectly regulates lysosomal association of TSC2.
Figure EV4. Aster‐C prevents lysosomal association of TSC2 during nutrient starvation.
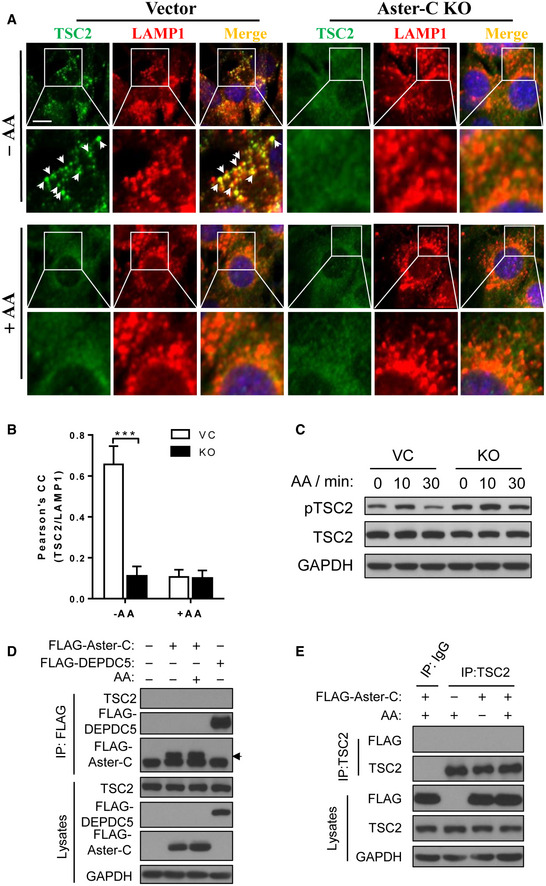
- Immunostaining of endogenous TSC2 and LAMP1 in C2C12‐Vector and Aster‐C KO cells under nutrient starvation (−AA) and in response to AA stimulation (+AA). Arrows highlight co‐localization of TSC2 with LAMP1. Scale bar, 10 μm.
- Statistical analysis of the Pearson's correlation coefficient of TSC2 and LAMP1 in A (n = 10–15 cells per group). Data are represented as mean ± SD. ***P < 0.001 by one‐way ANOVA.
- Western blot analysis of phosphorylation of TSC2 in C2C12‐Vector and Aster‐C KO cells under starvation and amino acid re‐stimulation for 10 or 30 min.
- Co‐IP analysis of the interaction of Aster‐C with TSC2 in HEK293T cells transiently expressing FLAG‐Aster‐C in response to starvation and AA stimulation. FLAG‐DEPDC5 was used as a negative control. Anti‐FLAG antibody was used for immunoprecipitation. Black arrow indicates the FLAG‐tagged Aster‐C protein.
- Co‐IP analysis of the interaction of Aster‐C with TSC2 in HEK293T cells transiently expressing FLAG‐Aster‐C in response to starvation and AA stimulation. Anti‐TSC2 antibody was used for immunoprecipitation.
Aster‐C sequesters mTORC1 with the GATOR2 complex at rough ER during nutrient starvation
To uncover the cellular mechanisms by which Aster‐C regulates mTORC1 activation, we next determined the subcellular localization of Aster‐C in live C2C12 (Fig 2A) and COS‐7 cells (Appendix Fig S1) transiently expressing GFP‐tagged Aster‐C and DsRed‐ER, an ER marker protein. The results showed that Aster‐C is an ER‐resident protein whose subcellular localization was not regulated by amino acids. The findings are consistent with a recent report that Ltc1, the yeast ortholog of Aster‐C, is localized at the ER (Murley et al, 2015). It is widely accepted that mTOR is cytoplasmic during nutrient starvation and translocated to lysosomal membranes upon activation. However, the precise subcellular localization of mTOR during nutrient starvation remains poorly understood. We next carried out subcellular fractionation analysis in HEK293T cells to determine whether mTOR and Aster‐C co‐localize, and if so, whether the co‐localization is regulated by amino acids. HEK293T cells transiently transfected with FLAG‐tagged Aster‐C were fractionated into the cytosol, rough ER (RER), lysosomal, and microsomal fractions by differential centrifugation, followed by Western blot analysis of Aster‐C, mTOR, WDR24, and Mios (two components of the GATOR2 complex). The blot was also probed with anti‐Sec63, LAMP1, and GAPDH antibodies as biomarkers for the RER, lysosomal, and cytosolic proteins, respectively. The results showed that Aster‐C is exclusively localized at the RER (Fig 2B), which is consistent with our findings from confocal imaging analysis (Fig 2A). These results also indicated that the transiently expressed tagged Aster‐C protein were functional in cells, though it is better to directly detect subcellular localization of the endogenous Aster‐C or generate a cell line stably expressing Aster‐C by lentiviral transduction. Remarkably, both mTOR and the GATOR2 complex are predominantly localized at the RER during amino acid starvation (Fig 2B). In response to AA stimulation, both mTOR and GATOR2 complex, but not Aster‐C, translocated from the RER to lysosomes both in HEK293T and C2C12 vector control cells (Fig 2B and C). In contrast, Aster‐C deficiency caused a significant shift of mTOR and WDR24 from the RER fraction to the lysosomal fraction during amino acid starvation when compared with those in the vector control cells (Fig 2C). In contrast to vector control cells, amino acids failed to stimulate translocation of mTOR and WDR24 from the RER to lysosomes (Fig 2C).
Figure 2. Aster‐C regulates mTORC1 activity by selectively interacting with the GATOR2 complex.
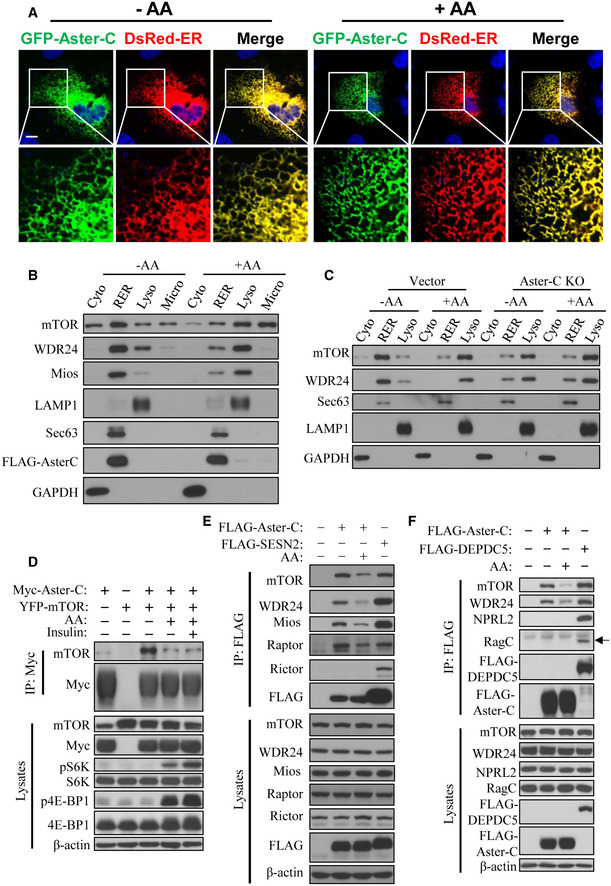
- Confocal image analysis depicting the co‐localization of Aster‐C with the ER in C2C12 cells transiently expressing GFP‐Aster‐C and DsRed‐ER under starvation and in response to AA stimulation. Scale bar, 5 μm.
- Subcellular fractionation analysis of mTOR, GATOR2 complex, and Aster‐C localization in HEK293T cells transiently expressing FLAG‐Aster‐C under starvation and in response to AA stimulation. LAMP1, Sec63, and GAPDH were used as lysosomal (Lyso), rough ER (RER), and cytosol (Cyto) protein markers, respectively. Microsomal fraction (Micro) was also used in the blot.
- Subcellular fractionation analysis of mTOR and GATOR2 complex in C2C12‐Vector and Aster‐C KO cells under starvation and in response to AA stimulation. LAMP1, Sec63, and GAPDH were used as lysosomal (Lyso), rough ER (RER), and cytosol (Cyto) protein markers, respectively.
- Co‐IP analysis of the interaction of Aster‐C with exogenous mTOR in response to starvation and AA or insulin stimulation in HEK293T cells transiently expressing the indicated proteins. Anti‐Myc antibody was used for immunoprecipitation.
- Co‐IP analysis of the interaction of Aster‐C with endogenous mTOR and the GATOR2 complex using FLAG‐Sestrin2 (SESN2) as a positive control in HEK293T cells transiently expressing the indicated proteins. Anti‐FLAG antibody was used for immunoprecipitation.
- Co‐IP analysis of the interaction of Aster‐C with mTOR, the GATOR2 complex, GATOR1 complex, and the Ragulator‐Rag complex using FLAG‐DEPDC5 as a positive control in HEK293T cells transiently expressing the indicated proteins. Anti‐FLAG antibody was used for immunoprecipitation. Black arrow indicates the RagC protein.
The findings that Aster‐C co‐localized with mTOR and components of GATOR2 at the RER during starvation prompted us to investigate whether Aster‐C interacts with mTORC1 and its upstream regulators, including GATOR1 and GATOR2 complexes by co‐immunoprecipitation (co‐IP) analysis. Using Myc/FLAG‐tagged Aster‐C as the “bait”, we showed that Aster‐C specifically interacted with both the YFP‐tagged mTOR transiently expressing in HEK293T cells (Fig 2D) and the endogenous mTOR protein (Fig 2E and F). The interaction was diminished in response to amino acid stimulation. Aster‐C also interacted with Raptor, but not Rictor, suggesting that Aster‐C specifically interacted with mTORC1, but not the mTORC2 complex (Fig 2E). Using DEPDC5 and Sestrin2 (SESN2) as positive controls for the GATOR1 complex and the upstream inhibitor of the GATOR2 complex, respectively, for the co‐IP analysis, we showed that Aster‐C selectively interacted with multiple components of the GATOR2 complex, including the endogenous Mios and WDR24 (Fig 2E and F). Like mTORC1, these interactions were also weakened by amino acid stimulation. In contrast, Aster‐C did not interact with any components of the GATOR1 complex or the Ragulator‐Rag complex, as represented by NPRL2 and RagC, respectively, in the co‐IP analysis (Fig 2F). Together, the findings confirmed the results from subcellular fractionation analysis, indicating that Aster‐C prevents mTORC1 activation during nutrient starvation, in part, by selectively interacting with the GATOR2 complex, the positive regulator of mTORC1.
Aster‐C selectively interacts with multiple components of COP I vesicles
To gain mechanistic insights into how Aster‐C regulates mTORC1 trafficking and activity, we next carried out proteomic analysis to identify Aster‐C binding proteins by mass spectrometric analysis. Using Aster‐C as the “bait” for the co‐IP analysis and an empty vector as the negative control, we identified more than 60 Aster‐C‐specific binding proteins by mass spectrometric analysis (Table EV1 and Appendix Fig S2). Strikingly, the most abundant Aster‐C‐binding proteins are those involved in COP I vesicle assembly and trafficking, including multiple coatomer proteins (COPA, COPB1, COPB2, COPE, COPG1, COPG2), non‐muscle myosin heavy chain 10 (MYH10), and a family of cytoskeletal proteins involved in the transport of COP I vesicles. Intriguingly, Aster‐C also interacts well with multiple components of the nuclear pore complex (NPC). NPC shares its core architecture with that of vesicle‐coating complexes, such as COP I, COP II, and clathrin in budding yeast (Dokudovskaya & Rout, 2015). Our findings are corroborated by a recent report that NPC is a part of the SEA complex (Seh1‐associated) which consists of both GATOR1 and GATOR2 subcomplexes in yeast (Dokudovskaya & Rout, 2015).
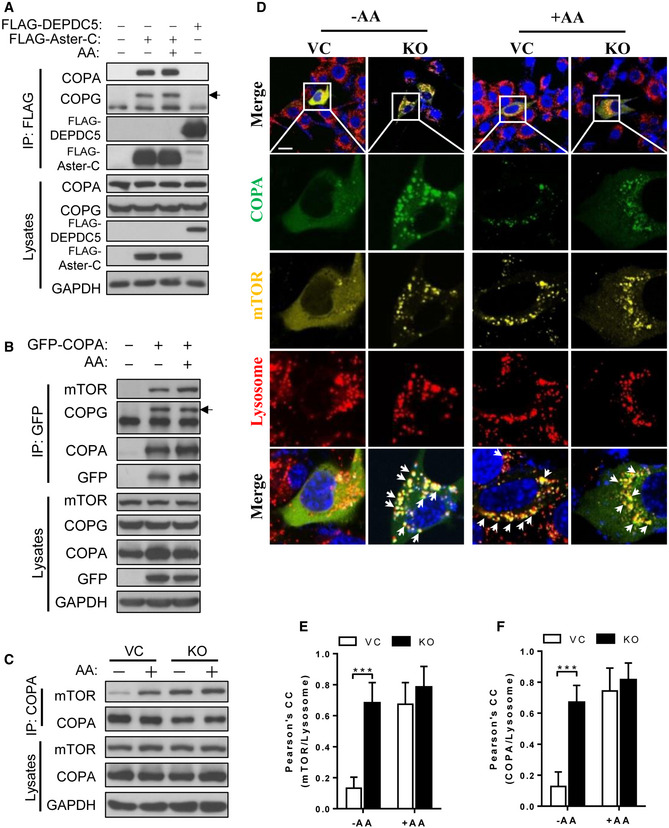
The COP I vesicles mediate both anterograde and retrograde traffic of cargoes between the cis‐Golgi and the rough ER (Brandizzi & Barlowe, 2013). The findings that Aster‐C selectively interacts with multiple components of COP I vesicles raised the question whether COP I vesicles are also required for lysosomal trafficking and activation of mTORC1. To provide answers to this question, we first confirmed the specificity of the interactions by co‐IP analysis. The results showed that Aster‐C indeed selectively binds to the endogenous COPA and COPG (Fig 3A). In contrast, DEPDC5, a component of the GATOR1 complex which was used as the negative control for the co‐IP analysis, did not bind to either endogenous COPA or COPG in HEK293T cells transiently expressing FLAG‐Aster‐C or FLAG‐DEPDC5. Additionally, COPA also selectively interacted with endogenous mTOR, which was enhanced in response to amino acid stimulation (Fig 3B). Consistent with our proteomic data, GFP‐COPA also selectively interacted with endogenous COPG (Fig 3B), suggesting that attachment of a GFP tag to COPA protein did not affect its biological function. Consistent with these findings, we further showed that endogenous COPA also specifically interacted with endogenous mTOR, and the binding affinity was also significantly enhanced by amino acid stimulation (Fig 3C). Strikingly, Aster‐C deficiency significantly enhanced the interaction of COPA and mTOR during nutrient starvation (Fig 3C), suggesting a role for COP I vesicle in lysosomal trafficking and activation of mTORC1. In support of this notion, COPA also became punctated and co‐localized well with lysosomes in response to amino acid stimulation, as shown by the confocal imaging analysis of C2C12 cells transiently expressing GFP‐COPA and stained ER with ER‐Tracker Red. (Fig EV5A), and transiently expressing GFP‐COPA and stained lysosomes with LysoTracker Red (Fig EV5B).
Figure 3. COP I vesicle assembly is required for the trafficking, activation and lysosomal association of mTORC1.
-
ACo‐IP analysis of the interaction of Aster‐C with COPA and COPG in response to starvation and AA stimulation using FLAG‐DEPDC5 as a negative control in HEK293T cells transiently expressing the indicated proteins. Anti‐FLAG antibody was used for immunoprecipitation. Black arrow indicates the COPG protein.
-
BCo‐IP analysis of the interaction of COPA with mTOR in HEK293T cells transiently expressing GFP‐COPA in response to starvation and AA stimulation. Anti‐GFP antibody was used for immunoprecipitation. Black arrow indicates the COPG protein.
-
CCo‐IP analysis of the interaction of COPA with mTOR in C2C12‐Vector and Aster‐C KO cells in response to starvation and AA stimulation. Anti‐COPA antibody was used for immunoprecipitation.
-
DConfocal imaging analysis depicting the co‐localization of YFP‐mTOR (yellow) with GFP‐COPA (green) and lysosomes (red) in live C2C12‐Vector and Aster‐C KO cells in response to nutrient starvation and re‐stimulation by AA. Arrows highlight co‐localization of mTOR, COPA, and lysosomes. Scale bar, 20 μm.
-
E, FStatistical analysis of the Pearson's correlation coefficient of mTOR/Lysosome (E) and COPA/Lysosome (F) in Fig 3D (n = 10–12 cells per group). Data are represented as mean ± SD. ***P < 0.001 by one‐way ANOVA.
Figure EV5. Amino acids stimulate the biogenesis and lysosomal association of COP I vesicles.
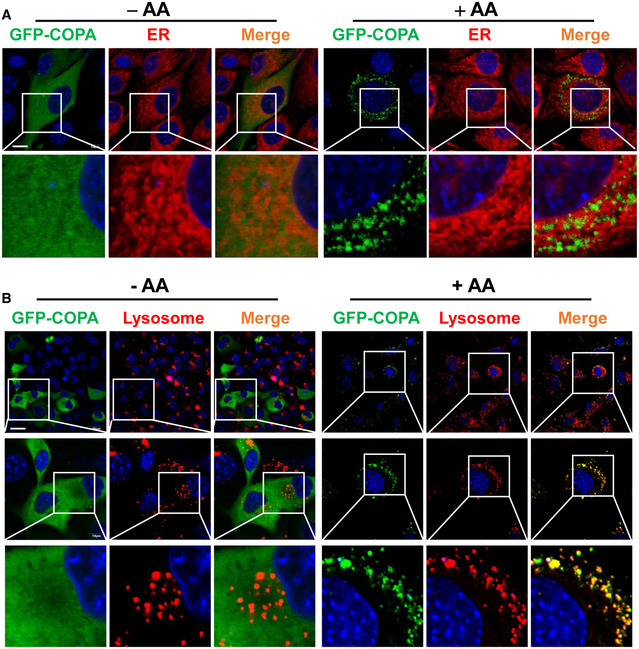
- Confocal image analysis the co‐localization of COPA with the ER in live C2C12 cells transiently expressing GFP‐COPA and stained ER with ER‐Tracker Red under starvation and in response to AA stimulation. Scale bar, 10 μm.
- Confocal image analysis co‐localization of COPA with lysosomes in live C2C12 cells transiently expressing GFP‐COPA and stained with LysoTracker Red under starvation and in response to AA stimulation. Scale bar, 30 μm.
Aster‐C couples COP I vesicles biogenesis with mTORC1 trafficking and activation on lysosomes
COP I‐mediated protein traffic begins with vesicle budding, which is catalyzed by ADP ribosylation factor‐1 (ARF1), followed by vesicle assembly with coatomer proteins, and finally transported by myosin motors along the actin filaments (Beck et al, 2008). We next determined whether the binding of mTOR with COPA is required for the translocation of mTORC1 to lysosomes in live C2C12 cells. Using GFP‐COPA as the surrogate for COP I vesicles, we showed that both mTOR and COPA exhibited homogeneous and cytoplasmic distribution during nutrient starvation in live C2C12 cells transiently expressing YFP‐mTOR and GFP‐COPA and stained with LysoTracker Red (Fig 3D). In response to amino acids, COPA became punctated, and completely co‐localized with mTORC1 puncta on lysosomal membranes, implicating a potential role of COP I vesicles in mTORC1 trafficking and activation. In support of this notion, Aster‐C deficiency led to spontaneous formation of mTOR puncta which co‐localized with the COPA puncta on lysosomal membranes during nutrient starvation (Fig 3D, highlighted by arrows, and Pearson's correlation coefficient of mTOR/lysosome and COPA/lysosome were quantified in Fig 3E and F, respectively).
It is generally believed that COPI vesicles are below the resolution of the conventional light microscopy, which raised an intriguing question whether COPA puncta became visible only after their association with lysosomes. We answered this question by analyzing the sequential events of the formation of COPA puncta, mTORC1 puncta, and their association with lysosomes by time‐lapse confocal microscopy in live C2C12 cells transiently expressing GFP‐COPA and YFP‐mTOR, and stained with LysoTracker Red. The results showed that COPA promptly became punctated in response to amino acid stimulation. It seems that a few COPA puncta formed prior to their association with mTORC1 or lysosomes in the beginning of amino acid stimulation (Fig 4, bottom panel, highlighted by arrows). In contrast, mTORC1 puncta never appeared alone but always associated with COPA. Moreover, a few mTORC1 puncta already became visible prior to their lysosomal association, as examined by time‐lapse confocal imaging analysis in live COS‐7 cells (Movie EV1). All COPA and mTORC1 puncta were fully associated with lysosomes at later stage of stimulation. Together, these findings suggest that COPA formed puncta with mTORC1 prior to their association with lysosomes.
Figure 4. COP I vesicle moves with mTORC1 to the lysosome surface upon amino acid stimulation.
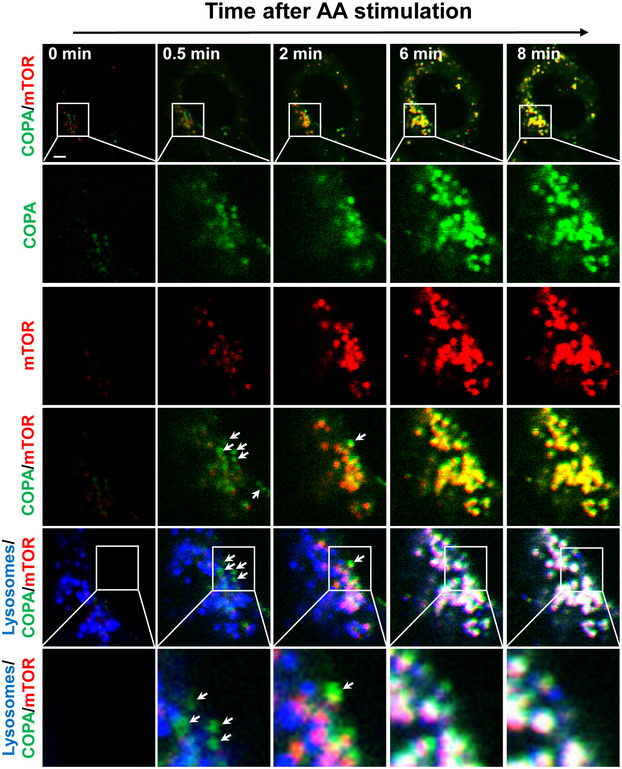
Time‐lapse confocal imaging analysis of the co‐localization of YFP‐mTOR (red) with GFP‐COPA (green) and lysosomes (blue) in live C2C12 cells under nutrient starvation (0 min), and in response to AA re‐stimulation for indicated time (0.5, 2, 6 and 8 min). Arrows highlight COPA puncta that were co‐localized with mTOR or COPA puncta alone prior to their association with mTOR and lysosomes. Scale bar, 5 μm.
Data information: Data are representative of two independent experiments.
COP I vesicle assembly is required for mTORC1 activation
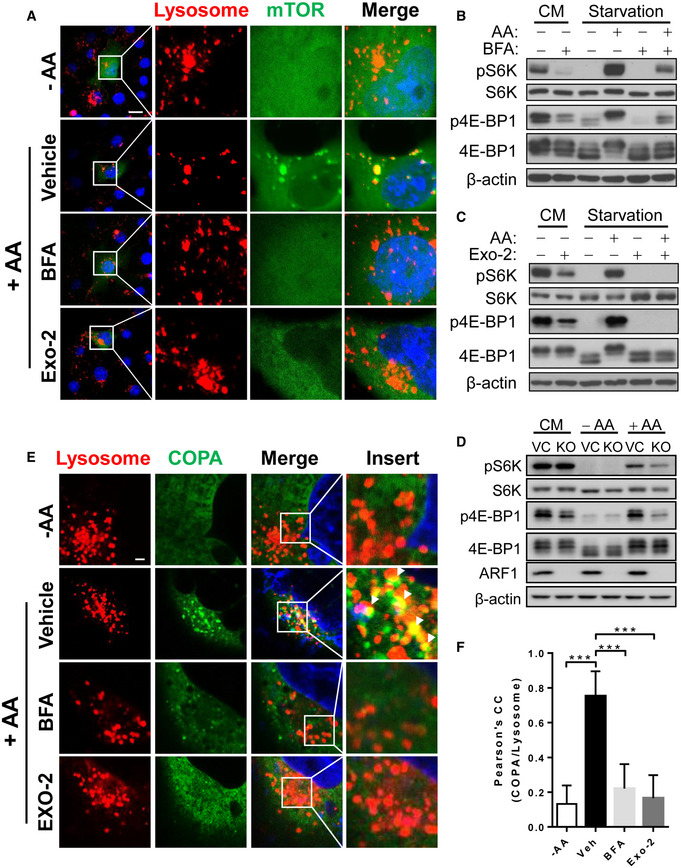
During COP I vesicle‐mediated protein transport, the assembly of the coat complexes and the selection of cargo proteins must be coordinated with the subsequent translocation of vesicles from the donor to an acceptor compartment (Brandizzi & Barlowe, 2013). ARF1 is a small GTPase that is required for the assembly of COP I vesicles by inducing membrane curvature and polymerization of coat proteins (Beck et al, 2008). A previous study showed that ARF1 is also required for mTORC1 activation and lysosomal localization by glutamine (Jewell et al, 2015). Intriguingly, ARF1 also directly interacts with vacuolar v‐GTPase, which is required for mTORC1 activation in yeast (Dechant et al, 2014). Yeast vacuoles are equivalent to mammalian lysosomes, raising the possibility that ARF1 may coordinate COP I vesicle assembly with nutrient sensing by mTORC1 on the lysosomal membranes. We tested this possibility by determining whether ARF1 is required for mTORC1 activation. Indeed, treatment of cells with brefeldin A (BFA) or Exo‐2, two small‐molecule inhibitors of ARF1, significantly inhibited mTORC1 activity, as evidenced by confocal imaging analysis of the lysosomal association of mTOR in live C2C12 cells transiently expressing YFP‐mTOR (Fig 5A), and also by decreased phosphorylation of both S6K and 4E‐BP1 (Fig 5B and C). These results were consistent with the previous study in which BFA inhibited glutamine induced mTORC1 activation and localization to the lysosomes (Jewell et al, 2015). We also generated ARF1 knockout C2C12 cells by using CRISPR/Cas9 gene editing and investigated the role of ARF1 in mTORC1 activation. ARF1 deficiency prevented mTORC1 activation, as evidenced by decreased phosphorylation of S6K and 4E‐BP1 (Fig 5D), and decreased the co‐localization of mTOR with lysosomes (Appendix Fig S3) upon amino acid stimulation. Consistent with the findings, inhibition of COP I vesicle assembly by BFA or Exo‐2 also prevented the COPA puncta formation and association with lysosomes, as evidenced by results from confocal imaging analysis of C2C12 cells transiently expressing GFP‐COPA and stained with LysoTracker Red (Fig 5E, and the Pearson's correlation coefficient of COPA and lysosomes was quantified in Fig 5F).
Figure 5. Inhibition of ARF1 attenuates the activation of mTORC1 by amino acid stimulation.
-
AConfocal imaging analysis depicting the lysosomal association of mTOR in response to AA stimulation in the presence or absence of BFA (10 μM) or Exo‐2 (10 μM) in live C2C12 cells transiently expressing YFP‐mTOR and stained with LysoTracker Red. Scale bar, 20 μm.
-
B, CWestern blot analysis of mTORC1 activity in C2C12 cells in CM, in response to nutrient starvation and AA stimulation in the presence or absence of BFA (10 μM) (B) or Exo‐2 (10 μM) (C).
-
DWestern blot analysis of mTORC1 activity in C2C12‐Vector and ARF1 KO cells in CM, in response to nutrient starvation and AA stimulation.
-
EConfocal imaging analysis depicting COPA puncta (green) formation and co‐localization with lysosomes (red) in live C2C12 cells transiently expressing GFP‐COPA and stained with LysoTracker Red in response to nutrient starvation and AA stimulation in the presence or absence of BFA (10 μM) or Exo‐2 (10 μM). Arrows highlight co‐localization of COPA with lysosomes. Scale bar, 5 μm.
-
FStatistical analysis of Pearson's correlation coefficient of COPA and lysosomes in Fig 5E (n = 10–15 cells per group). Data are represented as mean ± SD. ***P < 0.001 by one‐way ANOVA.
Aster‐C coordinates with non‐muscle myosin II to regulate mTOR trafficking by COP I vesicles
MYH10, also known as non‐muscle myosin IIB heavy chain, is required for both COP I vesicle budding and retrograde actin flow (Duran et al, 2003). MYH10 is one of the most abundant Aster‐C‐binding proteins (Table EV1). Consistent with the finding, Aster‐C specifically interacted with the endogenous MYH10, as evidenced by results from co‐IP analysis in HEK293T cells transiently expressing FLAG‐Aster‐C (Fig 6A). The binding affinity was enhanced by inhibition of COP I vesicle assembly with BFA, yet diminished by inhibition of MYH10 with blebbistatin (BBS). Treatment with BFA or BBS also significantly decreased the binding affinity of Aster‐C with WDR24 and MIOS (Fig 6A), further supporting the notion that Aster‐C serves as a potential docking site for COP I vesicles. Consistent with this notion, the binding affinity of Aster‐C with COPA is not affected by either BFA or BBS (Fig 6A).
Figure 6. Aster‐C coordinates with non‐muscle myosin to regulate mTORC1 trafficking and activation.
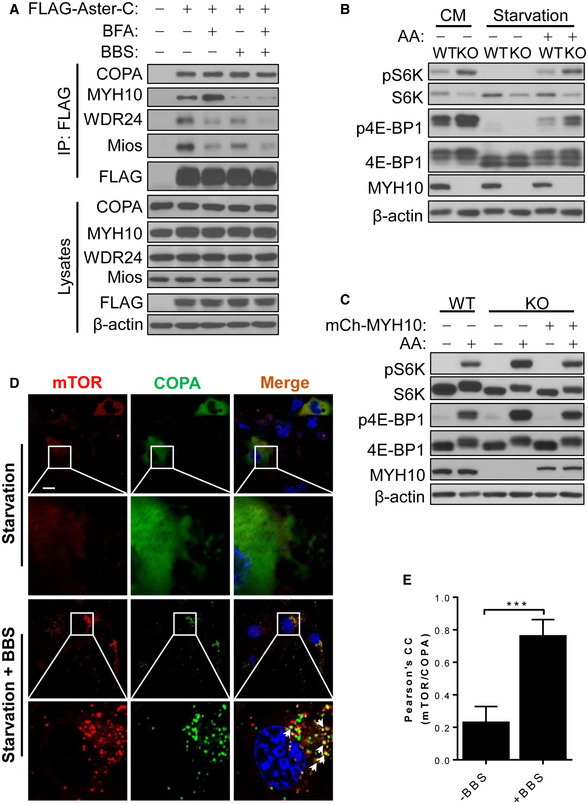
- Co‐IP analysis of the interaction of Aster‐C with COPA, MYH10, WDR24, and Mios in HEK293T cells transiently expressing the indicated proteins in response to treatment with brefeldin A (BFA, 10 μM) and/or blebbistatin (BBS, 10 μM), inhibitors of ARFs and MYH10, respectively. Anti‐FLAG antibody was used for immunoprecipitation.
- Western blot analysis of mTORC1 activity in wild‐type (WT) and MYH10 KO MEF cells cultured in CM, or in response to starvation and AA stimulation.
- Western blot analysis of mTORC1 activity in MYH10 KO MEF cells with stably re‐expressed exogenous mCherry‐MYH10 in response to starvation and AA stimulation. MYH10 KO MEF cells were transfected with mCherry‐MYH10 and selected with G418 for 2 weeks.
- Confocal imaging analysis depicting COPA puncta (green) formation and co‐localization with mTOR (red) in live C2C12 cells transiently expressing GFP‐COPA and YFP‐mTOR in response to nutrient starvation in the presence or absence of BBS (10 μM). Arrows highlight the co‐localization of mTOR with COPA. Scale bar, 20 μm.
- Statistical analysis of the Pearson's correlation coefficient of mTOR and COPA in Fig 6D (n = 10–12 cells per group). Data are represented as mean ± SD. ***P < 0.001 by Student's t test.
We next questioned whether the binding of Aster‐C with MYH10 is required for the sequestration of mTORC1 during starvation. Using mouse embryonic fibroblasts (MEFs) from the MYH10 knockout mice (Takeda et al, 2003), we showed that MYH10 deficiency caused mTORC1 hyper‐activation, as evidenced by increased S6K and 4E‐BP1 phosphorylation in MEFs (Fig 6B). Conversely, restoration of MYH10 expression in MYH10 KO MEF cells normalized the mTORC1 activity in response to amino acid stimulation (Fig 6C). Consistent with these findings, inhibition of MYH10 by BBS caused spontaneous formation of mTORC1 puncta which co‐localized with those of COPA, as revealed by results from confocal imaging analysis of live C2C12 cells transiently expressing GFP‐COPA and YFP‐mTOR (Fig 6D, and the Pearson's correlation coefficient of mTOR and COPA was quantified in Fig 6E). Our findings are consistent with the phenotype of the MYH10 knockout mice which exhibited dilated cardiomyopathy and enlarged cardiomyocytes size (Takeda et al, 2003), since mTORC1 hyper‐activation is implicated in various forms of dilated cardiomyopathy (Sciarretta et al, 2014).
Disruption of actin filaments assembly prevents mTORC1 activation
ARF1‐dependent polymerization of actin is required for COP I vesicle trafficking. Accordingly, nutrients stimulate robust formation of actin filaments (Jacinto et al, 2004), whereas ablation of Rac1, a member of the Rho GTPase family that coordinates with ARF1 in cytoskeletal assembly, inhibits mTORC1 activation (Saci et al, 2011). These findings prompted us to test the hypothesis that actin polymerization is also required for mTORC1 activation in response to amino acid stimulation. The results showed that mTOR rapidly became punctated, as expected, in response to amino acid stimulation. However, most of the puncta were closely associated with the actin filaments, suggesting a role of actin filaments in mTOR activation (Fig 7A, as shown by arrows). In support of this notion, treatment with latrunculin‐B (LA‐B), an actin polymerization inhibitor, not only disrupted actin filaments, but also prevented mTORC1 puncta formation (Fig 7A). Our findings are consistent with a previous report that rapamycin inhibits cytoskeleton reorganization (Liu et al, 2010). The findings were further supported by results from immunofluorescence analysis which showed LA‐B treatment inhibited mTORC1 activation and localization with lysosomes (Fig 7B), as well as from Western blot analysis which showed that LA‐B treatment inhibited mTORC1 activity in both complete medium (CM) and in response to amino acid stimulation after nutrient starvation, as demonstrated by decreased phosphorylation of mTOR, S6K, and 4E‐BP1 in C2C12 cells (Fig 7C). Furthermore, the binding affinity of Aster‐C with MYH10, but not COPA, was diminished by LA‐B treatment, as demonstrated by co‐IP analysis (Fig 7D). Likewise, treatment with cytochalasin D (Cyto‐D), another cell‐permeable and potent inhibitor of actin polymerization, also disrupted interaction of Aster‐C with MYH10 (Fig 7D).
Figure 7. Actin filament is required for the trafficking and activation of mTORC1.
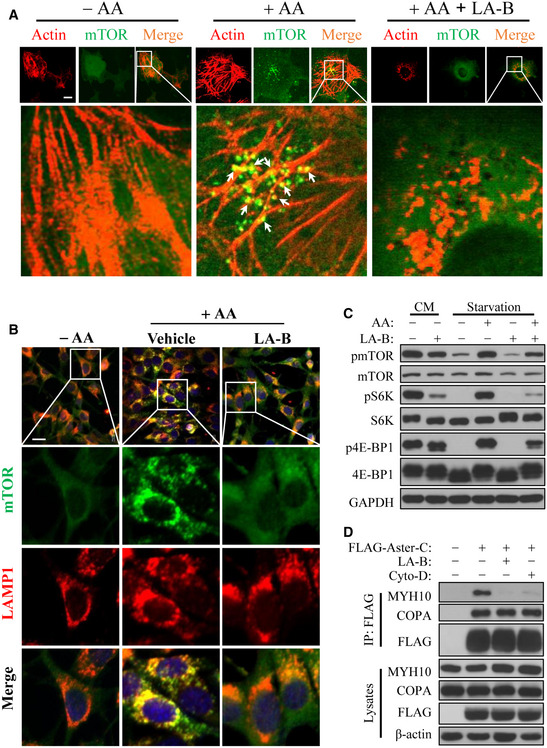
- Confocal imaging analysis depicting mTOR puncta (green) formation on actin filaments (red) in COS‐7 cells transiently expressing YFP‐mTOR in response to AA stimulation in the presence or absence of latrunculin B (LA‐B, 100 nM). Actin filaments were stained using BODIPY™ 558/568‐Phalloidin. Arrows indicate the association of mTOR with actin filaments. Scale bar, 5 μm.
- Immunostaining of endogenous mTOR and LAMP1 in C2C12 cells under amino acid starvation (−AA), or in response to AA stimulation (+AA) in the presence or absence of LA‐B (100 nM). Scale bar, 20 μm.
- Western blot analysis of mTORC1 activity in C2C12 cells in CM, in response to nutrient starvation and AA stimulation in the presence or absence of LA‐B (100 nM).
- Co‐IP analysis of the interaction of Aster‐C with COPA and MYH10 in the presence or absence of LA‐B (100 nM) or cytochalasin D (Cyto‐D, 250 nM) in HEK293T cells transiently expressing FLAG‐Aster‐C. Anti‐FLAG antibody was used for immunoprecipitation.
Discussion
In the present study, we identified Aster‐C as a novel regulator of mTORC1 signaling during nutrient starvation. Aster‐C is a member of a family of proteins that are recently implicated in cholesterol trafficking from the cell membrane to the ER (Sandhu et al, 2018). In the process, we also revealed an unexpected role for COP I vesicles in lysosomal trafficking and activation of mTORC1, which is supported by multiple lines of evidence. We showed that Aster‐C prevents mTORC1 activation during nutrient starvation by sequestering mTOR and the GATOR2 complex at the RER, and amino acids stimulated translocation of mTORC1 from the RER to lysosomes. In support of this notion, Aster‐C deficiency led to retention of mTORC1 at the lysosomes during nutrient starvation. The findings are further supported by results from the co‐IP experiment which demonstrated that Aster‐C directly binds to mTORC1 and multiple components of the GATOR‐2 complex during nutrient starvation, and such bindings were diminished in response to amino acid stimulation. Consequently, Aster‐C deficiency resulted in constitutive activation of mTORC1 and defective lipophagy which can be mitigated through inhibition of mTORC1 by rapamycin. Moreover, this function of Aster‐C is independent of its projected role of cholesterol trafficking, since Aster‐C‐deficient cells remain highly sensitive to cholesterol‐stimulated mTORC1 activation. In further support of Aster‐C as a negative regulator of mTORC1, ablation of Aster‐C also prevented lysosomal association of TSC2, a hallmark of mTORC1 inactivation, during nutrient starvation.
One of the major unresolved issues in mTOR research is its precise subcellular localization. The mTORC1 complex quickly dissociates from lysosomes and becomes cytoplasmic in response to amino acid depletion. However, its precise localization during nutrient starvation remains elusive, although mTOR has been identified in various organelles, including the ER, mitochondria, Golgi, and nucleus (Betz & Hall, 2013). We resolved this important issue in the present study by identifying Aster‐C as a key determinant for subcellular localization of mTOR during nutrient starvation. Accordingly, we showed that Aster‐C is an ER‐resident protein on the rough ER membrane where it co‐localized with mTOR and multiple components of the GATOR2 complex, the positive regulator of mTORC1, during nutrient starvation. Amino acids potently stimulated the dissociation of mTORC1 together with the GATOR2 proteins from Aster‐C as large puncta prior to their translocation to the lysosomes. Our findings are further corroborated by a recent report that the yeast Ltc1 protein, an orthologue of Aster‐C, also localized at a special ER membrane domain that partitioned the upstream regulators of the TORC1 and TORC2, although the precise role of Ltc1 in regulating mTOR signaling remains poorly understood (Murley et al, 2017).
COP I vesicles are commonly recognized for their roles in mediating both anterograde and retrograde traffic of cargoes between the cis‐Golgi and the rough ER (Brandizzi & Barlowe, 2013). Emerging evidence also supports a dynamic role of COP I vesicles in regulating protein and mRNA traffic to other organelles, including mitochondria, lysosomes, and lipid droplets (Gabriely et al, 2007). However, the potential involvement of COP I vesicles in mediating mTORC1 trafficking to lysosomes has not been reported. In this study, we identified for the first time a key role of COP I vesicles in lysosomal trafficking and activation of mTORC1 in response to amino acid stimulation. Accordingly, we showed that mTORC1 became punctated only after its association with COP I vesicles, which presumably allows COP I to escort mTORC1 to the lysosomal surface. Consistent with this notion, we further showed that amino acids potently stimulated the biogenesis of COPA puncta concurrently with translocation of mTORC1 to the lysosomal membrane. These findings are consistent with the suggested role for cargo proteins in directly stimulating COP I vesicle assembly (Gomez‐Navarro & Miller, 2016).
COP I vesicle biogenesis is controlled by ARF1, a small GTPase of the Ras superfamily. In further support of COP I as the mediator of mTORC1 trafficking, we showed that inhibition of ARF1 not only abolished COP I vesicle biogenesis, but also prevented mTORC1 activation and lysosomal association. The findings are consistent with the previously reported role of ARF1 in glutamine‐stimulated lysosomal mTORC1 localization and activation (Li et al, 2010; Jewell et al, 2015). Additionally, our proteomic analysis demonstrated that Aster‐C specifically binds to multiple coatomers of COP I vesicles. The binding is postulated to prevent COP I vesicle biogenesis during nutrient starvation, since Aster‐C deficiency leads to constitutive COP I vesicle formation as well as spontaneous association of mTORC1 with lysosomes. Moreover, Aster‐C also binds to multiple components of the NPC which is a part of the SEA complex in yeast that consists of both GATOR1 and GATOR2 subcomplexes (Dokudovskaya & Rout, 2015).
Vesicular trafficking is intrinsically linked to the activity of myosin motors and actin dynamics, both of which are regulated by ARFs. ARFs integrate COP I vesicle biogenesis with cytoskeleton activity through remarkably diverse mechanisms, ranging from the recruitment of effectors and coat proteins to the integration of vesicular transport with cytoskeleton assembly (Myers & Casanova, 2008). Specifically, ARF1 integrates COP I vesicle budding with retrograde actin flow (Duran et al, 2003). Inhibition of ARF1 by BFA not only abolishes COP I vesicle biogenesis, but also profoundly affects non‐muscle myosin activity and F‐actin remodeling (Le et al, 2013). Consistent with the projected roles of ARFs, we further showed that Aster‐C specifically binds to MYH10. The binding is abolished by inhibition of myosin II activity by BBS. Moreover, ablation of MYH10 leads to spontaneous COPA puncta formation and mTORC1 activation. These defects are highly reminiscent of those caused by Aster‐C deletion, further implicating a role of MYH10 in regulating mTORC1 trafficking by COP I vesicles.
COP I vesicle biogenesis is coordinately regulated by the assembly of actin filaments, as ARFs are also important regulators of actin cytoskeleton dynamics in a variety of actin‐based processes. In final support of COP I in regulating mTORC1 traffic, we showed that amino acids stimulated the trafficking of mTORC1 concurrently with the remodeling of actin filaments. Disruption of actin polymerization by latrunculin B also prevented phosphorylation of S6K and 4E‐BP1 proteins in response to stimulation by amino acids. As latrunculin B is used for the treatment of various cancers, it is interesting to note that Aster‐C expression levels are negatively correlated with the prognosis of human renal cancer (Appendix Fig S4). The findings lend further proof to Aster‐C being a negative regulator of mTORC1, since mTORC1 hyper‐activation is commonly associated with the pathogenesis of most cancers. Finally, our findings are corroborated by previous reports that mTOR and actin dynamics are mutually regulated. Accordingly, mTORC2 has been shown to control F‐actin remodeling, whereas inhibition of mTORC1 by rapamycin disrupts cytoskeleton reorganization (Jacinto et al, 2004; Liu et al, 2010). Likewise, nutrients stimulate robust formation of actin filaments (Jacinto et al, 2004), whereas ablation of Rac1, a member of the Rho GTPase family that cooperates with ARF1 in cytoskeletal assembly, inhibits mTORC1 activation (Saci et al, 2011).
Taken together, these findings support our hypothetical model that Aster‐C defines a special subdomain on the RER membrane where it sequesters mTOR during nutrient starvation. Accordingly, amino acids potently stimulate the dissociation of mTORC1 from Aster‐C concurrently with assembly of COP I vesicles which escort mTORC1 together with the GATOR2 complex to the lysosomal membrane. Consequently, depletion of Aster‐C or inhibition of retrograde trafficking by non‐muscle myosin IIB disrupts the cycling process, leading to constitutive activation of mTORC1 on the lysosomal membrane.
Materials and Methods
Reagents
l‐glutamine (#8540), l‐leucine (#L8912), l‐Isoleucine (#I7403), l‐Arginine (#A5131), Bafilomycin A1 (#B1793), Brefeldin A (#B6542), Insulin (I1507), Rapamycin (#37094), phosphatase inhibitor cocktail 2 (#P5726) and phosphatase inhibitor cocktail 3 (#P0044) were from Sigma. DSP (#22585), LysoTracker™ Red DND‐99 (#L7528), LysoTracker™ Green DND‐26 (#L7526), LysoTracker™ Blue DND‐22 (#7525), Hoechst 33342 Solution (#62249), CellMask™ deep red plasma membrane stain (#C10046), SYBR™ green PCR master mix (#4309155). DQ™ red BSA (#D12051), and Protein A/G Agarose (#20421) were from Thermo Fisher Scientific. Blebbistatin (#ab120425) and Fluoroshield mounting medium with DAPI (#ab104139) was from Abcam. EDTA‐free protease inhibitors (#11873580001) and X‐tremeGENE™ HP DNA transfection reagent (#6366236001) were from Roche. ViaFect™ transfection reagent (#E4982) was from Promega.
peYFP‐C1‐mTOR (#73384), DsRed2‐ER‐5 (#55836), mCherry‐MyosinIIB‐N‐18 (#55107), pRK5‐FLAG‐DEPDC5 (#46340), and pRK5‐FLAG‐Sestrin2 (#72595) were from Addgene. Myc/DDK‐Aster‐C (#MR207298) and GFP‐Aster‐C (#MG207298) were from Origene. GFP‐COPA was a gift kindly provided by Dr. Masayuki Matsushita (University of the Ryukyus, Japan).
Anti‐phospho‐S6K (T389, #9205), S6K (#9202), phosphor‐mTOR (S2448, #2971), mTOR (#2972), mTOR (#2983), phosphor‐4E‐BP1 (T37/46, #2855), 4E‐BP1 (#9644), Sestrin2 (#8487), RagA (#4357), RagC (#9408), MIOS (#13557), MYH10 (#8824), phosphor‐Akt (S473, #4060), phosphor‐Akt (T308, #13038), Akt (#9272), phosphor‐TSC2 (T1462, #3611), TSC2 (#4308), phosphor‐ULK1 (S555, #5869), ULK1 (#8054), Raptor (#2280), Rictor (#2114), and β‐actin (#4967) antibodies were from Cell Signaling. Anti‐COPA (#ab18122), anti‐Arf1 (ab58578), anti‐LAMP1 (#ab25245), and anti‐Sec13 (#ab168824) antibodies were from Abcam. Anti‐GAPDH (#sc‐32233) antibody was from Santa Cruz. Anti‐c‐Myc agarose affinity gel antibody (#A7470) and FLAG antibody (#F3165) were from Sigma. Anti‐Sec63 antibody was from Novus Biologicals (#NBP2‐30405). Anti‐Myc antibody was a gift kindly provided by Dr. Zhijie Chang (Tsinghua University, China). Secondary antibodies used in Western blots and immunofluorescent staining: HRP‐conjugated Goat anti‐Rabbit IgG Fc secondary antibody (#31463) and HRP‐conjugated Goat anti‐Mouse IgG (H+L) secondary antibody (#31430) were from Thermo Scientific. HRP‐conjugated mouse monoclonal SB62a anti‐rabbit IgG light chain (#ab99697) was from Abcam. Cy™3 affinity Pure donkey anti‐rat IgG (H+L) (#712‐165‐150) and FITC affinity Pure donkey anti‐rabbit IgG (H+L) (#711‐095‐152) were from Jackson ImmunoResearch.
Cell lines and tissue culture
C2C12, HEK293T, and COS‐7 cells were maintained at 37°C with 5% CO2, cultured in high‐glucose DMEM (Sigma, Cat#D5796) supplemented with 10% FBS (Atlanta Biologicals, Cat#S11550H) and 50 μg/ml penicillin/streptomycin (Invitrogen Cat#15140122). Wild‐type and Myosin IIB knockout MEF cells were kindly provided by Dr. Robert S. Adelstein (NIH/NHLBI) and cultured in high‐glucose DMEM supplemented with 10% FBS, 1× MEM amino acids (Invitrogen, Cat#11130051), 1× MEM non‐essential amino acids (Invitrogen, Cat#11140050) and 50 μg/ml penicillin/streptomycin.
Generation of Aster‐C KO and Arf1 KO cells using CRISPR/Cas 9 gene editing
Aster‐C or Arf1 genes were knocked out in C2C12 cells by transfecting CRISPR/Cas9 mouse plasmids from Santa Cruz (#sc‐424667 and #sc‐424667‐HDR for Aster‐C, Cat#419186‐KO‐2 and Cat#419186‐HDR‐2 for Arf1) using Viafect Transfection Reagent (Promega, Cat#E4982), and then purified through GFP and RFP fluorescence by the UT Health San Antonio Flow Cytometry Core. Cells were then kept under selection with 5 μg/ml puromycin (Santa Cruz, Cat#sc‐205821). Vector control cells were created by transfecting C2C12 cells with an empty pBABE‐puro vector backbone (Addgene, plamid ID: 1764,) and selected and kept in culture medium with 10 μg/ml puromycin.
RNA extraction, reverse transcription, and real‐time PCR
Aster‐C gene expression in C2C12‐Vector and Aster‐C KO cells was measured by quantitative real‐time PCR. In brief, cells were seeded on 6‐well plates for 24 h and then washed once with ice‐cold PBS. Total RNA was then extracted using TRIzol reagent (Invitrogen, Cat#15596018). 2 μg of total RNA was reverse‐transcribed to complementary DNA (cDNA) using SuperScript IV reverse transcriptase (Invitrogen, Cat#18090010). cDNAs were then used as templates for quantification of Aster‐C gene expression by real‐time PCR analysis, which was performed using SYBR green PCR master mix (Thermo Fisher Scientific, Cat#4309155) and the 7300 Real‐Time PCR System (Applied Biosystems). GAPDH was used as the internal control. The primers used in PCR are shown below:
Aster‐C: Forward: 5′‐CCACAGATTTGGGCTTCGAG‐3′
Reverse: 5′‐CACATTCAGCAGAACGAGCA‐3′
GAPDH: Forward: 5′‐GACTTCAACAGCAACTCCCAC‐3′
Reverse: 5′‐ TCCACCACCCTGTTGCTGTA‐3′
Cell treatment, nutrient starvation, and re‐stimulation
For nutrient starvation, C2C12, HEK293T, COS‐7, and MEFs cells were starved in a standard Krebs Ringer Phosphate HEPES medium (KRPH, 140 mM NaCl, 2 mM Na2HPO4, 4 mM KCl, 1 mM MgCl2, 1.5 mM CaCl2, 10 mM HEPES, pH 7.4) for 1 h unless otherwise indicated. For insulin stimulation experiments, cells were stimulated with 100 nM of insulin in complete medium, or starved in KRPH for 1 h first and then stimulated with 100 nM of insulin for 30 min. For amino acid stimulation experiments, cells were starved in KRPH for 1 h unless otherwise indicated and then stimulated with 2× MEM amino acids (50× MEM amino acids were diluted to 2× in KRPH with 8 mM of l‐glutamine and adjusted pH back to 7.4), or a mixture of l‐leucine (800 μM), l‐glutamine (4 mM), and l‐arginine (400 μM) in KRPH for 30 min (for Western blot and co‐immunoprecipitation experiments) or 10 min (for live cell confocal imaging experiments). For cholesterol depletion, cells were incubated with DMEM containing 0.5% methyl‐beta cyclodextrin (MCD) supplemented with 0.5% fatty acid free BSA for 2 h. For cholesterol re‐stimulation, the sterol‐depleted cells were incubated with DMEM containing 50 μM cholesterol pre‐complexed with 0.1% MCD for indicated time. For Rapamycin treatment, cells were treated with 100 nM of Rapamycin under normal culture conditions for 30 min, or starved in KRPH for 1 h prior to the addition of 100 nM of Rapamycin for 30 min. For brefeldin A (BFA) treatment, cells were first starved in KRPH for 30 min and then treated with 10 μM BFA for 1 h, followed by stimulation with or without amino acids as described above for 30 min. For Exo‐2 treatment, cells were cultured in as stated previously or subjected to nutrient starvation for 1 h, followed by stimulation with amino acids in the presence or absence of 10 μM Exo‐2 for 30 min.
Cell transfection
COS‐7 and HEK293T cells were transfected with plasmid DNA using X‐tremeGENE HP DNA transfection reagent, while C2C12 cells were transfected using ViaFect transfection reagent in antibiotic free medium according to the manufacturer's instructions. For transfection, cells were plated in either 6‐cm culture dishes (for Western blot and confocal imaging experiments) or 10‐cm culture dishes (for co‐immunoprecipitation experiments). 24 h later cells were transfected with either individual or a combination of plasmids as indicated in each experiment, and a total of 2.5 or 10 μg of plasmid DNA was transfected into cells cultured in 6‐cm dishes or 10‐cm dishes, respectively. Fresh medium was added 6 h after transfection. For Western blot and co‐immunoprecipitation experiments, cells were treated as indicated in each experiment after 48 h of transfection. For confocal imaging experiments, cells were sub‐cultured and plated on 35 mm glass bottom imaging dishes (Fluorodish, Cat#FD35) after 24 h of transfection and cultured for another 24 h prior to confocal imaging.
Immunofluorescence
C2C12‐Vector and Aster‐C KO cells were starved for 1 h in KRPH buffer and then stimulated with amino acids 30 min. Cells were then washed with 1× PBS and fixed by neutral buffered 10% formalin solution. After permeabilization with 0.1% Triton X‐100 in PBS, cells were blocked in 1% BSA in PBS with 5% normal donkey serum for 1 h at RT, and then incubated with anti‐mTOR (Cell Signaling, Cat#2983) or anti‐TSC2 (Cell Signaling, Cat#4308) and anti‐LAMP1 (Abcam, Cat#ab25245) primary antibodies overnight at 4°C. Cells were then washed again with 1× PBS 3 times and incubated with the FITC donkey anti‐rabbit IgG (Jackson ImmunoRes, Cat#711‐095‐152) and Cy™3 donkey anti‐rat IgG (Jackson ImmunoRes, Cat#712‐165‐150) secondary antibodies for 1 h at RT. After wash with 1× PBS for 3 times, the cell nucleus were stained with mounting medium with DAPI (Abcam, Cat#ab104139). For immunostaining of exogenous Aster‐C in COS‐7 cells, cells transfected with GFP‐COPA and FLAG‐Aster‐C were fixed, permeabilized and blocked as above. Cells were incubated with anti‐FLAG antibody (Sigma, Cat#F3165) overnight at 4°C and then incubated with Cy™3 donkey anti‐mouse IgG (Jackson ImmunoRes, Cat#715‐165‐150) secondary antibody for 1 h at RT. Cells were imaged using Zeiss LSM710 confocal microscope. Zeiss ZEN Blue was used for image processing and analysis.
Live cell fluorescence labeling and confocal imaging
For live cell confocal imaging analysis, cells were plated on 35‐mm glass bottom imaging dishes. On the day of the experiments, cells were stained with the appropriate dyes as indicated. In summary, nuclei were labeled with 500 nM Hoechst 33342 for nuclei; lysosomes were labeled with either LysoTracker™ Red DND‐99 (100 nM), LysoTracker™ Green DND‐26 (100 nM), or LysoTracker™ Blue DND‐22 (100 nM); Lipid droplets were stained using BODIPY™ 650/665‐X (ThermoFisher, Cat#D10001) according to the manufacturer's instructions. A Zeiss LSM710 confocal microscope with a 63× oil inverted objective was used for live cell imaging. For nutrient starvation and amino acid stimulation, cells were starved for 1 h in 2 ml of KRPH and then treated with 1 ml KRPH containing a 3× concentration of amino acids (2.4 mM of l‐leucine, 12 mM of l‐glutamine and 1.2 mM of l‐arginine), which brought the final concentration of AA to 1×. Following the addition of amino acids, confocal images were acquired either immediately, after 10 min, or for the indicated times in the case of time‐lapse. For actin staining, cells were fixed in 10% neutral formalin solution and then stained using BODIPY™ 558/568‐Phalloidin (ThermoFisher, Cat#B3475) according to the manufacturer's instructions. Zeiss ZEN Blue and ImageJ software (NIH, RRID:SCR_003070) were used for image processing and analysis.
Subcellular fractionation
HEK293T and C2C12 cells were collected and re‐suspended in hypotonic extraction buffer (10 mM HEPES, pH 7.8, 1 mM EGTA, and 25 mM KCl) for 20 min on ice. Cells were then homogenized in isotonic extraction buffer (10 mM HEPES, pH 7.8, 250 mM sucrose, 1 mM EGTA, and 25 mM KCl) and centrifuged at 800 g for 10 min at 4°C. The post nuclear supernatants were centrifuged at 12,000 g for 15 min at 4°C. The supernatants, which were the post mitochondrial fraction (PMF), were incubated with 8 mM CaCl2 for 15 min on ice and then centrifuged at 8,000 g for 10 min at 4°C. The pellets were the rough ER (RER) fractions, and the supernatants were centrifuged at 20,000 g for 30 min at 4°C. The pellets were the lysosome fractions, and the supernatants were further centrifuged at 100,000 g for 1 h at 4°C to get the cytosol fractions (supernatants) and the microsome fractions (pellets). Equal amount of total protein in each fraction was loaded to SDS‐PAGE for immunoblot analysis.
Cell lysis and immunoprecipitation
HEK293T cells were transfected with plasmids as indicated in each experiment using X‐tremeGENE™ HP DNA transfection reagent according to the manufacturer's instructions. After 48 h of transfection, cells were starved, re‐stimulated with amino acids, or treated with BFA or BBS as described above. Cells were then rinsed twice with ice‐cold PBS and lysed in ice‐cold NP‐40 lysis buffer (50 mM Tris–HCl, pH 7.5, 150 mM NaCl, 1 mM EDTA, 0.5% NP‐40, 1 mM PMSF, and one tablet of EDTA‐free protease inhibitors per 50 ml). The soluble fractions from cell lysates were isolated by centrifugation at 13,000 g for 10 min at 4°C. Protein concentration was measured using Pierce™ BCA protein assay kit (Thermo Fisher, Cat#23225). For immunoprecipitations, primary anti‐Myc or anti‐FLAG antibody was added to an equal amount of total protein from each lysate and incubated with rotation for 2 h at 4°C. 30 μl of a 50% slurry of protein A/G sepharose beads was added and continuously incubated with rotation at 4°C overnight. The immunoprecipitates were then washed five times with lysis buffer, and 30 μl SDS sample buffer was added to the precipitates and boiled for 5 min to denature the proteins. The eluates were then resolved by 10% SDS‐PAGE and analyzed by Western blot analysis.
Lysosomal proteolytic degradation assay
C2C12‐Vector and Aster‐C KO cells were treated with DQ‐red‐BSA (10 μg/ml) at 37°C for 2 h. After the extracellular DQ‐red‐BSA was removed, cells were nutrient starved in KRPH buffer for 4 h. The DQ‐red‐BSA exhibited red fluorescence upon cleavage and was detected by fluorescent spectrophotometer and normalized by total protein.
Stable re‐expression of exogenous Aster‐C in C2C12‐Aster‐C KO cells and MYH10 in MYH10 KO MEF cells
C2C12‐Aster‐C KO cells and MYH10 KO MEF cells were transfected with GFP‐Aster‐C or mCherry‐MYH10 expressing plasmids, respectively. Cells were then selected with G418 (200 μg/ml) for 2 weeks. The selected colonies were expanded and the exogenous protein expression was verified by Western blot analysis.
Protein mass spectrometry
HEK293T cells were transfected with Myc/DDK‐Aster‐C or Vector plasmids as described above. After 48 h of transfection, cells were starved in KRPH for 1 h. Cell lysates were prepared as described above. 50 μl of anti‐c‐Myc agarose affinity gel beads were added to an equal amount of total protein of each lysate and incubated with rotation overnight at 4°C. The beads were then washed five times with lysis buffer. The immunoprecipitates were eluted off the anti‐c‐Myc antibody affinity beads by adding 50 μl SDS sample buffer and boiled for 5 min, resolved on 4–12% NuPage gels (Invitrogen), and stained with Blue Silver stain (Invitrogen). Each lane in a gel was sliced into 6 pieces, and the proteins in each gel slice were digested overnight with trypsin. The resulting digests were then analyzed by mass spectrometry at the UT Health San Antonio Mass Spectrometry Core.
Quantification and statistical analysis
Data were routinely represented as mean ± SD. Statistical significance was assessed by Student's t test or one‐way ANOVA using GraphPad Prism 6.0. Differences were considered statistically significant at P < 0.05; *P < 0.05; **P < 0.01; ***P < 0.001.
Author contributions
Project conception and research design: YS. Experiment: JZ, J‐PA, HS, XL. Data analysis: YS, JZ, J‐PA, JN. Experiment assistance: NS. Manuscript writing: YS, JZ, J‐PA. Manuscript editing: All authors.
Conflict of interest
The authors declare that they have no conflict of interest.
Supporting information
Appendix
Expanded View Figures PDF
Table EV1
Movie EV1
Review Process File
Acknowledgements
We would like to thank Dr. Masayuki Matsushita at University of the Ryukyus, Japan for providing us with the GFP‐COPA plasmid and Dr. Robert Adelstein at NIH/NHLBI for the WT and MYH10 KO MEFs. The current studies were funded in part by the NIH (DK076685, Y.S.), the American Diabetes Association (#1‐18‐IBS‐329, Y.S.), the National Science Foundation of China (#31771309, Y.S.), and the National Institute on Aging (AG021890, J‐P.A.).
EMBO Reports (2020) 21: e49898
Data availability
No data were deposited in a public database.
References
- Beck R, Sun Z, Adolf F, Rutz C, Bassler J, Wild K, Sinning I, Hurt E, Brugger B, Bethune J et al (2008) Membrane curvature induced by Arf1‐GTP is essential for vesicle formation. Proc Natl Acad Sci USA 105: 11731–11736 [DOI] [PMC free article] [PubMed] [Google Scholar]
- Besprozvannaya M, Dickson E, Li H, Ginburg KS, Bers DM, Auwerx J, Nunnari J (2018) GRAM domain proteins specialize functionally distinct ER‐PM contact sites in human cells. Elife 7: e31019 [DOI] [PMC free article] [PubMed] [Google Scholar]
- Betz C, Hall MN (2013) Where is mTOR and what is it doing there? J Cell Biol 203: 563–574 [DOI] [PMC free article] [PubMed] [Google Scholar]
- Brandizzi F, Barlowe C (2013) Organization of the ER‐Golgi interface for membrane traffic control. Nat Rev Mol Cell Biol 14: 382–392 [DOI] [PMC free article] [PubMed] [Google Scholar]
- Castellano BM, Thelen AM, Moldavski O, Feltes M, van der Welle RE, Mydock‐McGrane L, Jiang X, van Eijkeren RJ, Davis OB, Louie SM et al (2017) Lysosomal cholesterol activates mTORC1 via an SLC38A9‐Niemann‐Pick C1 signaling complex. Science 355: 1306–1311 [DOI] [PMC free article] [PubMed] [Google Scholar]
- Dechant R, Saad S, Ibanez AJ, Peter M (2014) Cytosolic pH regulates cell growth through distinct GTPases, Arf1 and Gtr1, to promote Ras/PKA and TORC1 activity. Mol Cell 55: 409–421 [DOI] [PubMed] [Google Scholar]
- Demetriades C, Doumpas N, Teleman AA (2014) Regulation of TORC1 in response to amino acid starvation via lysosomal recruitment of TSC2. Cell 156: 786–799 [DOI] [PMC free article] [PubMed] [Google Scholar]
- Dokudovskaya S, Rout MP (2015) SEA you later alli‐GATOR–a dynamic regulator of the TORC1 stress response pathway. J Cell Sci 128: 2219–2228 [DOI] [PMC free article] [PubMed] [Google Scholar]
- Duran JM, Valderrama F, Castel S, Magdalena J, Tomas M, Hosoya H, Renau‐Piqueras J, Malhotra V, Egea G (2003) Myosin motors and not actin comets are mediators of the actin‐based Golgi‐to‐endoplasmic reticulum protein transport. Mol Biol Cell 14: 445–459 [DOI] [PMC free article] [PubMed] [Google Scholar]
- Egan D, Kim J, Shaw RJ, Guan KL (2011a) The autophagy initiating kinase ULK1 is regulated via opposing phosphorylation by AMPK and mTOR. Autophagy 7: 643–644 [DOI] [PMC free article] [PubMed] [Google Scholar]
- Egan DF, Shackelford DB, Mihaylova MM, Gelino S, Kohnz RA, Mair W, Vasquez DS, Joshi A, Gwinn DM, Taylor R et al (2011b) Phosphorylation of ULK1 (hATG1) by AMP‐activated protein kinase connects energy sensing to mitophagy. Science 331: 456–461 [DOI] [PMC free article] [PubMed] [Google Scholar]
- Gabriely G, Kama R, Gerst JE (2007) Involvement of specific COPI subunits in protein sorting from the late endosome to the vacuole in yeast. Mol Cell Biol 27: 526–540 [DOI] [PMC free article] [PubMed] [Google Scholar]
- Gatta AT, Wong LH, Sere YY, Calderon‐Norena DM, Cockcroft S, Menon AK, Levine TP (2015) A new family of StART domain proteins at membrane contact sites has a role in ER‐PM sterol transport. Elife 4: e07253 [DOI] [PMC free article] [PubMed] [Google Scholar]
- Gomez‐Navarro N, Miller E (2016) Protein sorting at the ER‐Golgi interface. J Cell Biol 215: 769–778 [DOI] [PMC free article] [PubMed] [Google Scholar]
- Jacinto E, Loewith R, Schmidt A, Lin S, Ruegg MA, Hall A, Hall MN (2004) Mammalian TOR complex 2 controls the actin cytoskeleton and is rapamycin insensitive. Nat Cell Biol 6: 1122–1128 [DOI] [PubMed] [Google Scholar]
- Jewell JL, Kim YC, Russell RC, Yu FX, Park HW, Plouffe SW, Tagliabracci VS, Guan KL (2015) Differential regulation of mTORC1 by leucine and glutamine. Science 347: 194–198 [DOI] [PMC free article] [PubMed] [Google Scholar]
- Le K, Li CC, Ye G, Moss J, Vaughan M (2013) Arf guanine nucleotide‐exchange factors BIG1 and BIG2 regulate nonmuscle myosin IIA activity by anchoring myosin phosphatase complex. Proc Natl Acad Sci USA 110: E3162–E3170 [DOI] [PMC free article] [PubMed] [Google Scholar]
- Li L, Kim E, Yuan H, Inoki K, Goraksha‐Hicks P, Schiesher RL, Neufeld TP, Guan KL (2010) Regulation of mTORC1 by the Rab and Arf GTPases. J Biol Chem 285: 19705–19709 [DOI] [PMC free article] [PubMed] [Google Scholar]
- Lim CY, Davis OB, Shin HR, Zhang J, Berdan CA, Jiang X, Counihan JL, Ory DS, Nomura DK, Zoncu R (2019) ER‐lysosome contacts enable cholesterol sensing by mTORC1 and drive aberrant growth signalling in Niemann‐Pick type C. Nat Cell Biol 21: 1206–1218 [DOI] [PMC free article] [PubMed] [Google Scholar]
- Ling NXY, Kaczmarek A, Hoque A, Davie E, Ngoei KRW, Morrison KR, Smiles WJ, Forte GM, Wang T, Lie S et al (2020) mTORC1 directly inhibits AMPK to promote cell proliferation under nutrient stress. Nat Metab 2: 41–49 [DOI] [PMC free article] [PubMed] [Google Scholar]
- Liu L, Luo Y, Chen L, Shen T, Xu B, Chen W, Zhou H, Han X, Huang S (2010) Rapamycin inhibits cytoskeleton reorganization and cell motility by suppressing RhoA expression and activity. J Biol Chem 285: 38362–38373 [DOI] [PMC free article] [PubMed] [Google Scholar]
- Menon S, Dibble CC, Talbott G, Hoxhaj G, Valvezan AJ, Takahashi H, Cantley LC, Manning BD (2014) Spatial control of the TSC complex integrates insulin and nutrient regulation of mTORC1 at the lysosome. Cell 156: 771–785 [DOI] [PMC free article] [PubMed] [Google Scholar]
- Murley A, Sarsam RD, Toulmay A, Yamada J, Prinz WA, Nunnari J (2015) Ltc1 is an ER‐localized sterol transporter and a component of ER‐mitochondria and ER‐vacuole contacts. J Cell Biol 209: 539–548 [DOI] [PMC free article] [PubMed] [Google Scholar]
- Murley A, Yamada J, Niles BJ, Toulmay A, Prinz WA, Powers T, Nunnari J (2017) Sterol transporters at membrane contact sites regulate TORC1 and TORC2 signaling. J Cell Biol 216: 2679–2689 [DOI] [PMC free article] [PubMed] [Google Scholar]
- Myers KR, Casanova JE (2008) Regulation of actin cytoskeleton dynamics by Arf‐family GTPases. Trends Cell Biol 18: 184–192 [DOI] [PMC free article] [PubMed] [Google Scholar]
- Saci A, Cantley LC, Carpenter CL (2011) Rac1 regulates the activity of mTORC1 and mTORC2 and controls cellular size. Mol Cell 42: 50–61 [DOI] [PMC free article] [PubMed] [Google Scholar]
- Sancak Y, Bar‐Peled L, Zoncu R, Markhard AL, Nada S, Sabatini DM (2010) Ragulator‐Rag complex targets mTORC1 to the lysosomal surface and is necessary for its activation by amino acids. Cell 141: 290–303 [DOI] [PMC free article] [PubMed] [Google Scholar]
- Sandhu J, Li S, Fairall L, Pfisterer SG, Gurnett JE, Xiao X, Weston TA, Vashi D, Ferrari A, Orozco JL et al (2018) Aster proteins facilitate nonvesicular plasma membrane to ER cholesterol transport in mammalian cells. Cell 175: 514–529 [DOI] [PMC free article] [PubMed] [Google Scholar]
- Saxton RA, Sabatini DM (2017) mTOR signaling in growth, metabolism, and disease. Cell 168: 960–976 [DOI] [PMC free article] [PubMed] [Google Scholar]
- Sciarretta S, Volpe M, Sadoshima J (2014) Mammalian target of rapamycin signaling in cardiac physiology and disease. Circ Res 114: 549–564 [DOI] [PMC free article] [PubMed] [Google Scholar]
- Shaw RJ (2008) mTOR signaling: RAG GTPases transmit the amino acid signal. Trends Biochem Sci 33: 565–568 [DOI] [PMC free article] [PubMed] [Google Scholar]
- Takeda K, Kishi H, Ma X, Yu ZX, Adelstein RS (2003) Ablation and mutation of nonmuscle myosin heavy chain II‐B results in a defect in cardiac myocyte cytokinesis. Circ Res 93: 330–337 [DOI] [PubMed] [Google Scholar]
- Yuan HX, Xiong Y, Guan KL (2013) Nutrient sensing, metabolism, and cell growth control. Mol Cell 49: 379–387 [DOI] [PMC free article] [PubMed] [Google Scholar]
Associated Data
This section collects any data citations, data availability statements, or supplementary materials included in this article.
Supplementary Materials
Appendix
Expanded View Figures PDF
Table EV1
Movie EV1
Review Process File
Data Availability Statement
No data were deposited in a public database.


