

Summary
Severe acute respiratory syndrome-coronavirus 2 (SARS-CoV-2) is transmitted largely by respiratory droplets or airborne aerosols. Despite being frequently found in the immediate environment and feces of patients, evidence supporting the oral acquisition of SARS-CoV-2 is unavailable. Using the Syrian hamster model, we demonstrate that the severity of pneumonia induced by the intranasal inhalation of SARS-CoV-2 increases with virus inoculum. SARS-CoV-2 retains its infectivity in vitro in simulated human-fed-gastric and fasted-intestinal fluid after 2 h. Oral inoculation with the highest intranasal inoculum (105 PFUs) causes mild pneumonia in 67% (4/6) of the animals, with no weight loss. The lung histopathology score and viral load are significantly lower than those infected by the lowest intranasal inoculum (100 PFUs). However, 83% of the oral infections (10/12 hamsters) have a level of detectable viral shedding from oral swabs and feces similar to that of intranasally infected hamsters. Our findings indicate that the oral acquisition of SARS-CoV-2 can establish subclinical respiratory infection with less efficiency.
Keywords: coronavirus, COVID-19, SARS-CoV-2, hamster, oral, gastrointestinal, subclinical, feces
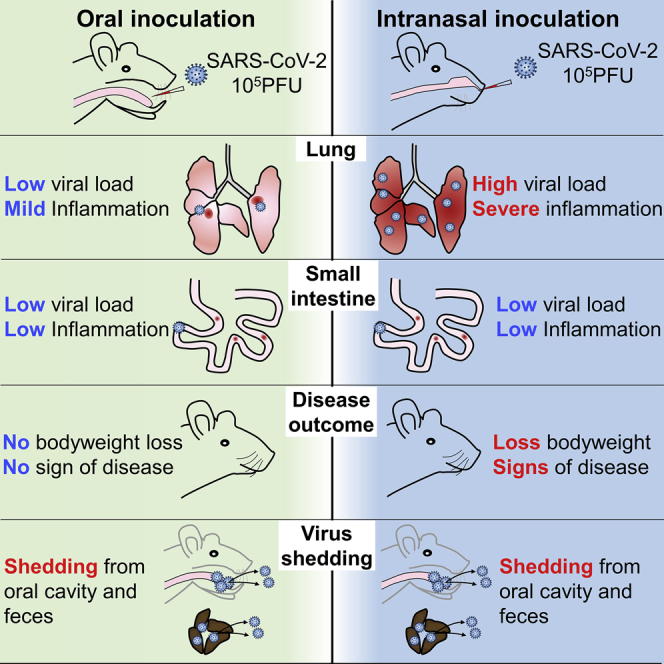
Graphical Abstract
Highlights
Oral inoculation of SARS-CoV-2 can establish respiratory infection in hamsters
Orally infected hamsters do not have body weight loss and signs of disease
Orally infected hamsters have a lower viral load and milder inflammation in lung
Orally and intranasally infected hamsters have comparable level of virus shedding
Lee et al. demonstrate that SARS-CoV-2 virus can cause subclinical mild pneumonia in Syrian golden hamsters via oral inoculation with less efficiency compared to intranasal inoculation, but virus shedding from oral cavity and feces lasts as long as that in intranasally infected hamsters.
Introduction
The coronavirus disease 2019 (COVID-19) pandemic caused by severe acute respiratory syndrome-coronavirus 2 (SARS-CoV-2) has affected >14 million patients, with >0.6 million deaths within a period of 6 months.1 Because of the high degree of genome homology between SARS-CoV-2 and bat SARS-related coronaviruses2, 3, 4 and the growth of the virus in intestinal organoids derived from Chinese horseshoe bats,5 SARS-CoV-2 is likely to originate from bats.6,7 Although how SARS-CoV-2 jumped the species barrier from animals to humans is still uncertain, the virus is highly transmissible among humans, leading to familial clusters and large outbreaks related to food and drink premises, religious gatherings, and cruise ships.8, 9, 10 Symptomatic COVID-19 typically causes upper and lower respiratory symptoms; SARS-CoV-2 is shed in large amounts from the respiratory tract through coughing and sneezing. Like other respiratory viruses, SARS-CoV-2 is believed to be predominantly transmitted by the inhalation of respiratory droplets or airborne aerosols. Despite the frequent detection of SARS-CoV-2 in the immediate surroundings of patients11 and their feces,12 the importance of transmission by direct and indirect contact with contaminated respiratory secretions or by the fecal-oral route remains to be ascertained. While fingers touching surfaces contaminated by respiratory secretions or fecal particles can inoculate the virus into the eyes or nose, the virus may also be inoculated via food or drink through the oral cavity to establish infection in the oropharynx or the gastrointestinal tract before spreading directly or through viremia into the respiratory tract. We and others have recently established the golden Syrian hamster SARS-CoV-2 infection model, which has demonstrated experimental transmission by close contact, respiratory droplets, or airborne aerosols; transmission by the latter two routes could be reduced by a surgical mask barrier between cages.10,13,14 In this study, we determined the severity of clinical disease and histopathological changes associated with different infectious doses given by intranasal (i.n.) inhalation. To investigate whether oral administration of SARS-CoV-2 could establish infection and what the differences in the disease course are compared to i.n. infection, we fed conscious hamsters the highest i.n. virus dose. By monitoring the serial clinical, histopathological, and virological changes in the gastrointestinal and respiratory tract tissues, we demonstrated that orally acquired SARS-CoV-2 established subclinical infection in this hamster model for COVID-19, with delayed onset and much milder pneumonia comparing to i.n. inoculation.
Results
Disease Severity in i.n. SARS-CoV-2-Infected Hamsters Increases with the Dose of Virus Inoculum
Four groups of hamsters were i.n. infected with different infectious doses of SARS-CoV-2 (102, 103, 104, and 105 plaque-forming units [PFUs]). The clinical signs of lethargy, ruffled fur, hunched back posture, and rapid breathing were observed, which were accompanied by a maximum body weight loss of 4%–10% at 4 day post-infection (dpi) in the 4 groups (Figure 1A). The viral loads in the trachea and lung tissues at 2 dpi increased with the virus inoculum, while similar lung viral loads were detected among the different groups at 4 dpi (Figure 1B). These results indicated that the viral load peaked earlier with higher virus inoculum and were consistent with our previous report.10 Immunofluorescence staining for viral nucleocapsid (N) protein in the lung tissues at 2 dpi showed more focal distribution in bronchiolar epithelium with lower virus inoculum and more diffuse and intense N protein expression in the alveoli with higher inoculum (Figure 1C). By 4 dpi, however, similar intensity and distribution of N protein expression was observed in all of the groups (Figure 1C), which also correlated with their lung viral loads.
Figure 1.

Body Weight, Viral Load, Lung Histology, and Cytokine/Chemokine Profiles in Syrian Hamsters Intranasally (i.n.) Inoculated with Different Doses of SARS-CoV-2
(A) Body weight changes during the 5-day experimental period. n = 6 for 0–2 dpi, n = 3 for 3–4 dpi. dpi, days post-infection. The error bars represent standard deviations of the mean.
(B) Viral load determined by qRT-PCR in homogenized lung and trachea tissues at 2 and 4 dpi. n = 3 each group. The error bars represent standard deviations of the mean.
(C) Representative images of immunofluorescence-stained viral N protein (green) in lung sections at 2 and 4 dpi. At 2 dpi, there is sporadic N protein expression in the bronchiolar epithelium. While it is abundantly associated with luminal debris (open arrow) in 102 PFUs inoculated hamster, the alveoli are largely negative. In 103–105 PFUs inoculated hamster lungs, besides increased N protein expression in bronchiolar epithelium (open arrows), increasingly larger areas of alveoli express N protein (solid arrows). At 4 dpi, the diffuse expression of N protein in alveoli is shown in the lungs of all 4 different inoculation groups and is slightly less intensive in 102 PFUs inoculated hamsters (solid arrows). B, bronchiole; N, SARS-CoV-2 N protein; DAPI, 4′,6-diamidino-2-phenylindole.
(D) H&E images of infected hamster lungs. At 2 dpi, the lung of a 102PFUs inoculated hamster shows moderate alveolar wall thickening (solid arrows) and bronchiolar epithelial cell death with luminal cell debris (open arrow). In the 103 PFUs inoculated lung, a moderate degree of alveolar wall thickening with capillary congestion (solid arrows) and more severe bronchiolar cell death indicated by larger clumps of luminal cell debris are shown (open arrows). 104 PFUs inoculation causes diffuse lung consolidation with alveolar space infiltration and exudation; the air sac almost disappeared from this lung section (solid arrow) (2 bronchiole sections with luminal cell debris [open arrows]). In the 105 PFUs inoculated lung, 2 bronchiolar lumens filled with abundant cell debris (open arrows), and diffuse alveolar septal edema, alveolar space infiltration, exudation, and hemorrhage are shown (solid arrows). At 4 dpi, the lungs sections of hamsters inoculated at different doses all showed diffuse alveoli infiltration, exudation, and hemorrhage; the damage was more severe in 104 and 105 PFUs inoculated hamsters (solid arrows). The images in the bottom panel are mock-infected hamster lung tissue stained by H&E and SARS-CoV-2 N protein.
(E) Images of pulmonary blood vessels from mock-infected or infected hamsters. A medium-sized blood vessel (V) shows normal structure in a mock-infected hamster. 104 PFUs inoculated hamster lungs show severe pulmonary vasculitis and endotheliitis at 4 dpi. The lower left image shows a medium-sized vessel with perivascular infiltration and endothelium infiltration-caused detachment of the endothelium (open arrows); 1 larger vessel shows severe vessel wall infiltration (upper center, arrows) and endothelium infiltration and activation (magnified image, open arrows); and 1 medium-sized vessel is completely occluded by severe endothelium infiltration (right panels), in addition to severe perivascular infiltration. The boxed areas are magnified.
(F) Real-time RT-PCR determined relative mRNA expression of inflammatory cytokine/chemokine in homogenized lung tissues from 102 or 105 PFUs inoculated hamsters at 2 and 4 dpi. n = 3 per group. The error bars represent standard deviations of the mean. The p values were calculated with 2-way ANOVA.
Histological examination of H&E-stained lung tissue sections at 2 dpi showed mainly bronchiolar epithelial cell death (Figure 1D, open arrows) and patchy alveolar septal congestion and infiltration without severe lung parenchymal damage in the hamsters infected with 102 or 103 PFUs SARS-CoV-2 (Figure 1D, solid arrows). The lungs of the hamsters infected with 104 or 105 PFUs virus showed large patches of inflammatory consolidation in addition to bronchiolar epithelial cell death, with alveolar septal congestion, edema, alveolar space infiltration, protein-rich fluid exudation, and patchy alveolar hemorrhage (Figure 1D). These findings indicate that a higher i.n. virus inoculum is associated with the earlier onset of lung parenchymal damage at 2 dpi. By 4 dpi, the hamsters infected with 102 or 103 PFUs of SARS-CoV-2 also developed lung parenchymal damage that was milder than that observed in the hamsters infected with 104 or 105 PFUs virus (Figure 1D, lower panel). In addition, SARS-CoV-2-induced pulmonary vasculitis and endotheliitis, which were most severe at 4 dpi in all groups, showed intense mononuclear cell infiltration and disruption of smooth muscle fibers in the vessel wall. Severe endotheliitis was more frequently observed with higher virus inoculum; the extensive mononuclear cell infiltration beneath the endothelium caused the detachment of endothelial cells or vessel occlusions (Figure 1E), which affected blood vessels of different size, including both arteries and veins. No viral N protein antigen was detected in the blood vessels.
The inflammatory cytokines and chemokines in the lung tissues inoculated with the lowest inoculum of 102 PFUs and the highest inoculum of 105 PFUs were determined at 2 and 4 dpi. The gene expression levels of inflammatory cytokines and chemokines, including interleukin-6 (IL-6), tumor necrosis factor-α (TNF-α), macrophage inflammatory protein-1α (MIP-1α), regulated upon activation, normal T cell expressed and presumably secreted (RANTES), interferon (IFN) γ-induced protein-10 (IP-10), IFN-α, and IFN-γ, were significantly upregulated in hamsters infected with 105 PFUs at 2 and 4 dpi (Figure 1F). Although the cytokine and chemokine responses peaked at 2 dpi in both groups, the response induced by the lower virus inoculum (102 PFUs) mostly decreased at 4 dpi (Figure 1F).
SARS-CoV-2 Susceptibility to Simulated Human Gastrointestinal Fluids In Vitro
Since nausea, vomiting, and diarrhea are not uncommon clinical manifestations of COVID-19 and >40% of the feces of these patients were RT-PCR+ for SARS-CoV-2,12,15 the feasibility of fecal-oral transmission should be investigated. Due to extreme pH and abundant digestive enzymes, gastrointestinal fluids are known to protect hosts against orally acquired pathogens. Therefore, we tested the susceptibility of SARS-CoV-2 in simulated human gastrointestinal fluids in vitro. The results showed that SARS-CoV-2 retained its viability and infectivity up to 120 min in fed-state simulated gastric fluid (FeSSGF, pH 5.0) and fasted-state simulated intestinal fluid (FaSSIF, pH 6.5) (Figure 2A), while in fasted-state simulated gastric fluid (FaSSGF, pH 1.6), SARS-CoV-2 lost its infectivity within 30 min and was rendered non-infectious immediately when added to fed-state simulated intestinal fluid (FeSSIF, pH 5.0), which contains bile. The degree of susceptibility of SARS-CoV-2 in FeSSGF and FaSSIF was similar to those of SARS-CoV and human coronavirus 229E (HCoV-229E). Human enterovirus 71 (EV-A71) was also tested in parallel, which retained infectivity in all of the simulated gastrointestinal fluids up to 120 min (Figure 2A).
Figure 2.

In Vitro Stability of SARS-CoV-2 Virus in Simulated Human Gastrointestinal Fluids, and In Vivo Infection of Hamsters via Oral Inoculation
(A) SARS-CoV-2 viability tested in simulated human gastrointestinal fluids. 105 PFUs of SARS-CoV-2 virus were mixed at a 1:10 ratio with FaSSGF, FaSSIF, FeSSGF, FeSSIF, or DMEM culture medium as control, and incubated for 0, 30, 60, or 120 min at 37°C; virus infectivity was then determined by median tissue culture infectious dose (TCID50) assays on Vero E6 cells. The percentage viability of the virus was calculated with the viability of the culture medium controls at each time point as 100%. SARS-CoV, human enterovirus 71 (EV-A71), and human coronavirus 229E (HCoV-229E) were tested in parallel on Vero E6, RD, and Huh7 cell lines, respectively, as controls. The dashed lines represent 100% viability of the culture medium controls. Triplicated tests for each condition were performed. The error bars represent standard deviations of the mean.
(B) Body weight changes during the 14-day experimental period after oral or i.n. inoculation of 105 PFUs SARS-CoV-2. n = 5 for i.n. and mock inoculation. For oral, n = 6 for 0–7 dpi and n = 3 for 8–14 dpi. The error bars represent standard deviations of the mean. The p values were calculated by 2-way ANOVA by comparing the oral inoculation groups with the i.n. inoculation group. Oral, oral inoculation.
(C) Viral load determined by qRT-PCR in homogenized oral mucosa, tongue, esophageal, stomach, and small intestine tissues 12 hpi after oral or i.n. virus inoculation of 105 PFUs SARS-CoV-2. n = 3 per group. The dashed line indicates the detection limit of the assay. The error bars represent standard deviations of the mean. The p value was calculated with the Student’s t test.
(D) Immunofluorescent images of viral N protein expression in lymph node (area in dashed line) in oropharynx tissue taken at 12 hpi after oral inoculation and N protein-expressing cells (green, arrows in magnified image of the boxed area). N, SARS-CoV-2 N protein.
(E) Relative mRNA expression level of proinflammatory cytokines and chemokines in small intestine tissues of hamsters at 12 h after oral or i.n. inoculation. The expression of cytokines and chemokines in mock-infected hamsters was set as basal line control. n = 3 each group. The error bars represent standard deviations of the mean. The p values were calculated with 2-way ANOVA.
Oral SARS-CoV-2 Inoculation Caused Subclinical Infection but Early Upregulation of Cytokines and Chemokines in Intestinal Tissue
We then investigated the effect of SARS-CoV-2 on hamsters by oral inoculation. A total of 105 PFUs SARS-CoV-2 in 200 μL DMEM was delivered by plastic pipettes to their mouths, which were swallowed spontaneously by the alert animals without anesthesia.16,17 For comparison, a parallel group of animals were inoculated with 105 PFUs SARS-CoV-2 by i.n. inhalation under anesthesia. Hamsters i.n. infected developed ruffled fur, labored breathing, and lost ∼8% body weight. All of the orally infected hamsters did not show signs of disease while gaining a similar amount of weight as the mock controls (Figure 2B). At 12 hpi, a low viral load was detectable in homogenized oral mucosa, but not detectable in the esophagus, stomach, small intestinal tissues, and blood samples of orally infected hamsters (n = 3; Figure 2C). The i.n. infected hamsters had a significantly higher viral load in the esophagus and stomach, but no detectable virus in small intestinal tissues (n = 3; Figure 2C). Interestingly, viral N protein was detected in 1 of the 3 lymph nodes taken from the oropharyngeal tissues at 12 hpi in the orally infected hamster (Figure 2D), which suggested that the virus had reached the lymphoid tissue at this early time point. However, mediastinal lymph nodes from 3 i.n. inoculated hamsters showed no detectable N protein at 12 hpi. The expression of cytokines and chemokines, including IFN-α, IFN-γ, IL-6, TNF-α, MIP-1α, RANTES, and IP-10, in small intestinal tissues of orally infected hamsters were upregulated and higher than those of i.n. infected hamsters, although these did not reach a statistically significant level (Figure 2E). The weaker cytokine responses in i.n. inoculated hamsters may be due to the higher viral load, which may be effective in the inhibition of host innate responses. Histological examination of alimentary tissues showed no apparent pathological changes at 12 hpi.
Oral and i.n. Inoculation of SARS-CoV-2 Caused a Similar Degree of Intestinal Inflammation at 4 dpi
At 4 dpi, 4 of the 6 orally inoculated hamsters had detectable viral RNA in their oral mucosa, tongue, esophagus, and stomach, but not their small intestines (Figure 3A). Infectious virus was detected by Vero E6 cell culture from some of the above tissue homogenates (Figure 3A), but the virus was not detectable from small intestinal samples by viral culture, which could be due to the toxicity induced by the intestinal tissue homogenate. Hamsters i.n. inoculated had higher levels of viral RNA in their esophagus and stomach and also in one of the three small intestine samples; this suggested that the virus may have spread from the respiratory system back to the upper gastrointestinal tract through the swallowing of infected tissue debris from the nasal cavity or trachea, besides swallowing some of the inoculum initially. In addition, viral N protein was detected from oropharyngeal tissue lymph nodes (Figure S1A), mediastinal lymph nodes, and the peripheral blood monocytes (Figure S1B) of orally and i.n. infected hamsters, which were consistent with the detectable viremia in both groups at this time point. Histologically, orally infected hamsters showed mild inflammatory infiltrations in the tongue submucosa, oral mucosa, forestomach lamina propria, or in the smooth muscle of the glandular stomach (Figure 3B), but no viral N protein was detected in any of these epithelial cells, except from luminal cell debris (Figures S2A–S2C). Moreover, the small intestine tissues from orally infected hamsters showed medium to severe degrees of inflammatory infiltration and edema at the lamina propria, moderate to severe intestinal villi epithelium desquamation, and complete destruction of the villi in some tissues (Figure 3C). The expression of cytokines and chemokines in the small intestine tissues of orally infected hamsters were elevated to levels similar to those of the i.n. infected hamsters (Figure 3D). Notably, the severity of these histopathological changes in small intestine tissues was similar to what we previously reported in i.n. infected hamsters.10 Moreover, after oral or i.n. inoculation, enterocytes expressing N protein were occasionally observed (Figure S2D), as expected from the high expression of angiotensin-converting enzyme 2 (ACE2), the receptor for SARS-CoV-2, in the mucosal cells of the alimentary tract (Figure S3). The findings suggested that SARS-CoV-2 infection of the intestinal tissue together with virus-induced systemic inflammatory responses both play important roles in the development of intestinal pathology.
Figure 3.

Oral Inoculation 105 PFUs SARS-CoV-2 Cause Histopathological Changes in the Alimentary Tract at 4 dpi
(A) Viral load and infectious virus in homogenized oral mucosa, tongue, esophageal, stomach, and small intestine tissues at 4 dpi. Left, viral load determined by qRT-PCR. The error bars represent standard deviations of the mean. The p values were calculated with the Student’s t test. The dashed line indicates the detection limit of the assay. Right, the presence of infectious virus was determined by cytopathic effect (CPE) in Vero E6 cells inoculated with 1:10 diluted tissue homogenates and cultured for 4 days. The samples showed CPE were counted as infectious virus positive (n = 3–6 per group). ND, not determined.
(B) Representative images of histopathological changes in the alimentary tract 4 dpi after oral inoculation. The tongue and oral mucosa tissue (left panel) show mild infiltration in lamina propria (open arrows). in the images in the center panel show the junction between the forestomach and the glandular stomach, with mild lamina propria infiltration in the forestomach smooth muscles (open arrows) and lamina propria infiltration in the glandular stomach (magnified image, open arrows). The glandular stomach (right panel) shows mild infiltration and some luminal cell debris (arrows in the magnified image of the boxed area).
(C). Small intestine tissues at 4 dpi show lamina propria infiltration and edema (left, solid arrows) and congestion; intestinal villi infiltration and swelling (left, open arrows); magnified image in the center show destruction of the intestinal villi by severe epithelium desquamation (open arrows). Small intestine tissue of mock control with normal villi shown at right.
(D) Relative mRNA expression level of proinflammatory cytokines and chemokines in small intestine tissues at 4 dpi. The levels of relative gene expression are determined by qRT-PCR compared with the mock-infected hamster small intestine tissues as baselines. n = 3–6. The error bars represent standard deviations of the mean.
See also Figures S1–S3.
Oral Inoculation Established Delayed Subclinical Respiratory Infection and Mild Lung Pathology
To study whether subclinical respiratory infection was established via oral inoculation, we used the same dose (105 PFUs) i.n. inoculation as the control group. At 12 hpi, viral gene and N protein antigen were readily detectable in the nasal turbinate, trachea, and lung tissues from all of the hamsters in the i.n. group (n = 3), although no histological changes other than mild pulmonary blood vessel congestion were found at this early time point (Figures 4A–4C). On the contrary, no viral load or N protein was detectable in respiratory tract tissues from the orally inoculated group (Figures 4A–4C). This indicated that orally inoculated SARS-CoV-2 was not accidentally aspirated or reached the respiratory tract at 12 hpi. At 4 dpi, 6 orally inoculated hamsters were examined. Only 4 developed respiratory tract infection, which was evident from the results of viral load and N protein immunostaining. Viral antigen was found to be sparsely distributed as small foci in the lung tissue, unlike the denser distribution of larger foci in i.n. infected controls (Figure 5A). As expected, the viral titers in the lung tissues were significantly lower than those of the i.n. infected control hamsters (Figure 5B). Histological examination showed that the orally infected hamster lung tissues had milder alveolar septal infiltration and capillary congestion than the diffuse alveolar infiltration, exudation, epithelium desquamation, and pulmonary vasculitis observed in i.n. infected hamsters (Figure 5C). To quantitatively compare the severity of lung damage after oral and i.n. inoculation, we performed a semiquantitative histopathological evaluation of the bronchioles, alveoli, and blood vessels using a method modified from our previous influenza infection mouse model and a reported hamster infection model (Table S1).18,19 The results showed that the same inoculum 105 PFUs SARS-CoV-2 through oral inoculation caused significantly lower lung histopathological scores (scores = 9, 8, 8, and 6; average score = 7.8) than i.n. inoculation (scores = 27, 27, 27; average = 27) at 4 dpi (Table S2); the expressions of lung cytokines and chemokines were also significantly lower in orally infected hamsters (Figure 5D; Table 1). Notably, when comparing the lung pathological damage caused by oral infection through the i.n. route, oral inoculation with 105 PFUs caused significantly milder infection than the i.n. route, even milder than the lowest dose (102 PFUs) i.n. inoculation, in which the hamsters showed significantly higher lung viral load, lung histology scores, and lung cytokines and chemokines, among which RANTES and IP-10 were significantly higher than that of orally infected hamsters (Table 2). These results suggested that the oral inoculation of SARS-CoV-2 can establish respiratory infection but with much less efficiency, delayed course, and mild lung damage. Follow-up of the histopathology showed resolution of the inflammation in the lung at 7 dpi, which was similar to our previous report.10 Serum neutralizing antibody was detected at a similar level from both orally (titer = 10–40) and i.n. (titer = 20–40) inoculated hamsters at 7 dpi; the neutralizing antibody titer in i.n. inoculated hamsters increased to a higher level at 14 dpi (titer = 40–160) but was not significantly different when compared with orally inoculated hamsters (titer = 10–80) (Figure 5E).
Figure 4.

Hamster Did Not Develop Respiratory Infection at 12 h after Oral Inoculation of 105 PFUs SARS-CoV-2
Hamsters were orally inoculated with 105 PFUs SARS-CoV-2; the i.n. inoculation group was included as control. Nasal turbinate, trachea, and lung were examined at 12 hpi.
(A) Real-time qRT-PCR determined viral load in homogenized nasal turbinate, trachea, and lung tissues at 12 hpi. n = 3 each group. The dashed line represents the detection limit. The error bars represent standard deviations of the mean. The p values were calculated by the Student’s t test.
(B) Images of immunofluorescence-stained SARS-CoV-2 N protein in nasal turbinate, trachea, and lung tissues from orally or i.n. inoculated hamsters at 12 hpi. No viral antigen is shown in orally inoculated hamsters in any of these tissue sections; N protein expression in the epithelium of nasal turbinate (arrows), trachea (arrows), bronchiolar epithelium (open arrows), and alveoli (open arrows) of i.n. inoculated hamsters.
(C) H&E images of trachea (upper) and lung (lower) taken from orally or i.n. inoculated hamsters at 12 hpi. Only i.n. inoculation induced alveolar wall thickening and blood vessel congestion at this time point. Images from mock control hamsters are at right.
Figure 5.

Oral Inoculation of 105 PFUs SARS-CoV-2 Caused Subclinical Mild Pneumonia in Hamsters at 4 dpi, but Similar Levels of Virus Shedding as i.n. Inoculated Hamsters
(A) Images of N protein expression in the lung tissues. Oral inoculated hamster lung showed 2 foci of N protein-expressing cells in the bronchiolar epithelium (upper left, open arrows) and scattered expression in a small area alveoli (lower left, solid arrows); the lung of i.n. inoculated hamsters show many more bronchiolar epithelial cells (open arrows) and alveolar cells (solid arrows) expressing N protein (right).
(B) Infectious viral titer in homogenized lung tissues at 4 dpi determined by TCID50 assay in Vero E6 cells. The error bars represent standard deviations of the mean. The p value was calculated with the Student’s t test.
(C) H&E images of lung tissues. The lower-magnification images show blood vessel congestion and alveolar wall thickening in oral inoculated hamsters; the magnified images below show alveolar wall congestion (open arrows) and a few epithelial cell detachments in the lumen of bronchioles (solid arrow). The lungs of i.n. inoculated hamsters show diffuse infiltration and alveolar consolidation; the magnified image shows massive bronchiolar epithelial cell death (solid arrows) and extensive infiltration and destruction of alveoli (open arrows).
(D) Relative mRNA expression of proinflammatory cytokine/chemokines in the lung tissues of orally or i.n. inoculated hamsters at 4 dpi. The expression levels of mock control hamster lung tissues were used as a baseline control. n = 3–6 each group. The error bars represent standard deviations of the mean. The p values were calculated with the Student’s t test.
(E) Oral inoculation induced serum neutralizing antibody in hamsters. Serum samples taken at 7 and 14 dpi were tested for SARS-CoV-2 neutralizing antibody on Vero E6 cells. The neutralizing antibody titer presented was the highest dilution of serum that inhibited 50% of CPE. n = 3 each group. The error bars represent standard deviations of the mean. See also Table S2.
(F) Virus shedding from oral swabs determined by real-time qRT-PCR. Oral swab samples were taken from hamsters every other day after orally or i.n. inoculation for 14 days. The data come from viral RdRp gene copies. The percentages indicate the positive detection rate. The dashed line represents the detection limit. For the oral group, n = 12 for 2–4 dpi, n = 6 for 6 dpi, n = 3 for 8–14 dpi. For the i.n. group, n = 8 for 2–4 dpi, n = 5 for 6–14 dpi. The error bars represent standard deviations of the mean. The p values were calculated with the Student’s t test.
(G) Viral RdRp gene copies determined by real-time qRT-PCR in feces samples taken from orally or i.n. inoculated hamsters. The percentages indicate the positive detection rate. The dashed line represents the detection limit. For the oral group, n = 12 for 2–4 dpi, n = 6 for 6 dpi, n = 3 for 8–14 dpi. For the i.n. group, n = 8 for 2–4 dpi, n = 5 for 6–14 dpi. The error bars represent standard deviations of the mean. The p values were calculated with the Student’s t test.
Table 1.
Disease Course in SARS-CoV-2-Infected Hamster via Oral or i.n. Inoculation
| 12 hpi |
4 dpi |
|||||
|---|---|---|---|---|---|---|
| Oral (n = 3) | i.n. (n = 3) | p | Oral (n = 6) | i.n. (n = 3) | p | |
| Clinical scoresa (mean ± SD) | 0.00 ± 0.00 | 0.00 ± 0.00 | >0.99 | 0.00 ± 0.00 | 3.33 ± 0.58 | 0.0006 |
| qRT-PCR+rate (%) | ||||||
| Upper digestive tract tissuesb | 67 | 100 | >0.99 | 83 | 100 | 0.45 |
| Lower digestive tract tissuesc | 0 | 33 | 0.27 | 50 | 100 | 0.13 |
| Upper respiratory tract tissuesd | 0 | 100 | 0.014 | 67 | 100 | 0.26 |
| Lung | 0 | 100 | 0.014 | 67 | 100 | 0.26 |
| Histopathology | ||||||
| Small intestine | - | - | N/A | +++ | +++ | N/A |
| Lung | - | + | N/A | + | +++ | N/A |
| Cytokine and chemokine expression | ||||||
| Small intestine | ↑ | - | N/A | ↑ | ↑ | N/A |
| Lung | - | ↑ | N/A | ↑ | ↑↑ | N/A |
i.n., intranasal; N/A, not applicable; SARS-CoV-2, severe acute respiratory syndrome-coronavirus 2. - normal; + mild; +++ severe; ↑ upregulated; ↑↑ highly upregulated.
A score of 1 was given to each of the following clinical signs: lethargy, ruffled fur, hunchback posture, and rapid breathing.
Oral mucosa, tongue, esophagus.
Stomach, small intestine.
Nasal turbinate, trachea.
Table 2.
Disease Comparison between Lowest Inhalation and Highest Oral Inoculation of SARS-CoV-2-Infected Hamsters
| 4 dpi |
|||
|---|---|---|---|
| i.n. Inhalation (102 PFUs) | Oral Inoculation (105 PFUs) | p | |
| Clinical scores (mean ± SD)a | 2.33 ± 0.58 | 0.00 ± 0.00 | 0.0023 |
| Body weight change (%, mean ± SD)b | −3.17 ± 1.70 | 11.58 ± 4.18 | 0.0007 |
| Lung viral load (RdRp gene copies/β-actin, mean ± SD) | 94.50 ± 42.05 | 16.52 ± 23.87 | 0.025 |
| Lung histology score (mean ± SD) | 24.00 ± 5.20 | 7.80 ± 1.26 | 0.0079 |
| Lung chemokine expression by qRT-PCR (fold change compared to mock, mean ± SD) | |||
| RANTES | 34.45 ± 9.25 | 6.78 ± 7.56 | 0.0019 |
| IP-10 | 50.09 ± 9.41 | 12.06 ± 19.28 | 0.016 |
IP-10, interferon-γ-induced protein-10; RANTES, regulated upon activation, normal T cell expressed and presumably secreted.
A score of 1 was given to each of the following clinical signs: lethargy, ruffled fur, hunchback posture, and rapid breathing.
4 dpi minus 0 dpi body weight.
Virus Shedding Was Similar between Orally and i.n. Infected Hamsters
After oral inoculation, the viral load was detected from oral swabs for 10 days with higher titer before 8 dpi, then decreased until 12 dpi (Figure 5F). Oral swabs from i.n. infected hamsters had a viral load similar to that of orally infected hamsters, except at 2 dpi, when a significantly higher viral load was detected in i.n. infected hamsters (Figure 5F). The fecal samples had a lower viral load compared to oral swabs, which became undetectable after 8 dpi (Figure 5G). Overall, despite the lack of disease signs and weight loss, orally infected hamsters had similar viral loads and similar durations of virus shedding in oral swabs (11.33 days) and fecal samples (6.67 days) compared to i.n. infected hamsters (9.2 and 6.8 days, respectively).
Discussion
Clinical and histopathological severity of COVID-19 in hamsters was found to increase proportionally with the i.n. infectious dose of SARS-CoV-2. This is an important observation as it confirms that the initial infectious dose is a potentially modifiable risk factor for severe COVID-19. Epidemiological studies in humans have similarly suggested a link between exposure intensity and clinical severity for various viral infections, including measles, polio, and chickenpox.20, 21, 22 In areas with COVID-19 transmission, physical distancing, face mask usage, and hand hygiene all are measures that can prevent exposure, and if this is not possible, they at least reduce the initial SARS-CoV-2 infectious dose. We believe that this would modify the disease course in vulnerable individuals such as the elderly.
The extent of host responses of representative inflammatory cytokine and chemokine in the lung tissue was also virus dose dependent, with higher viral inoculum resulting in higher and more persistent inflammatory cytokine/chemokine responses, which was accompanied by extensive immune cell influx into the lung and severe tissue damage. We compared the serial clinical, histopathological, and virological changes in animals i.n. or orally inoculated with SARS-CoV-2. While all hamsters could be infected i.n., even with a low virus inoculum of 100 PFUs, virus shedding in oral swabs and feces indicated that only 83% (10/12) of hamsters were infected after oral inoculation with a high infectious dose of 100,000 PFUs. Orally infected animals had milder infection, as manifested by the absence of signs of clinical distress and no weight loss, delayed onset of pneumonia with lower chemokine and cytokine response, a lower severity of inflammatory damage, and lower N protein expression in their lungs. Most groups working on COVID-19 animal models use the i.n. virus challenge. For studying the pathogenesis of severe COVID-19, we inoculated the SARS-CoV-2 in a volume of 50 μL inoculum to ensure that both the upper and lower airways were immediately exposed to the virus. However, the extent to which such modes of inoculation models reflect real-life COVID-19 transmission in humans is uncertain, especially given that serological studies indicate that >90% of COVID-19 infections are subclinical or mild.23 Also, such models do not reflect a significant route of exposure in the human population, namely hand contact with COVID-19 patients or virus-contaminated surfaces followed by touching the oral mucosa with contaminated fingers. SARS-CoV-2 is known to persist for several hours to days on metallic or plastic surfaces.24 Our data in this study prove that the oral route of inoculation can establish SARS-CoV-2 infections in hamsters with an infection pattern that is consistent with mild COVID-19. Sun and colleagues,25 using human ACE2 transgenic mice demonstrated that intragastric inoculation of SARS-CoV-2 established productive infection and interstitial pneumonia. Consistent with our hamster model, gastroenteric infection, even with high virus doses, caused milder lung damage with no clinical signs in the mice. Compared with their intragastric inoculation, our oral inoculation model may be more clinically relevant to orally acquired infection.
The “portal of entry” following oral inoculation was uncertain. The virus may begin replication in the oropharynx or may be swallowed into the gastrointestinal tract before starting infection there. The latter was considered likely, given the high proportion of COVID-19 patients with fecal shedding, the survival of SARS-CoV-2 in stool, and the ability of human enteroids to support SARS-CoV-2 replication.5,12 However, our hamster model suggests that the former possibility of local oropharyngeal replication is more likely. Oral inoculation allows the virus to multiply locally in the oropharynx before entering the lungs by inhalation, micro-aspiration, or viremia after replication in the oropharyngeal lymphoid tissue. SARS-CoV-2 tolerated simulated fasted gastric and fed intestinal juice poorly. This was unlike Middle East respiratory syndrome (MERS)-CoV, which we previously reported can maintain some viability in the presence of fed-state intestinal fluids.26 A previous protein intrinsic disorder-based model predicted that the matrix and nucleocapsid protein of MERS-CoV form relatively hard inner and outer shells that confer upon the virus more stability in the environment27; this may explain, at least in part, why MERS-CoV is more tolerant than SARS-CoV-2 of the bile salt and other digestive enzymes in the small intestine fluid. As expected, little viral N antigen was evident in the enterocytes of orally infected hamsters. In individuals taking proton pump inhibitors (PPIs), which reduce gastric acidity, this important defense mechanism is compromised. PPI use has been linked to the increased risk of SARS-CoV-2-related acute respiratory distress syndrome in a recent observational study.28 We therefore caution against indiscriminate PPI use during this pandemic.
We have previously shown that the virus can be transmitted by close contact in co-housed hamsters and by respiratory droplet or airborne aerosols in hamsters housed in separate cages. The latter two routes of transmission are supported by the predominant pathological changes in the respiratory tract after i.n. inhalation.10,29 However, for close contact, a combination of transmission routes, including droplet/aerosol transmission and oral contact transmission, can occur. Piecing together the exact route of transmission in close-contact settings is important because many clusters of infections are related to food premises, where people talk, eat, and drink in close proximity without face coverings. Besides exposure to exhaled respiratory droplets, oral exposure to virus-laden salivary droplets directly or indirectly via utensils, the environment, and even cross-contaminated food and drink is likely to occur in such settings. Saliva from COVID-19 patients can have a very high viral load of 8 to 9 log/mL and can be culture positive for SARS-CoV-2.30 In this study, we showed that orally infected hamsters could shed the virus even when they have no signs of clinical disease, which is not different from those i.n. infected hamsters with severe disease. Therefore, our experimental evidence, together with the epidemiological evidence, suggests that the oral route of virus transmission should not be neglected. Public awareness of the possible risk in food and drink premises should be raised.
Limitations of Study
Our study is limited by the difficulties in elucidating how orally acquired SARS-CoV-2 reached and established infection in the lung. Further studies should be performed to understand the exact anatomical route of virus dissemination. Moreover, we were unable to detect infectious titer in the fecal samples for the documentation of fecal-oral transmission. However, false negative viral culture from fecal samples due to cell line toxicity and bacterial overgrowth can confound our results. In summary, oral SARS-CoV-2 inoculation by feeding the virus to conscious hamsters can establish subclinical COVID-19 with mild lung pathology and less cytokine and chemokine response when compared with i.n. infected hamsters.
STAR★Methods
Key Resources Table
| REAGENT or RESOURCE | SOURCE | IDENTIFIER |
|---|---|---|
| Antibodies | ||
| Rabbit monoclonal anti-ACE2 | Thermo Fisher Scientific | Cat#MA5-32307, RRID:AB_2809589 |
| Rabbit polyclonal anti-SARS-CoV N protein | In-house10 | N/A |
| Donkey polyclonal anti-Rabbit IgG, FITC | Jackson ImmunoResearch | Cat#711-095-152, RRID:AB_2315776 |
| Goat Anti-Rabbit IgG Antibody (H+L), Biotinylated | Vector Laboratories | Cat#BA-1000 RRID:AB_2313606 |
| Bacterial and Virus Strains | ||
| SARS-CoV-2/human/HKG/HKU-001a/2020 | Clinical isolate31 | GenBank:MT230904 |
| Chemicals, Peptides, and Recombinant Proteins | ||
| FaSSIF/FeSSIF/FaSSGF | Biorelevant | Cat#FFF01 |
| FaSSGF Buffer Concentrate | Biorelevant | Cat#FASGBUF01 |
| FaSSIF Buffer Concentrate | Biorelevant | Cat#FASBUF01 |
| FeSSIF Buffer Concentrate | Biorelevant | Cat#FESBUF01 |
| Bovine Serum Albumin | Sigma-Aldrich | Cat#A3059 |
| Formaldehyde solution | Sigma-Aldrich | Cat#252549 |
| Phosphate-Buffered Saline | Thermo Fisher Scientific | Cat#10010023 |
| Fetal Bovine Serum | Thermo Fisher Scientific | Cat#16140071 |
| Dulbecco’s Modified Eagle Medium | Thermo Fisher Scientific | Cat#11966025 |
| Penicillin-Streptomycin | Thermo Fisher Scientific | Cat#15070063 |
| Critical Commercial Assays | ||
| QIAamp Viral RNA Mini Kit | QIAGEN | Cat#52906 |
| QuantiNova Probe PCR Kit | QIAGEN | Cat#208256 |
| MiniBEST Universal RNA Extraction Kit | Takara | Cat#9767 |
| PrimeScript RT Reagent Kit | Takara | Cat#RR037A |
| Experimental Models: Cell Lines | ||
| Vero E6 cell line | ATCC | Cat# CRL-1586, RRID:CVCL_0574 |
| RD cell line | ATCC | Cat# CCL-136, RRID:CVCL_1649 |
| Huh7 cell line | JCRB | Cat# JCRB0403, RRID:CVCL_0336 |
| Experimental Models: Organisms/Strains | ||
| Hamster/Golden Syrian | Centre for Comparative Medicine Research, the University of Hong Kong | N/A |
| Oligonucleotides | ||
| Primer sequences are provided in the Table S4 | This paper | N/A |
| Software and Algorithms | ||
| cellSens | Olympus | RRID:SCR_014551 |
| GraphPad Prism 8 | GraphPad Software | RRID:SCR_002798 |
Resource Availability
Lead Contact
Further information and requests for resources and reagents can be directed to the Lead Contact KY Yuen (kyyuen@hku.hk)
Materials Availability
This study did not generate new unique reagents.
Data and Code Availability
This study did not generate any unique datasets or code.
Experimental Model and Subject Details
Virus and biosafety
SARS-CoV-2 HKU-001a strain (GenBank accession number: MT230904) was isolated from a laboratory-confirmed case of COVID-19 in Hong Kong in African green monkey kidney cells (Vero E6) as we previously reported.31 The virus stock was prepared and titrated after three serial passages and stored at −80°C until use. All experiments involving live SARS-CoV-2 were performed in Biosafety Level-3 (BSL-3) facility of the University of Hong Kong (HKU) following approved standard operating procedures.
Animals
Syrian hamsters, male and female, aged 6-8 weeks old, were obtained from the Chinese University of Hong Kong Laboratory Animal Service Centre through the HKU Centre for Comparative Medicine Research (CCMR). The animals were kept in biosafety level 2 facility with free access to standard pellet feed and water. Animal experimental procedures were approved by the Committee on the Use of Live Animals in Teaching and Research of The University of Hong Kong (CULATR #5370-20).
Cell lines
Vero E6 (clone of Vero-76, ATCC, CRL-1586) and human Rhabdomyosarcoma cell line (RD cell, ATCC, CCL-136) cells and human Hepatocellular carcinoma cell line (Huh7, JCRB0403, JCRB cell bank of Okayama University) were cultured in Dulbecco’s Modified Eagle Medium (DMEM) supplemented with 10% fetal bovine serum and 1% penicillin/streptomycin.
Method Details
Virus infection experiments
Male and female adult Syrian hamsters 6-8 weeks of age were randomly divided into experimental groups in this study. The numbers of animals included in each experiment are listed in Table S3. For SARS-CoV-2 intranasal inoculation, 102, 103, 104 or 105 PFUs of SARS-CoV-2 in 100 μL DMEM was intranasally inhaled by each animal under intraperitoneal ketamine (100mg/kg) and xylazine (10mg/kg) anesthesia.10 For oral inoculation, each conscious hamster was given 105 PFUs of the virus in 200 μL DMEM drop-by-drop through spontaneous self-swallowing without anesthesia. After virus inoculation, the hamsters were monitored twice daily for disease signs and body weight. At 12 hours, 4, and 7 days post infection (hpi, dpi) 3-6 animals were sacrificed for the collection of respiratory and gastrointestinal tract tissues for virological and histological analyses. Oral swabs and feces were collected from each hamster every other day throughout the 14-day study period and stored in viral transport media at −80°C until use for virological studies.
Determination of viral load by real time RT-PCR and TCID50 assay
Lung, Trachea, nasal turbinate, oral mucosa, tongue, esophagus, stomach, small intestinal tissues were homogenized in 1mL of DMEM with 1% penicillin/streptomycin, 350μl of the homogenate was for total RNA extraction using MiniBEST universal RNA extraction kit (Takara). Oral swab and feces sample in 1mL of viral transporting medium were also extracted for total RNA. One step quantitative real time RT PCR (qRT-PCR) was performed for detection of viral RdRp gene copies using QuantiNova Probe RT-PCR kit (QIAGEN) on LightCycler 480 system (Roche). Primers and probes were listed in Table S4. Infectious viral titer in homogenized tissues was determined by median tissue culture infection dose (TCID50) assay in Vero E6 cells as we previously described.10
Histopathology, immunofluorescence and immunochemistry staining
Tissues fixed in 10% formalin immediately after sampling were processed into paraffin-embedded block. 4μm of sectioned were stained by hematoxylin and eosin (H&E) for histopathological study. SARS-CoV-2 nucleocapsid (N) protein expression in hamster tissues were stained using in-house produced rabbit anti-SARS-CoV N protein antibody and FITC-conjugated donkey anti-rabbit IgG antibody.10 De-paraffinized and rehydrated tissue sections were first treated with Antigen Unmasking Solution in pressure cooker (Vector Laboratories) then blocked with 1% bovine serum albumin (BSA) for 30 minutes at room temperature. Primary and secondary antibody was incubated at 4°C overnight and at room temperature for 30min respectively. The sections were mounted with VECTASHIELD mounting medium with 4’,6-diamidino-2-phenylindole (DAPI) (Vector Laboratories). To identify the expression of angiotensin-converting enzyme 2 (ACE2), immunohistochemistry staining was performed after antigen retrieval as above, using rabbit monoclonal anti-ACE2 (MA5-32307, ThermoFisher) at 4°C for overnight and biotin-conjugated goat anti-rabbit IgG antibody (Vector Laboratories) at room temperature for 30 minutes. Streptavidin/peroxidase complex reagent (Vector Laboratories) was then incubated for 30 min followed by color development using 3,3′-diaminobenzidine (DAB) (Vector Laboratories) and counterstaining with hematoxylin.
Semiquantitative evaluation of the hamster lung histopathological changes
H&E stained lung tissue sections were blinded for the identities of experimental settings and examined by trained histo-pathologists. Histological scoring system based on the criteria listed in Table S1 was applied to assess the severity of lung damage. Briefly, each sample was first examined under lower power lens (4x) to determine the scope of tissue damage and assign a score from 0 to 3 as normal morphology to most diffuse tissue lesions. Then, inflammatory lesions in bronchiolar, alveolar and vascular structures was assessed, 0-3 scores were given to each category of pathological changes. A total of 27 scores would be accumulated for the most severely damaged lung tissue.
In vitro stability of SARS-CoV-2 in simulated human gastrointestinal fluid
Simulated human gastrointestinal fluid were prepared according to the manufacturer’s instruction with some modification as we previously described.26 The solutions tested included: Fasted-state simulated gastric fluid (FaSSGF, pH 1.6), Fasted-state simulated intestinal fluid (FaSSIF, pH 6.5), Fed-state simulated gastric fluid (FeSSGF, pH 5.0), Fed-state simulated intestinal fluid (FeSSIF, pH 5.0). 105 PFUs of SARS-CoV-2, SARS-CoV, human coronavirus 229E (hCoV-229E) or human enterovirus 71 (EV-A71) were mixed with above solution individually at 1:10 ration. After 0, 30, 60 or 120 minutes of incubation at 37°C, the mixture was neutralized with sodium hydroxide and then titrated viral viability by TCID50 assay. Viruses treated with culture medium were included as controls. SARS-CoV-2 and SARS-CoV were performed in Vero E6 cells, EV-A71 in RD cells, and hCoV-229E in Huh7 cells.
Determination of cytokine and chemokine gene expression
Total RNA extracted from lung and small intestinal tissues was reverse transcribed into cDNA with PrimeScript™ RT reagent kit (Takara). Real-time quantitative PCR was performed with gene specific primers (Table S4) using SYBR Premix Ex TaqII kit (Takara). The expression of house-keeping gene β-actin was analyzed in parallel to normalize the amount of RNA. The ΔΔCt method was applied for the comparison of the differential gene expressions between samples.
Microneutralization assay
Serum taken from orally or intranasally inoculated hamsters at 7dpi and 14dpi was tested for viral neutralizing antibody titer by microneutralizing assay in Vero E6 cells as we described previously.10 Briefly, the 2-fold serial diluted (1:10 to 1:1280) serum samples were mixed with 100 TCID50 of SARS-CoV-2 virus and incubated at 37°C for 1 hour. The mixture was then added to Vero E6 cells and further incubated at 37°C for 72 hours. The neutralizing antibody titer was defined as the highest dilution that inhibits 50% of cytopathic effect.
Quantification and Statistical Analysis
All data were analyzed with Prism 8.0 (GraphPad Software Inc). One-way ANOVA, Two-way ANOVA and multiple Student’s t test were used to determine significant differences between groups. Categorical variables were analyzed by Chi-square test. P value of < 0.05 was considered statistically significant.
Acknowledgments
This study was partly supported by the donations of May Tam Mak Mei Yin, Richard Yu and Carol Yu, the Shaw Foundation Hong Kong, Michael Seak-Kan Tong, Respiratory Viral Research Foundation Limited, Hong Kong Sanatorium & Hospital, Lo Ying Shek Chi Wai Foundation, Hui Ming, Hui Hoy and Chow Sin Lan Charity Fund Limited, Chan Yin Chuen Memorial Charitable Foundation, Marina Man-Wai Lee, the Hong Kong Hainan Commercial Association South China Microbiology Research Fund, the Jessie & George Ho Charitable Foundation, Perfect Shape Medical Limited, Kai Chong Tong, Foo Oi Foundation Limited, and Tse Kam Ming Laurence; and funding from the National Program on Key Research Project of China (grant no. 2020YFA0707500 and 2020YFA0707504), and the Consultancy Service for Enhancing Laboratory Surveillance of Emerging Infectious Diseases and Research Capability on Antimicrobial Resistance for the Department of Health of the Hong Kong Special Administrative Region Government. The funding sources had no role in the study design, data collection, analysis, interpretation, or writing of the article.
Author Contributions
A.C.-Y.L., A.J.Z., J.F.-W.C., C.L., and K.-Y.Y. had roles in the study design, data collection, data analysis, data interpretation, and writing of the manuscript. Z.F., F.L., Y.C., R.L., J.-P.C., V.K.-M.P., C.C.-S.C., S.S., K.K.-W.T., S.Y., H.C., and J.Z. had roles in the experiments, data collection, data analysis, and/or data interpretation. All of the authors reviewed and approved the final version of the manuscript.
Declaration of Interests
K.-Y.Y. serves as a member of the Advisory Committee on Centre for Health Protection in Hong Kong and is the chair of the Scientific Committee on Emerging and Zoonotic Diseases of the Centre for Health Protection in Hong Kong. J.F.-W.C. is an invited member of the WHO ad hoc expert group on COVID-19 animal models.
Published: September 22, 2020
Footnotes
Supplemental Information can be found online at https://doi.org/10.1016/j.xcrm.2020.100121.
Supplemental Information
References
- 1.World Health Organization . 2020. Coronavirus disease (COVID-19). Situation Report - 184.https://www.who.int/docs/default-source/coronaviruse/situation-reports/20200722-covid-19-sitrep-184.pdf?sfvrsn=7680210a_2 [Google Scholar]
- 2.Zhou P., Yang X.L., Wang X.G., Hu B., Zhang L., Zhang W., Si H.R., Zhu Y., Li B., Huang C.L. A pneumonia outbreak associated with a new coronavirus of probable bat origin. Nature. 2020;579:270–273. doi: 10.1038/s41586-020-2012-7. [DOI] [PMC free article] [PubMed] [Google Scholar]
- 3.Lu R., Zhao X., Li J., Niu P., Yang B., Wu H., Wang W., Song H., Huang B., Zhu N. Genomic characterisation and epidemiology of 2019 novel coronavirus: implications for virus origins and receptor binding. Lancet. 2020;395:565–574. doi: 10.1016/S0140-6736(20)30251-8. [DOI] [PMC free article] [PubMed] [Google Scholar]
- 4.Chan J.F., Kok K.H., Zhu Z., Chu H., To K.K., Yuan S., Yuen K.Y. Genomic characterization of the 2019 novel human-pathogenic coronavirus isolated from a patient with atypical pneumonia after visiting Wuhan. Emerg. Microbes Infect. 2020;9:221–236. doi: 10.1080/22221751.2020.1719902. [DOI] [PMC free article] [PubMed] [Google Scholar]
- 5.Zhou J., Li C., Liu X., Chiu M.C., Zhao X., Wang D., Wei Y., Lee A., Zhang A.J., Chu H. Infection of bat and human intestinal organoids by SARS-CoV-2. Nat. Med. 2020;26:1077–1083. doi: 10.1038/s41591-020-0912-6. [DOI] [PubMed] [Google Scholar]
- 6.Lau S.K., Woo P.C., Li K.S., Huang Y., Tsoi H.W., Wong B.H., Wong S.S., Leung S.Y., Chan K.H., Yuen K.Y. Severe acute respiratory syndrome coronavirus-like virus in Chinese horseshoe bats. Proc. Natl. Acad. Sci. USA. 2005;102:14040–14045. doi: 10.1073/pnas.0506735102. [DOI] [PMC free article] [PubMed] [Google Scholar]
- 7.Cheng V.C.C., Lau S.K.P., Woo P.C.Y., Yuen K.Y. Severe acute respiratory syndrome coronavirus as an agent of emerging and reemerging infection. Clin. Microbiol. Rev. 2007;20:660–694. doi: 10.1128/CMR.00023-07. [DOI] [PMC free article] [PubMed] [Google Scholar]
- 8.Hung I.F., Cheng V.C., Li X., Tam A.R., Hung D.L., Chiu K.H., Yip C.C., Cai J.P., Ho D.T., Wong S.C. SARS-CoV-2 shedding and seroconversion among passengers quarantined after disembarking a cruise ship: a case series. Lancet Infect. Dis. 2020;20:1051–1060. doi: 10.1016/S1473-3099(20)30364-9. [DOI] [PMC free article] [PubMed] [Google Scholar]
- 9.Cheng V.C.C., Wong S.C., Chuang V.W.M., So S.Y.C., Chen J.H.K., Sridhar S., To K.K.W., Chan J.F.W., Hung I.F.N., Ho P.L., Yuen K.Y. The role of community-wide wearing of face mask for control of coronavirus disease 2019 (COVID-19) epidemic due to SARS-CoV-2. J. Infect. 2020;81:107–114. doi: 10.1016/j.jinf.2020.04.024. [DOI] [PMC free article] [PubMed] [Google Scholar]
- 10.Chan J.F., Zhang A.J., Yuan S., Poon V.K., Chan C.C., Lee A.C., Chan W.M., Fan Z., Tsoi H.W., Wen L. Simulation of the clinical and pathological manifestations of Coronavirus Disease 2019 (COVID-19) in golden Syrian hamster model: implications for disease pathogenesis and transmissibility. Clin. Infect. Dis. 2020 doi: 10.1093/cid/ciaa325. [DOI] [PMC free article] [PubMed] [Google Scholar]
- 11.Cheng V.C., Wong S.C., Chan V.W., So S.Y., Chen J.H., Yip C.C., Chan K.H., Chu H., Chung T.W., Sridhar S. Air and environmental sampling for SARS-CoV-2 around hospitalized patients with coronavirus disease 2019 (COVID-19) Infect. Control Hosp. Epidemiol. 2020 doi: 10.1017/ice.2020.282. [DOI] [PMC free article] [PubMed] [Google Scholar]
- 12.Cheung K.S., Hung I.F.N., Chan P.P.Y., Lung K.C., Tso E., Liu R., Ng Y.Y., Chu M.Y., Chung T.W.H., Tam A.R. Gastrointestinal Manifestations of SARS-CoV-2 Infection and Virus Load in Fecal Samples From a Hong Kong Cohort: Systematic Review and Meta-analysis. Gastroenterology. 2020;159:81–95. doi: 10.1053/j.gastro.2020.03.065. [DOI] [PMC free article] [PubMed] [Google Scholar]
- 13.Imai M., Iwatsuki-Horimoto K., Hatta M., Loeber S., Halfmann P.J., Nakajima N., Watanabe T., Ujie M., Takahashi K., Ito M. Syrian hamsters as a small animal model for SARS-CoV-2 infection and countermeasure development. Proc. Natl. Acad. Sci. USA. 2020;117:16587–16595. doi: 10.1073/pnas.2009799117. [DOI] [PMC free article] [PubMed] [Google Scholar]
- 14.Sia S.F., Yan L.M., Chin A.W.H., Fung K., Choy K.T., Wong A.Y.L., Kaewpreedee P., Perera R.A.P.M., Poon L.L.M., Nicholls J.M. Pathogenesis and transmission of SARS-CoV-2 in golden hamsters. Nature. 2020;583:834–838. doi: 10.1038/s41586-020-2342-5. [DOI] [PMC free article] [PubMed] [Google Scholar]
- 15.Mao R., Qiu Y., He J.S., Tan J.Y., Li X.H., Liang J., Shen J., Zhu L.R., Chen Y., Iacucci M. Manifestations and prognosis of gastrointestinal and liver involvement in patients with COVID-19: a systematic review and meta-analysis. Lancet Gastroenterol. Hepatol. 2020;5:667–678. doi: 10.1016/S2468-1253(20)30126-6. [DOI] [PMC free article] [PubMed] [Google Scholar]
- 16.Shivkumar M., Milho R., May J.S., Nicoll M.P., Efstathiou S., Stevenson P.G. Herpes simplex virus 1 targets the murine olfactory neuroepithelium for host entry. J. Virol. 2013;87:10477–10488. doi: 10.1128/JVI.01748-13. [DOI] [PMC free article] [PubMed] [Google Scholar]
- 17.Gardner J., Rudd P.A., Prow N.A., Belarbi E., Roques P., Larcher T., Gresh L., Balmaseda A., Harris E., Schroder W.A., Suhrbier A. Infectious Chikungunya Virus in the Saliva of Mice, Monkeys and Humans. PLOS ONE. 2015;10:e0139481. doi: 10.1371/journal.pone.0139481. [DOI] [PMC free article] [PubMed] [Google Scholar]
- 18.Cimolai N., Taylor G.P., Mah D., Morrison B.J. Definition and application of a histopathological scoring scheme for an animal model of acute Mycoplasma pneumoniae pulmonary infection. Microbiol. Immunol. 1992;36:465–478. doi: 10.1111/j.1348-0421.1992.tb02045.x. [DOI] [PubMed] [Google Scholar]
- 19.Li C., Li C., Zhang A.J.X., To K.K.W., Lee A.C.Y., Zhu H., Wu H.W.L., Chan J.F.W., Chen H., Hung I.F.N. Avian influenza A H7N9 virus induces severe pneumonia in mice without prior adaptation and responds to a combination of zanamivir and COX-2 inhibitor. PLOS ONE. 2014;9:e107966. doi: 10.1371/journal.pone.0107966. [DOI] [PMC free article] [PubMed] [Google Scholar]
- 20.Garenne M., Aaby P. Pattern of exposure and measles mortality in Senegal. J. Infect. Dis. 1990;161:1088–1094. doi: 10.1093/infdis/161.6.1088. [DOI] [PubMed] [Google Scholar]
- 21.Poulsen A., Cabral F., Nielsen J., Roth A., Lisse I.M., Vestergaard B.F., Aaby P. Varicella zoster in Guinea-Bissau: intensity of exposure and severity of infection. Pediatr. Infect. Dis. J. 2005;24:102–107. doi: 10.1097/01.inf.0000151034.15747.4a. [DOI] [PubMed] [Google Scholar]
- 22.Nielsen N.M., Hedegaard K., Aaby P. Intensity of exposure and severity of whooping cough. J. Infect. 2001;43:177–181. doi: 10.1053/jinf.2001.0907. [DOI] [PubMed] [Google Scholar]
- 23.Wang Y., Wang Y., Chen Y., Qin Q. Unique epidemiological and clinical features of the emerging 2019 novel coronavirus pneumonia (COVID-19) implicate special control measures. J. Med. Virol. 2020;92:568–576. doi: 10.1002/jmv.25748. [DOI] [PMC free article] [PubMed] [Google Scholar]
- 24.van Doremalen N., Bushmaker T., Morris D.H., Holbrook M.G., Gamble A., Williamson B.N., Tamin A., Harcourt J.L., Thornburg N.J., Gerber S.I. Aerosol and Surface Stability of SARS-CoV-2 as Compared with SARS-CoV-1. N. Engl. J. Med. 2020;382:1564–1567. doi: 10.1056/NEJMc2004973. [DOI] [PMC free article] [PubMed] [Google Scholar]
- 25.Sun S.H., Chen Q., Gu H.J., Yang G., Wang Y.X., Huang X.Y., Liu S.S., Zhang N.N., Li X.F., Xiong R. A Mouse Model of SARS-CoV-2 Infection and Pathogenesis. Cell Host Microbe. 2020;28:124–133.e4. doi: 10.1016/j.chom.2020.05.020. [DOI] [PMC free article] [PubMed] [Google Scholar]
- 26.Zhou J., Li C., Zhao G.Y., Chu H., Wang D., Yan H.H.N., Poon V.K.M., Wen L., Wong B.H.Y., Zhao X.Y. Human intestinal tract serves as an alternative infection route for Middle East respiratory syndrome coronavirus. Sci. Adv. 2017;3:eaao4966. doi: 10.1126/sciadv.aao4966. [DOI] [PMC free article] [PubMed] [Google Scholar]
- 27.Goh G.K., Dunker A.K., Uversky V. Prediction of Intrinsic Disorder in MERS-CoV/HCoV-EMC Supports a High Oral-Fecal Transmission. PLOS Curr. 2013;5 doi: 10.1371/currents.outbreaks.22254b58675cdebc256dbe3c5aa6498b. ecurrents.outbreaks.22254b58675cdebc256dbe3c5aa6498b. [DOI] [PMC free article] [PubMed] [Google Scholar]
- 28.Luxenburger H., Sturm L., Biever P., Rieg S., Duerschmied D., Schultheiss M., Neumann-Haefelin C., Thimme R., Bettinger D. Treatment with proton pump inhibitors increases the risk of secondary infections and ARDS in hospitalized patients with COVID-19: coincidence or underestimated risk factor? J. Intern. Med. 2020 doi: 10.1111/joim.13121. [DOI] [PMC free article] [PubMed] [Google Scholar]
- 29.Chan J.F., Yuan S., Zhang A.J., Poon V.K., Chan C.C., Lee A.C., Fan Z., Li C., Liang R., Cao J. Surgical mask partition reduces the risk of non-contact transmission in a golden Syrian hamster model for Coronavirus Disease 2019 (COVID-19) Clin. Infect. Dis. 2020 doi: 10.1093/cid/ciaa644. [DOI] [PMC free article] [PubMed] [Google Scholar]
- 30.To K.K., Tsang O.T., Yip C.C., Chan K.H., Wu T.C., Chan J.M.C., Leung W.S., Chik T.S., Choi C.Y., Kandamby D.H. Consistent detection of 2019 novel coronavirus in saliva. Clin. Infect. Dis. 2020;71:841–843. doi: 10.1093/cid/ciaa149. [DOI] [PMC free article] [PubMed] [Google Scholar]
- 31.Chu H., Chan J.F.-W., Yuen T.T.-T., Shuai H., Yuan S., Wang Y., Hu B., Yip C.C.-Y., Tsang J.O.-L., Huang X. Comparative tropism, replication kinetics, and cell damage profiling of SARS-CoV-2 and SARS-CoV with implications for clinical manifestations, transmissibility, and laboratory studies of COVID-19: an observational study. Lancet Microbe. 2020;1:e14–e23. doi: 10.1016/S2666-5247(20)30004-5. [DOI] [PMC free article] [PubMed] [Google Scholar]
Associated Data
This section collects any data citations, data availability statements, or supplementary materials included in this article.
Supplementary Materials
Data Availability Statement
This study did not generate any unique datasets or code.