

Summary
N6-methyladenosine (m6A) is the most abundant mRNA nucleotide modification and regulates critical aspects of cellular physiology and differentiation. m6A is thought to mediate its effects through a complex network of interactions between different m6A sites and three functionally distinct cytoplasmic YTHDF m6A-binding proteins (DF1, DF2, and DF3). In contrast to the prevailing model, we show that DF proteins bind the same m6A-modified mRNAs, rather than different mRNAs. Furthermore, we find that DF proteins do not induce translation in HeLa cells. Instead, the DF paralogs act redundantly to mediate mRNA degradation and cellular differentiation. The ability of DF proteins to regulate stability and differentiation becomes evident only when all three DF paralogs are simultaneously depleted. Our studies reveal a unified model of m6A function in which all m6A-modified mRNAs are subjected to the combined action of the YTHDF proteins in proportion to the number of m6A sites.
In brief
The transcriptome-wide effects of the m6A mRNA effectors, known as the YTHDF proteins, demonstrates that they act redundantly to induce degradation of the same subset of mRNAs, with no evidence for a role in promoting translation
Graphical Abstract
Introduction
Methylation of adenosine in mRNA to form N6-methyladenosine (m6A) has important roles in cellular physiology. Initial studies in Arabidopsis and yeast showed defective seed development and sporulation, respectively, upon genomic deletion of the m6A-forming methyltransferase (Clancy, 2002; Zhong et al., 2008). More recent studies have further documented the connection between m6A and cellular differentiation in embryonic and hematopoietic stem cells, in acute myeloid leukemia cells, as well as other cell types (Barbieri et al., 2017; Cui et al., 2017; Geula et al., 2015; Lee et al., 2019; Vu et al., 2017; Wang et al., 2014b). Together these studies show that m6A affects cellular physiology, and these effects likely reflect modulation of mRNA fate by m6A.
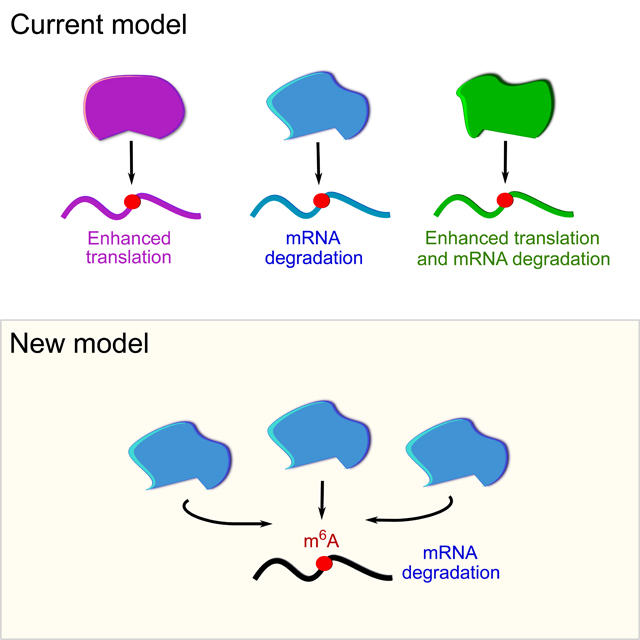
The effects of m6A in cytosolic transcripts are thought to be mediated by a poorly understood and complex network of interactions between specific m6A sites and specific members of the YTHDF family of m6A-binding protein (Shi et al., 2017; Shi et al., 2019). The YTHDF family includes three paralogs, YTHDF1, YTHDF2, and YTHDF3 (DF1, DF2, and DF3, respectively), each of which have different reported functions: DF1 enhances mRNA translation, DF2 promotes mRNA degradation, and DF3 enhances both translation and degradation (Li et al., 2017; Shi et al., 2017; Wang et al., 2015; Wang et al., 2014a). According to the prevailing model (Shi et al., 2017; Shi et al., 2019), the largest fraction of m6A-mRNAs (~44%) bind a single DF paralog, but some m6A-mRNAs (~32%) bind two DF paralogs. m6A-mRNAs that bind all three DF paralogs are relatively rare (24%). Based on these studies, each DF paralog mediates the effects of m6A by targeting specific cohorts of m6A-mRNAs, which has led to the major concept that different DF paralogs control distinct physiologic processes (Anders et al., 2018; Han et al., 2019; Hesser et al., 2018; Paris et al., 2019; Shi et al., 2018).
Although the ability of the DF paralogs to bind different m6A sites is fundamental to explain the different biology of the DF paralogs, it remains unclear how they achieve selective binding to different m6A sites. Additionally, the mechanistic basis for the different functions of DF proteins remains unknown, especially in light of their high sequence identity (Patil et al., 2018; Wang and He, 2014).
Here, we present a fundamentally different model to explain the effects of m6A on mRNA and how DF proteins mediate these effects. In contrast to the prevailing view that different m6A sites bind largely different DF paralogs, we find that all m6A sites bind all three DF paralogs in an essentially similar manner. Thus, all DF paralogs regulate the same mRNAs based on the presence of m6A sites. We also find that DF paralogs are not translation enhancers, as is currently thought for DF1 and DF3. Instead, we show that the major effect of the three DF paralogs is to promote mRNA degradation in a largely redundant manner. The redundant effect of DF depletion has not been detected previously since these proteins are typically depleted separately rather than simultaneously. Our finding that DF paralogs have similar functions, rather than different functions is supported by their essentially identical m6A-binding properties, their similar set of associated binding proteins, and their shared subcellular localizations. Furthermore, we show that effects of m6A on cellular differentiation can be explained by the combined action of the three DF proteins, rather than individual DF proteins. Overall, these studies reveal a new unified model of m6A function, in which m6A predominantly influences mRNA degradation via the combined action of three largely redundant DF proteins.
Results
Structural analysis of different YTH domains reveals their similar RNA-binding properties
An important concept in m6A-mediated gene regulation is that the different DF proteins bind distinct subsets of m6A residues in the transcriptome (Han et al., 2019; Liu et al., 2018; Shi et al., 2017; Shi et al., 2019; Shi et al., 2018; Wang et al., 2015). As a result, m6A is thought to influence mRNAs in different ways, depending on which DF paralog it binds. Based on this, a set of DF1, DF2, or DF3 “unique” m6A sites are commonly used for analysis of the function of each DF paralog (Han et al., 2019; Liu et al., 2018; Ok Hyun Park, 2019; Shi et al., 2017; Shi et al., 2019; Shi et al., 2018). Because this m6A-specific binding behavior of the DF paralogs ultimately determines how m6A regulates cellular processes, a major goal is to understand the basis for selective m6A recognition by the DF paralogs.
To address this, we first asked if differences in the YTH domains might account for the different binding preferences of the DF proteins. The YTH domain comprises ~134 amino acids and mediates the selective binding to m6A (Li et al., 2014; Patil et al., 2018; Xu et al., 2015). We used the crystal structures of the DF1 and DF2 YTH domains bound to m6A-containing RNA (Li et al., 2014; Xu et al., 2015) to annotate the amino acids that recognize m6A and the adjacent nucleotides. In the case of DF3, an RNA-bound structure has not yet been reported; however, each of the amino acids that bind m6A and the adjacent nucleotides in DF1, DF2 are conserved in DF3 (Figure S1A), suggesting that the structural mechanism of m6A binding is the same for all three DF proteins.
It remains possible that the few amino acids that differ between the YTH domains (Figure S1A) could affect RNA binding. However, these amino acids map on the surface opposite from the RNA-binding pocket (Figure 1A), suggesting that they might not affect YTH-RNA interactions. Furthermore, each full-length DF protein shows a similar binding affinity for an m6A-containing RNA oligonucleotide (Figure S1B), consistent with previous studies (Arguello et al., 2019; Wang et al., 2014a; Xu et al., 2015). Overall, the RNA-binding surfaces for the three YTH domains appear identical.
Fig. 1. DF proteins bind the same m6A sites throughout the transcriptome.

(A) The amino acids that contact m6A and the m6A-proximal nucleotides are conserved in the DF1, DF2 and DF3 YTH domain. Conserved (grey) and non-conserved amino acids (blue) are shown on the YTH domain, rendered from the DF1-m6A-RNA structure (Xu et al., 2015). Conserved is defined as amino acids identical in all three DF paralogs, while non-conserved is defined as amino acids that are different in at least one DF paralog. Front view (left), back view (rotated 180°, right).
(B) DF1, DF2, and DF3 have similar binding preferences for different m6A submotifs. Shown is the prevalence of different binding sites recognized by DF1, DF2, DF3 based on iCLIP binding data. For comparison, the percentage of each DRACH motif identified by miCLIP is shown. The three DF paralogs have similar binding site preferences. Their binding preferences are similar to the prevalence of the m6A sequence motifs.
(C) Each m6A site in the transcriptome binds DF1, DF2, and DF3. DF1, DF2, and DF3 binding at 4182 m6A mRNAs was based on DF1, DF2, and DF3 iCLIP datasets in HEK293T cells (Patil et al., 2016). m6A sites are plotted as points in which the x and y coordinates represent the number of normalized DF iCLIP reads overlapping that site (log2 normalized). We did not find m6A sites that preferentially bound either DF1, DF2, or DF3. The high Pearson correlation coefficients (r) show that DF paralogs have highly similar binding preferences. Similar results were found in HeLa cells using DF PAR-CLIP datasets (Figure S1E).
(D) DF1, DF2, and DF3 iCLIP reads show a similar distribution in mRNAs, which resembles themiCLIP read distribution. Representative examples of DF1, DF2 and DF3 iCLIP read distribution and miCLIP read distribution on HNRNPF and MDM2. iCLIP and miCLIP data shown here was obtained in HEK293T cells and was similar to data obtained in HeLa cells (Figure S1F–1H).
The DF paralogs show equivalent binding to all m6A sites throughout the transcriptome
The different transcriptome-wide binding properties reported for the DF paralogs (Shi et al., 2017) could reflect the ability of the different DF paralogs to bind different m6A sequence motifs. m6A residues are almost exclusively found in a single highly conserved sequence motif: DR-m6A-CH (D = A, G, U; R = A, G; H = A, C, U) (Canaani et al., 1979; Dimock and Stoltzfus, 1977; Linder et al., 2015; Wei et al., 1976). We reasoned that the differential association of DF paralogs with distinct sets of m6A sites could be explained by their preferences for certain DRACH submotifs, such as GG-m6A-CU vs. AG-m6A-CU.
To determine the binding preference for each DF paralog, we examined our recently generated transcriptome-wide iCLIP (individual-nucleotide resolution UV crosslinking and immunoprecipitation) maps of the binding sites of endogenously expressed DF1, DF2, and DF3 in HEK293T cells (Patil et al., 2016). We calculated the percentage of each DRACH sequence submotif at each DF-binding site identified by iCLIP and ranked the most common sequence submotifs bound by each DF paralog. These analyses showed a nearly identical frequency of each DRACH submotif bound by each DF paralog (Figure 1B). The rank-order of the prevalence of the submotifs recognized by the DF paralogs was similar to the overall prevalence of each m6A submotif in the transcriptome (Linder et al., 2015) (Figure 1B). Thus, each DF paralog shows the same binding preferences, which largely correlates with the abundance of m6A motifs, rather than a paralog-specific sequence preference.
Although the DF paralogs seem to bind m6A in proportion to the prevalence of the m6A motif, each paralog may be targeted to different set of m6A sites, as suggested by previous studies (Shi et al., 2017; Shi et al., 2019) (Figure S1C). Thus, we sought to identify the m6A sites uniquely bound by each DF paralog.
To do this, we quantified the number of DF1, DF2, and DF3 reads from the iCLIP datasets performed in HEK293T (Patil et al., 2016) that map to each of HEK293T m6A site (Linder et al., 2015), or, similarly, the FLAG-DF1 and FLAG-DF2 reads from the PAR-CLIP dataset performed in HeLa (Shi et al., 2017; Wang et al., 2015; Wang et al., 2014a) and mapped at each HeLa m6A site (Ke et al., 2017). We could not use the FLAG-DF3 PAR-CLIP dataset (Shi et al., 2017) since it contained a low number of reads mappable to cytosolic mRNAs (Figure S1D).
Using this m6A-centric approach, we found that there was a strong linear correlation in pairwise comparisons between DF1, DF2, and DF3 reads at each m6A site. This correlation was seen in both the PAR-CLIP datasets in HeLa cells mapped onto HeLa m6A sites (Figure S1E–S1F) and the iCLIP datasets in HEK293T cells mapped onto HEK293T m6A sites (Figure 1C). Notably, in contrast to the previous model that many m6A sites show DF-paralog-specific binding, we found no preferential enrichment of iCLIP or PAR-CLIP reads for any paralog at any m6A site. Overall, these results suggest that each m6A site is bound by DF1, DF2, and DF3 in similar proportions.
Because we were surprised by the lack of m6A sites uniquely bound by each of the DF proteins, we reexamined the previously reported DF1 and DF2 unique RNA-binding sites (Shi et al., 2017). We asked if DF1 binding, as measured by PAR-CLIP signal, was missing at DF2 unique sites, and vice versa. To test this, we plotted DF2 binding at each DF1 unique site and vice versa. This analysis shows that there is a comparable level of DF1 and DF2 binding at each DF1 unique site, and a comparable level of DF1 and DF2 binding at each DF2 unique site (Figure S1G and S1H). Thus, the previously described unique sites appear indistinguishable in terms of their DF1 and DF2 binding.
As a next step, we directly examined the PAR-CLIP reads on individual transcripts proposed to be DF1-unique or DF2 unique. After extensive visual inspection, we found essentially no differences in the distribution of DF1 and DF2 PAR-CLIP reads for any of these transcripts (Figure S1J). Notably, the PAR-CLIP reads correlated with the location of m6A-called sites, supporting the idea that DF binding is due to m6A. A similar effect was seen when using the iCLIP datasets for DF1, DF2, and DF3 (Figure 1D). These data further suggest that the sites that were previously described as being DF-paralog unique sites are not in fact unique.
Our reexamination of both the iCLIP and PAR-CLIP-seq studies contrast with previous reports showing each DF paralog has only partial overlap with m6A sites and with each other (Shi et al., 2017; Wang et al., 2015; Wang et al., 2014a) (Figure S1C). In the PAR-CLIP studies, DF paralog-binding sites were determined based on a threshold number of misincorporation-containing reads at any individual site in the transcriptome. However, using a threshold approach in independent experiments can often produce false-negative sites. These arise because of the arbitrary nature of a threshold, which can cause some sites to be missed if they fall just beneath that threshold. For this reason, the threshold approach is not generally used for comparative analysis of datasets (Chakrabarti et al., 2018; Guertin et al., 2019; Landt et al., 2012). Instead comparative analysis is often performed by selecting a set of specific transcriptomic sites, such as sequence motifs, and determining whether one CLIP dataset or another shows preferential binding to any of these sites (Dominguez et al., 2018; Wheeler et al., 2018). Our approach is similar, i.e., by comparing DF paralogs binding at mapped m6A sites, we find that the RNA binding of DF paralogs is essentially identical, even when using different cell lines and different CLIP methodologies (iCLIP and PAR-CLIP).
Overall, these diverse lines of evidence, including structural similarity, motif analysis, and analysis of DF binding at each m6A site in the transcriptome using CLIP datasets from two cell lines suggest that the DF paralogs do not exhibit different patterns of m6A-binding in the transcriptome. Instead, they appear to have similar binding preferences and affinities.
DF proteins exhibit a similar protein interaction network
Although we find that the DF paralogs bind the same m6A sites, an unresolved question is how these nearly identical proteins exert different molecular effects on m6A-mRNAs, especially in the case of DF1 (translation) compared to DF2 (degradation). A compelling possibility for divergent functions of DF paralogs might lie within their effector domain, a ~40 kDa low-complexity domain, which comprises the remainder of the protein outside the YTH domain (Patil et al., 2018). The recruitment of a distinct set of proteins to the effector domain of each DF paralog may allow the DF paralogs to exert different effects on m6A-mRNAs. We thus analyzed both the differences in the effector domains between DF paralogs, as well as their protein-interacting partners.
Examination of the three effector domains show them to be superficially similar. Each is a proline/glutamine-rich low complexity domain with ~60% amino acid identity and 70% amino acid similarity (Figure S2A). Furthermore, the hydrophobicity, and charge distribution along the length of the low complexity domains are highly similar. Additionally, the positions of the disordered regions within the low-complexity domains are similar for each paralog (Figure 2A).
Fig. 2. DF proteins exhibit similar binding partners and intracellular localization.

(A) The three DF paralogs have similar intrinsically disordered regions, hydrophobicity, andamino acid charge distribution along the length of their effector domains. A schematic representation of each DF protein is shown with the YTH domain indicated. Green indicates disordered regions (see STAR Methods). Each of these physiochemical parameters show high similarity among all DF paralogs, suggesting that these proteins may exhibit similar properties.
(B) DF paralogs show similar binding preferences for their high-confidence interacting proteins.Shown are pairwise comparisons of the average spectral counts of peptides derived from each protein identified as a DF paralog interactor in vivo (Youn et al., 2018). Each protein interactor is plotted as a circle in which x and y coordinates represent the average spectral counts calculated based on a Bio-ID study of each DF paralog (log2 normalized values). The diameter is proportional to the average probability of interaction (AvgP). As indicated by the orange circles (high-confident interactors with AvgP > 0.95 for both DF paralogs), there is high level of correlation between each pair of DF paralogs in the spectral counts and AvgP for each DF high-confidence interactor. These interactors are enriched in proteins related to mRNA degradation pathways (shown in red). Proteins with a function in mRNA translation, including EIF3A and EIF3B, have a low AvgP and thus are considered low-confidence or non-specific interactors.
(C) DFs are predicted to have similar subcellular localization. Shown is the “Non-negative matrixfactorization” probability assigned to each DF paralog in each subcellular compartment calculated based on the protein-protein interaction network (see STAR Methods). Each DF paralog shows a similar probability of being classified as a P-body protein and high probability of being enriched in RNP granules or stress granules.
(D) Structured illumination microscopy (SIM) images indicate that the DF paralogs (red) arelocalized to small punctate structures (<150 nm) throughout the cytoplasm and P-bodies (150–200 nm) based on colocalization with EDC4 (green).
The different DF proteins may have different protein-interaction partners in order to mediate their different functions. We therefore examined a recent comprehensive Bio-ID study, in which 139 proteins were BirA-tagged, and interacting proteins were detected based on their proximity-induced biotinylation (Youn et al., 2018). In these experiments, 937–1360 proteins were detected as DF possible interactors, of which 63–103 were identified as high-confidence interactors (63 out of 937 DF1 interactors, 100 out of 1270 DF2 interactors, 103 out of 1360 DF3 interactors).
To determine which interactors are preferentially bound by each DF paralog, we performed a scatterplot analysis in which each biotinylated interactor was plotted as a circle, with the x and y axis position each reflecting the average spectral counts for one of the three DF paralogs. In this pairwise analysis, we found similar proteins bound by all three paralogs. Additionally, we found a marked linear correlation in the spectral counts for each high-confidence protein interactor when examined in pairwise comparisons of DF1, DF2, and DF3 (Figure 2B). Thus, the DF-binding partners seem to be shared, and bind with the same overall rank-order preference for all three DF paralogs.
Notably, the top 25 interactors of all three DF paralogs were highly similar and included high-scoring interactions with components of the CCR4-NOT RNA-degradation complex, such as CNOT1, CNOT7, and CNOT10 (Figure 2B and S2B). Other high-confidence interactors of all three DF paralogs included RNA degradation proteins such as PATL1, XRN1, LSM12, and DDX6. In addition, all three DF paralogs interact with protein components of stress granules (Figure 2B and S2B). Stress granule proteins interact even in the absence of stress (Markmiller et al., 2018; Youn et al., 2018). Notably, all these interactors have been seen in other studies. For example, CNOT1 immunoprecipitation studies have identified all three DF paralogs (Du et al., 2016). Additionally, an APEX-based proteomic analysis of the G3BP1 stress granule protein found all three DF paralogs as interactors (Markmiller et al., 2018). Thus, all three DF paralogs show similar patterns of binding proteins, and the major interactions are seen across independent proteomic datasets.
Since DF1 is thought to regulate translation through its interactions with the eIF3A and eIF3B translation initiation factors (Shi et al., 2017; Wang et al., 2015), we wanted to determine if DF1 shows selective and robust interactions with these proteins. The Bio-ID proteomic analyses (Figure 2B) shows weak interactions of eIF3A and B with all three DF paralogs, and in each case the probability of interaction was low. Previous analysis of DF1-binding partners identified eIF3A and eIF3B based on mass spectrometry analysis of DF1 immunoprecipitates (Wang et al., 2015). However, in that study, eIF3A and eIF3B were among the lowest scoring DF1 interactors (Figure S2C). The weak binding seen in immunoprecipitates is consistent with the low probability seen in the Bio-ID studies (Figure 2B). Thus, each proteomic study suggests that all three DF paralogs exhibit nonspecific or low-level binding to eIF3A and eIF3B in cells.
Overall, the protein-protein interactions of all three DF paralogs are very similar, rather than different, with high-confidence interactions with RNA degradation machinery, and low-confidence interactions with translation machinery.
DF proteins exhibit similar intracellular localizations
To further understand the different functions of the DF paralogs, we examined their subcellular localizations, since distinct subcellular localizations might be expected for these proteins to mediate their reported functions. In the Bio-ID study (Youn et al., 2018), a non-negative matrix factorization classification analysis was developed to predict the subcellular localization of 139 RNA-binding proteins based on their interaction partners. The prominent localizations predicted for all three DF paralogs were P-bodies, and cytoplasmic mRNA ribonucleoprotein (mRNP) complexes (Figure 2C). Thus, DF paralogs are predicted to have similar subcellular localizations.
To further test this, we examined the localization of each DF paralog by immunofluorescence. Here we found that all three DF paralogs showed essentially identical localization throughout the cytoplasm in small punctate structures and, to a lower extent, in larger punctate structures. While the smaller ones resemble the granule-like particles previously detected in unstressed conditions (Youn et al., 2018), the larger punctate structures were identified as P-bodies based on their colocalization with EDC4, a P-body marker (Figure 2D). This is consistent with an independent proteomic analysis using P-body markers, which also identified all three DF paralogs in P-bodies (Youn et al., 2018). Thus, rather than exhibiting distinct localizations in cells, DF proteins have similar punctate cytoplasmic localization, some of which includes localization to P-bodies. Overall, these data suggest that DF proteins have highly similar sequence, functional domains, protein-binding partners, and intracellular localizations.
The combined activity of DF proteins leads to degradation of m6A-modified mRNA
Since all DF paralogs show high-confidence interactions with RNA degradation pathway proteins (Youn et al., 2018) (Figure 2B), we considered the possibility that each paralog may function to mediate degradation of m6A-mRNA.
Previous comparative studies of the DF paralogs found that some induce mRNA degradation when artificially tethered to a reporter transcript (Kennedy et al., 2016; Shi et al., 2017; Tirumuru et al., 2016; Wang et al., 2015; Wang et al., 2014a). However, since these studies used heterologously overexpressed DF proteins, we were concerned about the potential for these proteins to aggregate into stress granule-like structures when overexpressed. This phenomenon is seen in proteins, like the DF paralogs, that contain low-complexity domains (Alberti et al., 2019). Indeed, we observed variable levels of DF granule-like structures after transfecting cells with DF-expressing plasmids (Figure S2D). Thus, DF overexpression experiments may be misleading due to the variable degrees of DF aggregation which could sequester proteins and potentially suppress their function. We therefore re-examined the role of DF paralogs using knockdown approaches instead.
We first examined mRNA abundance using RNA-Seq after siRNA-mediated depletion of DF1, DF2, and DF3 in HeLa cells. We used siRNA that we validated for selective high efficiency DF1, DF2, and DF3 knockdown (Patil et al., 2016) (Figure S3A–S3C). Since m6A sites on mRNAs bind all the three DF paralogs (Figure 1 and S1), we examined how m6A-mRNAs were affected by DF depletion, and if the effects were correlated with the number of m6A sites (Table S1). As in the previous studies of DF1 (Wang et al., 2015), we found no effect of DF1 depletion on m6A-mRNA abundance compared to non-methylated mRNAs (Figure 3A). In contrast, as reported previously (Wang et al., 2014a), depletion of DF2, the most highly expressed DF paralog in HeLa cells (Patil et al., 2018) (Figure S3D), was associated with a small, but statistically significant increase in the abundance of m6A-mRNAs (Figure 3B). This effect was more pronounced for mRNAs with high numbers of annotated m6A sites. No increase in m6A-mRNA abundance was observed following DF3 depletion (Figure 3C), which like DF1, is more lowly expressed in HeLa cells (Patil et al., 2018) (Figure S3D). Overall, our data confirm the idea that DF2, but not DF1 or DF3, destabilizes m6A-mRNAs.
Fig. 3. DF proteins redundantly control the abundance and stability of m6A-modified mRNAs.

(A-D) m6A-modified mRNAs show substantially higher increase in expression upon simultaneous silencing of DF1, DF2, and DF3 in HeLa cells. The abundance of each mRNA (based on RNA-seq counts) was compared between the control and the conditions of DF paralog(s) silencing, as indicated. mRNAs were binned based on the number of m6A sites. The expression distribution of each of m6A mRNA subgroup is quantified in the boxplots. The center of each box represents the median fold change (log2), the boundaries contain genes within a quartile of the median, whiskers represent 1.5 × interquartile ranges. The width of the boxplot is proportional to the number of genes in each category. m6A mRNAs do not change in expression upon silencing of DF1 or DF3 compared to non-methylated mRNAs. However, m6A mRNAs show a small increase in their expression upon silencing of DF2. m6A-modified mRNAs show substantially higher increase in expression upon simultaneous silencing of DF1, DF2, and DF3. Only significant p-values are shown in each graph, two-tailed Mann–Whitney test. n=3 replicates. n=2425 mRNAs for 0, n=894 mRNAs for 1, n=1521 mRNAs for 2–4, n=2022 mRNAs for 5+ m6A sites.
(E) Quantification of results in A-D. The fold increase in mRNA expression was quantified for each indicated knockdown condition. Only mRNAs with 5 or more annotated m6A sites were used in this analysis and were compared to mRNAs with 0 annotated m6A sites. Although no effect on m6A mRNA expression is seen with depletion of DF1 or DF3, a small increase is seen when these two are knocked down together. Triple knockdown shows a significantly larger effect compared to knockdown of each DF paralog alone. ****p ≤ 2.2e-16, **p ≤ 0.001, two-tailed Mann–Whitney test.
(F) m6A mRNA stability is increased upon depletion of DF paralogs. The stability of m6A-modified mRNAs and non-methylated mRNAs was determined by quantifying mRNA levels before and 2 h after actinomycin D treatment. Shown is the fold change in the mRNA levels, used as measure of the stability change upon the silencing of the DF paralog(s) (see STAR Methods). The increase in mRNA stability is most apparent when all three DF paralogs were knocked down and is proportional to the number of m6A sites per mRNA. n=456 mRNAs for 0, n=96 mRNAs for 1 to 5, n=140 mRNAs for more than 5 annotated m6A sites. ***p = 2.079e-6, **p ≤ 0.01, *p ≤ 0.02, two-tailed Mann–Whitney test, n=2 replicates.
We then considered the possibility that the DF paralogs may be functionally redundant, and our inability to detect a stability-regulatory effect was due to compensation by the other paralogs. Additionally, we noticed that knockdown of any of the DF paralogs was associated with a compensatory increase in the expression of the other paralogs in HeLa cells (Figure S3A–S3B). Thus, compensatory upregulation of the other DF paralogs could further mask an effect of knockdown.
We therefore tested the simultaneous knockdown of different combinations of two DF paralogs, or all three DFs. Knocking down any two DF paralogs increased the overall abundance of m6A-mRNA (Figure S3E–S3I). Importantly, the selective increase in m6A-mRNA expression was largest upon triple knockdown (Figure 3D), and, in each case, it was directly correlated to the number of m6A sites per mRNA (Figure 3D and S3F–S3H). Both the double knockdown and triple knockdown exhibited greater increases in m6A-mRNA abundance than DF2 knockdown alone (Figure 3E). These data are consistent with a model in which any of the DF proteins can promote degradation of m6A-mRNAs, but m6A-mRNA degradation is most effective when all three DF paralogs are available, ensuing maximal DF-dependent m6A-mRNA degradation.
To determine if the expression levels seen upon triple DF knockdown are correlated with changes in mRNA stability levels, we measured the levels of m6A-mRNAs after transcription inhibition with actinomycin D. Since m6A-mRNAs tend to have a short half-life (Ke et al., 2017; Schwartz et al., 2014), we treated cells with actinomycin D for 2 h and measured the amount of each mRNA remaining using RNA-seq. mRNA stability was relatively unaffected upon depletion of each DF paralog individually, except in the case of DF2, where a small stabilizing effect was seen (Figure 3F). However, when all three DF paralogs were knocked down, a substantial increase in mRNA stability was seen for m6A-containing mRNAs compared to non-m6A mRNAs (Figure 3F). These effects were also seen in separate experiments examining the stability of specific mRNAs annotated to contain high number of m6A sites or annotated to lack m6A (Figure S3J).
Overall, these data further suggest that the most efficient degradation of m6A-mRNAs occurs when all three DF paralogs are present. When DF1 or DF3 is knocked down alone, the effects are nearly undetectable, but knockdown of DF1 and DF3 together, or in combination with DF2, resulted in readily detectable increases in m6A-mRNA mRNA expression (Figure 3E). This suggests that the other DF paralogs can partially compensate for the loss of another DF. The ability of any DF protein to compensate is likely to be influenced by its expression level, with the lower expression of DF1 and DF3 (Figure S3D) making them less able to compensate for DF2 depletion. In this model, only when all three DF paralogs are depleted, compensation cannot occur, and the m6A-mRNA stability is most robustly increased.
DF paralogs do not affect the translation of m6A-modified mRNAs
Although our data strongly indicate that DF paralogs act together to destabilize m6A-mRNA, it remains possible that one or more of these proteins could also control m6A-mRNA translation. Importantly, both DF1 and DF3 have been described as enhancers of m6A-mRNA translation (Shi et al., 2017; Wang et al., 2015). Therefore, we examined the role of the DF paralogs in the translational regulation of m6A-mRNAs.
DF1 was proposed to enhance translation by binding m6A in mRNA 3’UTRs and subsequently facilitate loading of eIF3 onto mRNA caps (Wang et al., 2015). This is reminiscent of the poly(A)-binding protein PABPC1, which also binds 3’UTRs, binds an initiation factor and promotes formation of initiation complexes at mRNA caps (Le et al., 1997; Ozoe et al., 2013; Wells et al., 1998). The ability of PABPC1 to enhance mRNA translation is evident based on its enrichment in the polysome fractions corresponding to highly translated mRNAs (Arava et al., 2003).
We therefore examined if DF1 is similarly enriched with highly translated mRNAs. However, all three DF paralogs are mostly excluded from the polysome fraction (Figure 4A and S4A) and highly enriched in the fractions at the beginning of the gradients, which represents cytoplasmic mRNPs (Arava et al., 2003). This result is not consistent with a model in which any DF protein is stably bound to mRNA 3’UTRs thus enhancing their translation.
Fig. 4. Depletion of DF proteins does not affect the translation efficiency of m6A mRNAs in HeLa cells.

(A) DF paralogs are not highly associated with actively translated mRNAs. DF1, DF2, and DF3 were not enriched in polysomal fractions. Instead, they were predominantly associated with the mRNA ribonucleoprotein complex fraction (mRNPs). The ribosomal protein RPS6 was used as a marker for ribosome-enriched fractions.
(B-E) The translation efficiency of m6A-modified mRNAs is not reduced upon silencing of DF1 or any DF paralog. The number of ribosome-protected fragments bound to each mRNA was normalized to the abundance of the respective mRNA to calculate translation efficiency (TE). The TE was then compared between control and cells knocked down for the indicated DF paralog(s). mRNAs were binned based on the number of m6A sites. The distribution of each of m6A mRNA subgroups is quantified in the boxplots. The center of each box represents the median fold change (log2), the boundaries contain genes within a quartile of the median, whiskers represent 1.5 × interquartile ranges. The width of the boxplot is proportional to the number of genes in each category. m6A-modified mRNAs do not decrease their TE upon either single or triple silencing of DF1, DF2, DF3 compared to non-methylated mRNAs. Only significant p-values are shown in each graph and the exact p-values are reported (two-tailed Mann–Whitney test). n=3 replicates. n=2425 mRNAs for 0, n=894 mRNAs for 1, n=1521 mRNAs for 2–4, n=2022 mRNAs for 5+ m6A sites.
Despite the absence of DF paralogs from the highly translating mRNA pool, we wanted to examine whether the translation of m6A-mRNAs is enhanced by any of the DF paralogs.
We first examined the published ribosome profiling data that revealed the translation-enhancing effect of DF1 (Wang et al., 2015). In this study, processed data was provided, indicating the ribosome-protected fragments that map to each gene. When we examined this processed data obtained after DF1 silencing, it was evident that m6A-mRNAs were less translated than in the control siRNA-transfected samples (Figure S4B). Thus, consistent with the previous study (Wang et al., 2015), but in contrast to what was expected from the polysome analysis (Figure S4A), DF1 silencing causes a reduction in the translation of m6A-mRNAs. This analysis was performed using the average of the two ribosome profiling replicates, as described in the original study.
However, we found different results when the processed data of the two DF1 siRNA replicates were analyzed separately. Replicate 1 showed a prominent decrease in the translation of m6A-mRNAs upon DF1 depletion, consistent with the idea DF1 enhances translation of m6A-mRNA (Figure S4C). However, Replicate 2 showed no change in the translation of m6A-mRNAs upon DF1 silencing (Figure S4D). Thus, the overall reduction in m6A-mRNA translation that we saw in the averaged data (Figure S4B) was driven by the large drop in m6A-mRNA translation seen in Replicate 1.
Because we were surprised by different roles for DF1 implied by the two different replicates, we re-processed the raw sequencing data generated in the Wang et al. study. Upon reanalysis using the standard pipeline for alignment and calculation of ribosome-protected fragments (Calviello et al., 2015; McGlincy and Ingolia, 2017), both replicates showed the same result—DF1 depletion did not affect m6A-mRNA translation efficiency (Figure S4E–G, Table S2–S3), similar to the effect seen with the previously processed Replicate 2, but not Replicate 1.
To understand the basis for the inconsistencies between the original Replicate 1 and 2, we generated correlation coefficients for the ribosome-protected fragments between replicates. Here we saw only modest correlation in the number of ribosomes-protected fragments per m6A mRNA between the original replicates (Figure S4H). In contrast, the re-processed data, showed high correlation (Figure S4I), as would be expected for replicates. We therefore considered that a bioinformatic, rather than a biological artefact may have caused variability in the original reported analysis. Overall, based on one of the original replicates, and based on both replicates after re-processing of the raw ribosome profiling data from Wang et al., 2015, DF1 does not regulate the translation of m6A-mRNAs.
We next examined DF3, which was also previously proposed to promote translation (Shi et al., 2017). In this previous analysis, DF3-bound mRNAs were identified by PAR-CLIP, and the translation efficiency of these mRNAs were analyzed after DF3 knockdown (Shi et al., 2017). However, we found that the DF3-PAR-CLIP dataset did not contain a sufficient number of mappable reads, as described above (Figure S1D). We therefore decided to reanalyze the effect of DF3 depletion on mRNAs based on the number of m6A sites, since m6A sites correlate with DF3 binding (Figure 1). Here, we saw that DF3 depletion does not affect the translation efficiency of m6A-mRNAs (Figure S4J).
Due to the various inconsistencies, we wanted to independently confirm the effects of depleting each DF paralog on the translation efficiency of m6A-mRNAs using ribosome profiling. In each experiment, we generated three replicates for knockdown and control (Figure S5A–S5C) (Figure S3A–S3B). We found no reduction in translation efficiency of m6A-mRNAs compared to non-methylated mRNAs in DF1-deficient HeLa cells (Figure 4B). Similarly, neither DF2 nor DF3 depletion was associated with a change in translation in m6A-mRNAs by ribosome profiling (Figure 4C and 4D). As a second approach, we quantified the levels of specific m6A-modified mRNAs at each position along the polysome gradient. We focused on specific m6A-mRNAs reported to show the largest drop in translation after DF1 depletion (Wang et al., 2015). However, we saw no decrease in translation upon DF1 depletion (Figure S5D).
Since all three DF proteins are redundantly mediating mRNA degradation, we considered the possibility that they may also redundantly regulate mRNA translation. We, therefore, performed ribosome profiling after knockdown of all three paralogs (Figure S5E–S5F). Here, we still saw no reduction, but rather a slight enhancement in the translation efficiency of m6A-containing transcripts (Figure 4E).
Overall, multiple independent datasets demonstrate that DF1 has no translation-promoting role in HeLa cells, including the original data that was used to show the translation promoting effect of DF1. Thus, none of the DF paralogs directly enhance mRNA translation. Instead, their major effect is to mediate m6A-mRNA degradation.
The combined activity of DF proteins suppresses differentiation of leukemia cells
One of the most-well studied examples of m6A-regulated cellular differentiation is in acute myeloid leukemia cell lines, where m6A maintains cells in an undifferentiated blast-like state (Barbieri et al., 2017; Vu et al., 2017). Knockdown of METTL3 induces the expression of markers such as CD14, a transmembrane protein which reflects differentiation and commitment to the myeloid lineage. This mechanism involves, in part, regulation of mRNA stability, with TNFRSF1B being recently linked as a differentiation-promoting transcript whose stability is suppressed by m6A in leukemia cell lines (Paris et al., 2019). Attempts to identify the m6A reader that mediate the differentiation-suppressive effects of m6A have not yet been successful. Recent studies have suggested that DF2 does not mediate the differentiation-suppressive effects of m6A since DF2 knockout does not induce differentiation (Paris et al., 2019), which contrasts to the effect of METTL3 depletion (Barbieri et al., 2017; Vu et al., 2017). Therefore, it has not been possible to ascribe the differentiation-suppressive effects of m6A to a specific m6A reader.
We therefore asked if the suppression of TNFRSF1B is mediated by the combined action of the three DF proteins. For these experiments, we knocked down each DF transcript alone or in combination in MOLM-13 leukemia cells, which we and others previously showed were maintained in an undifferentiated state by METTL3 (Barbieri et al., 2017; Vu et al., 2017) (Figure S5G). TNFRSF1B mRNA expression levels were slightly affected by knockdown of each of the DF paralogs individually, with the largest increase seen with DF2 knockdown (Figure 5A). However, upon knockdown of all three DF paralogs, TNFRSF1B expression was markedly enhanced (Figure 5A). Overall, these data further support the idea that the DF proteins act redundantly to control the expression levels of m6A-mRNAs linked to differentiation of MOLM-13 cells.
Fig. 5. DF proteins redundantly contribute to suppressing the differentiation of leukemia cells.

(A) TNFRSF1B mRNA expression is increased upon depletion of all DF paralogs. TNFRSF1B mRNA levels were measured by qRT-PCR in MOLM-13 cells after knockdown of each paralog. DF2 silencing lead to increased levels of TNFRSF1B, consistent with previous results (Paris et al., 2019). However, a larger and statistically significant increase in its expression level was seen upon silencing all three DF paralogs, suggesting that the combined activity of the DF paralogs mediates the destabilization of TNFRSF1B. TNFRSF1B levels were normalized to RPS28 expression levels, a non-methylated mRNA (Vu et al., 2017). Non-parametric ANOVA test, ****p ≤ 0.0001, n=3 mean± SEM.
(B) Expression of the CD14 differentiation marker in MOLM-13 cells is strongly induced bysilencing all three DF paralogs. Shown is the percentage of CD14+ cells after the silencing of the indicated DF paralog(s). For each DF paralog, two different shRNAs were tested in two biological replicates, with the two different shRNAs indicated as closed circle and an open circle. As previously described (Paris et al., 2019), DF2 silencing alone fails to cause an increase in CD14+. However, upon triple knockdown, the percentage of CD14+ cells is significantly increased. Non-parametric ANOVA test, ****p < 0.0001, ***p = 0.0010, **p = 0.0012, *p = 0.03.
We next examined the role of DF proteins in suppressing differentiation. DF2 depletion on its own does not induce differentiation as measured by the CD14 differentiation marker (Paris et al., 2019). We therefore asked if the combined action of the DF paralogs suppresses differentiation. To test this idea, we measured CD14 five days after knockdown of DF paralogs using flow cytometry. Similar to the previous study (Paris et al., 2019), we did not find an induction of CD14 upon knockdown of DF2 (Figure 5B). However, upon triple knockdown, CD14 expression was markedly increased. Overall, these data are consistent with the idea that three DF paralogs function together to mediate differentiation-suppressing effects of m6A.
Discussion
The YTHDF family of proteins, DF1, DF2, and DF3, are the major cytosolic m6A-binding proteins and are thought to mediate the effects of m6A in the cytosol (Patil et al., 2018). In contrast to the prevailing model that each DF paralog binds to distinct subsets of mRNAs, we show that the DF paralogs bind proportionately to each m6A site throughout the transcriptome. Additionally, rather than exerting different effects on different m6A-mRNAs, we show that the three DF proteins function together to mediate degradation of m6A-containing mRNAs. Although depletion of single DF paralogs leads to mild or no effect on mRNA abundance and stability, depleting all three DF proteins leads to robust stabilization of m6A-mRNAs, suggesting that each paralog can fully or partially compensate for the function of the other DF paralogs. Lastly, we find that previous studies that linked DF proteins to mRNA translation were affected by bioinformatic and technical issues, which led to the incorrect view that a major function of DF proteins was to promote translation. Instead, we show that DF paralogs do not appear to directly enhance the translation of m6A-mRNAs in HeLa cells. Our comprehensive analysis of DF paralog function reveals a unified model of DF protein binding and function, with the major effect of m6A to mediate mRNA degradation through the combined effects of all three DF paralogs.
The issue of whether DF paralogs bind different mRNAs, or the same mRNAs is a central question for understanding m6A function in cells. If each DF paralog binds different mRNAs, then each DF would affect different cellular pathways and processes. This prevailing model has created the impetus for knockout studies focusing on separate analysis of each DF paralog, with the goal of understanding the specific functions of each. However, this model lacks a clear mechanism to explain how the DF paralogs could bind different m6A sites.
Our analysis supports the opposite conclusion. We find that all m6A sites bind all DF proteins in an essentially indistinguishable manner, with the main determinant of DF paralog binding simply being the presence of the m6A site. The level of DF binding is likely to be correlated with m6A stoichiometry, which would positively correlate with the degradation effect. It should be noted that some m6A sites may bind DF paralogs poorly if they are obscured by local RNA structure or by the binding of nearby RNA-binding proteins that limit access to m6A.
Another central question is establishing the function of these major cytoplasmic m6A readers, DF1, DF2, and DF3. This is arguably the most important step in understanding m6A biology since it can explain how the effects of m6A can be rationalized in diverse m6A-dependent processes. The current concept is that m6A, through the action of different DF proteins, can either induce mRNA translation, mRNA degradation, or both, and this effect is transcript specific (Shi et al., 2017; Shi et al., 2019).
In contrast to this prevailing model, we find diverse lines of evidence supporting the idea that DF proteins have similar rather than different functions. In addition to the high sequence identity in both the RNA-binding and effector domains, the DF proteins have similar cytoplasmic localizations, including P-body localization, and similar protein interactors, each of which are hallmarks of proteins with similar functions. Most notable among the binding partners for all three DF proteins are the CCR4-NOT deadenylation complex proteins, supporting the idea that all DF paralogs have a common role in mRNA degradation. A recent study showed that all three DF proteins bind CNOT1 and elicit mRNA degradation (Du et al., 2016). The ability of all three DF proteins to mediate deadenylation supports the overall finding that the major function of these proteins is to mediate degradation of m6A-mRNAs. Further studies may also address whether the position of m6A along the transcript body has an impact on DF-mediated mRNA degradation.
Our data does not support the idea that DF paralogs have a direct role in regulating mRNA translation efficiency. Our reanalysis of previously published data together with our independent ribosome profiling datasets and analysis of individual m6A-mRNAs by polysome fractionation analysis performed in the same cell line show no evidence of decreased translation of m6A-mRNAs upon depletion of DF proteins. This conclusion is consistent with both the previously published protein polysome fractionation analysis, as well as the new one presented here, which do not show an enrichment of the DF proteins in the fractions containing highly translated mRNAs. Thus, the DF proteins, including DF1, do not behave like other translation-enhancing RNA-binding proteins that bind the 3’UTR (Le et al., 1997; Ozoe et al., 2013; Wells et al., 1998). Additionally, protein interaction analysis shows a lack of high-confidence interactions of the DF paralogs with translation initiation factors in cells (Youn et al., 2018). Overall, these diverse lines of evidence suggest that DF proteins do not promote translation. Although we cannot exclude a role for DF proteins in translation enhancement in other cell lines or conditions, our current findings are not consistent with a role for any DF paralog in regulating m6A translation, at least in the original cell line and conditions in which DF1 was originally linked to translational regulation.
Although DF proteins do not promote translation, m6A can promote translation through DF-independent mechanisms. m6A may directly bind eIF3 when m6A is in the 5’UTR (Meyer et al., 2015), or m6A may be associated with bound METTL3, which may facilitate translation (Choe et al., 2018). However, since eIF3 and METTL3 are thought to bind just a small subset of m6A sites, the role of eIF3 and METTL3 binding in the overall cellular effects of m6A is likely to be limited to specific transcripts (Zaccara et al., 2019).
Our finding that all the DF paralogs contribute to mRNA destabilization reconciles findings made by diverse groups in which depletion of DF1 was not associated with reduced mRNA translation. For example, DF1 depletion does not affect the translation of an heterologously expressed m6A-mRNA in MCF7 cells (Slobodin et al., 2017) and does not affect the translation of m6A-mRNAs in neurons when using a DF1-tethering system unless a stimuli is added (Shi et al., 2018). Thus, the lack of translation regulation seen upon DF1 depletion can now be explained by the new model of DF function presented here.
In light of our current findings, phenotypes seen upon DF depletion likely derive from upregulation of m6A-mRNAs. Depletion of any single DF protein can affect mRNA levels to a small degree, which can still result in clear cellular effects. For example, recent studies show that m6A suppresses interferon beta (IFNB1) mRNA levels, and knockdown of different DF paralogs can cause a small increase in the abundance and translation of this transcript (Winkler et al., 2018). Since cells are sensitive to small increases in IFNB1, single DF knockdown can lead to readily detectable cellular effects. These hypomorphic phenotypes may be different from METTL3 depletion since METTL3 depletion would cause more a substantial increase in the levels of highly m6A mRNAs, and thus affect multiple cellular pathways leading to potentially very different phenotypes.
Although the DF proteins appear to have similar functions, depletion of different DF paralogs can have different effects. This is because DF proteins exhibit markedly different expression levels in different tissues (Patil et al., 2018). Therefore, depletion of a low-abundance DF paralog, such as DF3, is likely to only affect a small number of highly sensitive mRNAs, while depletion of a higher abundance DF paralog would affect a larger subset of mRNAs, causing a different phenotype. Additionally, since DF paralogs may be expressed at different levels in different tissues, single DF paralog depletion can result in tissue-specific phenotypes (Nishizawa et al., 2018; Shi et al., 2018). DF paralogs may also be phosphorylated in a paralog-specific manner (Patil et al., 2018; Zaccara et al., 2019) or selectively induced in response to specific stimuli, as seen with p63-dependent induction of DF3 (Birkaya et al., 2007; Shi et al., 2017). These pathways and subtle DF-paralog amino acid sequence differences may confer additional modes of regulation that can affect the ability of DF paralogs to induce m6A-mRNA degradation.
Notably, the functions of the DF paralogs may differ depending on the cellular context. For example, in cell stress, DF proteins bind m6A-mRNA and relocalize to stress granules, but the mRNA is not targeted for degradation (Ries et al., 2019). In neurons, DF proteins have also been localized to transport granules and may therefore have roles in trafficking m6A-mRNA to dendrites and thus indirectly promote translation in neurons (Merkurjev et al., 2018; Ries et al., 2019). However, for cell types that exhibit the classic mRNA-destabilization effect of m6A, which has been seen in diverse cell types (Geula et al., 2015; Ke et al., 2017; Vu et al., 2017) and originally described in 1978 (Sommer et al., 1978), the likely mediator of this m6A-dependent destabilization effect is the combined action of DF1, DF2 and DF3.
STAR Methods
Resource Availability
Lead Contact.
Information and requests for resources and reagents should be directed to and will be fulfilled by the Lead Contact, Samie R. Jaffrey (srj2003@med.cornell.edu).
Material Availability.
This study did not generate new unique reagents.
Data and Code Availability.
All datasets generated during this study have been deposited to the NCBI Gene Expression Omnibus under accession number GEO: GSE134380. https://www.ncbi.nlm.nih.gov/geo/query/acc.cgi?acc=GSE134380 (Enter token grmjgaagnjwbfsr into the box)
The code used to analyze the ribosome profiling datasets in this study is available at DOI: 10.17632/nsz68ywvvx.1 (https://data.mendeley.com/datasets/nsz68ywvvx/draft?a=64827451c659-483f-9909-25237e946420)
Experimental Model and Subject Details
Cell Culture.
HeLa (ATCC CCL-2) cells of female origin were maintained in 1x DMEM (11995–065, Life Technologies) with 10% FBS, 100 U ml−1 penicillin and 100 μg ml−1 of streptomycin under standard culture conditions. Cells were split with TrypLE Express (Life Technologies) according to the manufacturer’s instructions. HeLa cells were authenticated. MOLM-13 (man origin) were maintained in 1x RPMI with 10% FBS, 100 U ml−1 penicillin and 100 μg ml−1 of streptomycin under standard culture condition. MOLM-13 cells were a kind donation from the laboratory of M. Kharas and were not authenticated during this study.
siRNA silencing in HeLa cells.
Cells were seeded in 6-well plates. After 24 h, 30 nM siRNA was transfected using Pepmute transfection reagent (Signagen) according to the manufacturer’s instructions. 48 h after the first transfection, a second transfection was performed. Cells were maintained at 70%−80% confluency and when necessary expanded in a 10-cm dish. Cells were then collected 4 days after the first transfection. When silencing multiple DF proteins at the same time, the total concentration of siRNA in the final transfection mixture was maintained constant (i.e. silencing of DF1, DF2, and DF3 was performed by adding 10 nM of siRNAs targeting DF1, 10 nM of siRNAs targeting DF2 and 10 nM of siRNAs targeting DF3 in the same transfection mixture, i.e. silencing of DF1 and DF2 was performed by adding 15 nM of siRNA for DF1 and 15 nM of siRNA for DF2 in the same transfection mixture). siRNA sequences were previously reported and validated (Patil et al., 2016). Knockdown was also additionally validated prior to all experiments reported in this study by western blot. In each silencing condition, the siRNA sequences were specific to the DF paralog of interest.
shRNA silencing in MOLM-13 cells.
MOLM-13 cells at a concentration of 500,000 cells ml−1 were transduced with lentiviruses expressing shRNAs against DF1, DF2, and DF3 or expressing a control scrambled shRNA sequence as performed previously (Vu et al., 2017). To increase the virus integration efficiency, cells were spinoculated at 1400 RPM for 1 h. After 24 h from the spinoculation (Day 1), cell media was changed. Cells were then collected 5 days after the transduction. shRNAs sequences against DF1, DF2, and DF3 were previously reported (Ries et al., 2019). In order to obtain at least two shRNAs for each DF, additional MISSION shRNA plasmid DNA sequences were purchased from Sigma (DF2 shRNA: TRCN000254410, DF3 shRNA: TCN000365173). EGFP/TGFP expression was used to select efficiently transduced cells by FACS sorting.
DF1, DF2 and DF3 overexpression and imaging.
HeLa cells were transfected with FLAG-3xHA-tagged DF1, FLAG-3xHA-tagged DF2 and FLAG-3xHA-tagged DF3-expressing plasmids using Fugene HD Transfection Reagent (E2311, Promega) according to the manufacturer’s instructions. As control, a FLAG-3xHA-expressing plasmid was used as control. Briefly, cells were plated on 35-mm glass-bottom dishes coated with 1% gelatin and allowed to reach 40%−60% confluency before transfection. 24 h after transfection, plates were fixed, and immunostaining was performed as described. To visualize the overexpressed DF, staining using an antibody against each DF paralog and the HA tag was performed. Areas where the HA staining overlaps with the DF staining indicate the localization of the FLAG-3xHA-tagged DF. After antibody staining, images were acquired using a Nikon TE-2000 inverted microscope with a 40x oil objective.
Protein expression and purification.
For in vitro binding affinity studies of m6A-modified RNA to DF paralogs, each full-length DF paralog was purified in bacteria as previously described (Patil et al., 2016; Ries et al., 2019). Briefly, DF proteins were expressed in Escherichia coli Rosetta2 (DE3) (Novagen) using pProEx HTb (Invitrogen) with checking every 20 min at 600nm (OD600) until the culture reached log phase (04–0.6 OD600). DF protein expression was induced with 1 mM isopropyl β-D-1-thiogalactopyranoside (IPTG) for 16 h at 18 °C. Cells were collected, pelleted and then resuspended in the following buffer: 50 mM NaH2PO4 pH 7.2, 300 mM NaCl, 20 mM imidazole at pH 7.2 and supplemented with EDTA-free protease inhibitor cocktail (05892791001, Roche) according to the manufacturer’s instructions. The cells were lysed by sonication and then centrifuged at 10,000g for 20 min. The soluble protein was purified using Talon Metal Affinity Resin (Clontech) and eluted in the following buffer: 50 mM NaH2PO4 pH 7.2, 300 mM NaCl, 250 mM imidazole-HCl at pH 7.2. Further concentration and buffer exchange were performed using Amicon Ultra-4 spin columns (Merck-Millipore) when proteins were not directly labeled. Recombinant protein was stored in the following buffer: 20 mM HEPES pH 7.4, 300 mM KCl, 6 mM MgCl2, 0.02% NP40, 50% glycerol at −80 °C or 20% glycerol at −20 °C. All protein purification steps were performed at 4 °C. The purified protein was quantified using a ND-2000C NanoDrop spectrophotometer (NanoDrop Technologies) with OD 280 and verified by Coomassie staining.
Methods details
Flow cytometry.
After 5 days of DF silencing, MOLM-13 cells were tested for the expression of the CD14 differentiation marker using the following protocol. Cells were collected by centrifugation, washed once with 1X PBS+2% FBS and then counted using a hemocytometer. One million cells were used to perform cellular staining using PE-CD14 antibody (BD Pharmingen). The antibody dilution was performed according to the manufacturer’s instructions. Staining was performed on ice for 1 h. After the staining, excess unbound antibody was removed by two washes with 1x PBS. DAPI was added prior to analysis. Cells were analyzed on a BD FACS ARIA instrument. To calculate the percentage of CD14 positive cells, data were processed using FlowJo.
Antibody staining and 3D-SIM imaging.
HeLa cells were seeded on coated no 1.5H (170μm +/− 5μm) coverslip (474030–9000-000, Carl Zeiss) in 6 well-plates. Coverslips were coated with gelatin prior to seeding. 24 h after seeding, cells were washed twice with PBS at 25°C and then fixed with 4% formaldehyde in 1X PBS for 15 min at 25°C. After two washes with 1X PBS to remove the excess of formaldehyde, cells were permeabilized with permeabilization/blocking buffer (1x FBS, 1% Triton-X in 1x PBS) at room temperature for 30 min. Following permeabilization/blocking, cells were incubated with the primary antibody in a humidified chamber for 2 h. Cells were then washed with 1x PBS for three times and then incubated with the appropriate secondary antibody (anti-rabbit Alexa Fluor 568, anti-mouse Alexa Fluor 488) for 1 h at room temperature. Following the incubation, cells were washed as before. Hoechst staining was performed for 5 min. After additional washes, coverslips were mounted in mounting media (Prolong Diamond, P36961, Life Technologies) and quickly sealed with nail polish. Stained cells were imaged by super-resolution 3D-SIM on OMX Blaze 3D-SIM super-resolution microscope (Applied Precision) equipped with a 100x/1.40 UPLSAPO oil objective. To reduce spherical aberrations, an oil with the optimal refractive index was first identified at the beginning of every acquisition session. Image reconstruction and alignment was performed using SoftWoRx. Because all acquired images have AF-568 staining (red staining), Optimal-Red transfer functions (OTFs) were used during the image processing. Further processing was performed on Imaris.
Polysome.
HeLa cells were seeded on 10-cm dishes. At 70%−80% confluency, cells were treated with 100 μg/mL cycloheximide for 10 min at 37°C and then collected. Briefly, cells were washed with PBS in mild cycloheximide condition and then lysed directly on the dish using 400 μl of lysis buffer (20 mM Tris HCl pH 7.4 100 mM KCl, 5 mM MgCl2, 1 % Triton-X 100, 100 μg/ml cycloheximide, 2 mM DTT, 1x cOmplete no EDTA protease inhibitor cocktail). The lysate was then left on ice for 10 min and then a centrifugation at 12,000g x 15 min was performed to clear the lysate. The cleared lysates were then loaded in 15–50% linear sucrose gradients, ultracentrifuged and fractionated with an automated fraction collector. Proteins were extracted from each fraction using trichloroacetic acid. Sodium deoxycholate was added as a carrier to assist in the protein precipitation. After acetone addition and washes, proteins were resuspended in protein loading buffer, denatured at 95°C for 10 min, and used for detecting DF1, DF2, DF3 and RPS6 by western blot. RNA was extracted from each fraction using TRIzol-LS reagent (Invitrogen). To account for differences in extraction efficiency, 2 ng of a spike-in luciferase mRNA (TriLink Biotechnologies) was added to each fraction before RNA extraction. Briefly, RNA extraction was performed using a ratio of 2:1 between the volume of TRIzol LS reagent and the sample. After TRIzol addition, RNA isolation was performed as indicated by the manual’s instructions.
Generation of the ribosome profiling and RNA seq libraries upon DFs silencing.
Ribosome profiling was performed following the original protocol (McGlincy and Ingolia, 2017) with minor modifications. Briefly, HeLa cells were plated on a 10-cm dish and each DF or combination of DF transcripts was silenced as described. After the silencing, to inhibit ribosome run-off during the collection and lysis, cells were rapidly washed once with ice-cold PBS containing 50 μg/ml cycloheximide and the plates were immersed in liquid nitrogen and placed in dried ice as previously described (Calviello et al., 2015). After allowing cells to reach 4°C by keeping cells on ice, cells were immediately lysed in 400 μL of cell lysis buffer (20 mM Tris pH 7.4, 150 mM NaCl, 5 mM MgCl2, 1 mM DTT, 100 μg/mL cycloheximide, 1% Triton, 25 U DNase I) and by triturating the sample through a 26-gauge needle ten times to further lyse the cellular material. 5% of the total cellular extract was used for RNAseq library preparation. 10% of the total cellular extract was used for Western Blot validation of the silencing. Lysate was then clarified by performing a centrifugation step at 20,000 x g for 10 min at 4°C. Supernatant was collected, flash-frozen and stored at −80°C.
For the ribosome profiling library preparation, the RNA concentration in the cleared lysate was quantified using RiboGreen. 30 μg of RNA was digested using RNase I (Epicentre) as previously described (McGlincy and Ingolia, 2017). After RNase digestion, lysates were loaded on a sucrose gradient and centrifuged at 100,000 rpm (TLA 100.3 rotor) for 1 h to pellet ribosomes. RNA from the resuspended ribosomal pellet was purified using Trizol and run on a gel to selectively excise foot-printed RNAs (from 17 nt to 34 nt in length). To reduce ribosomal contamination in the library preparation steps, we then performed Ribo Zero Gold depletion of the foot-printed RNA. The rRNA-depleted RNA fragments were dephosphorylated, and the adaptor was ligated. To specifically deplete unligated linker, yeast 5’-deadenylase and RecJ exonuclease digestion was performed. At this point, the library preparation steps were performed essentially as described previously (McGlincy and Ingolia, 2017). Briefly, reverse transcription was performed using SuperScript III. To avoid untemplated nucleotide addition, reverse transcription was carried out at 57°C, as described (McGlincy and Ingolia, 2017). cDNA purification, circularization, and amplification were performed as previously described (Linder et al., 2015). Using this method, every ribosomal footprint represents a unique ribosome-binding event. Libraries were sequenced with a single end 50 bp run using an Illumina Hiseq2500 platform.
For the RNAseq library preparation, the RNA was extracted from the 5% of the lysate before the RNase digestion using Trizol LS. The RNA quality was assessed by Bioanalyzer analysis. 1 μg of total RNA was used for library preparation using the NEBNext Ultra Directional RNA Library Prep Kit. Ribosomal RNA was removed using NEBNext rRNA Depletion Kit. The libraries were sequenced on the Illumina HiSeq 2500 instrument, in single read mode, 50 bases per read.
Actinomycin D treatment.
HeLa cells were plated on a 10-cm dish and each DF or combination of DF proteins was silenced as described. After five days of silencing, cells were treated with 5 μg/ml of actinomycin D or vehicle (DMSO) for 2 h to inhibit transcription. To ensure that the treatment did not affect cell viability, cells were counted before collection. Total RNA was extracted using TRIzol and 1 μg of total RNA was used to perform RNA-seq library preparation using the NEBNext Ultra Directional RNA Library Prep Kit. Ribosomal RNA was removed using NEBNext rRNA Depletion Kit. Prior to ribosomal depletion, 2 μl of the 1:100 dilution of the ERCC (external RNA control consortium) RNA Spike-in Control Mix 1 was added to each 1 μg of total RNA sample, as suggested by the manufacturer’s instructions.
Quantitative PCR analysis.
Total RNA was isolated from cells using TRIzol according to the manufacturer’s instructions. For each condition, the same amount of total RNA was reverse transcribed to cDNA using the SuperScript IV First-Strand kit. When the transcript abundance was tested upon actinomycin D treatment in HeLa cells, oligo-dT primers were used during the cDNA synthesis step. This allowed us to selectively convert to cDNA the amount of intact RNA still present in cells upon actinomycin D treatment, while avoiding the conversion of fragmented RNA to cDNA. When transcript abundance was tested in MOLM13 cells, random hexamers were used. Quantitative qPCR was performed using the iQ SYBR Green Supermix with 200nM primers in 10 μl final reaction mix. For the amplification, the following protocol was used: 98°C for 3 min, 40 cycles of 95 °C for 15 s and 60 °C for 45 s. To test primer specificity, melting curves were performed at the end of the 40 cycles of amplification. A delta cycle threshold (Ct) was calculated using the average Ct values across technical triplicates, by subtracting the geometric mean of a control non-m6A gene (RPS28). To test the distribution of the mRNA levels along the sucrose gradient, for each fraction, equal volume of extracted RNA was reverse transcribed to cDNA. The list of primers used for qPCR is presented in Table S4.
Microscale Thermophoresis (MST).
10 μM of each recombinant DF paralog expressed in E. coli was labeled with RES-NHS dye using the Monolith Protein Labeling Kit RED-NHS 2nd Generation (Amine Reactive) following the protocol instructions. Prior to each MST run, protein aggregation was minimized by centrifuging the protein solutions at 20,820×g for 10 min. A constant concentration (50 nM) of each DF paralog was mixed with increasing concentration of the m6A-modified RNA (rUrCrCrGrG/iN6Me-rA/rCrUrGrU, IDT) in MST buffer (50 mM HEPES, 100 mM NaCl, 0.05% Tween-20, pH 7.4) and incubated for 30 min at room temperature. After incubation, samples were loaded onto Premium Coated capillaries (NanoTemper Technologies) for MicroScale Thermophoresis (MST) acquisition. The MST measurements were performed at room temperature using a fixed IR-laser power of 40% for 20 s per capillary, using an LED power of 20% in a red laser equipped Monolith NT.115 instrument (NanoTemper Technologies) (HTSRC, Rockefeller University). The MonoTemper analysis software (NanoTemper Technologies) was used to determine KD values.
Quantification and statistical analysis
Protein-protein interactome analysis.
Data related to Figure 2B were previously reported in a recent Bio-ID interactome study in which the DF proteins were analyzed among 139 other proteins (Youn et al., 2018). This analysis was performed using two C-terminal labeling experiments for DF1, two N-terminal and two C-terminal labeling experiments for DF2 and DF3. “Table S1” of the Bio-ID interactome study was used to select the number of spectra counts, the number of performed replicates, the level of confidence of each DF1, DF2 and DF3 interactor. As determined in the study (Youn et al., 2018), only proteins with an average probability of interaction of 0.95 were considered as high-confidence interactors. In the Youn et al. study, 0.95 was considered as an optimal cut-off for high-confidence interactors as it was well above the Bayesian 1% FDR estimation (corresponding to an AvgP of 0.91) and as decreasing the threshold resulted in no worthwhile gains in BioGRID-curated interactions for the drop-in sensitivity. The list of top 25 interacting proteins is also provided in Table S1 of the same Bio-ID interactome study. “Table S7” of the same Bio-ID interactome study (Youn et al., 2018) was used to define the NMF analysis-based association of each DF protein presented in Figure 2C. The 14 subcellular compartments are: 1. RNP granule (cytoplasmic ribonucleoprotein granule), 2. chromosome, 3. ER (Endoplasmic reticulum), 4. RNP complex (ribonucleoprotein complex), 5. nucleolus, 6. plasma membrane, 7. mitochondrion, 8. P-body (CCR4-NOT complex/P-body), 9. stress granules, 10. cytoskeleton, 11. nucleus, 12. vesicles, 13. MOC (microtubule organizing center), 14. snRNPs (small nuclear ribonucleoprotein complex/spliceosomal complex).
Analysis of the physiochemical properties of each DF paralog.
The disordered region score was calculated using D2P2 (Oates et al., 2013). The prion-like likelihood ratio was calculated using PLAAC (Lancaster et al., 2014). The net charge per residue, and the probability of charged residues, were calculated in a sliding window of 10 amino acids using CIDER (Holehouse et al., 2017). Hydrophobicity analysis was performed using ProtScale (ExPASy) in a sliding window of 10 amino acids.
Reanalysis of publicly available PAR-CLIP data of DF1, DF2 and DF3 in HeLa cells.
Data from the DF3 PAR-CLIP (GEO accession number GSE86214) were downloaded and used for analysis in this study. Reads processing was performed using Flexbar (Dodt et al., 2012). First, the adaptor sequence reported on the GEO submission was removed using the following set-up: flexbar -r SRR509926X.fastq -f i1.8 -t SRR509926X.noadapter --max-uncalled 1 -a adapters_par-clip.fasta --pre-trim-phred 20 -n 20 --min-read-length 1. After the adapter removal, quality read analysis check was performed using Fastqc (https://www.bioinformatics.babraham.ac.uk/projects/fastqc/). According to the Fastqc results, 40% of the reads of each DF3 PAR-CLIP library replicate was represented by the following sequence: CTCAACACCCACTACCTAAAAAATCCCAAACATATAACTGAACTCCTCAC. By using the BLAT analysis tool, we found that the sequence had 100% sequence identity to MT-RNR2, the mitochondrially encoded 16S ribosomal RNA. This sequence is likely to represent a contaminant of the library preparation procedure. The removal of this sequence and any other PCR duplicate was performed using the CIMS/fastq2collapse.pl script. Reads shorter than 18 nucleotides were then removed by using Flexbar with the default --min-read-length option (Dodt et al., 2012). The remaining reads were aligned to the human genome (H. sapiens, NCBI GRCh38) using Bowtie version 1 and the reported parameters in the GEO submission data processing description (-v 2 -m 5).
Data from the DF1 and DF2 PAR-CLIP datasets were analyzed similarly. For DF1, the original PAR-CLIP sequencing data were downloaded from the GEO accession number GSE63591. For DF2, the original PAR-CLIP sequencing data were download from the GEO accession number GSE49339. In this case, when we performed the quality check using Fastqc, we did not find any over-represented sequences representing more than 5% of the library. Thus, after removing low-quality nucleotides, the adapter sequence, short reads, and duplicates, the remaining reads were aligned to the human genome (H. sapiens, NCBI GRCh38) using Bowtie version 1 and the reported parameters in the GEO submission data processing description (-v 2 -m 5). To visualize the aligned reads and comparing them across the different PAR-CLIP datasets, we calculated the number of reads counts normalized to the millions of mapped reads at every coordinate on the human genome. In this case, every single read does not represent a unique event of RNA-protein interaction since libraries were prepared using a Truseq small RNA sample preparation kit without the use of unique molecular identifiers. Therefore, PCR duplicates cannot be distinguished from distinct binding events.
Comparison of the DF protein coverage at each m6A site on mRNAs throughout the transcriptome.
To compare iCLIP coverage at each m6A site, we calculated the number of normalized DF iCLIP read counts at each m6A site using a previously described approach (Patil et al., 2016). We first calculated the number of unique read counts per million mapped reads obtained from the CITS analysis of each iCLIP dataset (Patil et al., 2016). In this approach, each iCLIP read represents a unique RNA-bound protein. Only m6A mapping to mRNAs were used in this analysis. A 5-nucleotide window from the m6A site genomic coordinate was selected and the number of iCLIP reads per million uniquely mapped reads was calculated at every m6A coordinate using BEDTools (Quinlan and Hall, 2010). The following formula was used: (r*106)/R where r = number of unique CLIP reads at the m6A window, R= total number of uniquely mapped unique iCLIP reads in the whole iCLIP library. We refer to the resulting number as “coverage at each m6A site” throughout the manuscript. For comparing the reanalyzed DF1 and DF2 PAR-CLIP coverage at each m6A site, we used a similar approach. For each DF1, DF2 and DF3 iCLIP and miCLIP, the enriched motif presented in Figure 1B was obtained using MEME suite (Bailey et al., 2009) as previously described (Patil et al., 2016).
For representation of iCLIP, PAR-CLIP and miCLIP tracks in Figure 1 and Figure S1, the normalized number of read counts from iCLIP, PAR-CLIP and miCLIP datasets at the indicated genomic coordinate is presented. GEO accession number of the analyzed iCLIP dataset in HEK293T cells: GSE78030, GEO accession number of analyzed miCLIP dataset in HEK293T cells: GSE63753, GEO accession number of analyzed miCLIP dataset in HEK293T cells: GSE63753, GEO accession number of the analyzed m6Aseq in HeLa cells: GSE86336. The reported annotated m6A sites in the respective GEO submission were downloaded. In order to calculate the number of m6A sites per transcript, m6A sites were assigned to the gene transcript using MetaplotR (Olarerin-George and Jaffrey, 2017).
Calculation of coverage at each DF1 and DF2 unique sites.
To select the previously described DF1-uniquely bound sites and DF2-uniquely bound sites, we first obtained the list of genes considered unique DF1 and DF2 targets from Shi et al., 2017. Next, the subset of called DF1 or DF2 sites on these targets were selected from the entire list of called sites reported in supplementary file “GSE63591_A-Y1-PARCLIP.xlsx” (GEO accession number: GSE63591), and in the supplementary file “GSE49339_A-PARCLIP.xlsx.gz” (GEO accession number: GSE49339). The number of DF1 and DF2 normalized coverage at each site was calculated using deepTools bamCoverage (parameters: --binSize 50 --effectiveGenomeSize --normalizeUsing BPM). To compare the two calculated coverage, deepTools bamCompare was used and visualized using deepTools plotHeatmap (Ramírez et al., 2016).
Analysis of the ribosome profiling and RNA seq data upon DFs silencing.
After the sequencing of the ribosome profiling libraries performed in this study, reads were quality-based trimmed and reads below 16 nucleotides were excluded. The adaptor was removed using Flexbar (Dodt et al., 2012). The demultiplexing was performed based on the experimental barcode using the pyBarcodeFilter.py script. The second part of the random barcode was then moved to the read header. After removal of the PCR duplicates based on the UMI sequence, ribosomal RNA reads were removed using STAR aligner (Dobin et al., 2013). As previously reported, a high percentage of reads in the library is represented by ribosomal RNA. To avoid possible contamination of the reads representing the Ago-complex recruited on the siRNA target sequence, reads were also mapped to the siRNA sequences to remove these sequences. siRNA sequences are previously described and reported in the GEO submission related to this previous study. Reads with no acceptable alignment to ribosomal and siRNA sequences were then mapped to the hg38 transcriptome. The STAR genome index was built using the annotation obtained from GENCODE (version 26). The following parameters were used to align to the genome: STAR -runThreadN 20 --genomeDir ./star_hg38 --readFilesIn reads_rRNA_siRNA_Unmapped.fastq -outSAMtype BAM SortedByCoordinate --sjdbGTFfile gencode.v26.protein_coding.annotation.gtf -outFilterMultimapNmax 8 --limitBAMsortRAM 10000000000 --alignEndsType EndtoEnd -outWigType bedGraph --outWigStrand Stranded --outWigNorm None --quantMode TranscriptomeSAM GeneCounts --outFilterMismatchNmax 8 --outSAMattributes All -outFilterIntronMotifs RemoveNoncanonicalUnannotated. These parameters were previously used (Calviello et al., 2015). The mapped reads that represent ribosome-protected fragments (reads longer than 21 nucleotides, but shorter than 32 nucleotides) with a 40% minimum level of periodicity were considered for the subsequent analysis. We specifically considered only ribosome-protected fragments reads mapped to the coding sequence to avoid any possible contamination coming from the untranslated area of the genome. To measure the degree to which transcripts are translated independently from the initiation and termination rate, we excluded reads mapping to the first 15 nucleotides from the start codon and the 9 nucleotides before the stop codon of each coding sequence, as recommended in previous studies (Lauria et al., 2018). To precisely determine the localization of each ribosome with respect to the start and stop codon, the P-site offset was estimated as previously described using riboWaltz (Lauria et al., 2018). Reads matching all these criteria were considered to determine the number of ribosome-protected fragments per gene. Given the level of variability and the possibility of contamination of the ribosome profiling library preparation, all these criteria have been reported as essential analysis steps to better estimate the number of ribosome-protected fragments mapped to each transcript (Calviello et al., 2015; McGlincy and Ingolia, 2017). Only the longest splice isoform of each gene was considered. Genes with less than 10 ribosome-protected fragments were excluded from the analysis. For each DF paralog silencing experiment, TMM normalization, empirical Bayes estimate of the negative binomial dispersion, and measurement of the level of change in translation (log2 Fold Change) compared to the control condition was performed using edgeR (McCarthy et al., 2012). To account for sample-to-sample variability, all replicates were analyzed at the same time to define a unique log2 Fold Change measurement.
After the sequencing of the RNA-seq libraries, reads with low quality were discarded and read lengths shorter than 18 nt were discarded. Ribosomal reads were removed using STAR aligner. The remaining reads were mapped to hg38 genome using STAR and the data were used to normalize the Riboseq data and derive the change in RNAseq expression. For each DF paralog silencing, TMM normalization, empirical Bayes estimate of the negative binomial dispersion, and measurement of the level of change in translation (log2 Fold Change) compared to the control condition was performed using edgeR. To account for sample to sample variability, all replicates were analyzed at the same time to define a unique log2 Fold Change measurement. For the translational efficiency measurement, the Riboseq change was compared to the RNAseq change.
Reanalysis of publicly available ribosome profiling data upon silencing of DF1 in HeLa cells.
To analyze the public available ribosome profiling data upon DF1 silencing, we used two independent approaches. First, we downloaded the Table “GSE63591_C-Y1-Ribosome_profiling.xlsx” available at the GEO accession number GSE63591 and assigned to each reported transcript a number of m6A sites. To define whether m6A mRNAs were affected by the DF1 silencing, we used the translational efficiency values reported in the table without performing any further processing step. Secondarily, the original sequencing data of the GSE63591 were downloaded and processed as follow. Quality check was performed using Flexbar. After quality check, sequences longer than 21 nt were first mapped to the siRNA sequences reported in the published study (Wang et al., 2015), to the ribosomal RNA, and then to the hg38 transcriptome. All mapping steps were performed using STAR as mentioned above. Reads mapping to the coding sequence that represent ribosome protected fragments and have high level of periodicity were considered for the analysis steps as described above. We excluded reads mapping to the first 5 codons from the start codon and the 3 codons before the stop codon of each coding sequence as described above.
We noticed a major difference between the original public available table and the new tables generated by our reanalysis. In the case of Replicate 2, the number of ribosome-protected fragments assigned to the DF1 mRNA in the processed table by Wang et al., 2015 showed a significant reduction in the number of ribosome-protected fragments for the DF1-silenced sample compared to the matching control sample. This is expected for the DF1 knockdown condition. When we reanalyzed the original sequences reads from GSE63591, we reproduced this loss of ribosome-protected fragments assigned to DF1 upon DF1 silencing. In contrast, the number of ribosome-protected fragments assigned to the DF1 mRNA in Replicate 1, as shown in the processed table “GSE63591_C-Y1-Ribosome_profiling.xlsx”, shows a substantially higher number of ribosome-protected fragments for the DF1-silenced sample compared to the matching control sample (15-fold increase). This would indicate a condition of overexpression instead of knockdown. We therefore examined the raw sequencing reads for Replicate 1 to generate a new table of ribosome-protected fragments. Upon reanalysis of the Replicate 1 ribosome-profiling data (Table S2), the number of ribosome-protected fragments mapped to DF1 mRNA was significantly lower than the number indicated in the published processed table “GSE63591_C-Y1-Ribosome_profiling.xlsx”. In the reanalysis, we observed 98% less ribosome-protected fragments mapped to DF1 than the number of ribosome-protected fragments mapped to DF1 in the matching control sample. This is consistent with the raw data representing a DF1 knockdown condition rather than an overexpression condition.
We used a standard protocol for determining ribosome-protected reads, which inherently discards any reads that derive from the siRNA itself because these fragments would be too short to be a ribosome-protected fragment, as described above (Calviello et al., 2015; McGlincy and Ingolia, 2017). It is possible that the large number of ribosome-protected fragments that map to DF1 in the published processed table for Replicate 1 derive from DF1-specific siRNA molecules that were cloned into the library but not removed, if there was no appropriate size filter used in the alignment protocol. The length, sequence and alignment position of each ribosome protected fragment is not provided in the processed table. Alternatively, the ribosome-protected reads assigned to DF1 could derive from a sample which contains overexpressed DF1 mRNA. Because of this uncertainty, we generated new DF1 knockdown ribosome profiling datasets in the same cell line. The pipeline used for the reanalysis of these datasets is reported (see “Data and Code Availability”).
Analysis of m6A mRNA stability upon DF paralog depletion.
The stability of m6A-modified mRNAs and non-methylated mRNAs was determined by quantifying mRNA levels immediately before and 2 h after actinomycin D treatment. After sequencing, libraries were checked for their quality as previously described for all RNA-seq libraries in this study. Reads were then mapped to the transcriptome using STAR aligner. A read count table was generated using the STAR aligner as well. ERCC Spike-in reads were also mapped using STAR aligner. Thus, the resulting read counts table contains reads mapping to the ERCC RNA Spike-in as well. To remove unwanted variation, the RUVg estimation package was used (Risso et al., 2014). Additionally, edgeR was used to calculate ERCC spike-in RNA size factors for each sample, which were then applied to normalize for library size changes in each replicate. We thus obtained a final number of normalized reads mapped to each mRNA. Since m6A mRNAs are known to have a short half-life (2 to 4 h) (Geula et al., 2015; Ke et al., 2017; Schwartz et al., 2014), m6A mRNA expressions are often substantially reduced even at 2 h after actinomycin D treatment. We focused on mRNAs in which the reduction in expression level could be accurately measured, i.e., those mRNAs that showed a reduction in expression level by at least 40% after 2 h of actinomycin D treatment. The percentage of mRNA abundance reduction was calculated in both the control samples (control siRNA) and in the samples subjected to DF paralog knockdown. In some cases, the stabilization of the mRNA was very substantial upon depletion of all three DF paralogs, and the mRNA expression reduction was less than 10%. Since these mRNAs no longer show a drop in mRNA expression, it is difficult to precisely establish the fold change in mRNA stability. Therefore, we simply assigned the reduction at 10% for these mRNAs in the calculations used in Figure 3F.
Supplementary Material
(A) The YTH domain of DF1, DF2 and DF3 exhibit high sequence homology. Shown is a detailed representation of the aligned amino acid sequence for the YTH domains of DF1, DF2 and DF3. Amino acids previously described to be essential for the m6A binding based on the DF1- m6A RNA and DF2- m6A RNA crystal structures (Li et al., 2014; Xu et al., 2015) are highlighted. Pink indicates the three tryptophan residues that form the aromatic cage surrounding m6A. Green and Blue indicate amino acids that make additional points of contact between the YTH domain and the nucleotides adjacent to m6A. Of note, each YTH-DF domain shares each of these amino acids. Shown below in a yellow color code scheme is the level of conservation of every amino acid among the three YTHDF proteins with a range from 1 (low conservation) to 10 (high conservation) as predicted by the Clustal Omega alignment algorithm (Madeira et al., 2019). Most residues (88%) are fully conserved residues across all DFs paralogs as indicated by the conservation score of 10. Importantly, amino acids essential for recognizing m6A and adjacent residues in RNA are fully conserved. As indicated in Figure 1A, amino acids with a conservation score lower than 10 are located on the opposite side of the YTH domain away from the RNA-binding pocket, suggesting that they might not affect the YTH-m6A RNA interaction.
(B) DF1, DF2 and DF3 have similar binding affinity to m6A-modified mRNA. Previous studies suggest that DF1, DF2 and DF3 bind with similar affinity to m6A-modified mRNA (Patil et al., 2018; Wang et al., 2014a; Xu et al., 2015). To compare the affinities side-by-side, full length DF1, DF2 and DF3 were prepared as recombinant proteins in E. coli and the affinity to an m6A-modified RNA was measured by microscale thermophoresis (MST). Shown is the percentage of protein bound (fraction bound) at increasing concentration of the m6A-RNA. These data show that the three DFs have similar in vitro binding affinity to m6A. Data are represented as mean ± s.d. (n= 2 replicates).
(C) The previously reported (Shi et al., 2017) level of overlap of the DF1, DF2, and DF3 targets is summarized. In these previous studies, the targets of each DF paralog were first identified by PAR-CLIP (Shi et al., 2017; Wang et al., 2015; Wang et al., 2014a). Then, to determine which of these mRNAs represent valid DF-mRNA interactions, RIP (immunoprecipitation of the DF paralog, followed by reverse transcription and sequencing of the bound RNA) was performed. An overlap approach was used to identify targets of each DF paralog, and subsequently to define DF1, DF2 or DF3 unique targets or common targets. This analysis resulted in the conclusion that only a minority of mRNAs (23.98%) are bound by all DF paralogs, as shown by the pie chart. Most of the mRNAs were annotated to be either unique targets of one DF or shared by two DFs. The finding that different DF proteins bind distinct subsets of m6A-containing mRNAs in the transcriptome has been the foundation of the current model of how DFs differentially regulate different m6A mRNA cohorts (Han et al., 2019; Liu et al., 2018; Ok Hyun Park, 2019; Shi et al., 2017; Shi et al., 2019; Shi et al., 2018).
(D) Read quality analysis of the previously performed DF1, DF2 and DF3 PAR-CLIP datasets. For each PAR-CLIP dataset (Shi et al., 2017; Wang et al., 2015; Wang et al., 2014a), reads are classified based on the following quality parameters: read length (yellow, whether a read is shorter than 18 nucleotides, and thus cannot be aligned to the genome), presence of PCR duplicates (blue, duplicates category), and mappability to the genome using Bowtie and the previously reported parameters (categorized into “mappable” (green) or “fail to map” (light blue) reads). The DF3 PAR-CLIP dataset was unusual for several reasons. First, 44.11% of all reads mapped to a single site in a single gene, MT-RNR2 (see STAR Methods). These reads were identical, consistent with a PCR duplication event and were not found in the DF1 or DF2 PAR-CLIP datasets or any miCLIP datasets. Second, of the remaining reads, only a small percentage of these were mappable (indicated in green in the 10 × 10 dot plot). Overall, the DF3 PAR-CLIP dataset lacks sufficient read depth to detect endogenous DF3-binding sites in the transcriptome as efficiently as the other PAR-CLIP datasets.
(E) Schematic representation of the method used to identify m6A sites bound by one DF or shared by two or more DFs. Scatterplots are used to represent the pairwise comparison of the number of normalized DF reads calculated from the iCLIP datasets at each m6A site. Yellow areas indicate where m6A sites that uniquely bind one DF should be located. For instance, DF1-unique sites with a high level of coverage for DF1 (high number on x axis) and a low level of coverage for DF2 (low number on the y-axis) will be shown in the lower right area of the scatterplot. m6A sites bound by two or more DFs with a similar level of binding for each DF will be found in the indicated light red area.
(F) Essentially all m6A sites show highly correlated binding of DF1 and DF2 based on previous PAR-CLIP datasets (Shi et al., 2017; Wang et al., 2015; Wang et al., 2014a). As described in E, to identify m6A sites that preferentially bind DF1 or DF2, their level of binding was quantified at each m6A site in the transcriptome (Ke et al., 2017). In this experiment, we used the previously reported PAR-CLIP datasets prepared in HeLa cells (Shi et al., 2017; Wang et al., 2015; Wang et al., 2014a). According to the previous analysis (Shi et al., 2017; Wang et al., 2015; Wang et al., 2014a), nearly 50% of m6A sites should be uniquely bound by one DF. However, few if any m6A sites show evidence of disproportionate binding of one DF paralog compared to the other. Additionally, the high Pearson correlation coefficients (r) show that DF1 and DF2 have highly similar binding preferences for each m6A site in the transcriptome of HeLa cells. Similar results are shown in Figure 1C using iCLIP data for DF1, DF2 and DF3 in HEK293T cells (Linder et al., 2015; Patil et al., 2016). Thus, the binding of all m6A sites to each DF paralog is not cell-type specific, and not specific to the type of CLIP assay used (PAR-CLIP vs. iCLIP).
(G, H) DF1-unique sites show extensive levels of bound DF2, and vice versa. Previous studies show that nearly half of all m6A sites are uniquely bound by only one DF paralog (Shi et al., 2017; Wang et al., 2015; Wang et al., 2014a). To confirm whether DF1-unique mRNAs are indeed uniquely bound by DF1, we asked if there are markedly fewer DF2 PAR-CLIP reads than DF1 PAR-CLIP reads located at DF1-unique sites. For this analysis, we selected the previously described DF1-uniquely bound sites and DF2-uniquely bound sites (Shi et al., 2017; Wang et al., 2015; Wang et al., 2014a). Shown is the DF1 and DF2 PAR-CLIP coverage at DF1-unique sites (G) and at DF2-unique sites (H). For each site, PAR-CLIP DF1 or DF2 coverage is shown, with each row representing the coverage for a different unique site and its surrounding area. The rows are ordered based on the degree of DF1 PAR-CLIP coverage (G) or DF2 PAR-CLIP coverage (H). In principle, DF1-unique sites should show higher level of DF1 PAR-CLIP coverage than DF2. However, the PAR-CLIP coverage for both DF1 and DF2 appears largely identical at both DF1-unique sites and DF2-unique sites. We were unable to define the DF3 coverage level at each site given the low number of mappable reads of the DF3 PAR-CLIP dataset, as discussed in Figure S1C.
(J) DF1 and DF2 PAR-CLIP read tracks are highly similar even on transcripts thought to be DF1-unique or DF2-unique (Shi et al., 2017; Wang et al., 2015; Wang et al., 2014a). DF1-unique and DF2-unique transcripts should show unique peaks or patterns of DF1 and DF2 binding. However, we found that transcripts generally appear to show identical PAR-CLIP read coverage along the entire length of the transcript body. When inspecting different mRNAs, differences in PAR-CLIP coverage were only seen if read coverage was low and therefore susceptible to read noise. Shown is the normalized read distribution of DF1 PAR-CLIP (in blue) and DF2 PAR-CLIP (in green) on OGT, an mRNA previously thought to be a DF1-unique target, and on DUSP1, an mRNA previously thought to be a DF2-unique target. The “called” DF peaks were previously reported by Wang et al., 2015 and Wang et al., 2014 based on a statistical peak finding algorithm PARalyzerv1.1 and are presented below their respective tracks. Each row represents called peaks in a different PAR-CLIP replicate. Notably, the location of peaks and the relative heights of each peak is similar for DF1 and DF2 on both transcripts. All the peaks overlap substantially with called m6A sites in HeLa cells (Ke et al., 2017). In the original DF1, DF2, and DF3 mapping studies, the PAR-CLIP called sites were overlapped with a list of target mRNAs immunoprecipitated using the RIP protocol (Shi et al., 2017; Wang et al., 2015; Wang et al., 2014a). Compared to the total number of m6A-containing mRNAs or the total number of mRNAs containing DF1 or DF2 PAR-CLIP peaks, only a few mRNAs were successfully immunoprecipitated using this method (1747 for DF1, 1592 for DF2, 2080 for DF3). Therefore, the use of this approach makes the final list of DF-specific mRNA targets highly dependent on this low efficiency mRNA immunoprecipitation method.
(A) DF1, DF2 and DF3 exhibit generally high sequence identity and similarity in their effectordomain. In Figure S1, we examined the high sequence identity of all DFs in their YTH domain. Shown here is a schematic representation of the aligned amino acid sequence of the remaining part of the DF1, DF2 and DF3 protein. There was overall similarity along the entire length of the effector domain, with small regions where there were amino acid differences. These small differences may account for the previously described differences of DF function, which are examined in this study. Residues are classified according to the ClustalW Multiple Sequence Alignment score (Madeira et al., 2019) based on whether the residue is exactly identical among all DFs, or “strongly and weakly similar” residues (the amino acids share higher or lower level of similarity in their physicochemical properties among all DFs). Shown in the table is the overall percentage of sequence identity and similarity calculated by the pairwise sequence EMBOSS Needle aligner (Madeira et al., 2019). The pairwise comparisons of the DF amino acid sequences confirms the high sequence similarity and identity of all DFs.
(B) High-confidence interactors of each DF paralog generally show high-confidence interactionswith the other DF paralogs. As described in Figure 2B, high-confidence interactors of each DF paralog in vivo were identified previously using a Bio-ID proteomic approach (Youn et al., 2018). The top 25 interacting proteins for each DF was previously determined based on their length-normalized spectral counts and the average probability of interaction calculated across different replicates (Youn et al., 2018). The heatmap show the AvgP, average probability of interaction, for each of the top 25 interactors of DF1, DF2 and DF3. The majority of the top 25 interactors have a high average probability of interaction with all three paralogs. These proteins include the main components of the CCR4-NOT RNA-degradation complex and proteins previously identified as stress granule components. A recent study showed that all three DF proteins bind CNOT1 and all three can elicit mRNA degradation when tethered in cells to a reporter mRNA (Du et al., 2016), supporting the overall finding that the major function of the DF proteins is to mediate degradation of m6A-mRNAs. Interestingly, interaction with components, or repressor of the translation process may suggest a possible involvement of DF proteins in the translational repression of m6A mRNAs. This repression may be then interconnected to the observed DF-dependent regulation of m6A-mRNA stability. Shown at the bottom is the AvgP of interaction of each DF with the other DF paralogs.
(C) The Bio-ID DF1 interactome data (Youn et al., 2018) did not identify EIF3A and 3B as highconfidence DF1 interactors. However, in Wang et al., 2015, EIF3A and EIF3B were identified in FLAG-tagged DF1 immunoprecipitates by mass spectrometry (Wang et al., 2015). Shown is the reported score and number of unique peptides mapped to each putative DF1 interactor from Wang et al., 2015. However, even in this study, EIF3A and EIF3B are not among the top DF1 interactors when ranking all the interactors by the reported score. Moreover, as shown in red, the number of unique peptides is less than 5. This low level of interaction is consistent with the Bio-ID interactome studies presented in Figure 2B. Thus, EIF3A and EIF3B are not seen as DF1 interactors in the Bio-ID study (Youn et al., 2018) and are weak interactors in the Wang et al.,2015 study (Wang et al., 2015).
(D) Heterologous expression of DF proteins causes formation of DF stress granule-like structures. Plasmids expressing FLAG-3xHA tagged DF proteins, or a control FLAG-3xHA construct were transfected in HeLa cells and staining was performed after 24 h of transfection. Areas where the HA staining (green) overlaps with the DF staining (red) indicate the FLAG-3xHA tagged DF localization (yellow). As indicated by the arrows, the FLAG-3xHA tagged protein formed granule-like structures of different dimension in some, but not all cells. This phenomenon occurs with proteins with low-complexity domains (Alberti et al., 2019). As shown by the absence of these structures in the control-transfected cells (FLAG-3xHA), the granule-like structures are not an artifact of transfection. Thus, expressing DF proteins may lead to uninterpretable results due to the variable formation of protein aggregates that could act to sequester DF proteins and mask their function. Scale bar, 20 μm.
(A) Validation of DF1, DF2 and DF3 knockdown upon silencing of each of the DF paralogs alone or together. Western blotting was used to confirm knockdown using the indicated DF paralog-specific antibodies on each sample used to perform RNA seq and Ribosome profiling analysis. HeLa cells were transfected with the same total concentration (30 nM) of siRNA in each condition. Western blotting was performed 4 days after transfection. In each silencing condition, the siRNA sequences were specific to the DF paralog of interest, as seen by the selective knockdown seen with each siRNA. GAPDH was used as loading control.
(B) Relative quantification of DF1, DF2 and DF3 protein band intensity shown in A. Western blot chemiluminescent signal of every band was measured using ImageLab Image tools and normalized to the GAPDH loading control. Knockdown of any of the DF paralogs was associated with a compensatory increase in the expression of the other paralogs. The number of dots indicates the number of Western Blot replicates for each condition. Error bars indicate standard deviation.
(C) Reproducibility of the RNA-seq library replicates. For each silencing condition tested (DF1, DF2, DF3 and triple silencing), three independent replicates were performed. The Pearson correlation coefficient of the normalized number of mapped reads across replicates was calculated and presented in each heatmap.
(D) DF1, DF2 and DF3 RNA and protein levels in HeLa cells measured by RNA-seq and Ribo-seq. The normalized counts of reads mapped to each paralog after RNAseq (mRNA) and ribosome profiling (RPFs, ribosome protected fragments) were used as a proxy of the mRNA expression and protein expression levels, respectively. As shown by the heatmap, DF1 has mRNA levels similar to DF2. However, DF2 is the most highly translated DF paralog. This will result in a higher amount of DF2 protein in HeLa cells. Thus, at least in HeLa cells, DF2 is likely to be the most abundant DF paralog.
(E) Validation of the simultaneous knockdown of DF1 and DF2, DF1 and DF3, DF2 and DF3 four days after siRNA transfection. Cells were transfected with siRNA on Day 1 and Day 3, and then western blotted to detect levels of DF1, DF2, or DF3 on Day 4. Knockdown of two DF paralogs was associated with a modest compensatory increase in the expression of the remaining DF paralog. GAPDH was used as loading control.
(F-H) Cumulative distribution plots related to Figure 3E. In Figure 3A–D, the cumulative distribution plots were shown only for the single knockdown experiments and the triple knockdown experiment. Here we show the cumulative distribution blots for the double knockdown experiments. The abundance of each mRNA (based on RNA-seq counts) was compared between the control and the indicated double DF silenced condition. mRNAs were binned based on the number of annotated m6A sites. m6A mRNAs show higher expression levels compared to nonmethylated mRNA upon silencing any two DF paralogs. In F-H, each m6A binned group was compared to the non-methylated mRNA group using a two-tailed Mann–Whitney test. Only significant p-values are shown in each graph and the exact p-values are reported. n=3 biological replicates.
(I) Reproducibility of the RNA-seq library replicates. For each silencing condition tested (DF1-DF2,DF1-DF3, DF2-DF3), three independent replicates were performed. The Pearson correlation coefficient of the normalized number of reads across replicates was calculated and presented in each heatmap.
(J) RT-qPCR validation of the increase in stability of m6A mRNAs upon the silencing of the three paralogs. Highly methylated mRNAs (ZNF503 – 4 annotated m6A sites, SGK1 – 4 annotated m6A sites, ID3 – 7 annotated m6A sites) were selected for validation. Transcripts lacking annotated m6A sites (PP1E3C and RPS28) were chosen as controls. The stability of m6A-modified mRNAs and non-methylated mRNAs was determined by quantifying by RT-qPCR the mRNA levels immediately before (0 h), 1 h and 2 h after actinomycin D treatment. The amount of mRNA detected at each time point is shown as percentage of the total mRNA amount quantified at time 0 and normalized on the RPS28 abundance. The increase in mRNA stability is most apparent when all three DF paralogs were knocked down. (n=2 biological replicates).
(A) Unlike PABPC1, DF1 is not enriched in the polysomal fraction. DF1 has been proposed to enhance translation by facilitating loading of eIF3 to mRNA 5’UTRs. In this model, DF1 binds to an mRNA 3’UTR, and binds eIF3. This can create an mRNA loop in which the 3’UTR and 5’UTR are connected via the DF1-eIF3 complex. This is similar to other PABPC1, which also binds to mRNA 3’UTRs and binds a translation initiation factor, which results in mRNA looping. PABPC1 function in enhancing mRNA translation is evidenced by its enrichment in the sucrose fractions occupied by mRNAs containing high levels of actively translating ribosomes (polysomes). We therefore tested if DF1 is also enriched in the polysome fractions by treating HeLa cells with cycloheximide and fractionating polysomes on a sucrose gradient. The RNA fractions indicated here are related to the UV trace as shown in Figure 4A. DF1 is not enriched in these fractions based on paralog-specific western blotting (also see Figure 4A). In contrast, PABPC1 is readily detected in the actively translating ribosomal fractions. The ribosomal protein RPS6 was used to confirm the efficiency in recovering the translating ribosomes from the polysomal sucrose fractions. Thus, these data do not support a model in which DF1 enhances the translation of m6A-mRNAs by binding to highly translated mRNAs.
(B) m6A-mRNAs are downregulated upon depletion of DF1, based on ribosome profiling datasets provided in Wang et al., 2015 (Wang et al., 2015). Here, we used two “processed” datasets provided in the GEO submission for Wang et al., 2015 (GSE63591_C-Y1-Ribosome_profiling.xlsx). These datasets are referred to as processed since the number of ribosome-protected fragments, RNA-Seq data, and translational efficiency (TE) are listed for each transcript based on the authors’ calculations and analysis of their next-generation sequencing data. We used this processed data to calculate the change in translational efficiency of mRNAs upon DF1 silencing based on the number of annotated m6A sites. As can be seen, m6A-modified mRNAs show reduced translation upon DF1 knockdown. This result is essentially identical to the cumulative distribution plots presented in Wang et al., 2015. Notably, the data presented here is based on the average of two replicates provided by Wang et al., designated Replicate 1 and Replicate 2.
(C) Replicate 1 shows a more prominent reduction in m6A-mRNA translation upon depletion of DF1. The effect seen in Replicate 1 is more pronounced than the effect seen in A, which is the average of Replicate 1 and Replicate 2. Only significant p-values are shown in each graph and the exact p-values are reported.
(D) Replicate 2 shows no reduction in m6A-mRNA translation efficiency upon depletion of DF1. Surprisingly, and in contrast to Replicate 1 (shown in B), Replicate 2 does not show a drop in m6A mRNA translation efficiency upon depletion of DF1. The effect seen in A was seen since it was the average of Replicate 1 and Replicate 2, which show different effects on m6A mRNA. In B-D, each m6A group was compared to the non-methylated mRNA group using a two-tailed Mann–Whitney test. Only significant p-values are shown in each graph and the exact p-values are reported.
(E) The reanalyzed ribosome profiling datasets do not show reduced m6A-mRNA translation efficiency upon depletion of DF1. In this experiment, we accessed the original next-generation sequencing data generated by Wang et al., 2015 (GEO Accession Number GSE63591) and generated a new table of ribosome-protected fragments using a standard ribosome-profiling analysis pipeline (McGlincy and Ingolia, 2017). We referred to these reanalyzed datasets “Replicate R1” and “Replicate R2.” mRNAs were binned based on the number of annotated m6A sites. In contrast to the results presented in B, analysis of the two replicates (presented as an average) shows that m6A mRNAs do not show reduced translation efficiency upon DF1 silencing.
(F) The reanalyzed ribosome profiling sample, i.e., Replicate R1, no longer shows a link betweenm6A mRNA translation and DF1. In contrast to the original processed data presented in C, reanalysis of the underlying next-generation sequencing data from the ribosome profiling data in Wang et al., 2015, no longer shows decreased m6A-mRNA translation upon depletion of DF1.
(G) Replicate R2, like the original Replicate 2 shown in D, shows no change in m6A-mRNA translation efficiency upon depletion of DF1. In E-G, each m6A binned group was compared to the non-methylated mRNA group using a two-tailed Mann–Whitney test. Only significant p-values are shown in each graph and the exact p-values are reported.
(H) The number of ribosome-protected fragments per mRNA reported by Wang et al. for Replicate 1 only modestly correlates to the number of ribosome-protected fragments of Replicate 2. Both the control replicates, and the DF1-depleted replicates were compared. For this analysis, we used the number of ribosome-protected fragments reported for the two replicates in the GEO submission for Wang et al., 2015 (GSE63591_C-Y1-Ribosome_profiling.xlsx). These datasets are referred to as “processed” since the number of ribosome-protected fragments are listed based on the authors’ analysis of their next-generation sequencing raw data. For each tested condition (transfection with a control siRNA or with siRNAs targeting DF1), a plot showing the comparison between the number of ribosome-protected fragments calculated for Replicate1 and Replicate 2 is presented. A Pearson correlation was calculated for each comparison. To reduce the complexity of the analysis, only the ribosome-protected fragments mapped to the m6AmRNAs are presented.
(I) Upon our re-examination of the raw data reported by Wang et al., the number of ribosome-protected fragments per mRNA in Replicate 1 strongly correlates with the number of ribosome-protected fragments of Replicate 2. This analysis was performed for both the control and DF1-depleted samples. Here, we accessed the original next-generation sequencing data generated by Wang et al., 2015 (GEO Accession Number GSE63591) and generated a new table of ribosomeprotected fragments per gene using a standard ribosome-profiling analysis pipeline (McGlincy and Ingolia, 2017). We referred to these as “Reanalysis of the data from Wang et al., 2015”. As in H, a plot showing the comparison between the number of ribosome-protected fragments calculated for Replicate1 and Replicate 2 is presented for each tested condition. In contrast to H, there is high level of correlation between replicates independently from the tested condition. This result is generally seen when analyzing replicates of the same condition giving higher level of confidence in interpreting the possible effect of DF1 on the translation of m6A genes.
(J) m6A-mRNAs do not show a reduction in translation efficiency upon depletion of DF3. We asked if m6A-mRNA translation is affected upon depletion of DF3, using the ribosome profiling datasets generated by Shi et al., 2017 (Shi et al., 2017). Unlike in the DF1 knockdown dataset, the processed data provided by Shi et al., 2017 presented the ribosome-protected fragments from two replicates as a log2-fold-change relative to a single control ribosome profiling experiment. mRNAs were binned based on the number of annotated m6A sites. Here, we saw no change in translation of m6A-annotated mRNAs using the two knockdown replicates provided in Shi et al., 2017.
(A) Reproducibility of the ribosome profiling library replicates. For each silencing condition tested(DF1, DF2, DF3), three independent replicates were performed. The Pearson correlation coefficient of the normalized number of ribosome-protected fragments reads across replicates was calculated and presented in each heatmap.
(B) Validation of ribosome profiling datasets. Distribution of read length in the ribosome profilingexperiments in each tested condition (DF1, DF2 and DF3 silencing). Most of the reads are 29–30 nt in length, which reflects the expected size of the ribosome footprint when a ribosome is translating on the mRNA and the A site is occupied (McGlincy and Ingolia, 2017; Wu et al., 2019). The samples were prepared in the absence of cycloheximide as recommended in the most current ribosome profiling protocols (McGlincy and Ingolia, 2017). The percentage of P-sites assigned to the coding sequence, 3’ UTR, or the 5’ UTR is presented as a bar plot for each condition. As expected, most of the reads map to the coding region. (lower right) The position of ribosome footprints relative to the reading frame was determined for each dataset. Overall, these analyses indicate that a high fraction of the reads obtained in these datasets represent ribosome-protected fragments that reflect the position of the translating ribosomes in cells.
(C) Validation of the DF1, DF2 and DF3 knockdown. To confirm knockdown of the DF paralogs, we quantified the number of ribosome-protected fragments (RPFs) that mapped to each transcript before and after the silencing of each DF paralog. Upon the silencing, the reduction in the RPFs confirms that DF1, DF2 and DF3 are less translated, consistent with efficient knockdown. These results are consistent with the western blot validation presented in Figure S3A and S3B.
(D) Effect of DF1 depletion on the distribution of m6A-modified mRNAs (OSGIN2, CDC27 and YY1) and non-m6A-modified mRNA (RPS28) along the sucrose gradient. To independently test whether m6A-mRNAs are less translated, we performed polysome fractionation on a sucrose gradient of DF1-silenced and control siRNA-treated cytoplasmic lysates (upper graph). The level of m6A-mRNAs reported to be exhibit markedly reduced in translation upon DF1 silencing by (YY1 and OSGIN2, −5.6 log2 fold change; CDC27, −3.66 log2 fold change, Wang et al., 2015), were tested in each fraction by qPCR. The quantity of each mRNA per fraction was normalized to the amount of spike-in luciferase mRNA in each fraction and presented as percentage of the total amount measured in all fractions. As shown in the lower graphs, DF1 silencing does not affect the distribution of m6A-mRNAs along the gradient. Thus, the effect previously shown by the ribosome profiling for the top-regulated m6A-mRNAs cannot be independently validated using polysome fractionation and qPCR analysis. Data are means +/− s.e.m. (n=2)
(E) Reproducibility of the DF1, DF2, and DF3 triple knockdown ribosome profiling dataset. As shown in A, the Pearson correlation coefficient of the normalized number of ribosome-protected fragments across replicates was calculated and presented in a heatmap.
(F) Validation of the ribosome profiling dataset obtained upon depletion of DF1, DF2, and DF3. As presented in B, shown are the distribution of the ribosome profiling read lengths, the percentage of P-sites assigned to the coding sequence, 3’ UTR, and 5’ UTR, and the position of ribosome footprints relative to the reading frame. Overall, these analyses indicate that a high fraction of the reads obtained in this dataset represent ribosome-protected fragments that reflect the position of the translating ribosomes in cells.
(G) Confirmation of DF1, DF2 and DF3 knockdown in MOLM-13 cells. Western Blot was performed after 5 days from the shRNA transduction. GAPDH was used as loading control.
Table S1. The number of annotated m6A sites per gene in HeLa cells. Related to Figure 3–4, S1, S3 and S4
Table S2. Reanalysis of the ribosome profiling performed upon DF1 silencing by Wang et al., 2015. Results related to Replicate 1 are presented. Related to Figure 4 and Figure S4F
Table S3. Reanalysis of the ribosome profiling performed upon DF1 silencing by Wang et al., 2015. Results related to Replicate 2 are presented. Related to Figure 4 and Figure S4G
Highlights:
YTHDF proteins function together to mediate degradation of m6A-mRNAs
YTHDF proteins show identical binding to all m6A sites in mRNAs
Each YTHDF paralog can compensate for the function of the other YTHDF paralogs
Depletion of all three YTHDF proteins promotes the differentiation of leukemia cells
Acknowledgments
We thank members of the Jaffrey laboratory for comments and suggestions, in particular V. Despic, and D. Patil. We thank members of the Epigenomics, Flow Cytometry Weill Cornell Cores. We thank A. North and the Rockefeller Bio-Imaging Resource Center for assistance with SIM microscopy. We thank the Rockefeller High-Throughput Screening Resource Center for assistance with the MST experiments. We thank Y. Cheng and M. Kharas for advice for the experiments using leukemia cells. This work was supported by NIH grants R35NS111631 and R01CA186702 (S.R.J.) and an American-Italian Cancer Foundation fellowship (S.Z.).
Footnotes
Declaration of interests
S.R.J. is scientific founder of, advisor to, and owns equity in Gotham Therapeutics
Publisher's Disclaimer: This is a PDF file of an unedited manuscript that has been accepted for publication. As a service to our customers we are providing this early version of the manuscript. The manuscript will undergo copyediting, typesetting, and review of the resulting proof before it is published in its final form. Please note that during the production process errors may be discovered which could affect the content, and all legal disclaimers that apply to the journal pertain.
References
- Alberti S, Gladfelter A, and Mittag T (2019). Considerations and Challenges in Studying Liquid-Liquid Phase Separation and Biomolecular Condensates. Cell 176, 419–434. [DOI] [PMC free article] [PubMed] [Google Scholar]
- Anders M, Chelysheva I, Goebel I, Trenkner T, Zhou J, Mao Y, Verzini S, Qian S-B, and Ignatova Z (2018). Dynamic m6A methylation facilitates mRNA triaging to stress granules. Life Science Alliance 1, e201800113. [DOI] [PMC free article] [PubMed] [Google Scholar]
- Arava Y, Wang Y, Storey JD, Liu CL, Brown PO, and Herschlag D (2003). Genome-wide analysis of mRNA translation profiles in Saccharomyces cerevisiae. Proc Natl Acad Sci USA 100, 3889–3894. [DOI] [PMC free article] [PubMed] [Google Scholar]
- Arguello AE, Leach RW, and Kleiner RE (2019). In Vitro Selection with a Site-Specifically Modified RNA Library Reveals the Binding Preferences of N6-Methyladenosine Reader Proteins. Biochemistry 58, 3386–3395. [DOI] [PMC free article] [PubMed] [Google Scholar]
- Bailey TL, Boden M, Buske FA, Frith M, Grant CE, Clementi L, Ren J, Li WW, and Noble WS (2009). MEME SUITE: tools for motif discovery and searching. Nucleic Acids Research 37, W202–W208. [DOI] [PMC free article] [PubMed] [Google Scholar]
- Barbieri I, Tzelepis K, Pandolfini L, Shi J, Millán-Zambrano G, Robson SC, Aspris D, Migliori V, Bannister AJ, Han N, et al. (2017). Promoter-bound METTL3 maintains myeloid leukaemia by m6A-dependent translation control. Nature 552, 126–131. [DOI] [PMC free article] [PubMed] [Google Scholar]
- Birkaya B, Ortt K, and Sinha S (2007). Novel in vivo targets of ΔNp63 in keratinocytes identified by a modified chromatin immunoprecipitation approach. BMC Mol Biol 8, 43. [DOI] [PMC free article] [PubMed] [Google Scholar]
- Calviello L, Mukherjee N, Wyler E, Zauber H, Hirsekorn A, Selbach M, Landthaler M, Obermayer B, and Ohler U (2015). Detecting actively translated open reading frames in ribosome profiling data. Nature Methods 13, 165–170. [DOI] [PubMed] [Google Scholar]
- Canaani D, Kahana C, Lavi S, and Groner Y (1979). Identification and mapping of N 6 -methyladenosine containing sequences in Simian Virus 40 RNA. Nucleic Acids Res 6, 2879–2899. [DOI] [PMC free article] [PubMed] [Google Scholar]
- Chakrabarti AM, Haberman N, Praznik A, Luscombe NM, and Ule J (2018a). Data Science Issues in Studying Protein–RNA Interactions with CLIP Technologies. Annual Review of Biomedical Data Science 1, 235–261. [DOI] [PMC free article] [PubMed] [Google Scholar]
- Choe J, Lin S, Zhang W, Liu Q, Wang L, Ramirez-Moya J, Du P, Kim W, Tang S, Sliz P, et al. (2018). mRNA circularization by METTL3–eIF3h enhances translation and promotes oncogenesis. Nature 561, 556–560. [DOI] [PMC free article] [PubMed] [Google Scholar]
- Clancy MJ (2002). Induction of sporulation in Saccharomyces cerevisiae leads to the formation of N6-methyladenosine in mRNA: a potential mechanism for the activity of the IME4 gene. Nucleic Acids Res 30, 4509–4518. [DOI] [PMC free article] [PubMed] [Google Scholar]
- Cui Q, Shi H, Ye P, Li L, Qu Q, Sun G, Sun G, Lu Z, Huang Y, Yang C-G, et al. (2017). m 6 A RNA Methylation Regulates the Self-Renewal and Tumorigenesis of Glioblastoma Stem Cells. Cell Reports 18, 2622–2634. [DOI] [PMC free article] [PubMed] [Google Scholar]
- Dimock K, and Stoltzfus CM (1977). Sequence specificity of internal methylation in B77 avian sarcoma virus RNA subunits. Biochemistry 16, 471–478. [DOI] [PubMed] [Google Scholar]
- Dobin A, Davis CA, Schlesinger F, Drenkow J, Zaleski C, Jha S, Batut P, Chaisson M, and Gingeras TR (2013). STAR: ultrafast universal RNA-seq aligner. Bioinformatics 29, 15–21. [DOI] [PMC free article] [PubMed] [Google Scholar]
- Dodt M, Roehr J, Ahmed R, and Dieterich C (2012). FLEXBAR—Flexible Barcode and Adapter Processing for Next-Generation Sequencing Platforms. Biology 1, 895–905. [DOI] [PMC free article] [PubMed] [Google Scholar]
- Dominguez D, Freese P, Alexis MS, Su A, Hochman M, Palden T, Bazile C, Lambert NJ, Van Nostrand EL, Pratt GA, et al. (2018). Sequence, Structure, and Context Preferences of Human RNA Binding Proteins. Molecular Cell 70, 854–867.e859. [DOI] [PMC free article] [PubMed] [Google Scholar]
- Du H, Zhao Y, He J, Zhang Y, Xi H, Liu M, Ma J, and Wu L (2016). YTHDF2 destabilizes m6A-containing RNA through direct recruitment of the CCR4–NOT deadenylase complex. Nature Communications 7, 12626. [DOI] [PMC free article] [PubMed] [Google Scholar]
- Geula S, Moshitch-Moshkovitz S, Dominissini D, Mansour AA, Kol N, Salmon-Divon M, Hershkovitz V, Peer E, Mor N, Manor YS, et al. (2015). m6A mRNA methylation facilitates resolution of naive pluripotency toward differentiation. Science 347, 1002–1006. [DOI] [PubMed] [Google Scholar]
- Guertin MJ, Cullen AE, Markowetz F, Holding AN (2019). Parallel factor ChIP provides essential internal control for quantitative differential ChIP-seq. Nucleic Acids Research 46. [DOI] [PMC free article] [PubMed] [Google Scholar]
- Han D, Liu J, Chen C, Dong L, Liu Y, Chang R, Huang X, Liu Y, Wang J, Dougherty U, et al. (2019). Anti-tumour immunity controlled through mRNA m6A methylation and YTHDF1 in dendritic cells. Nature 566, 270–274. [DOI] [PMC free article] [PubMed] [Google Scholar]
- Hesser CR, Karijolich J, Dominissini D, He C, and Glaunsinger BA (2018). N6methyladenosine modification and the YTHDF2 reader protein play cell type specific roles in lytic viral gene expression during Kaposi’s sarcoma-associated herpesvirus infection. PLOS Pathogens 14, e1006995. [DOI] [PMC free article] [PubMed] [Google Scholar]
- Holehouse AS, Das RK, Ahad JN, Richardson MOG, and Pappu RV (2017). CIDER: Resources to Analyze Sequence-Ensemble Relationships of Intrinsically Disordered Proteins. Biophys J 112, 16–21. [DOI] [PMC free article] [PubMed] [Google Scholar]
- Ke S, Pandya-Jones A, Saito Y, Fak JJ, Vågbø CB, Geula S, Hanna JH, Black DL, Darnell JE, and Darnell RB (2017). m6A mRNA modifications are deposited in nascent premRNA and are not required for splicing but do specify cytoplasmic turnover. Genes & Development 31, 990–1006. [DOI] [PMC free article] [PubMed] [Google Scholar]
- Kennedy EM, Bogerd HP, Kornepati AV, Kang D, Ghoshal D, Marshall JB, Poling BC, Tsai K, Gokhale NS, Horner SM, et al. (2016). Posttranscriptional m(6)A Editing of HIV-1 mRNAs Enhances Viral Gene Expression. Cell Host Microbe 19, 675–685. [DOI] [PMC free article] [PubMed] [Google Scholar]
- Lancaster AK, Nutter-Upham A, Lindquist S, and King OD (2014). PLAAC: a web and command-line application to identify proteins with prion-like amino acid composition. Bioinformatics 30, 2501–2502. [DOI] [PMC free article] [PubMed] [Google Scholar]
- Landt SG, Marinov GK, Kundaje A, Kheradpour P, Pauli F, Batzoglou S, Bernstein BE, Bickel P, Brown JB, Cayting P, et al. (2012). ChIP-seq guidelines and practices of the ENCODE and modENCODE consortia. Genome Res 22, 1813–1831. [DOI] [PMC free article] [PubMed] [Google Scholar]
- Lauria F, Tebaldi T, Bernabo P, Groen EJN, Gillingwater TH, and Viero G (2018). riboWaltz: Optimization of ribosome P-site positioning in ribosome profiling data. PLoS Comput Biol 14, e1006169. [DOI] [PMC free article] [PubMed] [Google Scholar]
- Le H, Tanguay RL, Balasta ML, Wei CC, Browning KS, Metz AM, Goss DJ, and Gallie DR (1997). Translation Initiation Factors eIF-iso4G and eIF-4B Interact with the Poly(A)-binding Protein and Increase Its RNA Binding Activity. J Biol Chem 272, 16247–16255. [DOI] [PubMed] [Google Scholar]
- Lee H, Bao S, Qian Y, Geula S, Leslie J, Zhang C, Hanna JH, and Ding L (2019). Stage-specific requirement for Mettl3-dependent m6A mRNA methylation during haematopoietic stem cell differentiation. Nature Cell Biology 21, 700–709. [DOI] [PMC free article] [PubMed] [Google Scholar]
- Li A, Chen Y-S, Ping X-L, Yang X, Xiao W, Yang Y, Sun H-Y, Zhu Q, Baidya P, Wang X, et al. (2017). Cytoplasmic m6A reader YTHDF3 promotes mRNA translation. Cell Research 27, 444–447. [DOI] [PMC free article] [PubMed] [Google Scholar]
- Li F, Zhao D, Wu J, and Shi Y (2014). Structure of the YTH domain of human YTHDF2 in complex with an m6A mononucleotide reveals an aromatic cage for m6A recognition. Cell Research 24, 1490–1492. [DOI] [PMC free article] [PubMed] [Google Scholar]
- Linder B, Grozhik AV, Olarerin-George AO, Meydan C, Mason CE, and Jaffrey SR (2015). Single-nucleotide-resolution mapping of m6A and m6Am throughout the transcriptome. Nature Methods 12, 767–772. [DOI] [PMC free article] [PubMed] [Google Scholar]
- Liu J, Eckert MA, Harada BT, Liu SM, Lu Z, Yu K, Tienda SM, Chryplewicz A, Zhu AC, Yang Y, et al. (2018). m(6)A mRNA methylation regulates AKT activity to promote the proliferation and tumorigenicity of endometrial cancer. Nat Cell Biol 20, 1074–1083. [DOI] [PMC free article] [PubMed] [Google Scholar]
- Madeira F, Park YM, Lee J, Buso N, Gur T, Madhusoodanan N, Basutkar P, Tivey ARN, Potter SC, Finn RD, et al. (2019). The EMBL-EBI search and sequence analysis tools APIs in 2019. Nucleic Acids Research 47, W636–W641. [DOI] [PMC free article] [PubMed] [Google Scholar]
- Markmiller S, Soltanieh S, Server KL, Mak R, Jin W, Fang MY, Luo E-C, Krach F, Yang D, Sen A, et al. (2018). Context-Dependent and Disease-Specific Diversity in Protein Interactions within Stress Granules. Cell 172, 590–604.e513. [DOI] [PMC free article] [PubMed] [Google Scholar]
- McCarthy DJ, Chen Y, and Smyth GK (2012). Differential expression analysis of multifactor RNA-Seq experiments with respect to biological variation. Nucleic Acids Res 40, 4288–4297. [DOI] [PMC free article] [PubMed] [Google Scholar]
- McGlincy NJ, and Ingolia NT (2017). Transcriptome-wide measurement of translation by ribosome profiling. Methods 126, 112–129. [DOI] [PMC free article] [PubMed] [Google Scholar]
- Merkurjev D, Hong W-T, Iida K, Oomoto I, Goldie BJ, Yamaguti H, Ohara T, Kawaguchi S-Y, Hirano T, Martin KC, et al. (2018). Synaptic N6-methyladenosine (m6A) epitranscriptome reveals functional partitioning of localized transcripts. Nature Neuroscience 21, 1004–1014. [DOI] [PubMed] [Google Scholar]
- Meyer KD, Patil DP, Zhou J, Zinoviev A, Skabkin MA, Elemento O, Pestova TV, Qian SB, and Jaffrey SR (2015). 5’ UTR m6A Promotes Cap-Independent Translation. Cell 163, 999–1010. [DOI] [PMC free article] [PubMed] [Google Scholar]
- Nishizawa Y, Konno M, Asai A, Koseki J, Kawamoto K, Miyoshi N, Takahashi H, Nishida N, Haraguchi N, Sakai D, et al. (2018). Oncogene c-Myc promotes epitranscriptome m6A reader YTHDF1 expression in colorectal cancer. Oncotarget 9, 7476–7486. [DOI] [PMC free article] [PubMed] [Google Scholar]
- Oates ME, Romero P, Ishida T, Ghalwash M, Mizianty MJ, Xue B, Dosztanyi Z, Uversky VN, Obradovic Z, Kurgan L, et al. (2013). D2P2: database of disordered protein predictions. Nucleic Acids Res 41, D508–D516. [DOI] [PMC free article] [PubMed] [Google Scholar]
- Ok Hyun Park HH, Yujin Lee,Boo Sung Ho, Kwon Do Hoon,Hyun Kyu Song, Kim Yoon Ki (2019). Endoribonucleolytic Cleavage of m6A-ContainingRNAs by RNase P/MRP Complex. Molecular Cell, 1–14. [DOI] [PubMed] [Google Scholar]
- Olarerin-George AO, and Jaffrey SR (2017). MetaPlotR: a Perl/R pipeline for plotting metagenes of nucleotide modifications and other transcriptomic sites. Bioinformatics 33, 1563–1564. [DOI] [PMC free article] [PubMed] [Google Scholar]
- Ozoe A, Sone M, Fukushima T, Kataoka N, Arai T, Chida K, Asano T, Hakuno F, and Takahashi S-I (2013). Insulin receptor substrate-1 (IRS-1) forms a ribonucleoprotein complex associated with polysomes. FEBS Lett 587, 2319–2324. [DOI] [PubMed] [Google Scholar]
- Paris J, Morgan M, Campos J, Spencer G, Shmakova A, Ivanova I, Mapperley C, Lawson H, Wotherspoon D, Sepulveda C, et al. (2019). Targeting the RNA m 6 A Reader YTHDF2 Selectively Compromises Cancer Stem Cells in Acute Myeloid Leukemia. Cell Stem Cell 25, 137–148. [DOI] [PMC free article] [PubMed] [Google Scholar]
- Patil DP, Chen C-K, Pickering BF, Chow A, Jackson C, Guttman M, and Jaffrey SR (2016). m6A RNA methylation promotes XIST-mediated transcriptional repression. Nature 537, 369–373. [DOI] [PMC free article] [PubMed] [Google Scholar]
- Patil DP, Pickering BF, and Jaffrey SR (2018). Reading m6A in the Transcriptome: m6A-Binding Proteins. Trends in Cell Biology 28, 113–127. [DOI] [PMC free article] [PubMed] [Google Scholar]
- Quinlan AR, and Hall IM (2010). BEDTools: a flexible suite of utilities for comparing genomic features. Bioinformatics 26, 841–842. [DOI] [PMC free article] [PubMed] [Google Scholar]
- Ramírez F, Ryan DP, Grüning B, Bhardwaj V, Kilpert F, Richter AS, Heyne S, Dündar F, and Manke T (2016). deepTools2: a next generation web server for deep-sequencing data analysis. Nucleic Acids Res 44, W160–W165. [DOI] [PMC free article] [PubMed] [Google Scholar]
- Ries RJ, Zaccara S, Klein P, Olarerin-George A, Namkoong S, Pickering BF, Patil DP, Kwak H, Lee JH, and Jaffrey SR (2019). m6A enhances the phase separation potential of mRNA. Nature 571, 424–428. [DOI] [PMC free article] [PubMed] [Google Scholar]
- Risso D, Ngai J, Speed TP, and Dudoit S (2014). Normalization of RNA-seq data using factor analysis of control genes or samples. Nature Biotechnology 32, 896–902. [DOI] [PMC free article] [PubMed] [Google Scholar]
- Schwartz S, Maxwell, Jovanovic M, Wang T, Maciag K, Mertins P, Ter-Ovanesyan D, Habib N, Cacchiarelli, Neville, et al. (2014). Perturbation of m6A Writers Reveals Two Distinct Classes of mRNA Methylation at Internal and 5′ Sites. Cell Reports 8, 284–296. [DOI] [PMC free article] [PubMed] [Google Scholar]
- Shi H, Wang X, Lu Z, Zhao BS, Ma H, Hsu PJ, Liu C, and He C (2017). YTHDF3 facilitates translation and decay of N6-methyladenosine-modified RNA. Cell Research 27, 315–328. [DOI] [PMC free article] [PubMed] [Google Scholar]
- Shi H, Wei J, and He C (2019). Where, When, and How: Context-Dependent Functions of RNA Methylation Writers, Readers, and Erasers. Molecular Cell 74, 640–650. [DOI] [PMC free article] [PubMed] [Google Scholar]
- Shi H, Zhang X, Weng Y-L, Lu Z, Liu Y, Lu Z, Li J, Hao P, Zhang Y, Zhang F, et al. (2018). m6A facilitates hippocampus-dependent learning and memory through YTHDF1. Nature 563, 249–253. [DOI] [PMC free article] [PubMed] [Google Scholar]
- Slobodin B, Han R, Calderone V, Vrielink JAFO, Loayza-Puch F, Elkon R, and Agami R (2017). Transcription Impacts the Efficiency of mRNA Translation via Co-transcriptional N6-adenosine Methylation. Cell 169, 326–337.e312. [DOI] [PMC free article] [PubMed] [Google Scholar]
- Sommer S, Lavi U, and Darnell JE (1978). The absolute frequency of labeled N-6-methyladenosine in HeLa cell messenger RNA decreases with label time. J Mol Biol 124, 487–499. [DOI] [PubMed] [Google Scholar]
- Tirumuru N, Zhao BS, Lu W, Lu Z, He C, and Wu L (2016). N6-methyladenosine of HIV-1 RNA regulates viral infection and HIV-1 Gag protein expression. Elife 5, e15528 [DOI] [PMC free article] [PubMed] [Google Scholar]
- Vu LP, Pickering BF, Cheng Y, Zaccara S, Nguyen D, Minuesa G, Chou T, Chow A, Saletore Y, Mackay M, et al. (2017). The N6-methyladenosine (m6A)-forming enzyme METTL3 controls myeloid differentiation of normal hematopoietic and leukemia cells. Nature Medicine 23, 1369–1376. [DOI] [PMC free article] [PubMed] [Google Scholar]
- Wang X, Boxuan Ian, Lu Z, Han D, Ma H, Weng X, Chen K, Shi H, and He C. (2015). N6-methyladenosine Modulates Messenger RNA Translation Efficiency. Cell 161, 1388–1399. [DOI] [PMC free article] [PubMed] [Google Scholar]
- Wang X, and He C (2014). Reading RNA methylation codes through methyl-specific binding proteins. RNA Biology 11, 669–672. [DOI] [PMC free article] [PubMed] [Google Scholar]
- Wang X, Lu Z, Gomez A, Hon GC, Yue Y, Han D, Fu Y, Parisien M, Dai Q, Jia G, et al. (2014a). N6-methyladenosine-dependent regulation of messenger RNA stability. Nature 505, 117–120. [DOI] [PMC free article] [PubMed] [Google Scholar]
- Wang Y, Li Y, Toth JI, Petroski MD, Zhang Z, and Zhao JC (2014b). N6-methyladenosine modification destabilizes developmental regulators in embryonic stem cells. Nature Cell Biology 16, 191–198. [DOI] [PMC free article] [PubMed] [Google Scholar]
- Wei CM, Gershowitz A, and Moss B (1976). 5’-Terminal and internal methylated nucleotide sequences in HeLa cell mRNA. Biochemistry 15, 397–401. [DOI] [PubMed] [Google Scholar]
- Wells SE, Hillner PE, Vale RD, and Sachs AB (1998). Circularization of mRNA by Eukaryotic Translation Initiation Factors. Molecular Cell 2, 135–140. [DOI] [PubMed] [Google Scholar]
- Wheeler EC, Van Nostrand EL, and Yeo GW (2018). Advances and challenges in the detection of transcriptome-wide protein-RNA interactions. Wiley Interdisciplinary Reviews: RNA 9, e1436. [DOI] [PMC free article] [PubMed] [Google Scholar]
- Winkler R, Gillis E, Lasman L, Safra M, Geula S, Soyris C, Nachshon A, Tai-Schmiedel J, Friedman N, Le-Trilling VTK, et al. (2018). m 6 A modification controls the innate immune response to infection by targeting type I interferons. Nature Immunology 20, 173. [DOI] [PubMed] [Google Scholar]
- Wu CC-C, Zinshteyn B, Wehner KA, and Green R (2019). High-Resolution Ribosome Profiling Defines Discrete Ribosome Elongation States and Translational Regulation during Cellular Stress. Molecular Cell 73, 959–970.e955. [DOI] [PMC free article] [PubMed] [Google Scholar]
- Xu C, Liu K, Ahmed H, Loppnau P, Schapira M, and Min J (2015). Structural Basis for the Discriminative Recognition ofN6-Methyladenosine RNA by the Human YT521-B Homology Domain Family of Proteins. Journal of Biological Chemistry 290, 24902–24913. [DOI] [PMC free article] [PubMed] [Google Scholar]
- Youn J-Y, Dunham WH, Hong SJ, Knight JDR, Bashkurov M, Chen GI, Bagci H, Rathod B, Macleod G, Eng SWM, et al. (2018). High-Density Proximity Mapping Reveals the Subcellular Organization of mRNA-Associated Granules and Bodies. Molecular Cell 69, 517–532.e511. [DOI] [PubMed] [Google Scholar]
- Zaccara S, Ries RJ, and Jaffrey SR (2019). Reading, writing and erasing mRNA methylation. Nature Reviews Molecular Cell Biology 20, 608–624. [DOI] [PubMed] [Google Scholar]
- Zhong S, Li H, Bodi Z, Button J, Vespa L, Herzog M, and Fray RG (2008). MTA Is an Arabidopsis Messenger RNA Adenosine Methylase and Interacts with a Homolog of a SexSpecific Splicing Factor. Plant Cell 20, 1278–1288. [DOI] [PMC free article] [PubMed] [Google Scholar]
Associated Data
This section collects any data citations, data availability statements, or supplementary materials included in this article.
Supplementary Materials
(A) The YTH domain of DF1, DF2 and DF3 exhibit high sequence homology. Shown is a detailed representation of the aligned amino acid sequence for the YTH domains of DF1, DF2 and DF3. Amino acids previously described to be essential for the m6A binding based on the DF1- m6A RNA and DF2- m6A RNA crystal structures (Li et al., 2014; Xu et al., 2015) are highlighted. Pink indicates the three tryptophan residues that form the aromatic cage surrounding m6A. Green and Blue indicate amino acids that make additional points of contact between the YTH domain and the nucleotides adjacent to m6A. Of note, each YTH-DF domain shares each of these amino acids. Shown below in a yellow color code scheme is the level of conservation of every amino acid among the three YTHDF proteins with a range from 1 (low conservation) to 10 (high conservation) as predicted by the Clustal Omega alignment algorithm (Madeira et al., 2019). Most residues (88%) are fully conserved residues across all DFs paralogs as indicated by the conservation score of 10. Importantly, amino acids essential for recognizing m6A and adjacent residues in RNA are fully conserved. As indicated in Figure 1A, amino acids with a conservation score lower than 10 are located on the opposite side of the YTH domain away from the RNA-binding pocket, suggesting that they might not affect the YTH-m6A RNA interaction.
(B) DF1, DF2 and DF3 have similar binding affinity to m6A-modified mRNA. Previous studies suggest that DF1, DF2 and DF3 bind with similar affinity to m6A-modified mRNA (Patil et al., 2018; Wang et al., 2014a; Xu et al., 2015). To compare the affinities side-by-side, full length DF1, DF2 and DF3 were prepared as recombinant proteins in E. coli and the affinity to an m6A-modified RNA was measured by microscale thermophoresis (MST). Shown is the percentage of protein bound (fraction bound) at increasing concentration of the m6A-RNA. These data show that the three DFs have similar in vitro binding affinity to m6A. Data are represented as mean ± s.d. (n= 2 replicates).
(C) The previously reported (Shi et al., 2017) level of overlap of the DF1, DF2, and DF3 targets is summarized. In these previous studies, the targets of each DF paralog were first identified by PAR-CLIP (Shi et al., 2017; Wang et al., 2015; Wang et al., 2014a). Then, to determine which of these mRNAs represent valid DF-mRNA interactions, RIP (immunoprecipitation of the DF paralog, followed by reverse transcription and sequencing of the bound RNA) was performed. An overlap approach was used to identify targets of each DF paralog, and subsequently to define DF1, DF2 or DF3 unique targets or common targets. This analysis resulted in the conclusion that only a minority of mRNAs (23.98%) are bound by all DF paralogs, as shown by the pie chart. Most of the mRNAs were annotated to be either unique targets of one DF or shared by two DFs. The finding that different DF proteins bind distinct subsets of m6A-containing mRNAs in the transcriptome has been the foundation of the current model of how DFs differentially regulate different m6A mRNA cohorts (Han et al., 2019; Liu et al., 2018; Ok Hyun Park, 2019; Shi et al., 2017; Shi et al., 2019; Shi et al., 2018).
(D) Read quality analysis of the previously performed DF1, DF2 and DF3 PAR-CLIP datasets. For each PAR-CLIP dataset (Shi et al., 2017; Wang et al., 2015; Wang et al., 2014a), reads are classified based on the following quality parameters: read length (yellow, whether a read is shorter than 18 nucleotides, and thus cannot be aligned to the genome), presence of PCR duplicates (blue, duplicates category), and mappability to the genome using Bowtie and the previously reported parameters (categorized into “mappable” (green) or “fail to map” (light blue) reads). The DF3 PAR-CLIP dataset was unusual for several reasons. First, 44.11% of all reads mapped to a single site in a single gene, MT-RNR2 (see STAR Methods). These reads were identical, consistent with a PCR duplication event and were not found in the DF1 or DF2 PAR-CLIP datasets or any miCLIP datasets. Second, of the remaining reads, only a small percentage of these were mappable (indicated in green in the 10 × 10 dot plot). Overall, the DF3 PAR-CLIP dataset lacks sufficient read depth to detect endogenous DF3-binding sites in the transcriptome as efficiently as the other PAR-CLIP datasets.
(E) Schematic representation of the method used to identify m6A sites bound by one DF or shared by two or more DFs. Scatterplots are used to represent the pairwise comparison of the number of normalized DF reads calculated from the iCLIP datasets at each m6A site. Yellow areas indicate where m6A sites that uniquely bind one DF should be located. For instance, DF1-unique sites with a high level of coverage for DF1 (high number on x axis) and a low level of coverage for DF2 (low number on the y-axis) will be shown in the lower right area of the scatterplot. m6A sites bound by two or more DFs with a similar level of binding for each DF will be found in the indicated light red area.
(F) Essentially all m6A sites show highly correlated binding of DF1 and DF2 based on previous PAR-CLIP datasets (Shi et al., 2017; Wang et al., 2015; Wang et al., 2014a). As described in E, to identify m6A sites that preferentially bind DF1 or DF2, their level of binding was quantified at each m6A site in the transcriptome (Ke et al., 2017). In this experiment, we used the previously reported PAR-CLIP datasets prepared in HeLa cells (Shi et al., 2017; Wang et al., 2015; Wang et al., 2014a). According to the previous analysis (Shi et al., 2017; Wang et al., 2015; Wang et al., 2014a), nearly 50% of m6A sites should be uniquely bound by one DF. However, few if any m6A sites show evidence of disproportionate binding of one DF paralog compared to the other. Additionally, the high Pearson correlation coefficients (r) show that DF1 and DF2 have highly similar binding preferences for each m6A site in the transcriptome of HeLa cells. Similar results are shown in Figure 1C using iCLIP data for DF1, DF2 and DF3 in HEK293T cells (Linder et al., 2015; Patil et al., 2016). Thus, the binding of all m6A sites to each DF paralog is not cell-type specific, and not specific to the type of CLIP assay used (PAR-CLIP vs. iCLIP).
(G, H) DF1-unique sites show extensive levels of bound DF2, and vice versa. Previous studies show that nearly half of all m6A sites are uniquely bound by only one DF paralog (Shi et al., 2017; Wang et al., 2015; Wang et al., 2014a). To confirm whether DF1-unique mRNAs are indeed uniquely bound by DF1, we asked if there are markedly fewer DF2 PAR-CLIP reads than DF1 PAR-CLIP reads located at DF1-unique sites. For this analysis, we selected the previously described DF1-uniquely bound sites and DF2-uniquely bound sites (Shi et al., 2017; Wang et al., 2015; Wang et al., 2014a). Shown is the DF1 and DF2 PAR-CLIP coverage at DF1-unique sites (G) and at DF2-unique sites (H). For each site, PAR-CLIP DF1 or DF2 coverage is shown, with each row representing the coverage for a different unique site and its surrounding area. The rows are ordered based on the degree of DF1 PAR-CLIP coverage (G) or DF2 PAR-CLIP coverage (H). In principle, DF1-unique sites should show higher level of DF1 PAR-CLIP coverage than DF2. However, the PAR-CLIP coverage for both DF1 and DF2 appears largely identical at both DF1-unique sites and DF2-unique sites. We were unable to define the DF3 coverage level at each site given the low number of mappable reads of the DF3 PAR-CLIP dataset, as discussed in Figure S1C.
(J) DF1 and DF2 PAR-CLIP read tracks are highly similar even on transcripts thought to be DF1-unique or DF2-unique (Shi et al., 2017; Wang et al., 2015; Wang et al., 2014a). DF1-unique and DF2-unique transcripts should show unique peaks or patterns of DF1 and DF2 binding. However, we found that transcripts generally appear to show identical PAR-CLIP read coverage along the entire length of the transcript body. When inspecting different mRNAs, differences in PAR-CLIP coverage were only seen if read coverage was low and therefore susceptible to read noise. Shown is the normalized read distribution of DF1 PAR-CLIP (in blue) and DF2 PAR-CLIP (in green) on OGT, an mRNA previously thought to be a DF1-unique target, and on DUSP1, an mRNA previously thought to be a DF2-unique target. The “called” DF peaks were previously reported by Wang et al., 2015 and Wang et al., 2014 based on a statistical peak finding algorithm PARalyzerv1.1 and are presented below their respective tracks. Each row represents called peaks in a different PAR-CLIP replicate. Notably, the location of peaks and the relative heights of each peak is similar for DF1 and DF2 on both transcripts. All the peaks overlap substantially with called m6A sites in HeLa cells (Ke et al., 2017). In the original DF1, DF2, and DF3 mapping studies, the PAR-CLIP called sites were overlapped with a list of target mRNAs immunoprecipitated using the RIP protocol (Shi et al., 2017; Wang et al., 2015; Wang et al., 2014a). Compared to the total number of m6A-containing mRNAs or the total number of mRNAs containing DF1 or DF2 PAR-CLIP peaks, only a few mRNAs were successfully immunoprecipitated using this method (1747 for DF1, 1592 for DF2, 2080 for DF3). Therefore, the use of this approach makes the final list of DF-specific mRNA targets highly dependent on this low efficiency mRNA immunoprecipitation method.
(A) DF1, DF2 and DF3 exhibit generally high sequence identity and similarity in their effectordomain. In Figure S1, we examined the high sequence identity of all DFs in their YTH domain. Shown here is a schematic representation of the aligned amino acid sequence of the remaining part of the DF1, DF2 and DF3 protein. There was overall similarity along the entire length of the effector domain, with small regions where there were amino acid differences. These small differences may account for the previously described differences of DF function, which are examined in this study. Residues are classified according to the ClustalW Multiple Sequence Alignment score (Madeira et al., 2019) based on whether the residue is exactly identical among all DFs, or “strongly and weakly similar” residues (the amino acids share higher or lower level of similarity in their physicochemical properties among all DFs). Shown in the table is the overall percentage of sequence identity and similarity calculated by the pairwise sequence EMBOSS Needle aligner (Madeira et al., 2019). The pairwise comparisons of the DF amino acid sequences confirms the high sequence similarity and identity of all DFs.
(B) High-confidence interactors of each DF paralog generally show high-confidence interactionswith the other DF paralogs. As described in Figure 2B, high-confidence interactors of each DF paralog in vivo were identified previously using a Bio-ID proteomic approach (Youn et al., 2018). The top 25 interacting proteins for each DF was previously determined based on their length-normalized spectral counts and the average probability of interaction calculated across different replicates (Youn et al., 2018). The heatmap show the AvgP, average probability of interaction, for each of the top 25 interactors of DF1, DF2 and DF3. The majority of the top 25 interactors have a high average probability of interaction with all three paralogs. These proteins include the main components of the CCR4-NOT RNA-degradation complex and proteins previously identified as stress granule components. A recent study showed that all three DF proteins bind CNOT1 and all three can elicit mRNA degradation when tethered in cells to a reporter mRNA (Du et al., 2016), supporting the overall finding that the major function of the DF proteins is to mediate degradation of m6A-mRNAs. Interestingly, interaction with components, or repressor of the translation process may suggest a possible involvement of DF proteins in the translational repression of m6A mRNAs. This repression may be then interconnected to the observed DF-dependent regulation of m6A-mRNA stability. Shown at the bottom is the AvgP of interaction of each DF with the other DF paralogs.
(C) The Bio-ID DF1 interactome data (Youn et al., 2018) did not identify EIF3A and 3B as highconfidence DF1 interactors. However, in Wang et al., 2015, EIF3A and EIF3B were identified in FLAG-tagged DF1 immunoprecipitates by mass spectrometry (Wang et al., 2015). Shown is the reported score and number of unique peptides mapped to each putative DF1 interactor from Wang et al., 2015. However, even in this study, EIF3A and EIF3B are not among the top DF1 interactors when ranking all the interactors by the reported score. Moreover, as shown in red, the number of unique peptides is less than 5. This low level of interaction is consistent with the Bio-ID interactome studies presented in Figure 2B. Thus, EIF3A and EIF3B are not seen as DF1 interactors in the Bio-ID study (Youn et al., 2018) and are weak interactors in the Wang et al.,2015 study (Wang et al., 2015).
(D) Heterologous expression of DF proteins causes formation of DF stress granule-like structures. Plasmids expressing FLAG-3xHA tagged DF proteins, or a control FLAG-3xHA construct were transfected in HeLa cells and staining was performed after 24 h of transfection. Areas where the HA staining (green) overlaps with the DF staining (red) indicate the FLAG-3xHA tagged DF localization (yellow). As indicated by the arrows, the FLAG-3xHA tagged protein formed granule-like structures of different dimension in some, but not all cells. This phenomenon occurs with proteins with low-complexity domains (Alberti et al., 2019). As shown by the absence of these structures in the control-transfected cells (FLAG-3xHA), the granule-like structures are not an artifact of transfection. Thus, expressing DF proteins may lead to uninterpretable results due to the variable formation of protein aggregates that could act to sequester DF proteins and mask their function. Scale bar, 20 μm.
(A) Validation of DF1, DF2 and DF3 knockdown upon silencing of each of the DF paralogs alone or together. Western blotting was used to confirm knockdown using the indicated DF paralog-specific antibodies on each sample used to perform RNA seq and Ribosome profiling analysis. HeLa cells were transfected with the same total concentration (30 nM) of siRNA in each condition. Western blotting was performed 4 days after transfection. In each silencing condition, the siRNA sequences were specific to the DF paralog of interest, as seen by the selective knockdown seen with each siRNA. GAPDH was used as loading control.
(B) Relative quantification of DF1, DF2 and DF3 protein band intensity shown in A. Western blot chemiluminescent signal of every band was measured using ImageLab Image tools and normalized to the GAPDH loading control. Knockdown of any of the DF paralogs was associated with a compensatory increase in the expression of the other paralogs. The number of dots indicates the number of Western Blot replicates for each condition. Error bars indicate standard deviation.
(C) Reproducibility of the RNA-seq library replicates. For each silencing condition tested (DF1, DF2, DF3 and triple silencing), three independent replicates were performed. The Pearson correlation coefficient of the normalized number of mapped reads across replicates was calculated and presented in each heatmap.
(D) DF1, DF2 and DF3 RNA and protein levels in HeLa cells measured by RNA-seq and Ribo-seq. The normalized counts of reads mapped to each paralog after RNAseq (mRNA) and ribosome profiling (RPFs, ribosome protected fragments) were used as a proxy of the mRNA expression and protein expression levels, respectively. As shown by the heatmap, DF1 has mRNA levels similar to DF2. However, DF2 is the most highly translated DF paralog. This will result in a higher amount of DF2 protein in HeLa cells. Thus, at least in HeLa cells, DF2 is likely to be the most abundant DF paralog.
(E) Validation of the simultaneous knockdown of DF1 and DF2, DF1 and DF3, DF2 and DF3 four days after siRNA transfection. Cells were transfected with siRNA on Day 1 and Day 3, and then western blotted to detect levels of DF1, DF2, or DF3 on Day 4. Knockdown of two DF paralogs was associated with a modest compensatory increase in the expression of the remaining DF paralog. GAPDH was used as loading control.
(F-H) Cumulative distribution plots related to Figure 3E. In Figure 3A–D, the cumulative distribution plots were shown only for the single knockdown experiments and the triple knockdown experiment. Here we show the cumulative distribution blots for the double knockdown experiments. The abundance of each mRNA (based on RNA-seq counts) was compared between the control and the indicated double DF silenced condition. mRNAs were binned based on the number of annotated m6A sites. m6A mRNAs show higher expression levels compared to nonmethylated mRNA upon silencing any two DF paralogs. In F-H, each m6A binned group was compared to the non-methylated mRNA group using a two-tailed Mann–Whitney test. Only significant p-values are shown in each graph and the exact p-values are reported. n=3 biological replicates.
(I) Reproducibility of the RNA-seq library replicates. For each silencing condition tested (DF1-DF2,DF1-DF3, DF2-DF3), three independent replicates were performed. The Pearson correlation coefficient of the normalized number of reads across replicates was calculated and presented in each heatmap.
(J) RT-qPCR validation of the increase in stability of m6A mRNAs upon the silencing of the three paralogs. Highly methylated mRNAs (ZNF503 – 4 annotated m6A sites, SGK1 – 4 annotated m6A sites, ID3 – 7 annotated m6A sites) were selected for validation. Transcripts lacking annotated m6A sites (PP1E3C and RPS28) were chosen as controls. The stability of m6A-modified mRNAs and non-methylated mRNAs was determined by quantifying by RT-qPCR the mRNA levels immediately before (0 h), 1 h and 2 h after actinomycin D treatment. The amount of mRNA detected at each time point is shown as percentage of the total mRNA amount quantified at time 0 and normalized on the RPS28 abundance. The increase in mRNA stability is most apparent when all three DF paralogs were knocked down. (n=2 biological replicates).
(A) Unlike PABPC1, DF1 is not enriched in the polysomal fraction. DF1 has been proposed to enhance translation by facilitating loading of eIF3 to mRNA 5’UTRs. In this model, DF1 binds to an mRNA 3’UTR, and binds eIF3. This can create an mRNA loop in which the 3’UTR and 5’UTR are connected via the DF1-eIF3 complex. This is similar to other PABPC1, which also binds to mRNA 3’UTRs and binds a translation initiation factor, which results in mRNA looping. PABPC1 function in enhancing mRNA translation is evidenced by its enrichment in the sucrose fractions occupied by mRNAs containing high levels of actively translating ribosomes (polysomes). We therefore tested if DF1 is also enriched in the polysome fractions by treating HeLa cells with cycloheximide and fractionating polysomes on a sucrose gradient. The RNA fractions indicated here are related to the UV trace as shown in Figure 4A. DF1 is not enriched in these fractions based on paralog-specific western blotting (also see Figure 4A). In contrast, PABPC1 is readily detected in the actively translating ribosomal fractions. The ribosomal protein RPS6 was used to confirm the efficiency in recovering the translating ribosomes from the polysomal sucrose fractions. Thus, these data do not support a model in which DF1 enhances the translation of m6A-mRNAs by binding to highly translated mRNAs.
(B) m6A-mRNAs are downregulated upon depletion of DF1, based on ribosome profiling datasets provided in Wang et al., 2015 (Wang et al., 2015). Here, we used two “processed” datasets provided in the GEO submission for Wang et al., 2015 (GSE63591_C-Y1-Ribosome_profiling.xlsx). These datasets are referred to as processed since the number of ribosome-protected fragments, RNA-Seq data, and translational efficiency (TE) are listed for each transcript based on the authors’ calculations and analysis of their next-generation sequencing data. We used this processed data to calculate the change in translational efficiency of mRNAs upon DF1 silencing based on the number of annotated m6A sites. As can be seen, m6A-modified mRNAs show reduced translation upon DF1 knockdown. This result is essentially identical to the cumulative distribution plots presented in Wang et al., 2015. Notably, the data presented here is based on the average of two replicates provided by Wang et al., designated Replicate 1 and Replicate 2.
(C) Replicate 1 shows a more prominent reduction in m6A-mRNA translation upon depletion of DF1. The effect seen in Replicate 1 is more pronounced than the effect seen in A, which is the average of Replicate 1 and Replicate 2. Only significant p-values are shown in each graph and the exact p-values are reported.
(D) Replicate 2 shows no reduction in m6A-mRNA translation efficiency upon depletion of DF1. Surprisingly, and in contrast to Replicate 1 (shown in B), Replicate 2 does not show a drop in m6A mRNA translation efficiency upon depletion of DF1. The effect seen in A was seen since it was the average of Replicate 1 and Replicate 2, which show different effects on m6A mRNA. In B-D, each m6A group was compared to the non-methylated mRNA group using a two-tailed Mann–Whitney test. Only significant p-values are shown in each graph and the exact p-values are reported.
(E) The reanalyzed ribosome profiling datasets do not show reduced m6A-mRNA translation efficiency upon depletion of DF1. In this experiment, we accessed the original next-generation sequencing data generated by Wang et al., 2015 (GEO Accession Number GSE63591) and generated a new table of ribosome-protected fragments using a standard ribosome-profiling analysis pipeline (McGlincy and Ingolia, 2017). We referred to these reanalyzed datasets “Replicate R1” and “Replicate R2.” mRNAs were binned based on the number of annotated m6A sites. In contrast to the results presented in B, analysis of the two replicates (presented as an average) shows that m6A mRNAs do not show reduced translation efficiency upon DF1 silencing.
(F) The reanalyzed ribosome profiling sample, i.e., Replicate R1, no longer shows a link betweenm6A mRNA translation and DF1. In contrast to the original processed data presented in C, reanalysis of the underlying next-generation sequencing data from the ribosome profiling data in Wang et al., 2015, no longer shows decreased m6A-mRNA translation upon depletion of DF1.
(G) Replicate R2, like the original Replicate 2 shown in D, shows no change in m6A-mRNA translation efficiency upon depletion of DF1. In E-G, each m6A binned group was compared to the non-methylated mRNA group using a two-tailed Mann–Whitney test. Only significant p-values are shown in each graph and the exact p-values are reported.
(H) The number of ribosome-protected fragments per mRNA reported by Wang et al. for Replicate 1 only modestly correlates to the number of ribosome-protected fragments of Replicate 2. Both the control replicates, and the DF1-depleted replicates were compared. For this analysis, we used the number of ribosome-protected fragments reported for the two replicates in the GEO submission for Wang et al., 2015 (GSE63591_C-Y1-Ribosome_profiling.xlsx). These datasets are referred to as “processed” since the number of ribosome-protected fragments are listed based on the authors’ analysis of their next-generation sequencing raw data. For each tested condition (transfection with a control siRNA or with siRNAs targeting DF1), a plot showing the comparison between the number of ribosome-protected fragments calculated for Replicate1 and Replicate 2 is presented. A Pearson correlation was calculated for each comparison. To reduce the complexity of the analysis, only the ribosome-protected fragments mapped to the m6AmRNAs are presented.
(I) Upon our re-examination of the raw data reported by Wang et al., the number of ribosome-protected fragments per mRNA in Replicate 1 strongly correlates with the number of ribosome-protected fragments of Replicate 2. This analysis was performed for both the control and DF1-depleted samples. Here, we accessed the original next-generation sequencing data generated by Wang et al., 2015 (GEO Accession Number GSE63591) and generated a new table of ribosomeprotected fragments per gene using a standard ribosome-profiling analysis pipeline (McGlincy and Ingolia, 2017). We referred to these as “Reanalysis of the data from Wang et al., 2015”. As in H, a plot showing the comparison between the number of ribosome-protected fragments calculated for Replicate1 and Replicate 2 is presented for each tested condition. In contrast to H, there is high level of correlation between replicates independently from the tested condition. This result is generally seen when analyzing replicates of the same condition giving higher level of confidence in interpreting the possible effect of DF1 on the translation of m6A genes.
(J) m6A-mRNAs do not show a reduction in translation efficiency upon depletion of DF3. We asked if m6A-mRNA translation is affected upon depletion of DF3, using the ribosome profiling datasets generated by Shi et al., 2017 (Shi et al., 2017). Unlike in the DF1 knockdown dataset, the processed data provided by Shi et al., 2017 presented the ribosome-protected fragments from two replicates as a log2-fold-change relative to a single control ribosome profiling experiment. mRNAs were binned based on the number of annotated m6A sites. Here, we saw no change in translation of m6A-annotated mRNAs using the two knockdown replicates provided in Shi et al., 2017.
(A) Reproducibility of the ribosome profiling library replicates. For each silencing condition tested(DF1, DF2, DF3), three independent replicates were performed. The Pearson correlation coefficient of the normalized number of ribosome-protected fragments reads across replicates was calculated and presented in each heatmap.
(B) Validation of ribosome profiling datasets. Distribution of read length in the ribosome profilingexperiments in each tested condition (DF1, DF2 and DF3 silencing). Most of the reads are 29–30 nt in length, which reflects the expected size of the ribosome footprint when a ribosome is translating on the mRNA and the A site is occupied (McGlincy and Ingolia, 2017; Wu et al., 2019). The samples were prepared in the absence of cycloheximide as recommended in the most current ribosome profiling protocols (McGlincy and Ingolia, 2017). The percentage of P-sites assigned to the coding sequence, 3’ UTR, or the 5’ UTR is presented as a bar plot for each condition. As expected, most of the reads map to the coding region. (lower right) The position of ribosome footprints relative to the reading frame was determined for each dataset. Overall, these analyses indicate that a high fraction of the reads obtained in these datasets represent ribosome-protected fragments that reflect the position of the translating ribosomes in cells.
(C) Validation of the DF1, DF2 and DF3 knockdown. To confirm knockdown of the DF paralogs, we quantified the number of ribosome-protected fragments (RPFs) that mapped to each transcript before and after the silencing of each DF paralog. Upon the silencing, the reduction in the RPFs confirms that DF1, DF2 and DF3 are less translated, consistent with efficient knockdown. These results are consistent with the western blot validation presented in Figure S3A and S3B.
(D) Effect of DF1 depletion on the distribution of m6A-modified mRNAs (OSGIN2, CDC27 and YY1) and non-m6A-modified mRNA (RPS28) along the sucrose gradient. To independently test whether m6A-mRNAs are less translated, we performed polysome fractionation on a sucrose gradient of DF1-silenced and control siRNA-treated cytoplasmic lysates (upper graph). The level of m6A-mRNAs reported to be exhibit markedly reduced in translation upon DF1 silencing by (YY1 and OSGIN2, −5.6 log2 fold change; CDC27, −3.66 log2 fold change, Wang et al., 2015), were tested in each fraction by qPCR. The quantity of each mRNA per fraction was normalized to the amount of spike-in luciferase mRNA in each fraction and presented as percentage of the total amount measured in all fractions. As shown in the lower graphs, DF1 silencing does not affect the distribution of m6A-mRNAs along the gradient. Thus, the effect previously shown by the ribosome profiling for the top-regulated m6A-mRNAs cannot be independently validated using polysome fractionation and qPCR analysis. Data are means +/− s.e.m. (n=2)
(E) Reproducibility of the DF1, DF2, and DF3 triple knockdown ribosome profiling dataset. As shown in A, the Pearson correlation coefficient of the normalized number of ribosome-protected fragments across replicates was calculated and presented in a heatmap.
(F) Validation of the ribosome profiling dataset obtained upon depletion of DF1, DF2, and DF3. As presented in B, shown are the distribution of the ribosome profiling read lengths, the percentage of P-sites assigned to the coding sequence, 3’ UTR, and 5’ UTR, and the position of ribosome footprints relative to the reading frame. Overall, these analyses indicate that a high fraction of the reads obtained in this dataset represent ribosome-protected fragments that reflect the position of the translating ribosomes in cells.
(G) Confirmation of DF1, DF2 and DF3 knockdown in MOLM-13 cells. Western Blot was performed after 5 days from the shRNA transduction. GAPDH was used as loading control.
Table S1. The number of annotated m6A sites per gene in HeLa cells. Related to Figure 3–4, S1, S3 and S4
Table S2. Reanalysis of the ribosome profiling performed upon DF1 silencing by Wang et al., 2015. Results related to Replicate 1 are presented. Related to Figure 4 and Figure S4F
Table S3. Reanalysis of the ribosome profiling performed upon DF1 silencing by Wang et al., 2015. Results related to Replicate 2 are presented. Related to Figure 4 and Figure S4G
Data Availability Statement
All datasets generated during this study have been deposited to the NCBI Gene Expression Omnibus under accession number GEO: GSE134380. https://www.ncbi.nlm.nih.gov/geo/query/acc.cgi?acc=GSE134380 (Enter token grmjgaagnjwbfsr into the box)
The code used to analyze the ribosome profiling datasets in this study is available at DOI: 10.17632/nsz68ywvvx.1 (https://data.mendeley.com/datasets/nsz68ywvvx/draft?a=64827451c659-483f-9909-25237e946420)