

Abstract
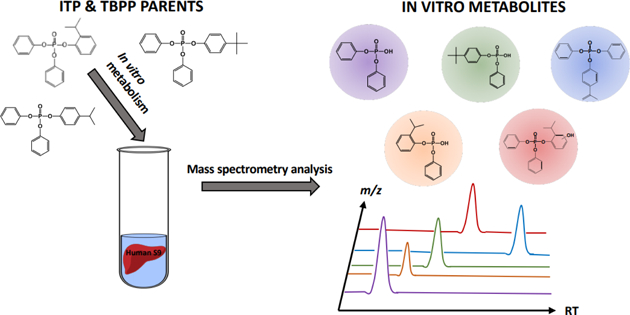
Isopropylated and tert-butylated triarylphosphate esters (ITPs and TBPPs) are plasticizers and flame retardants that are ubiquitous in indoor environments; however, no studies to date have characterized their metabolism. Using human liver subcellular S9 fractions, phase I and II in vitro metabolism of triphenyl phosphate (TPHP), 4-tert-butylphenyl diphenyl phosphate (4tBPDPP), 2-isopropylphenyl diphenyl phosphate (2IPPDPP), and 4-isopropylphenyl diphenyl phosphate (4IPPDPP) was investigated at 1 and 10 μM doses. Parent depletion and the formation of known or suspected metabolites (e.g. likely hydrolysis or hydroxylated products), including diphenyl phosphate (DPHP), hydroxyl-triphenyl phosphate (OH-TPHP), isopropylphenyl phenyl phosphate (ip-PPP), and tert-butylphenyl phenyl phosphate (tb-PPP), were monitored and quantified via GC/MS or LC/MS/MS. Tb-PPP and its conjugates were identified as the major in vitro metabolites of 4tBPDPP and accounted for 71 and 49% of the parent molecule that was metabolized during the incubation, respectively. While the mass balance between parents and metabolites was conserved for TPHP and 4tBPDPP, approximately 20% of the initial parent mass was unaccounted for after quantifying suspected metabolites of 2IPPDPP and 4IPPDPP that had authentic standards available. Two novel ITP metabolites, mono-isopropenylphenyl diphenyl phosphate and hydroxy-isopropylphenyl diphenyl phosphate, were tentatively identified by high-resolution mass spectrometry and screened for in recently collected human urine where mono-isopropenylphenyl diphenyl phosphate was detected in 1 of 9 samples analyzed. This study provides insight into the biological fate of ITP and TBPP isomers in human tissues and is useful in identifying appropriate biomarkers of exposure to monitor, particularly in support of epidemiological studies.
Graphical Abstract
Introduction
Isopropylated and tert-butylated triarylphosphate esters (ITPs & TBPPs) are used as flame retardants and plasticizers in a variety of materials ranging from residential furnishings and electronics to hydraulic fluids.1 As flame retardants, these chemicals have been increasingly used as pentaBDE substitutes in polyurethane foam following the phase-out of PBDEs in the early 2000s.2 Several currently-used commercial flame retardant mixtures contain several ITP and TBPP isomers as major components in their formulations, including Firemaster® 550 (34% ITPs), Firemaster® 600 (51% TBPPs), an ITP mixture (52% ITPs), and a TBPP mixture (at least 56% TBPPs).3
Since their relatively recent identification as flame retardants, numerous studies have highlighted the potential toxicity of the ITP and TBPP isomers. For instance, ITP and TBPP mixtures have been shown to cause long-term impairment of anxiety-related behavior in adult zebrafish following low level (0.03 μM) exposure during development.4 Developmental exposure to these mixtures (10–100 μM) has been demonstrated to cause bradycardia, atrial failure, and abnormalities in cardiac looping in zebrafish embryos.5,6 The ITP mixture is known to bind and activate the human nuclear receptor PPARγ, suggesting exposure could increase lipid accumulation and promote adipogenesis at relatively low concentrations (10 μM).7–9 Furthermore, epidemiological studies have associated ITP exposure with adverse health and behavioral outcomes using isopropylphenyl phenyl phosphate (ip-PPP), a urinary metabolite of ITP isomers, as an exposure biomarker. Higher maternal urinary concentrations of ip-PPP have been associated with impaired fine motor and language skills and lower scores on cognitive assessments in a cohort of young children.10 Additionally, increasing urinary ip-PPP concentration has been associated with reduced fertility measures and pregnancy outcomes in women undergoing in vitro fertilization, as well as sex-dependent changes in gestational age.11,12
Because recent assessments have indicated that ITP and TBPP isomers are potentially disruptive to normal growth and development, endocrine function, and reproductive health, it is important to monitor exposure levels in the human population. Multiple studies have reported on the widespread occurrence of ITPs and TBPPs in biological and environmental samples, indicating likelihood for human exposure.13–16 While a few studies have reported on the metabolism of triphenyl phosphate (TPHP), relatively little is known about the metabolism of ITPs and TBPPs. An in vivo study using Wistar rats confirmed ip-PPP as a urinary metabolite of ITPs in 2016, however metabolism kinetics were not included in its scope.17 Interestingly, urinary diphenyl phosphate (DPHP) and ip-PPP concentrations were not reflective of the parent TPHP and ITP composition in the dosing mixture, suggesting that ITPs might be metabolized to both DPHP and ip-PPP. Similarly, a human exposure study using silicone wristbands found that ITP concentrations on the bands correlated with urinary DPHP but not urinary ip-PPP levels.18 Human biomonitoring studies commonly rely on ip-PPP as a biomarker of exposure for ITPs, tb-PPP as a biomarker of exposure for TBPPs, and DPHP as a biomarker for TPHP (Table 1).19,13 However, DPHP is likely also a metabolite of ITP and TBPP isomers, in addition to TPHP and 2-ethylhexyl diphenyl phosphate (EHDPHP), complicating its utility as a biomarker of exposure for a single parent compound.20–23 To fill data gaps regarding the fate of ITPs and TBPPs in the human body and to develop reliable biomarkers for these compounds, metabolism studies focusing on ITPs and TBPPs are needed.
Table 1.
Structures of Parent Aryl Organophosphate Esters and Metabolites Used in Human Biomonitoring Studies
| ITP or TBPP isomer | Structure of Parent | Metabolites used in Biomonitoring | Structures of Known Metabolites |
|---|---|---|---|
| TPHP | 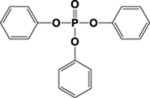 |
DPHP & OH-TPHP | |
| EHDPHP | 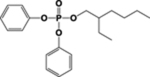 |
DPHP, EHMPP, & OH-EHMPP | 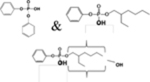 |
| 4tBPDPP | 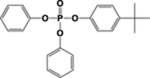 |
DPHP & tp-PPP | |
| 2IPPDPP | 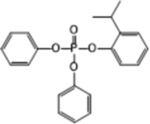 |
DPHP & ip-PPP | 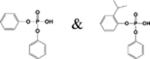 |
| 4IPPDPP | 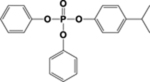 |
DPHP & ip-PPP | 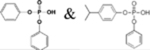 |
Due to the similarities in their chemical structures, ITP and TBPP metabolism experiments can be informed by the metabolism of TPHP, a compound with a well-characterized metabolite profile. TPHP has been shown to form DPHP, hydroxyl-triphenyl phosphate (OH-TPHP), di-hydroxy-triphenyl phosphate (di-OH-TPHP), hydroxyl-diphenyl phosphate (OH-DPHP), and glucuronidated and sulfated conjugates of OH-TPHP and di-OH-TPHP during in vitro metabolism studies.24–26 A recent study demonstrated that CYP1A2 and CYP2E1 are the major cytochrome P450 (CYP) isoforms involved in the phase I formation of DPHP from TPHP.27 Another study showed that the OH-TPHP glucuronide conjugates are the primary in vitro metabolites of TPHP (accounting for 65% on the initial TPHP treatment), which highlights the importance of phase II metabolic processes in the biological fate of this compound.24
Much like TPHP, we hypothesize that ITP and TBPPs will undergo both hydrolysis and hydroxylation/conjugation during hepatic metabolism. The predicted metabolism of 4-isopropylphenyl diphenyl phosphate (4IPPDPP), a representative ITP isomer, is shown in Figure S1. Because there is an inverse correlation between the pKa of the subsequent alcohol formed from the ester hydrolysis of the organophosphate and the hydrolysis rate, the cleavage of a phenol group is more likely to occur in abiotic hydrolysis reactions than is the cleavage of an alkylated phenol group (Figure S2).28 While potential differences between outcomes of abiotic and biotic hydrolysis may exist, this trend was supported by recent observations of the hydrolysis of 16 organophosphate triesters in aqueous solution.29 Thus, we predict that ip-PPP and tb-PPP will be formed more prevalently in comparison to DPHP as metabolites of ITPs and TBPPs. However, a substrate’s affinity for a particular enzyme active site is difficult to anticipate and should be noted as an important caveat of this prediction.
The current study sought to identify and quantify the in vitro metabolites and kinetics of 4-tert-butylphenyl diphenyl phosphate (4tBPDPP; a TBPP isomer), 2-isopropylphenyl diphenyl phosphate (2IPPDPP; an ITP isomer), and 4-isopropylphenyl diphenyl phosphate (4IPPDPP; an ITP isomer) metabolism using human liver S9 fractions. Isomers were assessed individually for the formation of phase I and phase II metabolites, and DPHP, OH-TPHP, ip-PPP, and tb-PPP levels were assessed quantitatively following metabolism incubations. Recently collected human urine samples (n=9) were also screened for the presence of ITP and TBPP metabolites.
Experimental Procedures
Materials
Triphenyl phosphate (TPHP, 99% pure), diphenyl phosphate (DPHP, 99% pure), uridine 5’-diphosphoglucuronic acid trisodium salt (UDPGA, 98% pure), glutathione (GSH), adenosine 3’-phosphate 5’-phosphosulfate lithium salt hydrate (PAPS), alamethicin, glucose-6-phosphate dehydrogenase (G-6-P-DH, 100 units/mg protein), sodium citrate, magnesium chloride, β-glucuronidase (from Patella vulgata), and sulfatase (from Helix pomatia) were purchased from Sigma Aldrich (St. Louis, MO). Authentic standards of 2-isopropylphenyl diphenyl phosphate (2IPPDPP, 98% pure), 4-isopropylphenyl diphenyl phosphate (4IPPDPP, 98% pure), and 13C-triphenyl phosphate (13C18-TPHP, 99% pure) were purchased from Wellington Laboratories (Guelph, Ontario). An authentic standard of 4-tert-butylphenyl diphenyl phosphate (4tBPDPP) was purchased from Toronto Research Chemicals (Toronto, Ontario). Isopropylated phenyl phenyl phosphate (ip-PPP), deuterated isopropylated phenyl phenyl phosphate (d16-ip-PPP), tert-butylated phenyl phenylphosphate (tb-PPP), and hydroxy-triphenyl phosphate (OH-TPHP) were synthesized by the Duke Small Molecule Laboratory (Durham, NC). Deuterated diphenyl phosphate (d10-DPHP) was synthesized by the Max Planck Institute for Biophysical Chemistry (Goettingen, Germany). NADP monosodium salt and glucose-6-phosphate (G-6-P) were purchased from Fisher Scientific (Waltham, MA). StrataX-AW (60 mg, 3 mL) solid phase extraction (SPE) cartridges were purchased from Phenomenex (Torrance, CA). Pooled human liver S9 fractions (mixed gender, pool of 50 individuals) were purchased from Sekisui XenoTech, LLC (Kansas City, KS). Concentrated TRIS buffer (1M) was obtained from VWR International (Radnor, PA).
Kinetic Biotransformation Assay
Kinetic experiments were carried out for TPHP, 4tBPPDPP, 2IPPDPP, and 4IPPDPP to determine depletion rates. These samples were subjected to the in vitro biotransformation assay described below and reactions were stopped by the addition of ice-cold acetonitrile at various time points (0, 15, 30, 45, 60, and 75 minutes).
In Vitro Biotransformation Assay
Methods were modeled after Van den Eede et al. 2011 and a scheme illustrating the workflow can be found in Figure S3. To explore the formation of phase I and phase II metabolites of TPHP, 4tBPDPP, 2IPPDPP, and 4IPPDPP, a reaction mixture containing 50 mM TRIS buffer (pH adjusted to 7.4 at 37°C), human liver S9 fraction (1 mg/mL, final protein concentration), and TPHP, 4tBPDPP, 2IPPDPP, or 4IPPDPP (tested at both 1 and 10 μM, final concentration) in a total volume of 1 mL were pre-incubated in a shaking water bath at 37°C. Target chemical concentrations were chosen for comparison with previous in vitro studies and two doses were included to investigate potential dose-related differences in metabolism.24 The following co-factors were also added individually: UDPGA, GSH (2 mM, final concentration) and PAPS (0.1 mM, final concentration). To increase membrane porosity and facilitate the diffusion of the substrate to the membrane-bound UGTs, alamethicin (50 μg/mL, final concentration) was also added to the reaction mixture (Fisher et al., 2000). The reaction was initiated by the addition of an NADPH regeneration system (1.3 mM NADP, final concentration). Reactions were stopped by the addition of 1 mL of ice-cold acetonitrile and storing tubes on ice. Internal standards (50 μL of 1.0 μg/mL 13C18-TPHP, d16-ip-PPP, and d10-DPHP) were also added at this time. Several controls were included and are described in more detail in the QA/QC section.
Deconjugation Assay
To deconjugate phase II metabolites and thereby allow for the targeted quantification of known metabolites, a subset of reaction mixtures from the in vitro biotransformation assay were subjected to a subsequent deconjugation assay.30 Following heat-inactivation of the S9 fractions, reaction mixtures were incubated overnight at 37°C in a 1 M sodium acetate buffer solution containing one of three enzyme treatments: 1) β-glucuronidase (1000 units/mL); 2) sulfatase (33 units/mL); 3) β-glucuronidase (1000 units/mL) and sulfatase (33 units/mL). Reactions were quenched by adding an equal volume of ice-cold acetonitrile and internal standards.
In Vitro Reaction Mixture Extraction and Clean-up
Following incubations, reaction mixtures were split into two equal fractions. One fraction was processed via liquid-liquid extraction and analyzed for the depletion of parent compounds. A 1:1 mixture of dicholormethane:hexane was added to the reaction mixture and centrifuged at 2,500 rpm for 10 minutes. The supernatant was transferred to a clean test tube, and the process was repeated two more times until a ~30 mL extract was collected. The extract was concentrated to ~1 mL under a gentle stream of nitrogen and transferred to an autosampler vial prior to analyte quantification. The other fraction was processed via mixed-mode anion-exchange solid phase extraction and analyzed for the formation of metabolites.21 Briefly, the reaction mixture was acidified with formic acid to pH <6.5 and diluted 1:1 with water. Extracts were cleaned using StrataX-AW SPE columns and eluted using 2 mL of 5% triethylamine in acetonitrile (v/v). Eluents were blown down to dryness under a gentle stream of nitrogen, and then reconstituted in 1:1 methanol:water prior to metabolite quantification.
Urine Collection and Extraction
Nine recently collected human urine samples were screened for the presence of metabolites identified in vitro using high-resolution mass spectrometry. Urine samples were collected from children in our TESIE cohort, which is described in detail in Hoffman et al., 2018.19 Samples were pooled (n=3 urine samples collected from 1 individual over 48 hours) urine aliquots collected from children aged 3–6 in North Carolina during 2014–2016. Urine samples (5 mL aliquots) were processed using the liquid-liquid extraction workflow described above. Another 5-mL aliquot of each urine sample was extracted and cleaned using previously described SPE methods. Both of these methods were scaled up to accommodate a larger sample volume but were otherwise identical to the methods used for the extraction and cleaning of the two in vitro reaction mixture fractions.
Targeted Mass Spectrometry Analysis of Known Metabolites
Parent compounds (TPHP, 4tBPDPP, 2IPPDPP, and 4IPPDPP) were quantified using GC/EI-MS and previously described methods.3,31 Known metabolites (DPHP, ip-PPP, tb-PPP, and OH-TPHP) were quantified using previously published LC/MS/MS methods.21,30 Additional GC and LC parameters are described in more detail in the Supporting Information. As internal standards, 13C18-TPHP was used for the quantification of TPHP, OH-TPHP, 2IPPDPP, 4IPPDPP, and 4tBPDPP, d16-ip-PPP was used for the quantification of ip-PPP and tb-PPP, and d10-DPHP was used for the quantification of DPHP. All sample values were blank corrected using the average blank level, and method detection limits (MDLs) were determined using three times the standard deviation of the average lab blanks. Mass balances between parent compounds and identified metabolites were assessed for each compound.
Tentative Metabolite Identification by High Resolution Mass Spectrometry
If a mass balance between parent compound and metabolites was not achieved, the missing amount was explored qualitatively using high-resolution mass spectrometry. A limited list of suspect metabolites was compiled from a priori knowledge of TPHP and tricresyl phosphate metabolism (Table S1). Suspect metabolite screening was conducted on a Q Exactive GC hybrid quadrupole-Orbitrap GC-MS/MS system (Thermo Scientific™). The QE-GC has a maximum scan range of 30 to 3000 m/z, is capable mass resolution up to 100,000 (m/z 272), and mass accuracy below 1 ppm (internal calibration). For this analysis, the QE-GC was operated in full scan Electron Ionization (EI) mode with a scan range 35 to 750 m/z, an automatic gain control (AGC) of 1e6, a maximum IT of 200 ms, and a mass resolution of 60,000 (m/z 200). Prior to analysis of samples, the QE-GC was tuned and calibrated to ensure maximum mass accuracy (0.22 ppm for sample run). The tune was examined after samples had run to ensure no significant sensitivity loss had occurred. Suspect exact mass ions (monotopic exact masses can be found in Table S1) were manually searched using Thermo Xcalibur Qual Browser software to produce tentative positive identifications. More information regarding the QE-GC operation parameters can be found in the Supporting Information. Suspect metabolite screening was also conducted via high performance liquid chromatography (HPLC; Thermo Scientific) coupled to a high-resolution mass spectrometer (HRMS; Thermo Scientific Orbitrap Fusion Lumos with positive and negative polarity electrospray ionization (ESI)). A 1 mL aliquot of each sample was prepared for HPLC-HRMS analysis with 10 μL of sample being injected onto a Luna C18(2)-HST column (50 × 2 mm, 2.5 um particle size, Phenomenex). MS1 data acquisition consisted of concurrent full scan (120–1500 m/z), high resolution (R = 240,000), accurate mass (<1 ppm in positive mode and <1.5 ppm in negative mode) spectra and data-dependent orbitrap tandem high-energy collisional dissociation mass spectra (OTMS2 HCD, R = 15,000). Data were screened for the presence of putative ITP metabolites in Freestyle 1.4 (Thermo Scientific) using exact mass and formula matches. More information regarding the LC-Orbitrap Fusion Lumos operation parameters can be found in the Supporting Information.
QA/QC
TPHP was included as a positive control because in vitro formation of its metabolites has been described in the past.21,24,26 All in vitro biotransformation reactions were run in triplicate, and kinetic samples were run in duplicate. Reactions containing heat-inactivated S9 fractions and abiotic controls (no S9 fractions) were included to account and correct for non-enzymatic hydrolysis and abiotic transformation. Blank samples were prepared with S9s and cofactors, but no substrate and samples were blank corrected (Table S2). Substrate spikes that were not subjected to the biotransformation assay were also included to determine initial parent concentrations. Spike recovery tests of the liquid-liquid extraction workflow were performed for each parent compound. Recoveries were measured as follows: 96.0 ± 1.5% for TPHP, 72.9 ± 9.3% for 4tBPDPP, 100.0 ± 8.9% for 2IPPDPP, and 85.9 ± 8.1% for 4IPPDPP. A spike recovery test was also performed for high and low OH-TPHP levels (100 and 1000 ng) using the SPE clean-up method. Recovery of OH-THPP was 75.2 ± 5.0% for the low spike and 79.3 ± 0.6% for the high spike. The measured m/z value of metabolites tentatively identified using high-resolution mass spectrometry was within 2 ppm of simulated exact mass values for identity confirmation.
Statistical Analyses
All statistical analyses were performed using GraphPad Prism statistical software (version 7.04; GraphPad Software, La Jolla, CA). Statistical significance was set to α = 0.05. All samples were blank corrected prior to statistical analysis. Values that were less than the method detection limit (MDL) were replaced with MDL/2.32 MDL values were calculated using three times the standard deviation of the average lab blank normalized to the reaction volume. Analysis of kinetic data was performed using linear regression, and 95% confidence intervals for the slope line of best fit were generated. Data were fit to both zero-order and first-order models, and R2 values were used to describe the fit of the model. If slopes were found to be significantly different among each dose, individual slopes were compared by one-way ANOVA. For the in vitro biotransformation assay results, one-way ANOVA was used to assess differences in the total mass balance and individual analyte levels across treatment groups (i.e. unprocessed spike, +S9, +heat-inactivated S9, etc.). ANOVA post hoc analysis was performed using Dunnett’s multiple comparison test. Percent depletion was calculated using Equation 1:
| (Eq. 1) |
Results
Kinetic Biotransformation Assay
Following incubation with human liver S9 fractions (0–75 min), in vitro depletion rates for TPHP, 4tBPDPP, 2IPPDPP, and 4IPPDPP were determined at both a 1 and 10 μM dose. Depletion rates were calculated by linear regression assuming both zero-order and first-order kinetics and are shown in Figure 1 and Table 2. For most compounds, a zero-order kinetic model fit the data better than a first-order kinetic model. Depletion rates were generally higher at the 10 μM dose compared to the 1 μM dose. At the 1 μM dose, 2IPPDPP had the slowest depletion rate of all chemicals tested. However, at the 10 μM dose, TPHP had the slowest depletion rate of all of the chemicals tested as modeled by zero-order kinetics.
Figure 1.
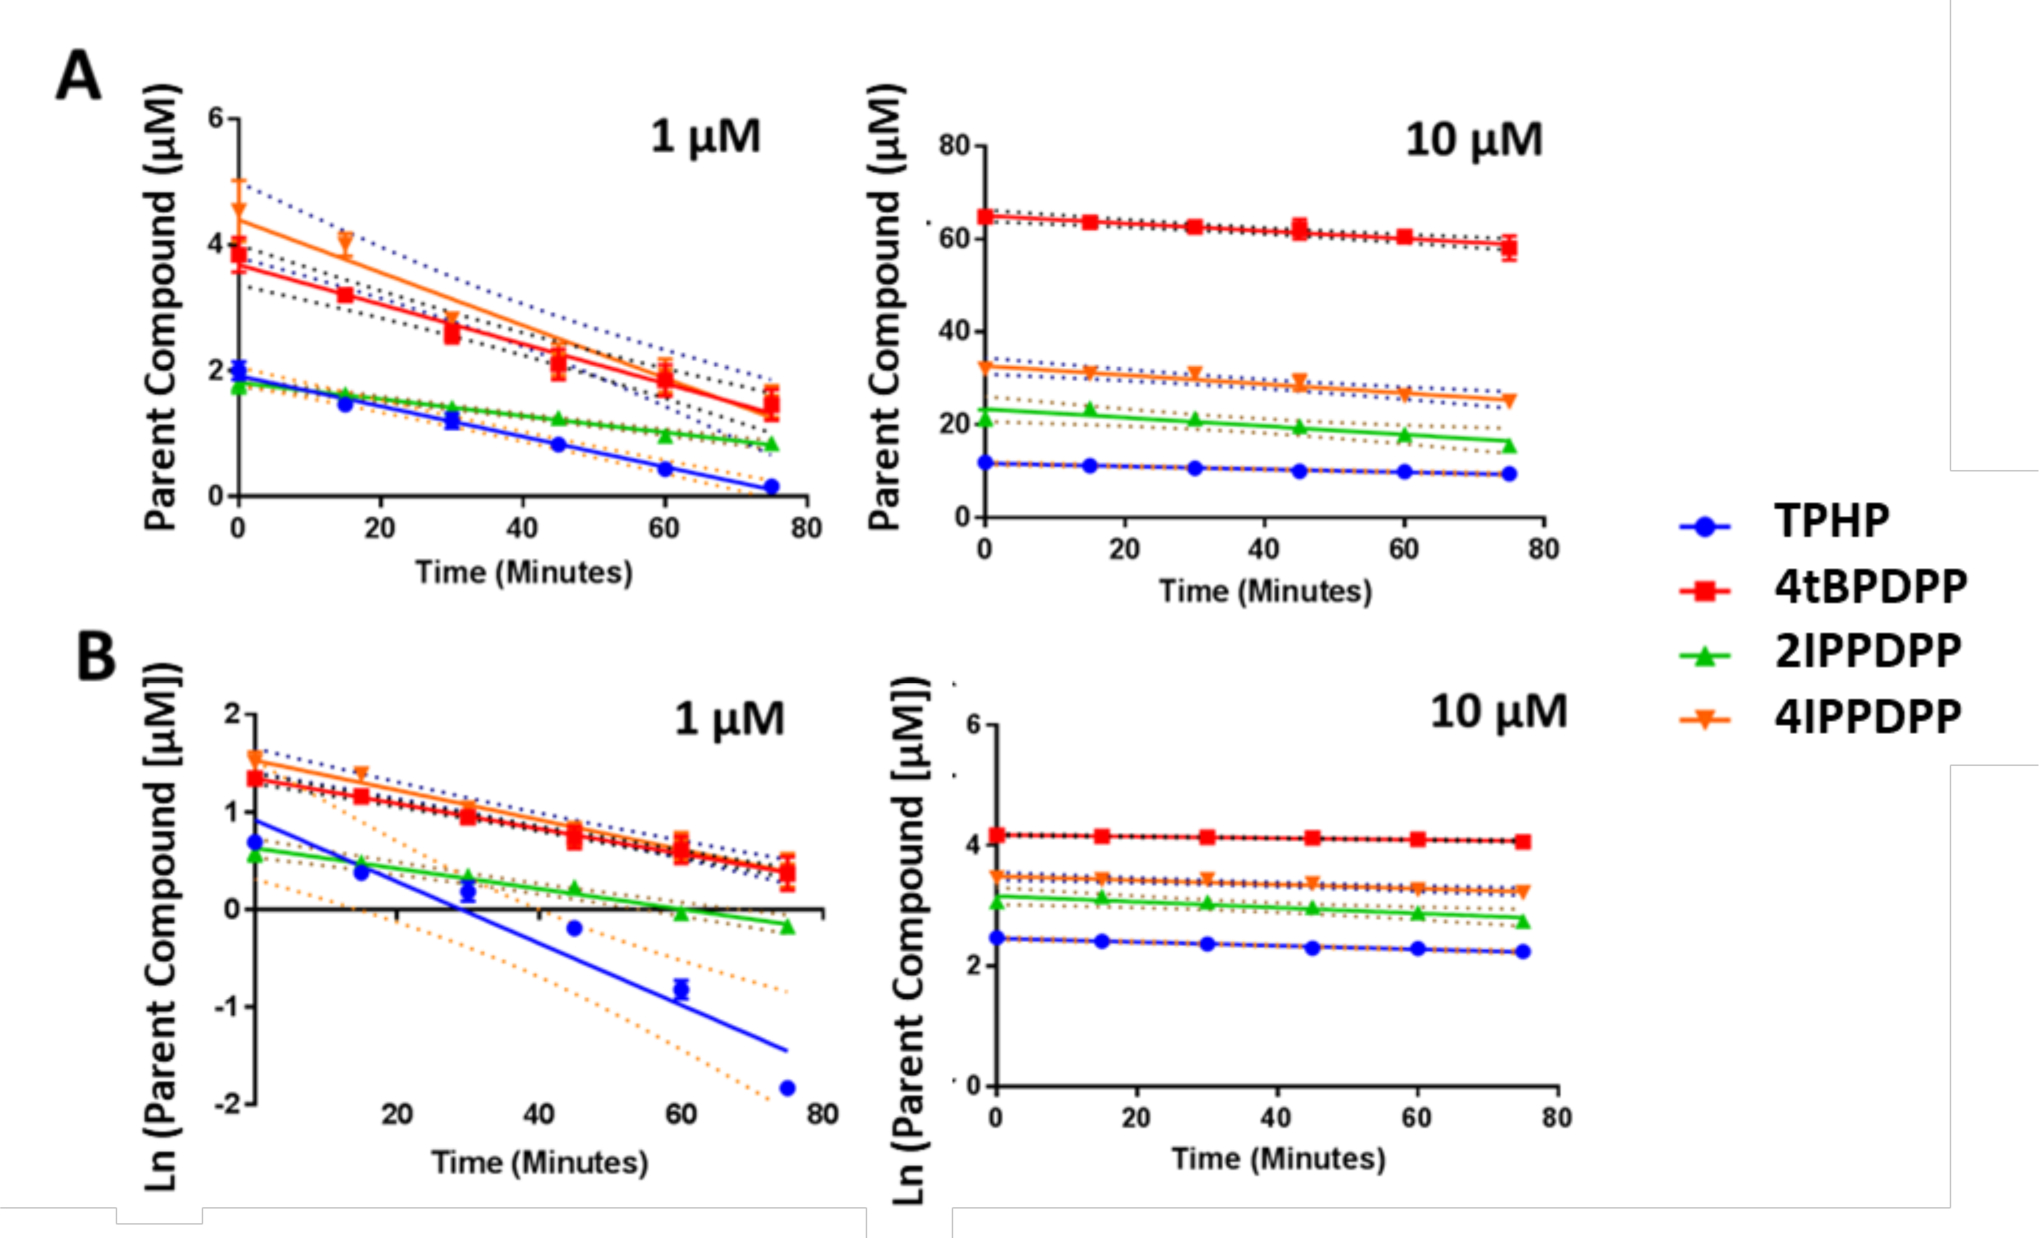
Depletion rates are calculated in kinetic experiments for each compound. A: Assuming zero-order kinetics; B: Assuming first-order kinetics. Means (n=2) are plotted for each analyte and bars depict standard error. Slope lines of best fit are plotted and were calculated using linear regression; 95% confidence intervals for the best-fit lines are also shown by dashed lines. Numerical depletion rates are found in Table 2.
Table 2.
Depletion Rates for Kinetic Biotransformation Assays; A: Zero-order Kinetics; B: First-order Kinetics
| Compound | Dose | Slope (nmol/min/mg protein) | 95% Confidence Interval | R2 |
|---|---|---|---|---|
| TPHP | 1 μM | −0.024 | (−0.029, −0.021) | 0.99 |
| 4tBPDPP | 1 μM | −0.031 | (−0.38, −0.024) | 0.97 |
| 2IPPDPP | 1 μM | −0.013* | (−0.015, −0.012) | 0.99 |
| 4IPPDPP | 1 μM | −0.042 | (−0.055, −0.029) | 0.95 |
| TPHP | 10 μM | −0.032 | (−0.041, −0.023) | 0.95 |
| 4tBPDPP | 10 μM | −0.082 | (−0.11, −0.055) | 0.95 |
| 2IPPDPP | 10 μM | −0.092 | (−0.15, −0.032) | 0.92 |
| 4IPPDPP | 10 μM | −0.097 | (−0.14, −0.059) | 0.92 |
| Compound | Dose | Slope (ln[nmol]/min/mg protein) | 95% Confidence Interval | R2 |
| TPHP | 1 μM | −0.032* | (−0.045, −0.018) | 0.91 |
| 4tBPDPP | 1 μM | −0.013 | (−0.014, −0.012) | 0.99 |
| 2IPPDPP | 1 μM | −0.010 | (−0.013, −0.0083) | 0.98 |
| 4IPPDPP | 1 μM | −0.015 | (−0.017, −0.013) | 0.98 |
| TPHP | 10 μM | −0.0030 | (−0.0038, −0.0022) | 0.97 |
| 4tBPDPP | 10 μM | −0.0013 | (−0.0018, −0.0009) | 0.94 |
| 2IPPDPP | 10 μM | −0.0048 | (−0.0079, −0.0017) | 0.82 |
| 4IPPDPP | 10 μM | −0.0034 | (−0.0049, −0.0020) | 0.92 |
Represents statistically significant difference from other slopes in 1 μM dose (p < 0.05)
In Vitro Biotransformation & Deconjugation Assay
TPHP, 4tBPDPP, 2IPPDPP, and 4IPPDPP were individually subjected to an in vitro biotransformation assay and subsequent deconjugation incubation to determine the relative proportions of phase I and phase II metabolites. Compounds were tested at 1 and 10 μM and known metabolites (DPHP, OH-TPHP, ip-PPP, and tb-PPP) were quantified with authentic standards via LC/MS/MS.
Triphenyl phosphate (TPHP)
The major metabolites of TPHP were DPHP, OH-TPHP and OH-TPHP conjugates (Table 3). No significant difference in the total molar mass (i.e. summed molar mass of parents and quantified metabolites) was observed between the unprocessed spike and either the heat-inactivated control or the abiotic control (ANOVA; p > 0.05) (Figure 2). Although DPHP was detected at low levels in both the heat-inactivated control and the abiotic control, suggesting abiotic hydrolysis did occur, the majority of metabolite formation appeared to be enzyme-mediated. The mass of TPHP was 69–77% and 32–37% lower in the +S9 treatment compared to the unprocessed spike at the 1 μM and 10 μM, respectively, indicating that metabolic transformation occurred. In comparison, 5–6% of the initial TPHP was depleted in the abiotic control group, indicating that only a small percentage of the TPHP depletion observed in the +S9 treatment group is due to abiotic hydrolysis. The total molar mass accounted for in the two groups treated with deconjugation enzymes was significantly higher than the +S9 treatment group, but not significantly different from the unprocessed spike (ANOVA; p > 0.05) (Figure 2). This implies that the amount missing from the +S9 treatment was comprised of conjugated metabolites. There was a significant 2- to 4-fold increase in OH-TPHP, but not DPHP, in the groups treated with deconjugation enzymes compared to the +S9 group at both doses (ANOVA; p < 0.001), suggesting that OH-TPHP conjugates are formed during in vitro TPHP metabolism. Overall, these results were consistent with previous in vitro metabolism studies of TPHP, validating the use of our biotransformation assays for other compounds.24,33
Table 3.
In Vitro Biotransformation of TPHP Following Incubation with Human Liver S9 Fractions.
| Dose | Treatment | Percentage of Initial Parent Administration (Mean ± Std Dev) | % Depletion | ||||
|---|---|---|---|---|---|---|---|
| TPHP | DPHP | OH-TPHP | Total | ||||
| TPHP | 1 μM | unprocessed spike | 100 ± 5% | N.D. | N.D | 100 ± 5% | -- |
| Abiotic Control | 94 ± 7% | 6.2 ± 1.7% | N.D | 96 ± 4% | 6% | ||
| Heat-inactivated s9 | 88 ± 2% | 6.2 ± 0.5% | N.D | 98 ± 5% | 12% | ||
| s9 | 31 ± 2% | 33 ± 3% | 9.1 ± 5.7% | 73 ± 7% | 69% | ||
| s9 & sulfatase | 23 ± 1% | 37 ± 0.5% | 29 ± 2% | 89 ± 4% | 77% | ||
| s9& glucuronidase | 31 ± 3% | 37 ± 5% | 21 ± 3% | 90 ± 9% | 69% | ||
| 10 μM | unprocessed spike | 100 ± 1% | N.D. | N.D | 100 ± 1% | -- | |
| Abiotic Control | 95 ± 1% | 5.3 ± 0.3% | N.D | 101 ± 3% | 5% | ||
| Heat-inactivated s9 | 94 ± 1% | 5.3 ± 0.2% | N.D. | 101 ± 1% | 6% | ||
| s9 | 68 ± 1% | 9.4± 0.2% | 7.9 ± 0.5% | 85 ± 0.2% | 32% | ||
| s9 & sulfatase | 63 ± 0.2% | 8.3 ± 0.6% | 30 ± 1% | 101 ± 2% | 37% | ||
| s9& glucuronidase | 67 ± 1% | 9.2 ± 0.8% | 25 ± 2% | 102 ± 2% | 33% | ||
Figure 2.
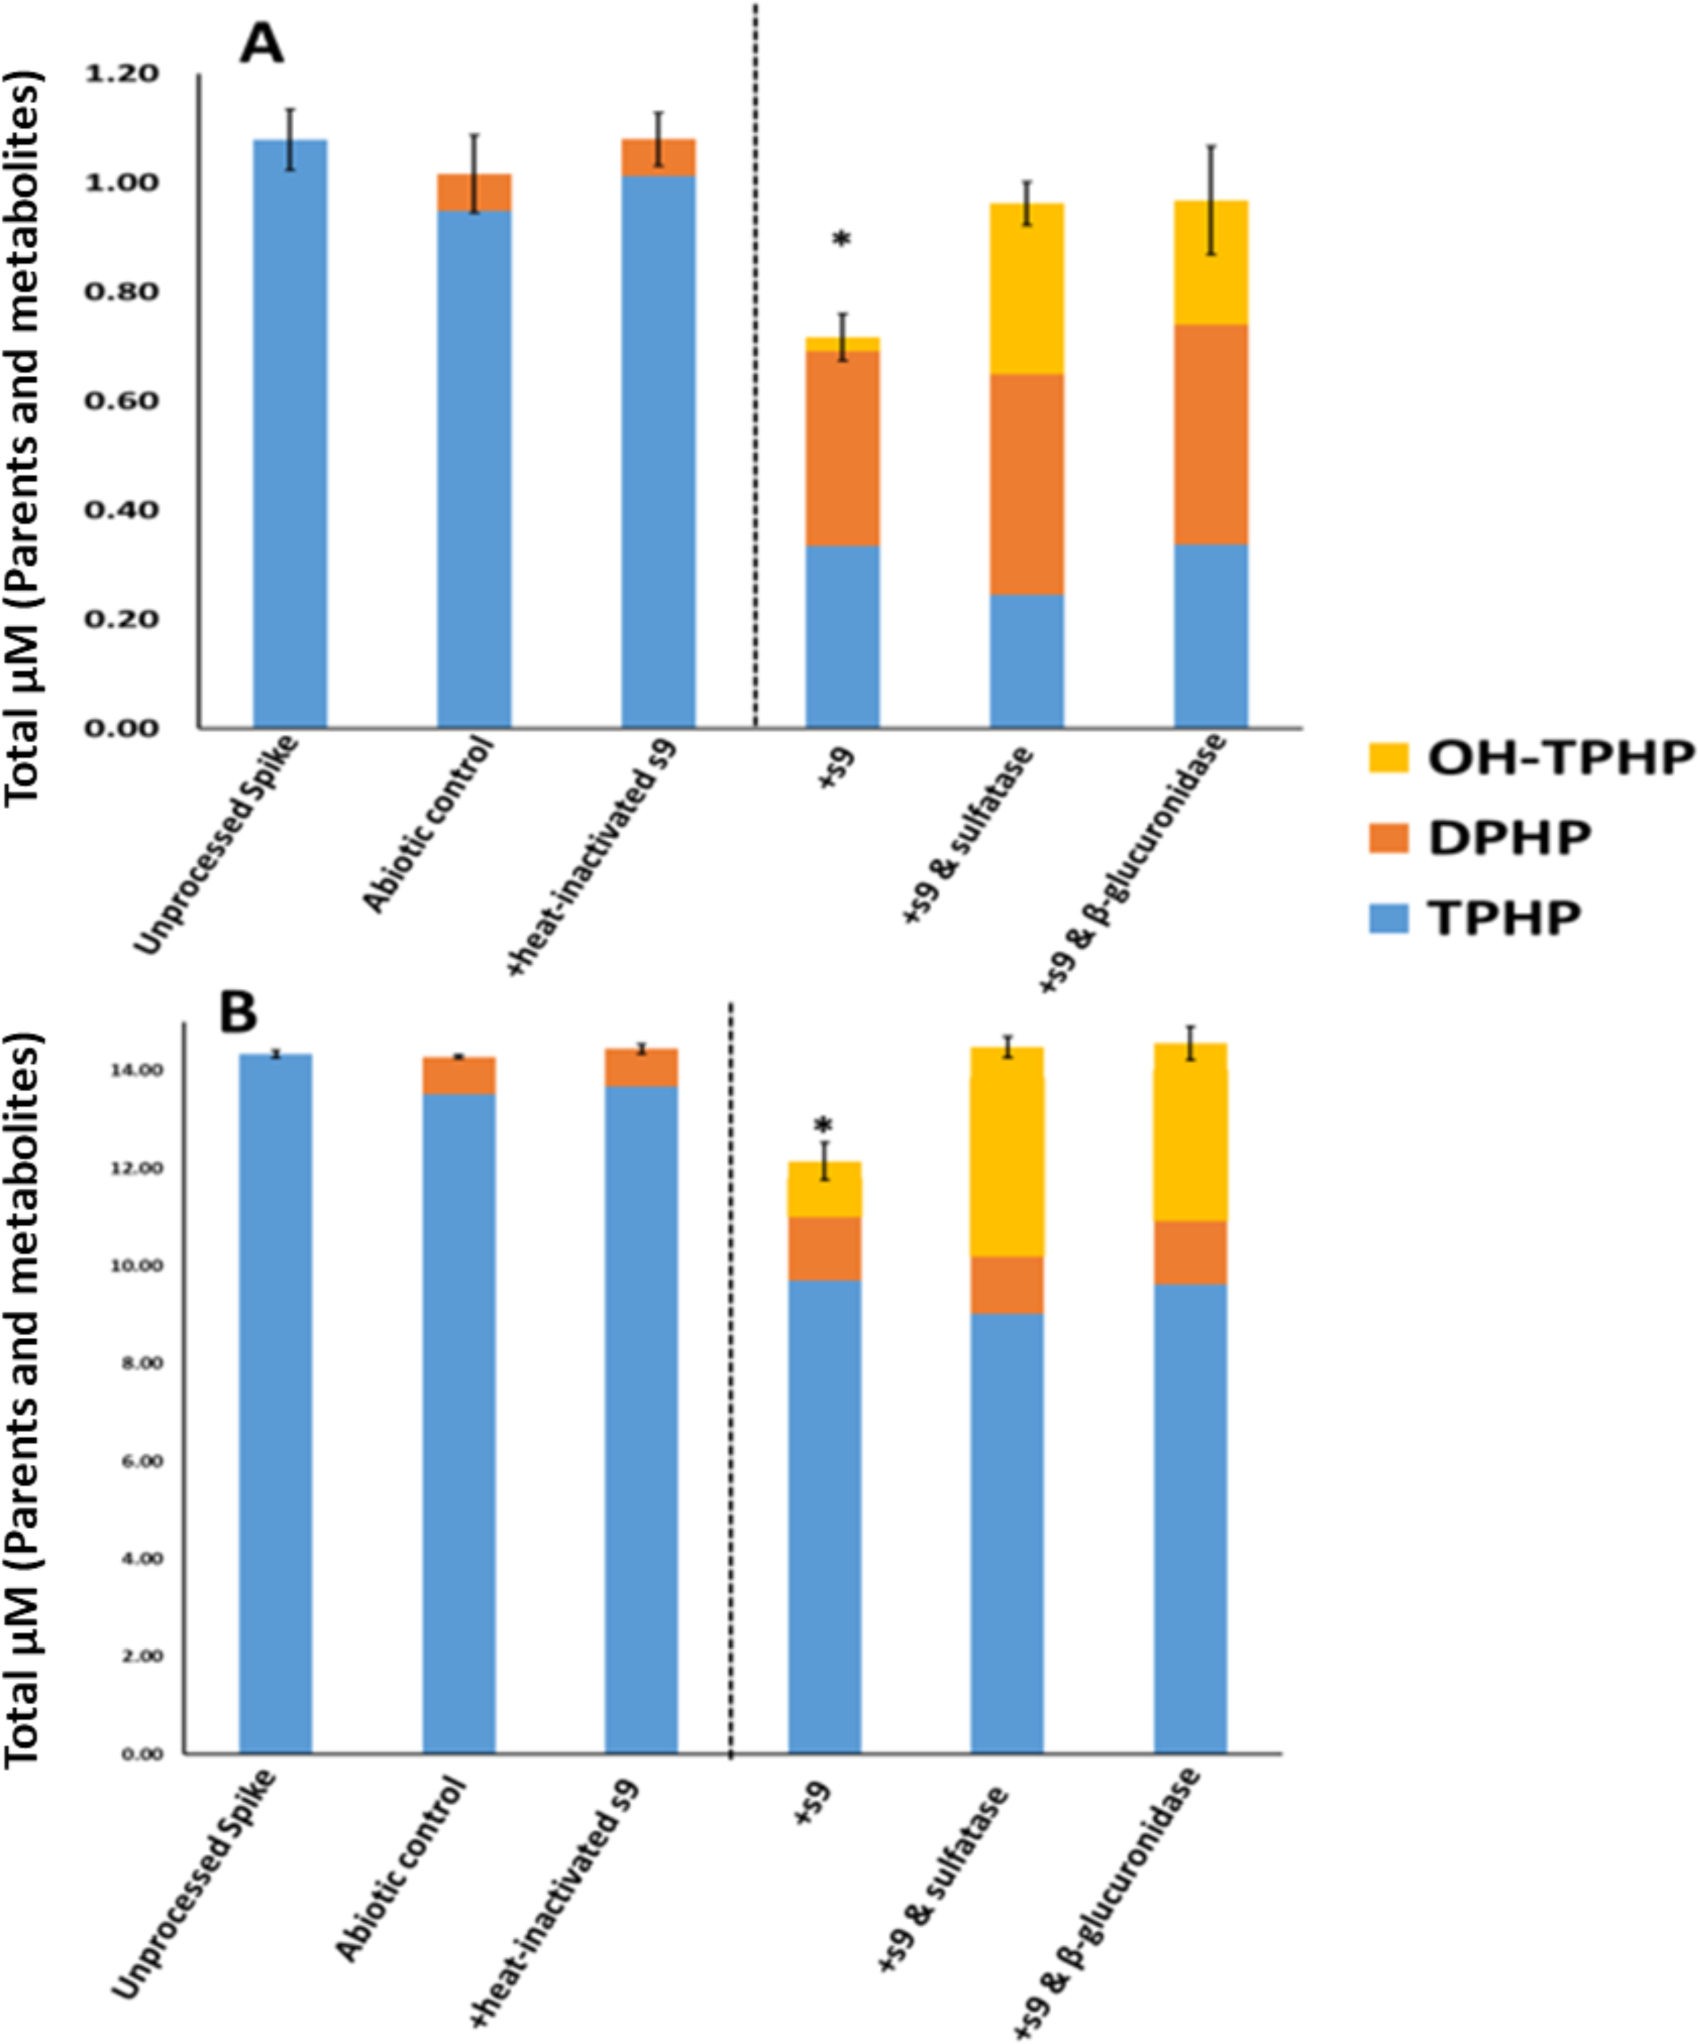
In Vitro Biotransformation of TPHP. A: 1 μM; B: 10 μM. Means (n=3) are plotted for each analyte and error bars depict standard deviation of the total mass balance for each treatment. A dashed line separates inactive and active treatments. Total mass was significantly different from the unprocessed spike for the +s9 treatment (ANOVA; p <0.0001).
4-tert-butylphenyl diphenyl phosphate (4tBPDPP)
The major metabolites of 4tBPDPP identified were tb-PPP and DPHP. To the author’s knowledge, this is the first study to demonstrate that tb-PPP is a major in vitro metabolite of 4tBPDPP in humans. OH-TPHP conjugates were also noticeably formed at the 10 μM dose (Table 4). It should be noted that TPHP was an impurity (~10% w/w by quantitative GC/MS analysis) in the 4tBPDPP stock and could be a source of DPHP and OH-TPHP conjugate formation. Assuming the transformation rate of TPHP from the experiment above, all of the DPHP formation observed in the 4tBPDPP incubations can be accounted for by the hydrolysis of the TPHP impurity in the dosing stock. No significant difference in the total molar mass of parents and quantified metabolites was found between the unprocessed spike and either the heat-inactivated control or the abiotic control (ANOVA; p > 0.05) (Figure 3). Although DPHP and tb-PPP were detected in both the heat-inactivated control and the abiotic control, 2- to 4-fold higher levels of these metabolites were found in the +S9 treatment and the three groups treated with deconjugation enzymes (ANOVA; p < 0.0001). Conjugated metabolites accounted for a relatively smaller proportion of 4tBPDPP transformation compared to TPHP biotransformation. Similarly, the percent depletion of 4tBPDPP was 30–45% lower than that of TPHP, a trend that has been observed previously in polar bear liver microsomes (Strobel et al., 2018).
Table 4.
In Vitro Biotransformation of 4tBPDPP Following Incubation with Human Liver S9 Fractions.
| Dose | Treatment | Percentage of Initial Parent Administration (Mean ±Std Dev) | % Depletion | ||||||
|---|---|---|---|---|---|---|---|---|---|
| TPHP | 4tBPDPP | DPHP | OH-TPHP | tb-PPP | Total | ||||
| 4tBPDPP | 1 μM | unprocessed spike | 8 ± 1% | 92 ± 4% | N.D. | N.D. | N.D. | 100 ± 4% | -- |
| Abiotic Control | 7.0 ± 0.4% | 84 ± 8% | 11 ± 1% | N.D. | 8.5 ± 0.7% | 111 ± 8% | 9% | ||
| Heat-inactivated s9 | 7.1 ± 0.7% | 81 ± 6% | 7.6 ± 0.5% | N.D. | 7.0 ± 0.2% | 103 ± 6% | 12% | ||
| s9 | 0.4 ± 0.4% | 59 ± 11% | 19 ± 1% | 0.2 ± 0.01% | 33 ± 3% | 111 ± 13% | 41% | ||
| s9& sulfatase | 0.3 ± 0.2% | 61 ± 5% | 18 ± 0.4% | 0.9 ± 0.03% | 29 ± 1% | 109 ± 5% | 39% | ||
| s9& glucuronidase | 0.7 ± 0.3% | 56 ± 5% | 20 ± 1% | 0.8 ± 0.03% | 28 ± 0.5% | 105 ± 5% | 43% | ||
| s9& sulfatase & glucuronidase | 0.6 ± 0.1% | 60 ± 6% | 19 ± 0% | 0.6 ± 0.4% | 29 ± 1% | 109 ± 7% | 39% | ||
| 10 μM | unprocessed spike | 11 ± 0.1% | 89 ± 1% | N.D. | N.D. | N.D. | 100 ± 1% | -- | |
| Abiotic Control | 11 ± 0.1% | 81 ± 1% | 3.4 ± 0.3% | N.D. | 9.1 ± 0.8% | 104 ± 2% | 8% | ||
| Heat-inactivated s9 | 9.4 ± 1.9% | 79 ± 11% | 2.7 ± 0.4% | N.D. | 6.9 ± 1.3% | 98 ± 15% | 12% | ||
| s9 | 5.1 ± 0.5% | 83 ± 2% | 6.6 ± 0.2% | 1.0 ± 0.1% | 11 ± 1% | 107 ± 2% | 12% | ||
| s9& sulfatase | 4.2 ± 0.5% | 73 ± 9% | 12 ± 1% | 5.5 ± 0.8% | 18 ± 3% | 112 ± 14% | 23% | ||
| s9& glucuronidase | 4.6 ± 0.1% | 72 ± 5% | 12 ± 1% | 6.4 ± 0.1% | 16 ± 1% | 109 ± 3% | 23% | ||
| s9& sulfatase & glucuronidase | 4.1 ± 0.6% | 71 ± 6% | 12 ± 1% | 6.0 ± 0.9% | 16 ± 4% | 107 ± 9% | 25% | ||
Figure 3.
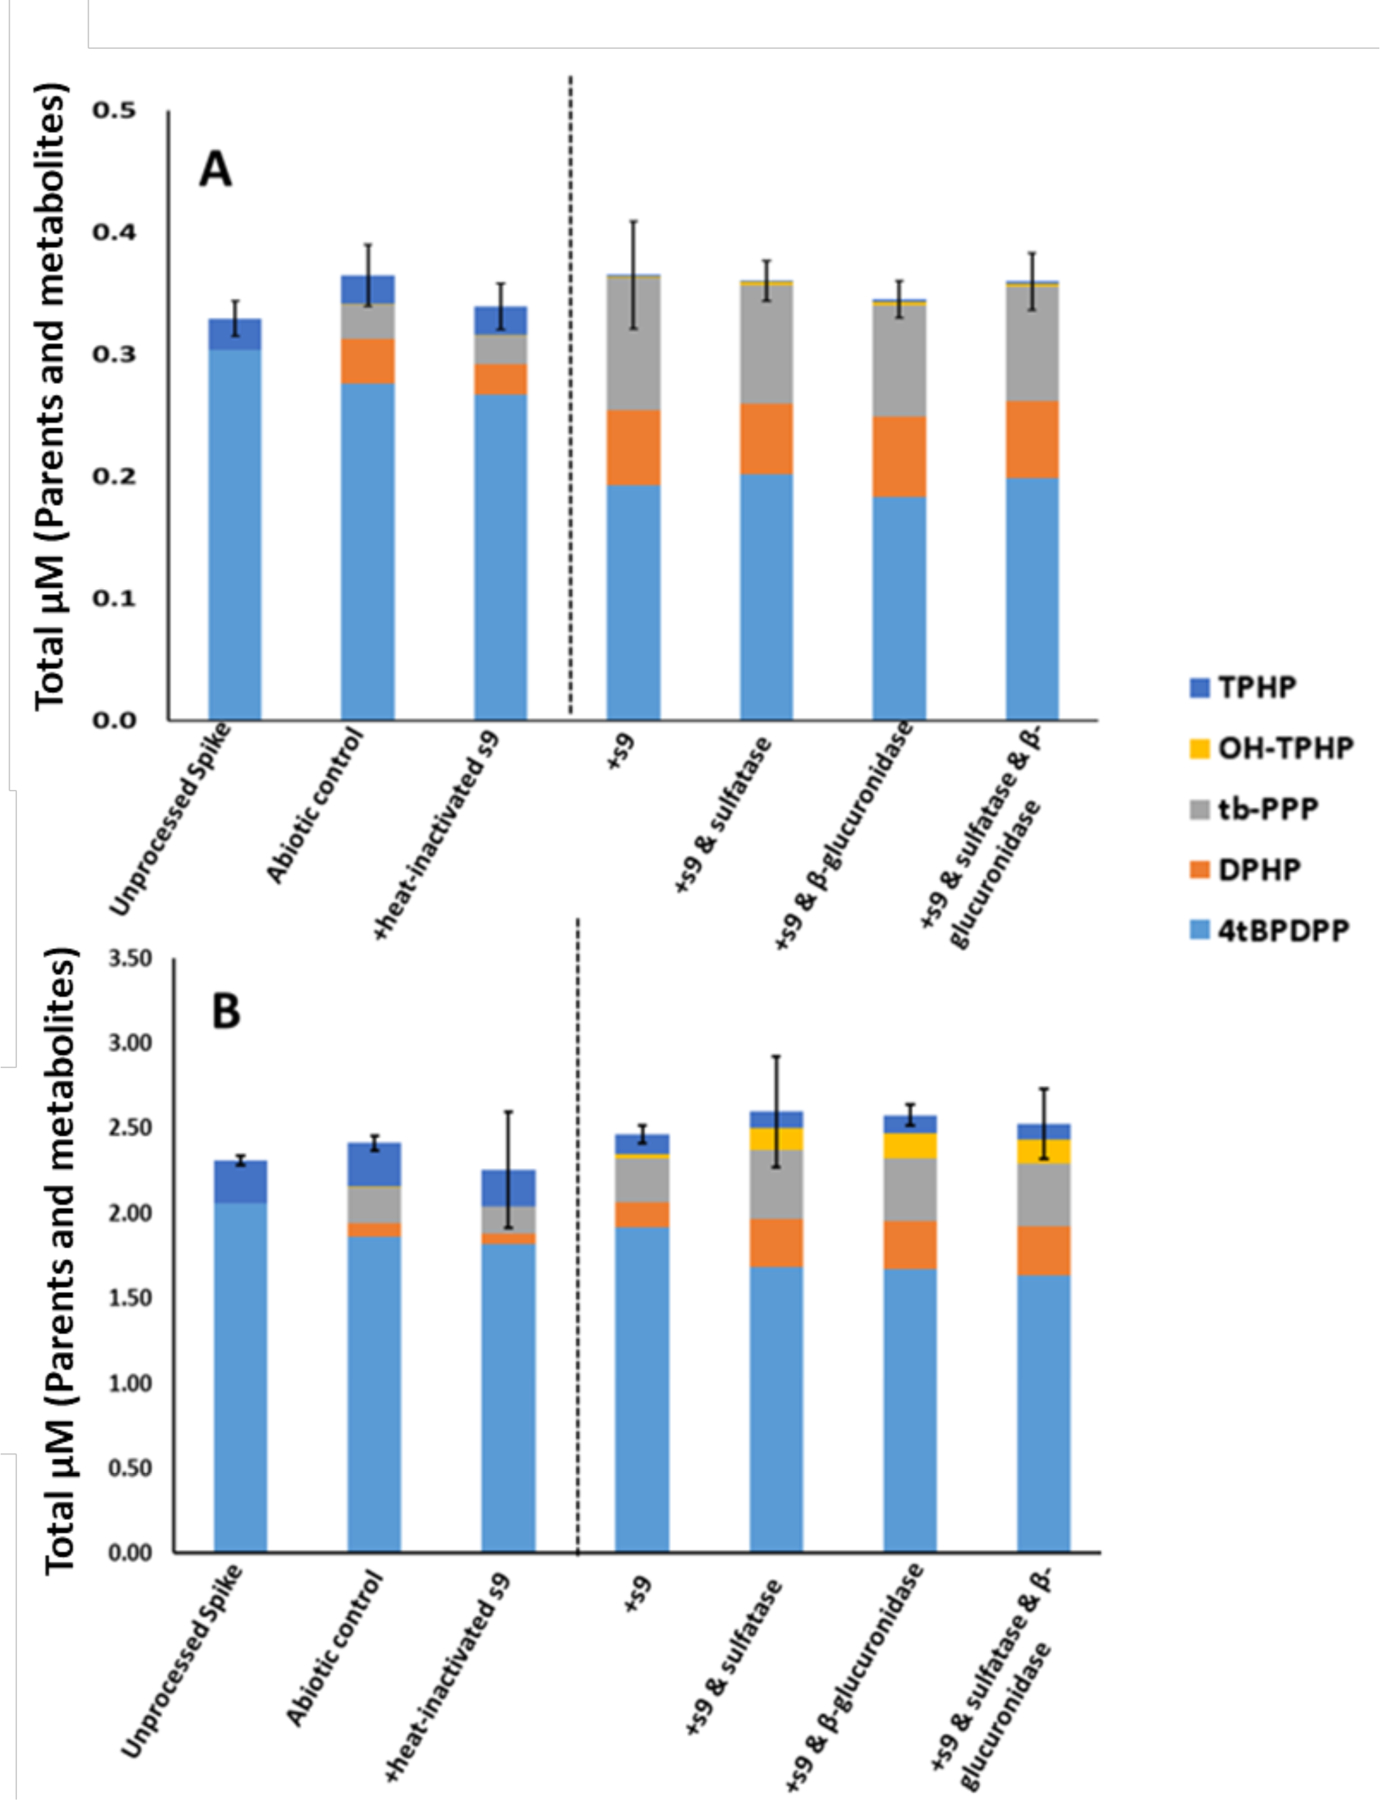
In Vitro Biotransformation of 4tBPDPP. A: 1 μM; B: 10 μM. Means (n=3) are plotted for each analyte and error bars depict standard deviation of the total mass balance for each treatment. A dashed line separates inactive and active treatments. Total mass was not significantly different for any of the treatment groups compared to the unprocessed spike.
2-isopropylphenyl diphenyl phosphate (2IPPDPP) and 4-isopropylphenyl diphenyl phosphate (4IPPDPP)
The metabolites of 2IPPDPP and 4IPPDPP were DPHP and ip-PPP (Tables 5 and 6). No significant difference in total molar mass of parent and quantified metabolites was found between the unprocessed spike and either the heat-inactivated or abiotic controls for both isomers (ANOVA; p > 0.05). 2IPPDPP showed the lowest percent depletion for all of the four compounds tested, which corresponds to its slower rate of depletion observed in the kinetic experiments. Low levels of OH-TPHP were detected in the three groups treated with deconjugation enzymes for the 2IPPDPP metabolism experiment but were not detected in any of the 4IPPDPP metabolism groups. DPHP was detected at approximately 4-fold higher levels in the treatment groups compared to the abiotic control (ANOVA; p < 0.05). Ip-PPP was also detected at significantly higher levels in the treatment groups compared to the abiotic control (ANOVA; p < 0.05). However, ip-PPP was detected at lower levels than DPHP for both doses and compounds across treatment groups. Notably, a significant difference in the total molar mass of parents and metabolites was found between the unprocessed spike and the other treatment groups (ANOVA; p < 0.05), indicating that a mass balance was not achieved by quantifying known metabolites alone (Figures 4 and 5). DPHP and ip-PPP, the two metabolites monitored for 2IPPDPP and 4IPPDPP, appeared to account for a small amount of their respective metabolism (representing only up to 9% and 6% of the missing mass balance). Likewise, DPHP was not detected following the incubation of the ortho and para isomers of triisopropylphenyl diphenyl phosphate (T2IPPP & T4IPPP) (Strobel et al., 2018). This suggests that there may be other, previously unknown metabolites of ITP isomers that account for a large proportion of the metabolism of these compounds.
Table 5.
In Vitro Biotransformation of 2IPPDPP Following Incubation with Human Liver S9 Fractions.
| Dose | Treatment | Percentage of Initial Parent Administration (Mean ± Std Dev) | % Depletion | |||||
|---|---|---|---|---|---|---|---|---|
| 2IPPDPP | DPHP | OH-TPHP | ip-PPP | Total | ||||
| 2IPPDPP | 1 μM | unprocessed spike | 100 ± 13% | N.D. | N.D. | N.D. | 100 ± 13% | -- |
| Abiotic Control | 105 ± 20% | 0.3 ± 0.01% | N.D. | 0.3 ± 0.01% | 106 ± 20% | 0% | ||
| Heat-inactivated s9 | 101 ± 8% | 0.4 ± 0.03% | N.D. | 0.3 ± 0.03% | 102 ± 8% | 0% | ||
| s9 | 56 ± 10% | 1.0 ± 0.1% | 0.1 ± 0.01% | 0.9 ± 0.1% | 58 ± 10% | 44% | ||
| s9& sulfatase | 64 ± 6% | 1.6 ± 0.2% | 0.1 ± 0.1% | 1.4 ± 0.1% | 67 ± 3% | 36% | ||
| s9& glucuronidase | 65 ± 3% | 1.8 ± 0.3% | 0.1 ± 0.1% | 1.6 ± 0.3% | 69 ± 3% | 35% | ||
| s9 & sulfatase & glucuronidase | 67 ± 4% | 1.5 ± 0.1% | 0.1 ± 0.1% | 1.2 ± 0.1% | 70 ± 3% | 33% | ||
| 10 μM | unprocessed spike | 100 ± 9% | N.D. | N.D. | N.D. | 100 ± 9% | -- | |
| Abiotic Control | 103 ± 10% | 0.2 ± 0.04% | N.D. | 0.3 ± 0.03% | 104 ± 10% | 0% | ||
| Heat-inactivated s9 | 103 ± 11% | 0.3 ± 0.1% | N.D. | 0.3 ± 0.03% | 103 ± 11% | 0% | ||
| s9 | 77 ± 5% | 1.1 ± 0.1% | 0.1 ± 0.002% | 0.6 ± 0.02% | 79 ± 5% | 23% | ||
| s9& sulfatase | 80 ± 7% | 1.2 ± 0.2% | 0.1 ± 0.003% | 0.9 ± 0.03% | 80 ± 7% | 20% | ||
| s9& glucuronidase | 82 ± 3% | 1.1 ± 0.1% | 0.1 ± 0.01% | 0.9 ± 0.1% | 84 ± 3% | 18% | ||
| s9 & sulfatase & glucuronidase | 84 ± 4% | 1.2 ± 0.1% | 0.1 ± 0.01% | 0.8 ± 0.1% | 86 ± 4% | 16% | ||
Table 6.
In Vitro Biotransformation of 4IPPDPP Following Incubation with Human Liver S9 Fractions.
| Dose | Treatment | Percentage of Initial Parent Administration (Mean ± Std Dev) | % Depletion | |||||
|---|---|---|---|---|---|---|---|---|
| 4IPPDPP | DPHP | OH-TPHP | ip-PPP | Total | ||||
| 4IPPDPP | 1 μM | unprocessed spike | 100 ± 2% | N.D. | N.D. | N.D. | 100 ± 13% | -- |
| Abiotic Control | 108 ± 23% | 0.9 ± 0.1% | N.D. | 0.3 ± 0.03% | 110 ± 23% | 0% | ||
| Heat-inactivated s9 | 82 ± 5% | 1.5 ± 0.3% | N.D. | 0.4 ± 0.1% | 84 ± 9% | 18% | ||
| s9 | 27 ± 4% | 2.9 ± 0.2% | N.D. | 1.0 ± 0.04% | 31 ± 4% | 73% | ||
| s9& sulfatase | 29 ± 3% | 3.5 ± 0.3% | N.D. | 1.3 ± 0.1% | 34 ± 3% | 71% | ||
| s9& glucuronidase | 27 ± 1% | 3.4 ± 0.2% | N.D. | 1.2 ± 0.1% | 32 ± 1% | 73% | ||
| s9 & sulfatase & glucuronidase | 32 ± 3% | 3.8 ± 0.2% | N.D. | 1.2 ± 0.1% | 37 ± 3% | 68% | ||
| 10 μM | unprocessed spike | 100 ± 3% | N.D. | N.D. | N.D. | 100 ± 3% | -- | |
| Abiotic Control | 94 ± 6% | 0.3 ± 0.04% | N.D. | 0.1 ± 0.004% | 94 ± 6% | 6% | ||
| Heat-inactivated s9 | 97 ± 10% | 0.2 ± 0.01% | N.D. | 0.1 ± 0.003% | 98 ± 10% | 3% | ||
| s9 | 55 ± 3% | 0.6 ± 0.1% | N.D. | 0.3 ± 0.01% | 56 ± 3% | 45% | ||
| s9& sulfatase | 54 ± 1% | 1.2 ± 0.03% | N.D. | 0.7 ± 0.02% | 56 ± 1% | 46% | ||
| s9& glucuronidase | 57 ± 2% | 1.2 ± 0.1% | N.D. | 0.4 ± 0.02% | 59 ± 2% | 43% | ||
| s9 & sulfatase & glucuronidase | 55 ± 4% | 1.0 ± 0.1% | N.D. | 0.5 ± 0.03% | 58 ± 3% | 45% | ||
Figure 4.
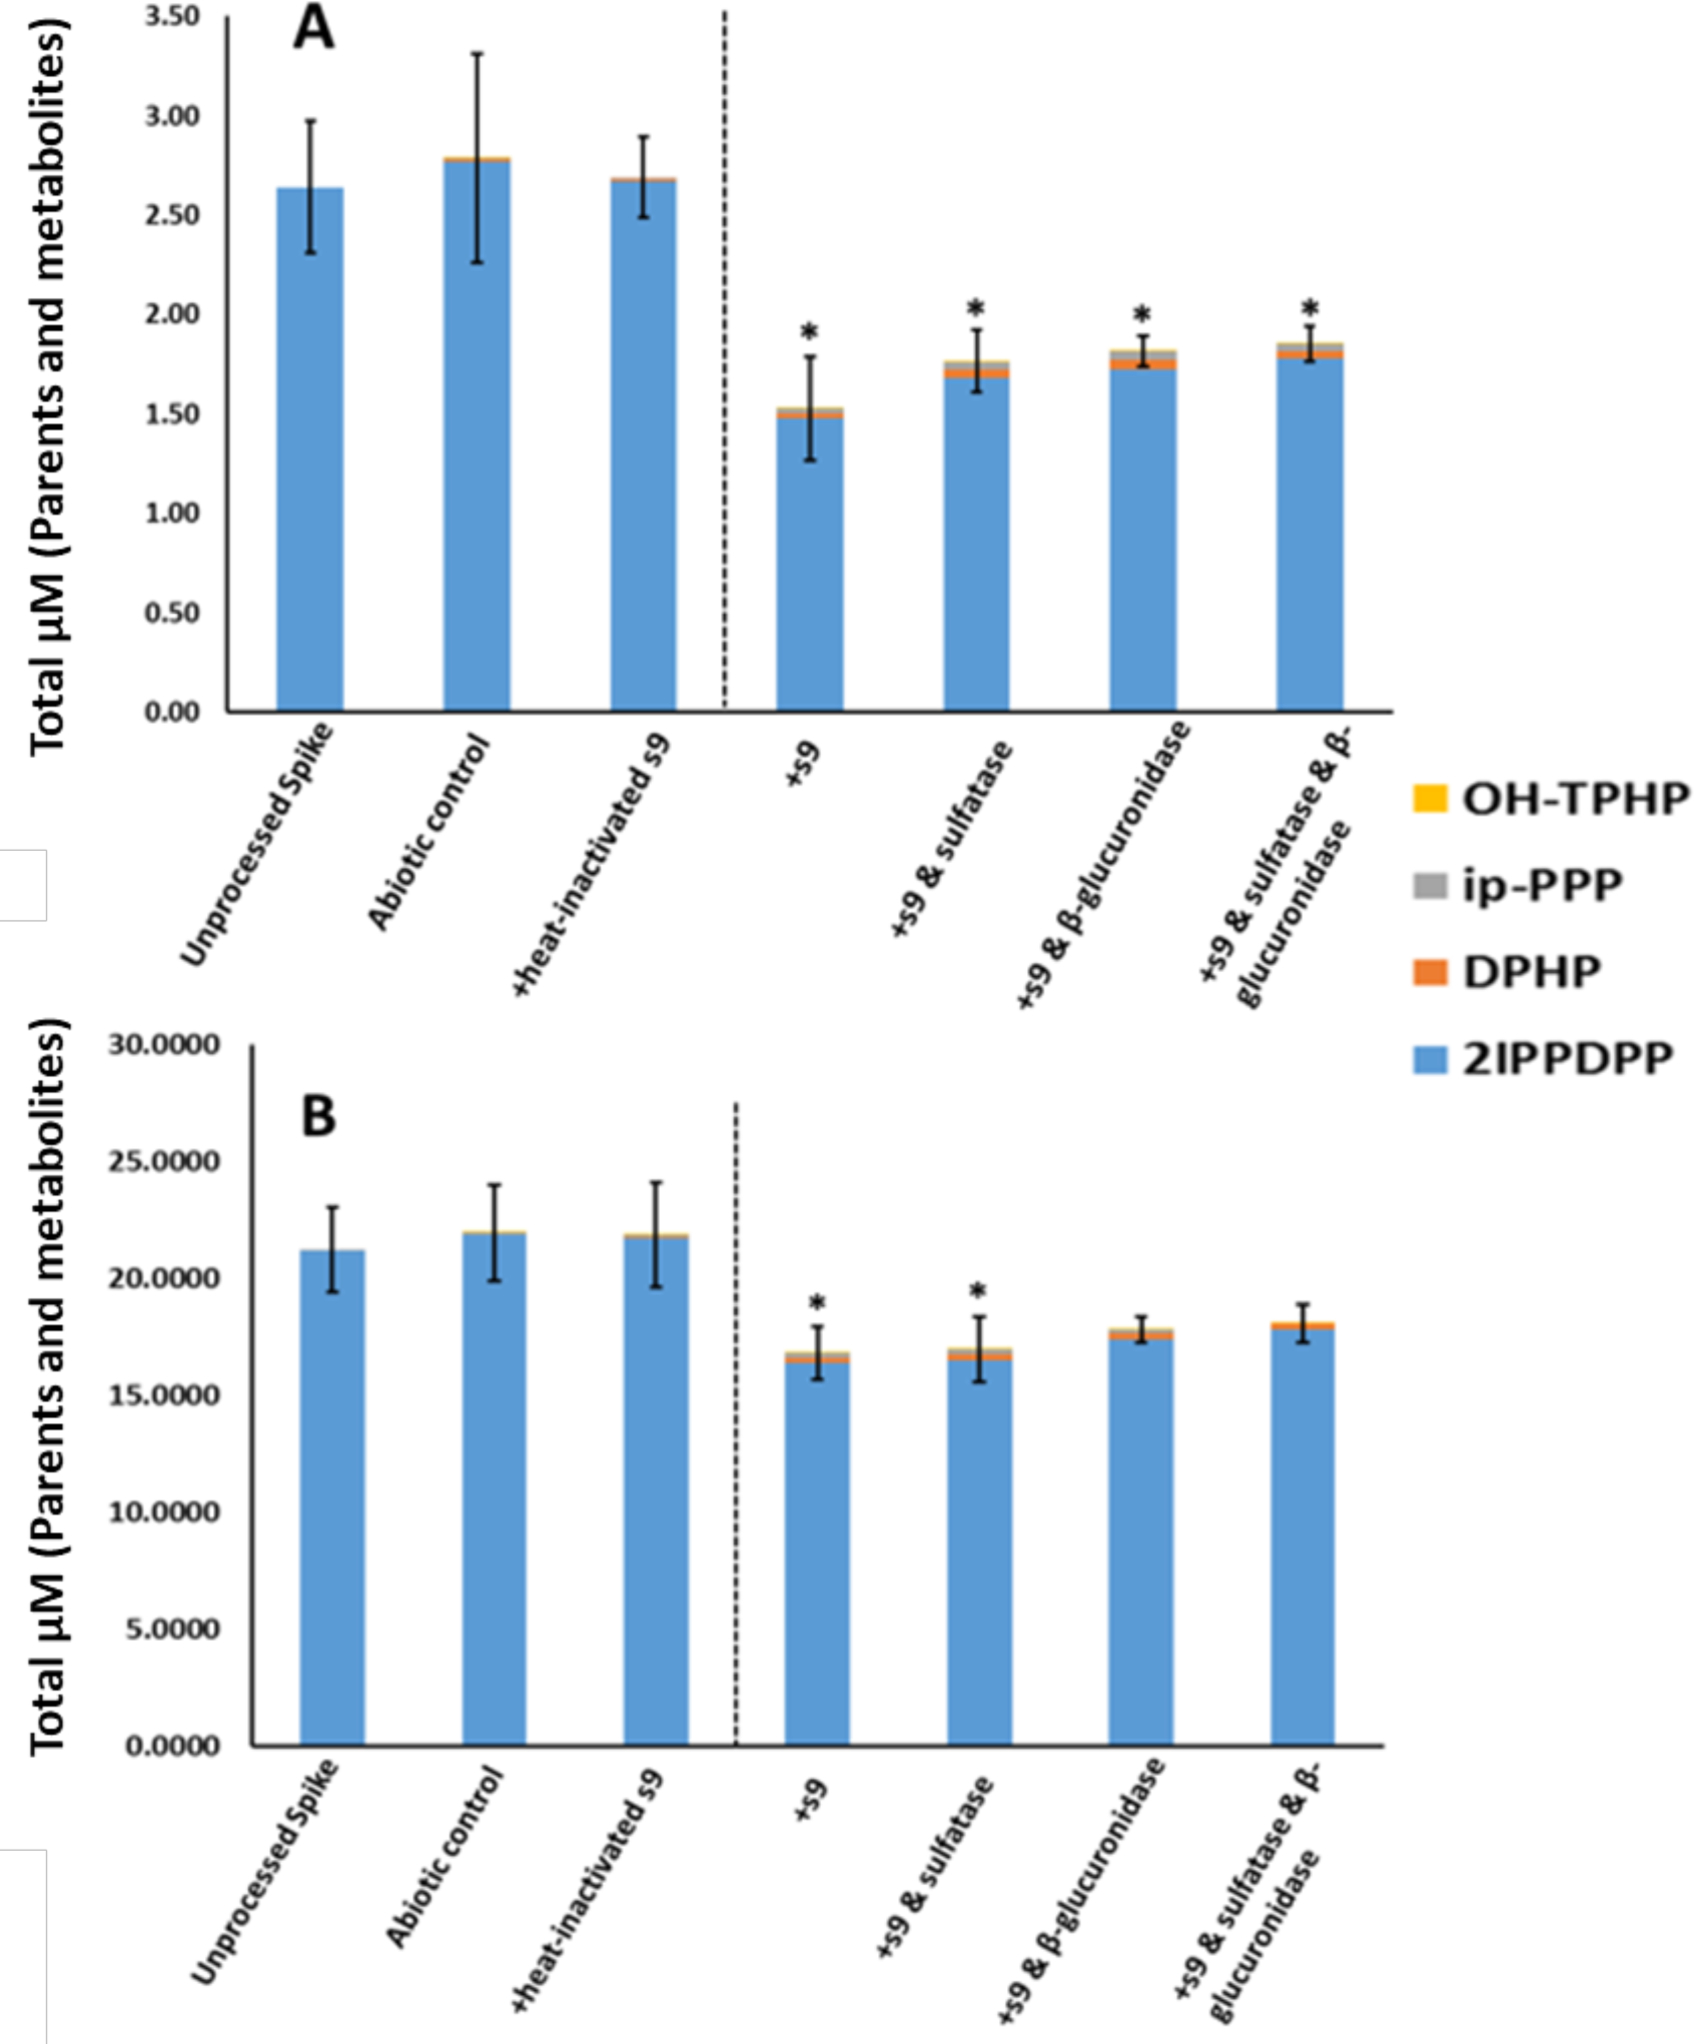
In Vitro Biotransformation of 2IPPDPP. A: 1 μM; B: 10 μM. Means (n=3) are plotted for each analyte and error bars depict standard deviation of the total mass balance for each treatment. A dashed line separates inactive and active treatments. Asterisks denote a significant difference in total mass compared to the unprocessed spike (ANOVA; p <0.05).
Figure 5.
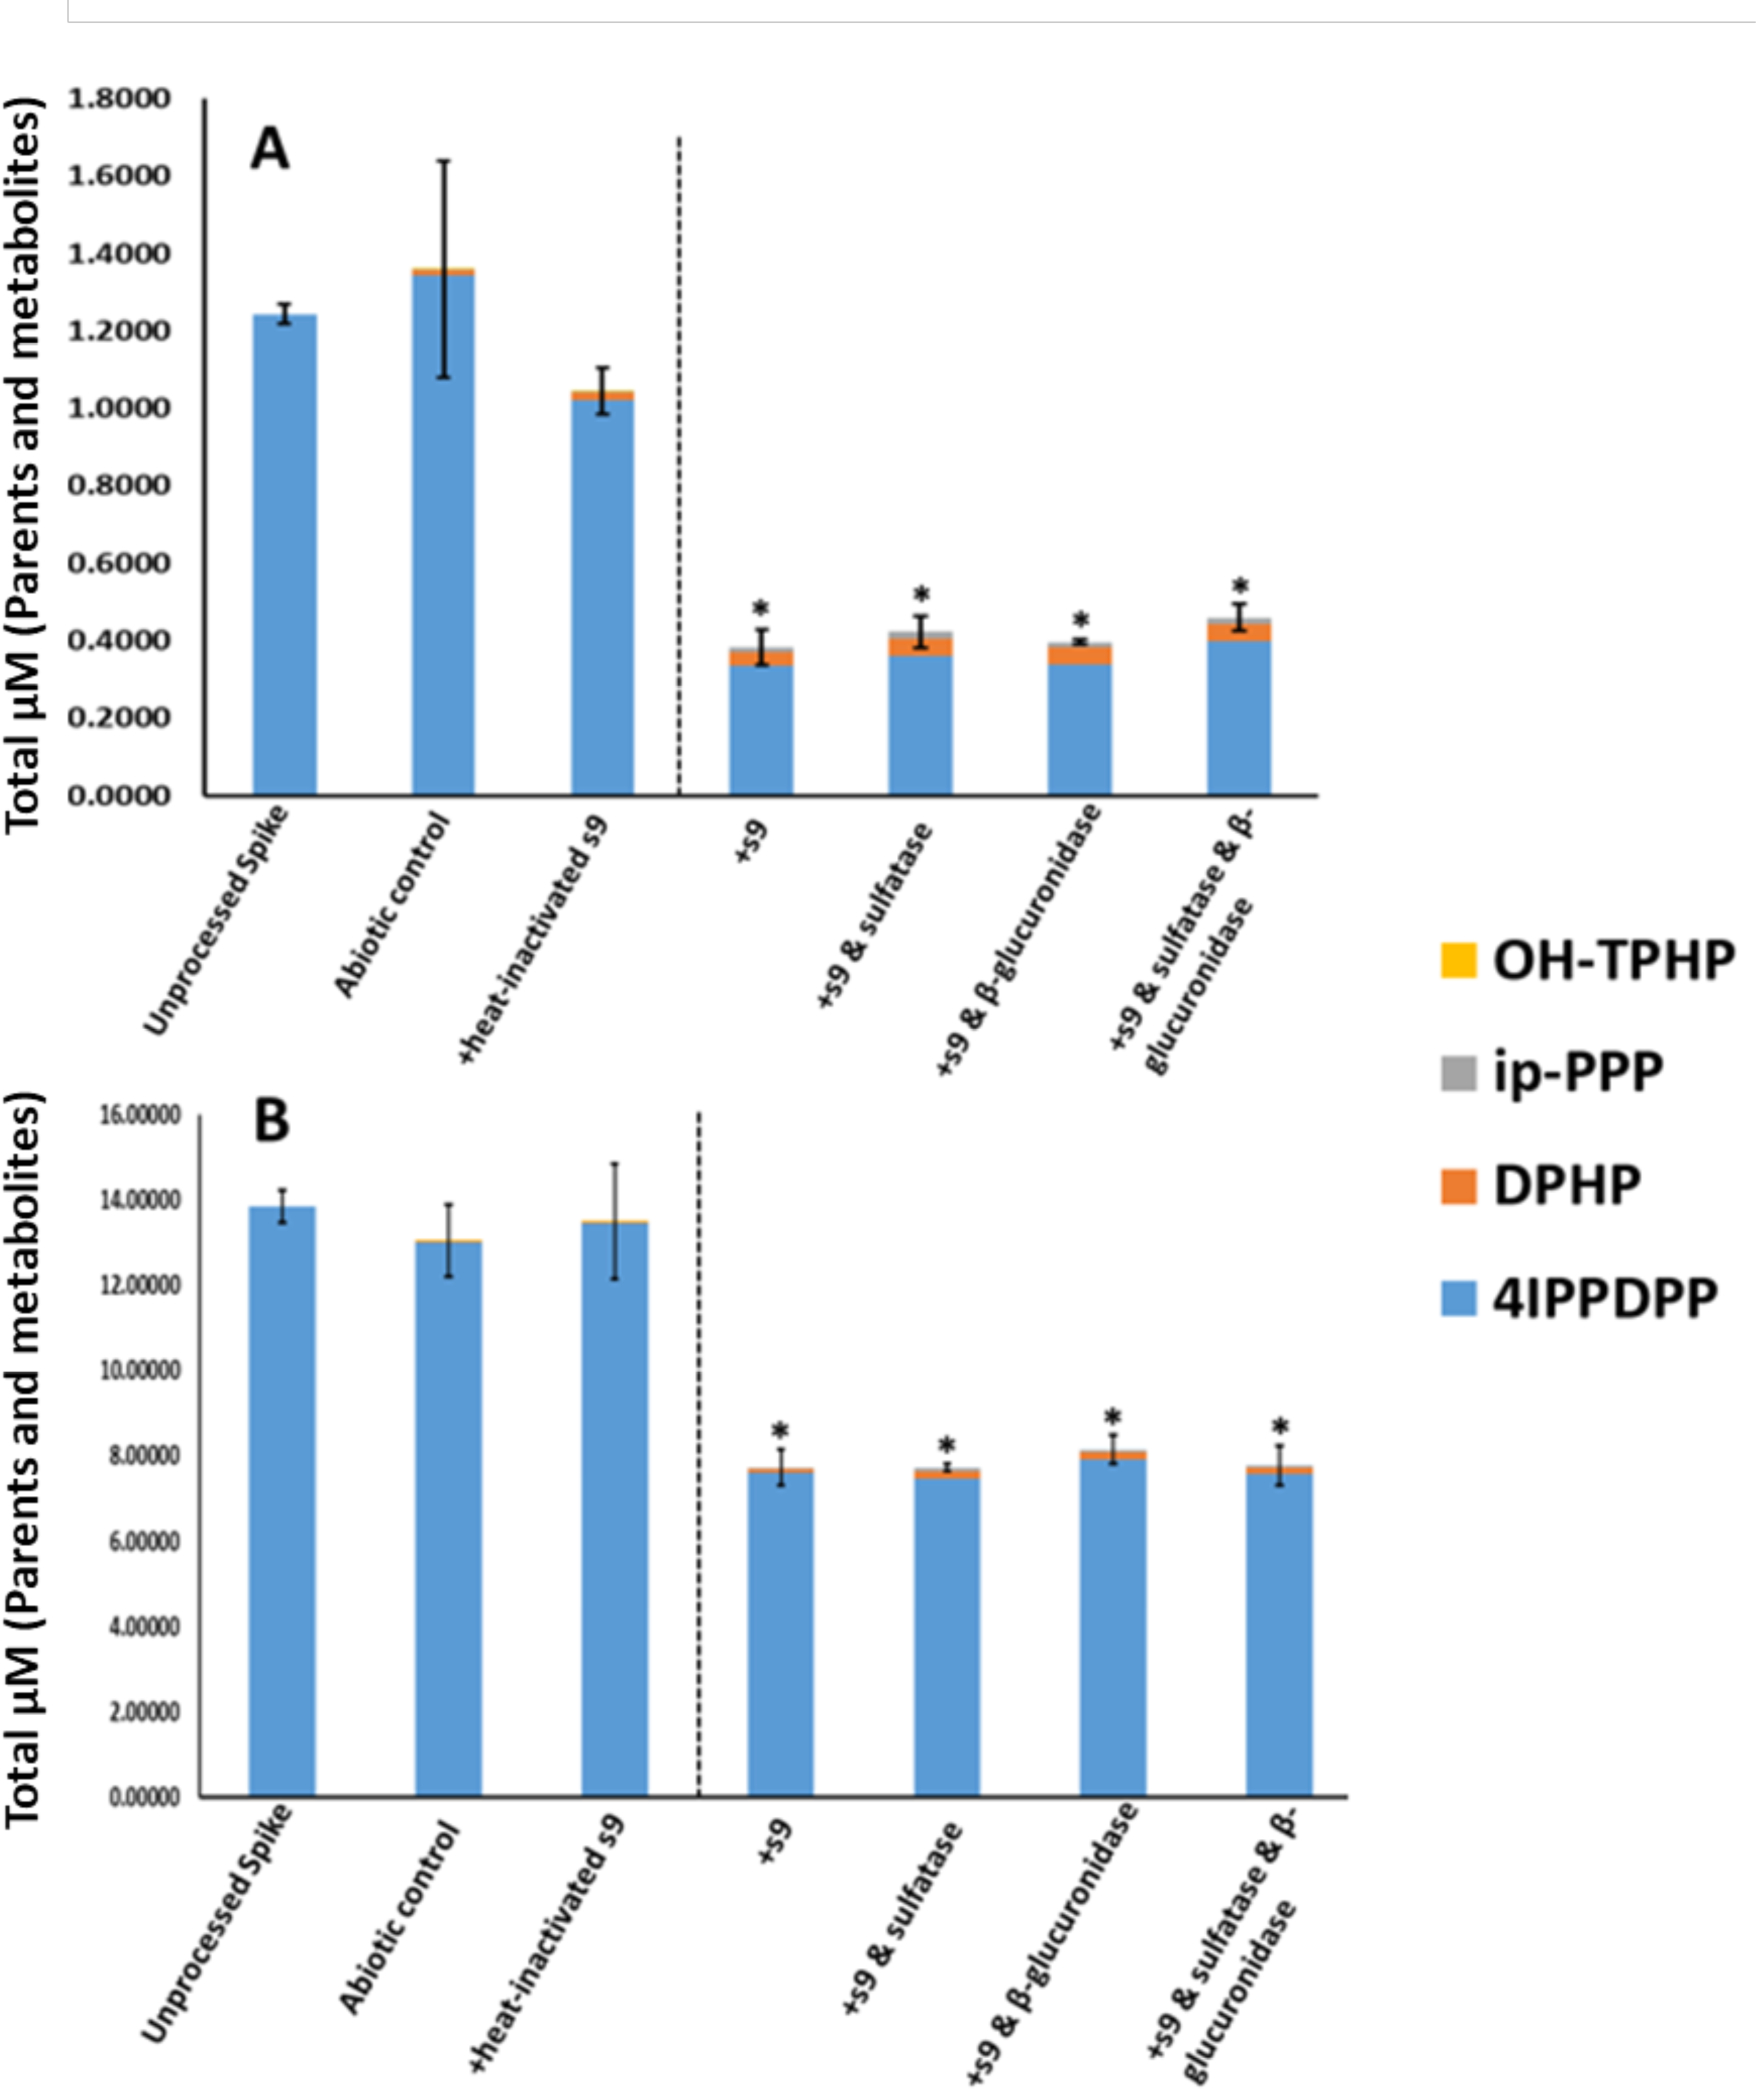
In Vitro Biotransformation of 4IPPDPP. A: 1 μM; B: 10 μM. Means (n=3) are plotted for each analyte and error bars depict standard deviation of the total mass balance for each treatment. A dashed line separates inactive and active treatments. Asterisks denote a significant difference in total mass compared to the unprocessed spike (ANOVA; p <0.05).
Suspect Screening by High Resolution Mass Spectrometry
To screen for metabolites contributing to the missing mass balance for 2IPPDPP and 4IPPDPP, samples from the in vitro biotransformation assays were analyzed using high-resolution mass spectrometry. A dehydrogenated metabolite of 2IPPDPP, mono-(o-isopropenylphenyl)-diphenyl phosphate (exact mass = 366.1015471, observed mass = 366.10144, δppm = −0.29), and a dehydrogenated metabolite of 4IPPDPP, mono-(p-isopropenylphenyl)-diphenyl phosphate (exact mass = 366.1015471, observed mass = 366.10110, δppm = −0.44), were tentatively identified by high resolution GC-MS/MS via exact mass matching (Figure 6). These compounds were present in the +S9 group and the three groups treated with deconjugation enzymes but not in the blanks, unprocessed spike, or abiotic control (Figure S4). Mono-(p-isopropenylphenyl)-diphenyl phosphate was also detected in 1 out of 9 urine samples tested (exact mass = 366.1015, δppm = −0.88), and was not present in laboratory blanks (Figure S5). Although it was not detected in any of the in vitro biotransformation assays, 2-phenyl-4H,−4,4-dimethyl-1,1,3,2 -benzodioxapho-sphoran-2-oxide (exact mass = 262.03895, δppm = 0.56) was tentatively detected in 1 out of 9 urine samples tested and was not present in laboratory blanks (Figure S6). Ultimately, the detection of both of these novel ITP metabolites in human urine was infrequent and their analytical signals were very low, suggesting they were not stable or abundant metabolites or that the extraction and cleanup method used in this study was inefficient for their analysis.
Figure 6.
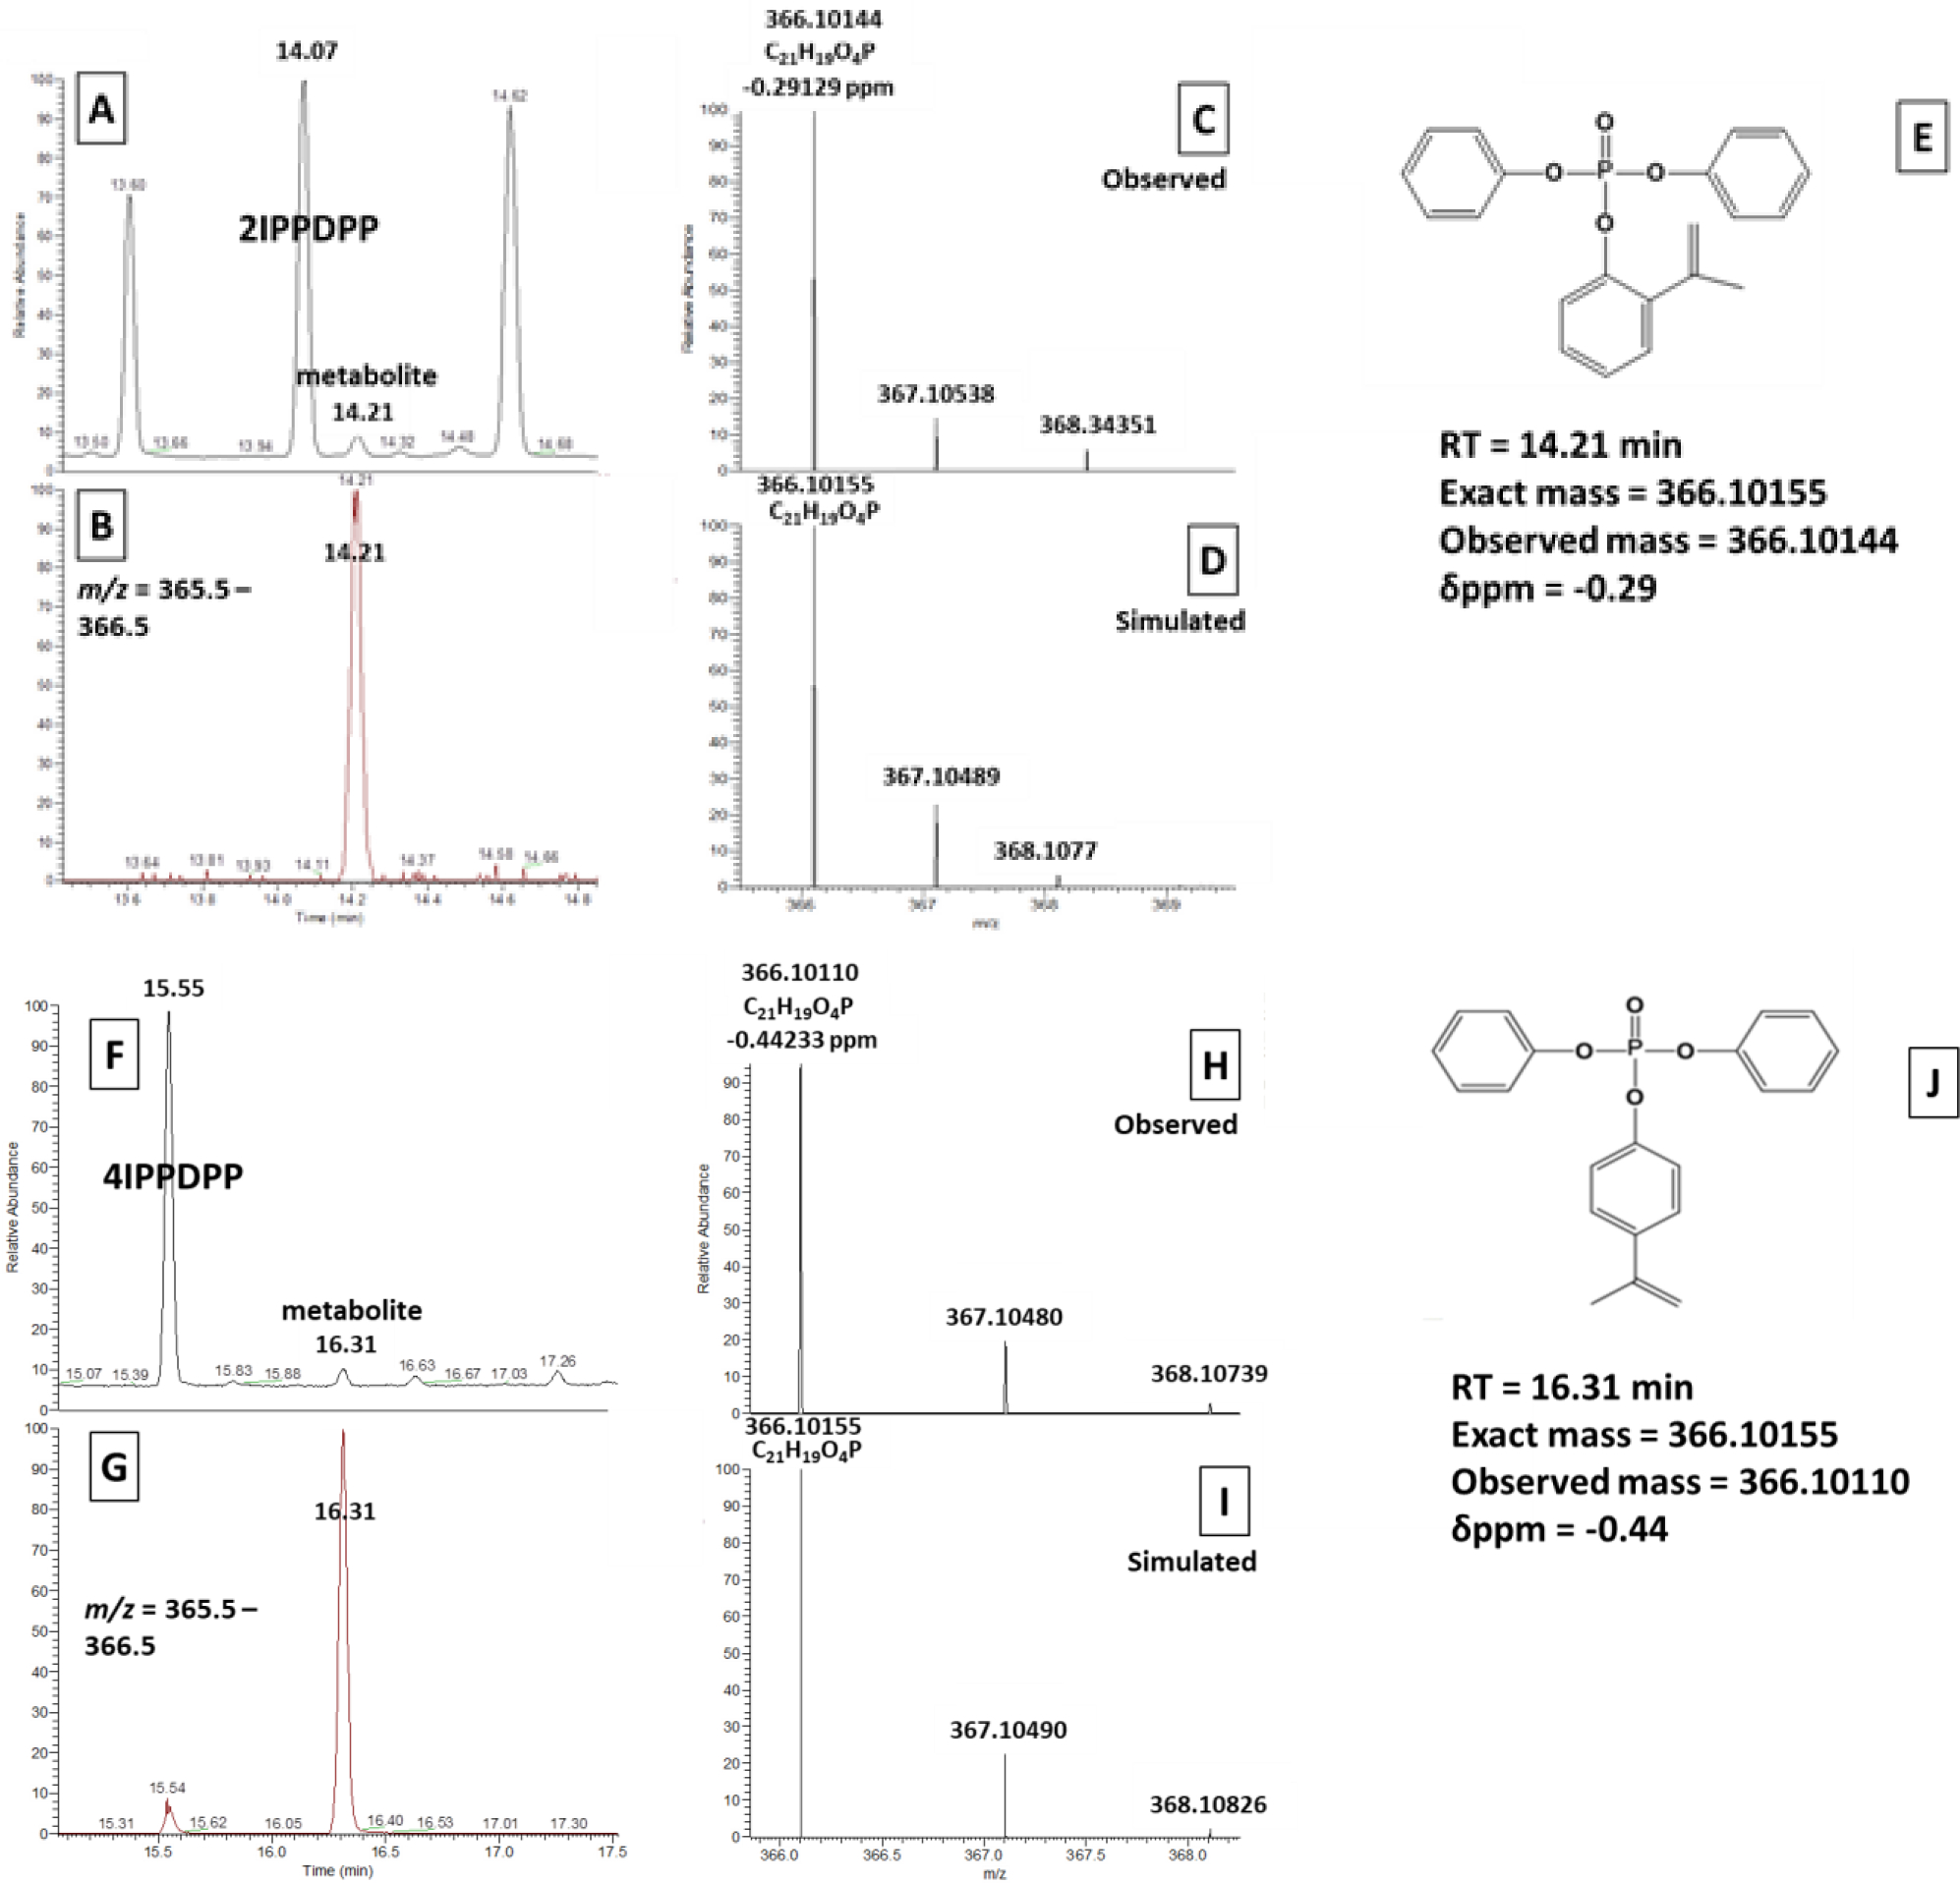
Q Exactive GC Orbitrap GC-MS/MS chromatograms and spectra used to identify novel ITP metabolites with ThermoFisher Excalibur software. A-E are from 2IPPDPP in vitro metabolism samples and F-J are from 4IPPDPP in vitro metabolism samples. A/F: total ion chromatogram (TIC); B/G: extracted ion chromatogram (EIC; m/z = 365.5–366.5); C/H: observed mass spectra (RT = 14.21 or 16.32 min); D/I: simulated mass spectra for C21H19O4P (exact mass = 366.10155); E: structure of mono-(o-isopropenylphenyl)-diphenyl phosphate and identification information (RT = 14.21 min, exact mass = 366.1015, δppm = −0.29); J: structure of mono-(p-isopropenylphenyl)-diphenyl phosphate and identification information (RT = 16.31 min, exact mass = 366.1015, δppm = −0.44).
Hydroxylated 2IPPDPP (exact mass = 385.1201, δppm = 0.31) and hydroxylated 4IPPDPP (exact mass = 385.1200, δppm = 0.23) were also tentatively identified as products of in vitro metabolism of 2IPPDPP and 4IPPDPP, respectively, via exact mass matches (< 1 ppm) by high resolution LC-MS/MS (Figure 7). These compounds were present in the +S9 group and the three groups treated with deconjugation enzymes but not in the blanks, unprocessed spike, or abiotic control (Figure S7). The magnitude of the mass spectral signal for the hydroxylated metabolites was similar among S9 treatment groups with and without the deconjugation enzymes, suggesting that deconjugation did not contribute significantly to the formation of this hydroxylated metabolite in vitro. Hydroxylated 2IPPDPP and hydroxylated 4IPPDPP were not detected in the any of the 9 urine samples screened in this study. The metabolites identified above were not quantified in the samples because authentic standards were not commercially available, but they likely contributed to a portion of the missing mass balance observed for 2IPPDPP and 4IPPDPP. Table S3 contains raw peak area for in vitro biotransformation assays. Exact mass integrations of molecular ions suggest that mono-(o-isopropenylphenyl)-diphenyl phosphate is present at ~1% the level of 2IPPDPP and mono-(p-isopropenylphenyl)-diphenyl phosphate is present at ~10% the level of 4IPPDPP. Exact mass integrations of molecular ions suggest that mono-hydroxylated 2IPPDPP is present at ~3% the level of 2IPPDPP and mono-hydroxylated 4IPPDPP is present at ~8% the level of 4IPPDPP. However, we caution against overinterpretation of these results as they are based on raw peak areas and not quantified masses. Additionally, the recovery of these metabolites is not known for the clean up procedures used prior to analysis.
Figure 7.
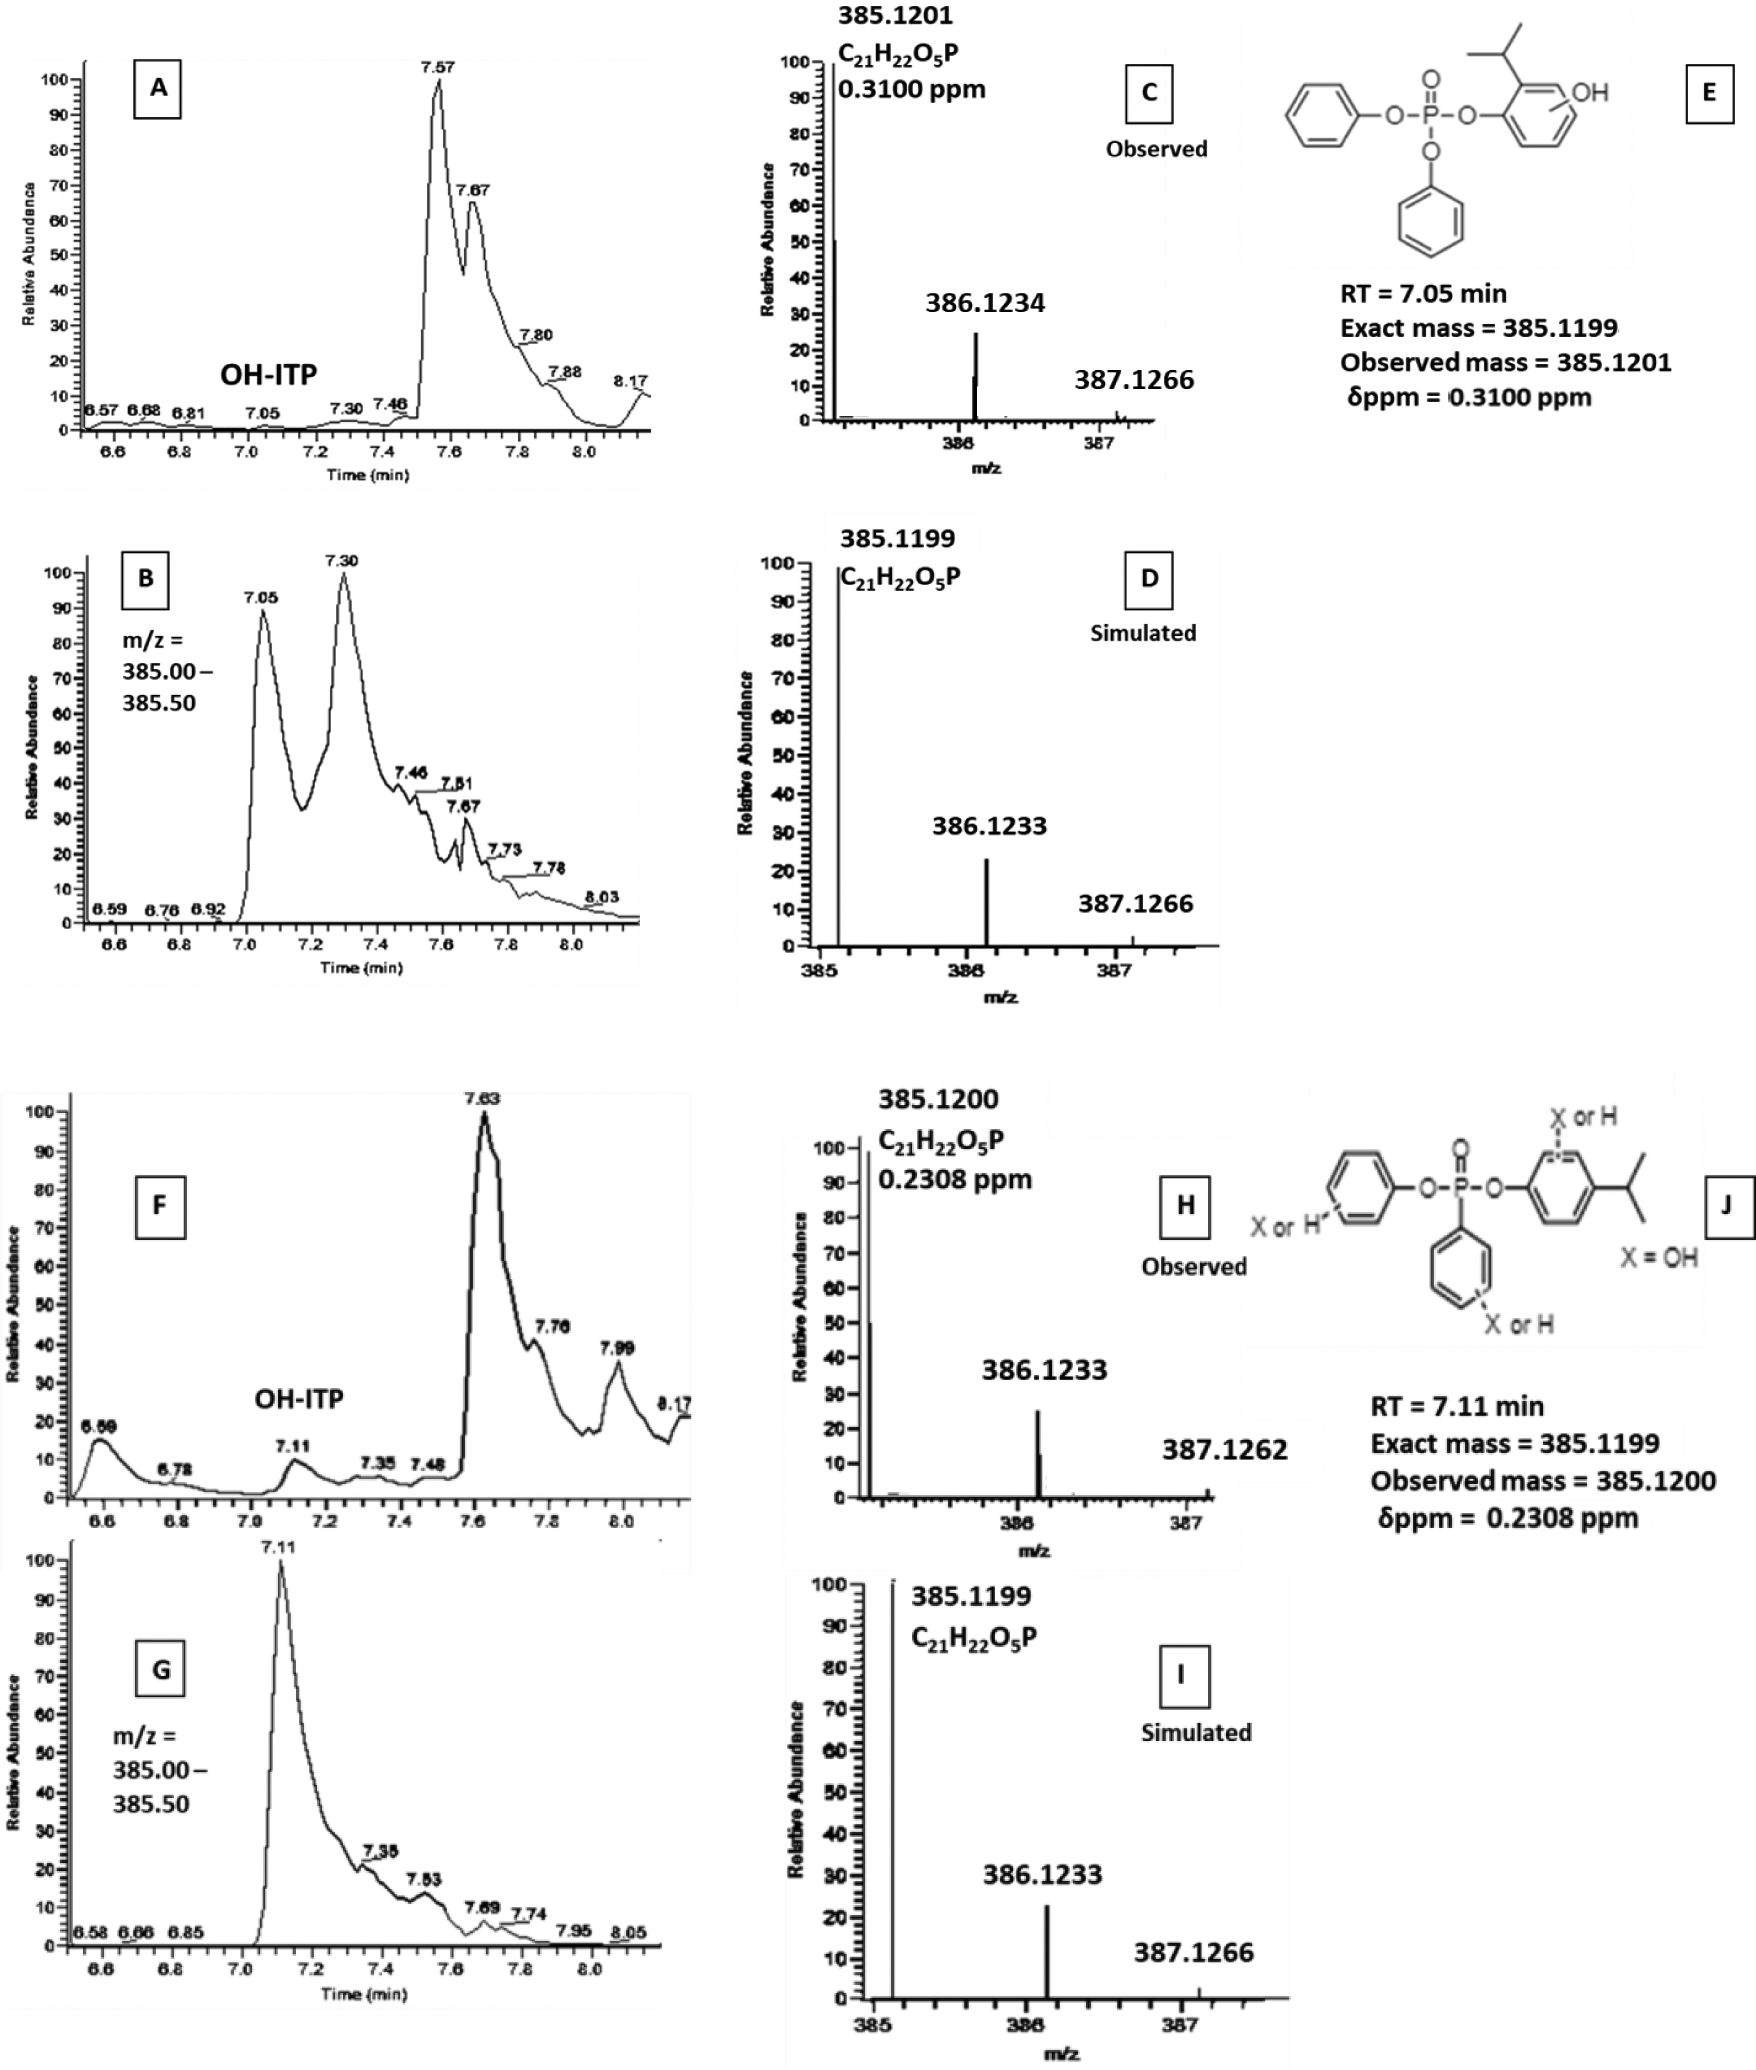
Orbitrap Fusion LC-MS chromatograms and spectra used to identify novel ITP metabolites with ThermoFisher Excalibur software. A-E are from 2IPPDPP in vitro metabolism samples and F-J are from 4IPPDPP in vitro metabolism samples. A/F: total ion chromatogram (TIC); B/G: extracted ion chromatogram (EIC; m/z = 385.0–385.5); C/H: observed mass spectra (RT = 7.05 or 7.11 min); D/I: simulated mass spectra for C21H22O5P (exact mass = 385.11994); E: structure of hydroxy-o-isopropylphenyl diphenyl phosphate and identification information (RT = 7.05 min, exact mass = 385.1201, δppm = 0.31); J: structure of hydroxy-p-isoproplylphenyl diphenyl phosphate and identification information (RT = 7.11 min, exact mass = 385.1200, δppm = 0.23).While hydroxylation is shown in each of the structures to occur at the alkylated phenyl ring, it could also occur at an unsubstituted ring or at the isopropyl group.
Discussion
Kinetic Biotransformation Assay
Most of the depletion rates for the 4 OPEs fit a zero-order kinetic model better than a first-order kinetic model, implying that depletion was independent of OPE concentration. Similarly, Greaves et al. (2016) observed a linear depletion rate (i.e. zero-order elimination kinetics) for several OPEs, including TPHP, at a concentration of 2 μM over a 40-minute incubation with 1 mg herring gull liver microsomes.34 However, first-order r2 values were slightly higher for 4tBPDPP and 4IPPDPP than zero-order r2 values at the 1 μM dose (but not at the 10 μM dose), suggesting that enzymatic saturation may have occurred at the 10 μM dose but not at the 1 μM dose for these compounds (Table 2). Interestingly, the depletion rate for TPHP at the 1 μM dose was similar to the depletion rate observed for 2 μM TPHP in herring gull liver microsomes (24 pmol/min/mg versus 22 pmol/min/mg).34 Although the depletion rates were not statistically different for any of the compounds at the 10 μM dose, 2IPPDPP had a significantly slower depletion rate compared to the other three compounds at the 1 μM dose when modeled with zero-order kinetics (ANOVA; p < 0.05) (Figure 1). It is not clear how the presence of an ortho substituent hindered metabolic clearance, however it is possible that a bulky alkyl group at this position results in steric hindrance and disrupts the compound’s interaction with metabolic enzymes. This finding is potentially important because 2IPPDPP is the dominant ITP congener in multiple technical flame retardant mixtures currently on the market.3
In Vitro Biotransformation & Deconjugation Assay
TPHP has been previously found to form glucuronide and sulfate conjugates of OH-TPHP following incubation with human liver S9 fractions.26 Although Van den Eede (2013) found that glucuronide conjugates of OH-TPHP were produced at a higher rate than the sulfated conjugate metabolites, there was no statistical difference in OH-TPHP levels between the two deconjugation enzyme treatment groups in our study (ANOVA; p = 0.9997) (Figure 2). While Van den Eede (2013) detected sulfated and glucuronidated conjugates directly, the sulfatase used in our study is known to have secondary β-glucuronidase activity (>300 units/mg) and the β-glucuronidase used is known to have secondary sulfatase activity which could account for this observation.35 In addition, Van den Eede (2013) relied on peaks areas, which can be influenced by a compound’s ionization efficiency, as a qualitative measure of sulfated and glucuronidated conjugates because authentic standards were unavailable. Future studies should utilize either authentic standards of conjugated metabolites or deconjugation enzymes without residual activity to determine the relative contribution of glucuronide and sulfate conjugates of TPHP.
Another recent metabolism study of TPHP using chicken embryonic hepatocytes found that OH-TPHP glucuronide conjugates were the dominant metabolite of 10 μM TPHP, detecting them at concentrations 3.5 to 12-fold higher than DPHP.24 In our study, OH-TPHP and its conjugates were the dominant metabolites at the 10 μM dose (accounting for up to 30% of the initial TPHP treatment), but DPHP was the dominant metabolite at the 1 μM dose (Table 3). This may suggest that the enzymes catalyzing the hydrolysis of TPHP to DPHP became saturated at the 10 μM dose, causing a dose-related shift in TPHP metabolism to hydroxylation and conjugation, or that the two pathways have different threshold levels of activation. Similarly, other studies have documented that the biotransformation of acetaminophen, bisphenol A, and paracetamol are dose-dependent events.36–38 While OH-TPHP conjugates have been measured in human urine samples, levels of OH-TPHP glucuronide were found to be 50–fold lower than levels of DPHP.25 This could be due to differences between in vivo and in vitro biotransformation, interferences from the multiple precursor parents of DPHP in humans, or potentially dose-related changes in metabolism. Prior in vitro biotransformation studies have explored the metabolism of 10 μM TPHP, however geometric mean urinary concentrations of DPHP have been measured around 10 nM, a much lower concentration at which the hydrolysis pathway could predominate over the hydroxylation/conjugation pathway.13
While Strobel et al. (2018) found that 41% of 4tBPDPP (2 μM) was converted to DPHP following a 100-min incubation with seal and polar bear liver microsomes, only approximately 20% of 4tBPDPP (1 μM) was converted to DPHP following our 60-min S9 incubation in our study (Table 4).22 This discrepancy may have resulted from the difference in incubation time and substrate concentration, or the different sources of 4tBPDPP used in the two studies. Unlike our study, Strobel et al. (2018) did not monitor the formation of tb-PPP, and also obtained 4tBPDPP from a technical mixture with an undetermined composition, which likely contained TPHP (Phillips et al., 2017). Alternatively, the difference may be attributed to interspecies variation, as the percentage of DPHP formation following TPHP incubation with polar bear liver microsomes was also much higher than was observed for human liver microsomes (97% versus 22%, respectively).22,26 To the authors’ knowledge, this is the first investigation of the in vitro metabolism of mono-ITPs, so no data exist for comparison to this study.
Suspect Screening by High Resolution Mass Spectrometry
Mono-(o-isopropenylphenyl)-diphenyl phosphate was previously detected in rabbit bile following gavage administration of a technical mixture containing 35% 2IPPDPP.39 It is possible the formation of these metabolites resulted from an enzymatic driven elimination reaction.27 The cyclic metabolite, 2-phenyl-4H,−4,4-dimethyl-1,1,3,2 -benzodioxapho-sphoran-2-oxide, was also detected in rabbit bile following gavage administration of a technical mixture containing 35% 2IPPDPP.39
Similar to the dehydrogenated metabolite described above, o-hyrdoxy-2IPPDPP was previously detected in rabbit bile.39 In this study, the authors determined that the hydroxyl group was not located at the isopropyl group, but instead located on the isopropyl-substituted ring. We were unable to determine the location of the hydroxyl group; however, it is known that phenyl rings are typically hydroxylated at the para position in the presence of electron donating substituents.40 Because OH-TPHP is a major in vitro metabolite of TPHP, it is not surprising that hydroxylated metabolites of 2IPPDPP and 4IPPDPP are formed during enzymatic biotransformation.25,27 Neither of the hydroxylated-ITP isomers were detected in screened urine samples. However, it is important to note that the urine extraction and cleanup procedure used in this study utilized anion exchange resin optimized for diesters and has not been tested for hydroxylated ITP isomers.
Limitations and Future Directions
The tentative identification of metabolites by high resolution mass spectrometry in this study relied upon exact mass matching and were not supported by complementary MS2 data. It is possible that these chromatographic peaks correspond to other isomers or unrelated compounds with similar exact masses. Although mono-isopropenylphenyl diphenyl phosphate and hydroxy-isopropylphenyl diphenyl phosphate were tentatively identified as novel, human metabolites of 2IPPDPP and 4IPPDPP, their levels were not quantified due to a lack of authentic, commercially available standards. As a result, we were unable to determine if these two compounds accounted for the entirety of the missing mass balance observed for the 2IPPDPP and 4IPPDPP in vitro biotransformation experiments. It is possible that there are other metabolites of 2IPPDPP and 4IPPDPP that were not characterized by our study. In addition, the urine used to screen for these metabolites was collected from children aged 3 to 6 years. Children may metabolize these compounds differently than adults due to the reduced expression of certain metabolic enzymes during development. In fact, the expression of CYP1A2, an enzyme implicated in the oxidative metabolism of TPHP, is known to have a delayed onset in the human liver.41 Finally, it is well known that extrapolation of in vitro metabolic incubations to in vivo biomonitoring studies can be problematic, and this has been demonstrated for other OPEs.25 Because ITP and TBPP isomers are increasingly being used as PBDE substitutes, a better understanding of their in vivo metabolism is necessary to properly document their levels in the human population.21 Moreover, because cyclic metabolites of tri-o-cresyl phosphate have been known to cause acute neurotoxicity, special consideration should be given to the potential formation of cyclic metabolites of ITP and TBPP isomers.42,43
Implications
Taken together, these results provide important insight into the findings of recent human biomonitoring studies. Our data support the observed correlations between ambient exposure to 4tBPDPP and its metabolites in a recent children’s exposure study. In a cohort of 203 children in North Carolina, the correlations between hand wipe levels of 4tBPDPP with urinary DPHP and tp-PPP concentrations were both positive and statistically significant. However, correlations between 4tBPDPP and tb-PPP were stronger than those between 4tBPDPP and DPHP (0.38 versus 0.19, respectively).13 Our study showed that 4tBPDPP is primarily metabolized to tb-PPP rather than DPHP in vitro (33% versus 19% of initial parent treatment, respectively for the +S9 treatment at 1 μM) (Table 4). Thus, tb-PPP appears to be a more appropriate biomarker of exposure to TBPP isomers than DPHP (a compound with multiple parent sources). Our in vitro studies also show that mono-ITPs can be metabolized to both DPHP and ip-PPP, but that relatively more DPHP is formed. Likewise, in a cross-sectional study of 40 adults in North Carolina that wore silicone wristbands as personal passive samplers for one week, wristband levels of 2IPPDPP and 4IPPDPP were correlated with urinary DPHP but not ip-PPP.18 In rats dosed with the Firemaster® 550, a mixture containing both TPHP and ITP isomers, a disproportionately higher level of DPHP was detected in the urine of dosed rats compared to ip-PPP.17
Because DPHP is a metabolite of multiple parent compounds including resorcinol bis(diphenyl phosphate) (RDP), TPHP, EHDPP, TBPP isomers, and ITP isomers, its utility as an exposure biomarker is unclear.20,26,44 Yet, other than ip-PPP, no specific biomarkers for ITP exposure currently exist. Because most glucuronide conjugates are known to be excreted in bile, it is possible that these and other ITP metabolites are present in human feces.39 Unfortunately, the collection and analysis of feces presents analytical challenges that have precluded its assessment as a biospecimen in the human biomonitoring of OPEs to date. Our study identified new metabolites of mono-ITP isomers, namely mono-isopropenylphenyl diphenyl phosphate and hydroxy-isopropylphenyl diphenyl phosphate, which warrant further study especially if authentic standards become commercially available.
Additionally, our results highlight the complicated nature of parent exposure estimation relying on a single urinary biomarker. While much of the research advancing the use of specific OPE biomarkers has focused on TPHP, very little biomarker research has been conducted with regards to ITP and TBPP isomers. Because monitoring exposure to ITPs and TBPPs using specific biomarkers is necessary to evaluate the potential risks arising from chronic exposure, more research is warranted to determine the suitability of candidate ITP and TBPP biomarkers tentatively identified in this study.
Supplementary Material
Funding Information
This work was funded by the National Institute of Environmental Health Sciences (R01 ES016099 to H.M.S. and T32-ES021432 to A.L.P.). This work was also supported by an American College of Toxicology North American Graduate Fellowship and P.E.O. Scholar Award A.L.P.
References
- (1).Weil ED; Levchik S; Moy P Flame and Smoke Retardants in Vinyl Chloride Polymers – Commercial Usage and Current Developments. J. Fire Sci 2016, 24 (3), 211–236. [Google Scholar]
- (2).Cooper EM; Kroeger G; Davis K; Clark CR; Ferguson PL; Stapleton HM Results from Screening Polyurethane Foam Based Consumer Products for Flame Retardant Chemicals: Assessing Impacts on the Change in the Furniture Flammability Standards. Environ. Sci. Technol 2016, 50 (19), 10653–10660. [DOI] [PMC free article] [PubMed] [Google Scholar]
- (3).Phillips AL; Hammel SC; Konstantinov A; Stapleton HM Characterization of Individual Isopropylated and tert-Butylated Triarylphosphate (ITP and TBPP) Isomers in Several Commercial Flame Retardant Mixtures and House Dust Standard Reference Material SRM 2585. Environ. Sci. Technol 2017, 51 (22), 13443–13449. [DOI] [PMC free article] [PubMed] [Google Scholar]
- (4).Glazer L; Hawkey AB; Wells CN; Drastal M; Odamah KA; Behl M; Levin ED Developmental Exposure to Low Concentrations of Organophosphate Flame Retardants Causes Life-Long Behavioral Alterations in Zebrafish. Toxicol. Sci 2018, 165, 487–498. [DOI] [PMC free article] [PubMed] [Google Scholar]
- (5).Alzualde A; Behl M; Sipes NS; Hsieh JH; Alday A; Tice RR; Paules RS; Muriana A; Quevedo C Toxicity profiling of flame retardants in zebrafish embryos using a battery of assays for developmental toxicity, neurotoxicity, cardiotoxicity and hepatotoxicity toward human relevance. Neurotoxicol. Teratol 2018, 70, 40–50. [DOI] [PubMed] [Google Scholar]
- (6).McGee SP; Konstantinov A; Stapleton HM; Volz DC Aryl phosphate esters within a major PentaBDE replacement product induce cardiotoxicity in developing zebrafish embryos: potential role of the aryl hydrocarbon receptor. Toxicol. Sci 2013, 133 (1), 144–156. [DOI] [PubMed] [Google Scholar]
- (7).Fang M; Webster TF; Stapleton HM Activation of Human Peroxisome Proliferator-Activated Nuclear Receptors (PPARγ1) by Semi-Volatile Compounds (SVOCs) and Chemical Mixtures in Indoor Dust. Environ. Sci. Technol 2015, 49 (16), 10057–10064. [DOI] [PMC free article] [PubMed] [Google Scholar]
- (8).Kassotis CD; Hoffman K; Stapleton HM Characterization of Adipogenic Activity of House Dust Extracts and Semi-Volatile Indoor Contaminants in 3T3-L1 Cells. Environ. Sci. Technol 2017, 51 (15), 8735–8745. [DOI] [PMC free article] [PubMed] [Google Scholar]
- (9).Pillai HK; Fang M; Beglov D; Kozakov D; Vajda S; Stapleton HM; Webster TF; Schlezinger JJ Ligand Binding and Activation of PPARγ by Firemaster 550: Effects on Adipogenesis and Osteogenesis in Vitro. Environ. Health Perspect 2014, 122 (11), 1225–1232. [DOI] [PMC free article] [PubMed] [Google Scholar]
- (10).Doherty BT; Hoffman K; Keil AP; Engel SM; Stapleton HM; Goldman BD; Olshan AF; Daniels JL Prenatal exposure to organophosphate esters and cognitive development in young children in the Pregnancy, Infection, and Nutrition Study. Environ. Res 2019, 169, 33–40. [DOI] [PMC free article] [PubMed] [Google Scholar]
- (11).Carignan CC; Mínguez-Alarcón L; Butt CM; Williams PL; Meeker JD; Stapleton HM; Toth TL; Ford JB; Hauser R Urinary Concentrations of Organophosphate Flame Retardant Metabolites and Pregnancy Outcomes among Women Undergoing in Vitro Fertilization. Environ. Health Perspect 2017, 125 (8): 087018. [DOI] [PMC free article] [PubMed] [Google Scholar]
- (12).Hoffman K; Stapleton HM; Lorenzo A; Butt CM; Adair L; Herring AH; Daniels JL Prenatal exposure to organophosphates and associations with birthweight and gestational length. Environ. Int 2018, 116, 248–254. [DOI] [PMC free article] [PubMed] [Google Scholar]
- (13).Phillips AL; Hammel SC; Hoffman K; Lorenzo AM; Chen A; Webster TF; Stapleton HM Children’s residential exposure to organophosphate ester flame retardants and plasticizers: Investigating exposure pathways in the TESIE study. Environ. Int 2018, 116, 176–185. [DOI] [PMC free article] [PubMed] [Google Scholar]
- (14).Hammel SC; Phillips AL; Hoffman K; Stapleton HM Evaluating the Use of Silicone Wristbands to Measure Personal Exposure to Brominated Flame Retardants. Environ. Sci. Technol 2018, 52 (20), 11875–11885. [DOI] [PMC free article] [PubMed] [Google Scholar]
- (15).Guan Q; Tan H; Yang L; Liu X; Fiedler H; Li X; Chen D Isopropylated and tert-butylated triarylphosphate isomers in house dust from South China and Midwestern United States. Sci. Total Environ 2019, 686, 1113–1119. [DOI] [PubMed] [Google Scholar]
- (16).Ingle ME; Mínguez-Alarcón L; Carignan CC; Butt CM; Stapleton HM; Williams PL; Ford JB; Hauser R; Meeker JD The association of urinary phosphorous-containing flame retardant metabolites and self-reported personal care and household product use among couples seeking fertility treatment. J. Expo. Sci. Environ. Epidemiol 2020, 30 (1), 107–116. [DOI] [PMC free article] [PubMed] [Google Scholar]
- (17).Phillips AL; Chen A; Rock KD; Horman B; Patisaul HB; Stapleton HM Transplacental and Lactational Transfer of Firemaster® 550 Components in Dosed Wistar Rats. Toxicol. Sci 2016, 153 (2), 246–257. [DOI] [PMC free article] [PubMed] [Google Scholar]
- (18).Hammel S; Hoffman K; Webster TF; Anderson KA; Stapleton HM Measuring Personal Exposure to Organophosphate Flame Retardants using Silicone Wristbands and Hand Wipes. Environ. Sci. Technol 2016, 50 (8), 4483–4491. [DOI] [PMC free article] [PubMed] [Google Scholar]
- (19).Hoffman K; Hammel SC; Phillips AL; Lorenzo AM; Chen A; Calafat AM; Ye X; Webster TF; Stapleton HM Biomarkers of exposure to SVOCs in children and their demographic associations: The TESIE Study. Environ. Int 2018, 119, 26–36. [DOI] [PMC free article] [PubMed] [Google Scholar]
- (20).Ballesteros-Gómez A; Erratico CA; Eede N Van den; Ionas AC; Leonards PEG; Covaci A In vitro metabolism of 2-ethylhexyldiphenyl phosphate (EHDPHP) by human liver microsomes. Toxicol. Lett 2015, 232, 203–212. [DOI] [PubMed] [Google Scholar]
- (21).Cooper EM; Covaci A; van Nuijs ALN; Webster TF; Stapleton HM Analysis of the flame retardant metabolites bis(1,3-dichloro-2-propyl) phosphate (BDCPP) and diphenyl phosphate (DPP) in urine using liquid chromatography-tandem mass spectrometry. Anal. Bioanal. Chem 2011, 401 (7), 2123–2132. [DOI] [PMC free article] [PubMed] [Google Scholar]
- (22).Strobel A; Letcher RJ; Willmore WG; Sonne C; Dietz R Structure-Dependent in Vitro Metabolism of Alkyl-Substituted Analogues of Triphenyl Phosphate in East Greenland Polar Bears and Ringed Seals. Environ. Sci. Technol. Lett 2018, 5, 214–219. [Google Scholar]
- (23).Shen J; Zhang Y; Yu N; Crump D; Li J; Su H; Letcher RJ; Su G Organophosphate Ester, 2-Ethylhexyl Diphenyl Phosphate (EHDPP), Elicits Cytotoxic and Transcriptomic Effects in Chicken Embryonic Hepatocytes and Its Biotransformation Profile Compared to Humans. Environ. Sci. Technol 2019, 53 (4), 2151–2160. [DOI] [PubMed] [Google Scholar]
- (24).Su G; Letcher RJ; Crump D; Gooden DM; Stapleton HM In Vitro Metabolism of the Flame Retardant Triphenyl Phosphate in Chicken Embryonic Hepatocytes and the Importance of the Hydroxylation Pathway. Environ. Sci. Technol. Lett 2015, 2 (4), 100–104. [Google Scholar]
- (25).Su G; Letcher RJ; Yu H; Gooden DM; Stapleton HM Determination of glucuronide conjugates of hydroxyl triphenyl phosphate (OH-TPHP) metabolites in human urine and its use as a biomarker of TPHP exposure. Chemosphere 2016, 149, 314–319. [DOI] [PubMed] [Google Scholar]
- (26).Van den Eede N; Maho W; Erratico C; Neels H; Covaci A First insights in the metabolism of phosphate flame retardants and plasticizers using human liver fractions. Toxicol. Lett 2013, 223 (1), 9–15. [DOI] [PubMed] [Google Scholar]
- (27).Zhang Q; Ji S; Chai L; Yang F; Zhao M; Liu W; Schüürmann G; Ji L Metabolic Mechanism of Aryl Phosphorus Flame Retardants by Cytochromes P450: A Combined Experimental and Computational Study on Triphenyl Phosphate. Environ. Sci. Technol 2018, 52 (24), 14411–14421. [DOI] [PubMed] [Google Scholar]
- (28).Kirby AJ; Varvoglis AG The Reactivity of Phosphate Esters. Monoester Hydrolysis. J. Am. Chem. Soc 1967, 89 (2), 415–423. [Google Scholar]
- (29).Su G; Letcher RJ; Yu H Organophosphate Flame Retardants and Plasticizers in Aqueous Solution: PH-Dependent Hydrolysis, Kinetics, and Pathways. Environ. Sci. Technol 2016, 50 (15), 8103–8111. [DOI] [PubMed] [Google Scholar]
- (30).Butt CM; Congleton J; Hoffman K; Fang M; Stapleton HM Metabolites of organophosphate flame retardants and 2-ethylhexyl tetrabromobenzoate in urine from paired mothers and toddlers. Environ. Sci. Technol 2014, 48 (17), 10432–10438. [DOI] [PubMed] [Google Scholar]
- (31).Stapleton HM; Klosterhaus S; Eagle S; Fuh J; Meeker JD; Blum A; Webster TF Detection of organophosphate flame retardants in furniture foam and U.S. house dust. Environ. Sci. Technol 2009, 43, 7490–7495. [DOI] [PMC free article] [PubMed] [Google Scholar]
- (32).Antweiler RC; Taylor HE Evaluation of Statistical Treatments of Left-Censored Environmental Data using Coincident Uncensored Data Sets: I. Summary Statistics. Environ. Sci. Technol 2008, 42 (10), 3732–3738. [DOI] [PubMed] [Google Scholar]
- (33).Van Den Eede N; Maho W; Erratico C; Neels H; Covaci A First insights in the metabolism of phosphate flame retardants and plasticizers using human liver fractions. Toxicol. Lett 2013, 223, 9–15. [DOI] [PubMed] [Google Scholar]
- (34).Greaves AK; Su G; Letcher RJ Environmentally relevant organophosphate triesters in herring gulls: In vitro biotransformation and kinetics and diester metabolite formation using a hepatic microsomal assay. Toxicol. Appl. Pharmacol 2016, 308, 59–65. [DOI] [PubMed] [Google Scholar]
- (35).Brand W; Van Der Wel PAI; Rein MJ; Barron D; Williamson G; Van Bladeren PJ; Rietjens IMCM Metabolism and transport of the citrus flavonoid hesperetin in Caco-2 cell monolayers. Drug Metab. Dispos 2008, 36, 1794–1802. [DOI] [PubMed] [Google Scholar]
- (36).Domoradzki JY; Thornton CM; Pottenger LH; Hansen SC; Card TL; Markham DA; Dryzga MD; Shiotsuka RN; Waechter JM Age and dose dependency of the pharmacokinetics and metabolism of bisphenol A in neonatal sprague-dawley rats following oral administration. Toxicol. Sci 2004, 77, 230–242. [DOI] [PubMed] [Google Scholar]
- (37).Kane RE; Tector J; Brems JJ; Li AP; Kaminski DL Sulfation and glucuronidation of acetaminophen by cultured hepatocytes replicating in vivo metabolism. ASAIO Trans. 1980, 36, M607–M610. [PubMed] [Google Scholar]
- (38).Prescott L Kinetics and metabolism of paracetamol and phenacetin. Br. J. of Clin. Pharmacol 1980, 10 (Suppl. 2), 291S–298S. [DOI] [PMC free article] [PubMed] [Google Scholar]
- (39).Yang SM; Thieme RA; von Meyerinck L; Benthe HF Identification of cyclic metabolites of isopropylated phenyl phosphates in rabbit bile. Biol. Mass Spectrom 1990, 19, 573–576. [DOI] [PubMed] [Google Scholar]
- (40).Bugnon R; Biosciences A The Biochemistry of Drug Metabolism. Chem. Biodivers 2006, 3, 1053–1101. [DOI] [PubMed] [Google Scholar]
- (41).Sonnier M; Cresteil T Delayed ontogenesis of CYP1A2 in the human liver. Eur. J. Biochem 1998, 251, 893–898. [DOI] [PubMed] [Google Scholar]
- (42).Casida JE; Eto M; Baron RL Biological activity of a tri-o-cresyl phosphate metabolite. Nature 1961, 191, 1396–1397. [DOI] [PubMed] [Google Scholar]
- (43).Eto M; Casida JE; Eto T Hydroxylation and cyclization reactions involved in the metabolism of tri-O-cresyl phosphate. Biochem. Pharmacol 1962, 11, 337–352. [DOI] [PubMed] [Google Scholar]
- (44).Ballesteros-Gómez A; Van Den Eede N; Covaci A In vitro human metabolism of the flame retardant resorcinol Bis(diphenylphosphate) (RDP). Environ. Sci. Technol 2015, 49 (6), 3897–3904. [DOI] [PubMed] [Google Scholar]
Associated Data
This section collects any data citations, data availability statements, or supplementary materials included in this article.