Abstract
INTRODUCTION:
Our study aimed at investigating tumor heterogeneity in esophageal adenocarcinoma (EAC) cells regarding clinical outcomes.
METHODS:
Thirty-eight surgical EAC cases who underwent gastroesophageal resection with lymph node dissection in 3 university centers were included. Archival material was analyzed via high-throughput cell sorting technology and targeted sequencing of 63 cancer-related genes. Low-pass sequencing and immunohistochemistry (IHC) were used to validate the results.
Results
Thirty-five of 38 EACs carried at least one somatic mutation that was absent in the stromal cells; 73.7%, 10.5%, and 10.5% carried mutations in tumor protein 53, cyclin dependent kinase inhibitor 2A, and SMAD family member 4, respectively. In addition, 2 novel mutations were found for hepatocyte nuclear factor-1 alpha in 2 of 38 cases. Tumor protein 53 gene abnormalities were more informative than p53 IHC. Conversely, loss of SMAD4 was more frequently noted with IHC (53%) and was associated with a higher recurrence rate (P = 0.015). Only through cell sorting we were able to detect the presence of hyperdiploid and pseudodiploid subclones in 7 EACs that exhibited different mutational loads and/or additional copy number amplifications, indicating the high genetic heterogeneity of these cancers.
DISCUSSION:
Selective cell sorting allowed the characterization of multiple molecular defects in EAC subclones that were missed in a significant number of cases when whole-tumor samples were analyzed. Therefore, this approach can reveal subtle differences in cancer cell subpopulations. Future studies are required to investigate whether these subclones are responsible for treatment response and disease recurrence.
INTRODUCTION
The incidence of esophageal adenocarcinomas (EACs) is increasing, and the survival rate is low despite the adoption of aggressive therapeutic protocols (1). Inadequate knowledge of cancer biology has resulted in difficulties in prevention, early diagnostic programs, and modalities of therapy for these cancers. Gastroesophageal reflux disease and Barrett's esophagus have been recognized as risk factors, as have obesity and cigarette smoking (2). At the cellular level, progression to EAC is underlined by continuous DNA damage caused by reflux and related chronic inflammation that increase the mutation rate and promote genomic instability (3).
Pathology discriminates different histological subtypes according to the Lauren classification (4,5) that may have different grades of aggressiveness (6) and response to chemotherapy, according to recent research (7,8). The American Joint Committee on Cancer tumor, node and metastasis staging system considers EAC as a single entity (9,10), although different biological behaviors imply that EAC may be consistently heterogeneous (11,12).
Recent studies at the genetic level included EAC in a group of tumors with one of the most frequent rates of copy number alterations (CNAs) and somatic structural rearrangements (13). Moreover, EAC is characterized by a high mutation frequency. Large-scale sequencing studies revealed 3 distinct mutational signatures in EAC: (i) enrichment for the BReast CAncer gene signature, with prevalent defects in the homologous recombination pathway; (ii) dominant T>G mutation pattern associated with a high mutational load and neoantigen burden; and (iii) C>A/T mutation pattern with evidence of an aging imprint (14). However, related studies have thus far only analyzed DNA derived from whole-tumor samples that are composed of cancer cells and stromal and infiltrating immune cells. Therefore, the real status of somatic mutations in cancer cells might be masked by the presence of stromal cells, although data on different subclones carrying different cellular mutational profiles are scarce.
This is of great importance for better understanding the highly mutational behavior of this cancer that is frequently associated with therapy resistance and tumor escape. Indeed, identification of coexisting mutational subpopulations will be required for the selection of adequate molecular therapies.
Our study aimed to (i) compare intratumor and intertumor heterogeneity in whole-tumor vs sorted cell populations and (ii) correlate tumor-specific mutational profiles with clinical outcomes, i.e., recurrence and survival. We combined a high-throughput cell sorting/recovery workflow with next-generation sequencing (NGS) technologies to separate and analyze different cancer cell populations and the corresponding normal (stromal) cells.
MATERIALS AND METHODS
The study material was obtained from formalin-fixed, paraffin-embedded blocks of chemotherapy- and radiotherapy-naive EACs (see Table 1, Supplementary Digital Content 1, http://links.lww.com/CTG/A379). Hematoxylin and eosin–stained slides from all blocks were inspected to identify the tumor areas. NGS on the sorted cell populations was performed for 63 cancer-related genes (mean depth 4,000X) (15).A detailed protocol for high-throughput cell sorting, targeted NGS, droplet digital PCR, and Sanger sequencing is reported in the Supplementary Information (Supplementary Digital Content 1, http://links.lww.com/CTG/A379) (15–17).
p53 and SMAD family member 4 immunohistochemistry
Immunohistochemistry (IHC) for p53 was performed with an anti-p53 mouse monoclonal antibody (clone DO-7, Ventana, Roche Diagnostics GmbH, Mannheim, Germany) on a Benchmark XT immunostainer (Ventana, Roche). IHC was validated with positive (an external positive control put on the slide) and negative (primary antibody omission) controls. p53 immunostaining was defined as overexpressed if there was evidence of strong and diffuse nuclear immunoreactivity (16).
HC for SMAD family member 4 (SMAD4) was performed with an anti-SMAD4 mouse monoclonal antibody (clone B-8; Santa Cruz Biotechnology, Dallas, TX) (18). IHC was validated using positive (non-neoplastic mucosa and lymphoid cells) and negative (primary antibody omission) controls. SMAD4 protein loss was defined by a complete loss of expression in at least 30% of cancer cells using the same cutoff score identified for colon cancer in our previously published work (18,19).
Statistical analysis
Differences in frequency data were analyzed using χ2 or Fisher tests as appropriate. We used the Mann-Whitney test to analyze continuous variables. Survival was assessed using the Kaplan-Meier and logrank tests. The detailed statistical methods are reported in the Supporting Information.
Analysis of agreement/correlation was calculated using the Cohen kappa (κ) coefficient (20,21). κ values ≤ 0 indicated no agreement and 0.01–0.20 as none to slight, 0.21–0.40 as fair, 0.41–0.60 as moderate, 0.61–0.80 as substantial, and 0.81–1.00 as almost perfect agreement.
Ethics committee approval
This study received approval (#L3P1223) from the Ethical Committee “Comitato Etico IRST IRCCS AVR (CEIIAV)”–Italy (Reg. Sper. 109/2016 Protocol 7353/51/2016), and written informed consent was obtained from all patients before inclusion in the study.
RESULTS
Using formalin-embedded material of 38 EAC cases, stromal and tumor cell populations were sorted based on immunoreactivity to antibodies against vimentin/pan-cytokeratin and high-throughput cell sorting technology. The proportional DNA contents were obtained according to 4',6-diamidino-2-phenylindole fluorescence. Target sequencing of the DNA extracted from the whole-tumor samples, and sorted cell populations were performed for 63 cancer-related genes.
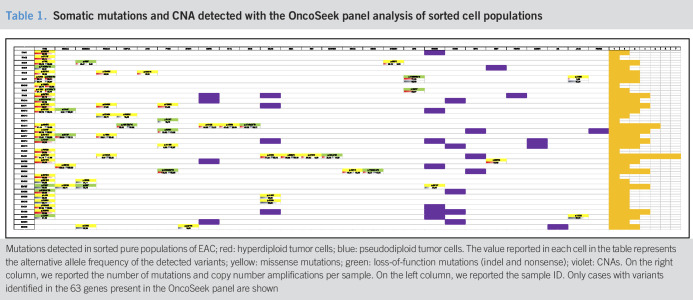
We found 61 point mutations (missense, nonsense, and frameshift) across 63 genes by targeted sequencing when whole-tumor samples were analyzed, with 9 more somatic mutations via sequencing of the sorted tumor cells (see Figure 1a, Supplementary Digital Content 2, http://links.lww.com/CTG/A376). On cell sorting, at least one somatic alteration (point mutation, small insertion/deletion, or copy-number alteration), which was not present in the corresponding sorted stromal cells, was revealed in 35 of 38 EACs analyzed (Table 1). It is interesting to note that despite the high sequencing coverage, the allele frequencies of gene mutations were greater in the sorted cells, where most variants are found in the homozygous state (the number of reads supporting the alternative allele was >80%). Instead, the analysis of unsorted heterogeneous tumor samples revealed an abundance of low-frequency genetic variants (under 20%) that were below the limit of detection of conventional NGS analysis at lower coverage (below 4,000X) (see Figure 1b, Supplementary Digital Content 2, http://links.lww.com/CTG/A376). Furthermore, in 5 cases, mutations in hepatocyte nuclear factor-1 alpha (HNF1A), phosphatase and tensin homolog, tumor protein 53 (TP53), and serine/threonine kinase 11 were missed because of a very low percentage of alternative alleles in the analysis of the unsorted material.
Table 1.
Somatic mutations and CNA detected with the OncoSeek panel analysis of sorted cell populations
 |
Mutations detected in sorted pure populations of EAC; red: hyperdiploid tumor cells; blue: pseudodiploid tumor cells. The value reported in each cell in the table represents the alternative allele frequency of the detected variants; yellow: missense mutations; green: loss-of-function mutations (indel and nonsense); violet: CNAs. On the right column, we reported the number of mutations and copy number amplifications per sample. On the left column, we reported the sample ID. Only cases with variants identified in the 63 genes present in the OncoSeek panel are shown
CNA analysis
In 5 EAC cases, only one of the 63 genes that were analyzed was mutated or had CNA, whereas the remaining cases presented alterations in multiple genes (Table 1).
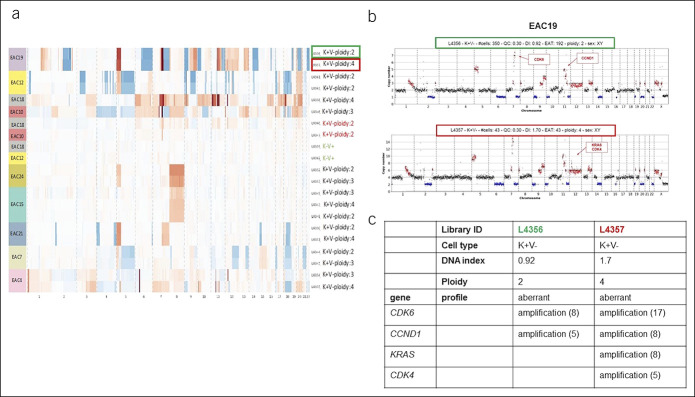
All stromal populations had a DNA index (DI) of 1, indicating a normal diploid DNA content. Most cancer populations showed a DI higher than 1 that is indicative of a hyperdiploid DNA content; others showed a pseudodiploid DNA content (DI = 1), more resembling the profile of normal stromal cells. In 13 EAC cases, we were able to isolate both hyperdiploid and pseudodiploid tumor clones. Nine of 13 cases were further analyzed by low-pass whole-genome analysis to verify whether pseudodiploid cells also showed an aberrant genomic profile. Among the 9 cases, 2 cytokeratin-positive pseudodiploid cell populations showed a normal copy number profile (true-diploid) resembling the corresponding stromal cells, whereas the other 7 cases showed aberrant copy number profiles (Figure 1a). These 7 cases actually contained the hyperdiploid populations with different single-nucleotide mutational loads. In 2 of these cases (EAC19 and EAC4), additional CNAs were detected in hyperdiploid cells compared with those identified in the corresponding pseudodiploid populations. It is likely that these subclones might have developed during tumor progression (Figure 1b,c).
Figure 1.
High-throughput image-based cell sorting and analysis of recovered cell populations. (a) CNV profiles inferred from low-pass whole-genome sequencing for different cell populations for 9 EACs, sorted based on antibodies against vimentin/pancytokeratin and based on the 4',6-diamidino-2-phenylindole signal. Gains and losses regarding the estimated main ploidy are shown in red and in blue, respectively. (b) Low-pass whole-genome profile (chr1-22 and chrX) for 2 keratin-positive cell populations (L4356, pseudodiploid cells, green box; L4357 hyperdiploid cells, red box) sorted from sample EAC19. Ploidy values are indicated on the y-axis; on the x-axis, the alteration of different chromosomes is plotted with different colors. CNAs in the tumoral cells are indicated in red (amplification) and blue (deletion). (c) Principal CNAs identified in pseudodiploid (L4356) and hyperdiploid cell populations (L4357) in EAC19. An approximate copy number value is indicated in brackets. CNA, copy number alteration; CNV, clustering of copy number variation; EAC, esophageal adenocarcinoma.
Identification of mutations in HNF1A, a novel mutated gene in EAC
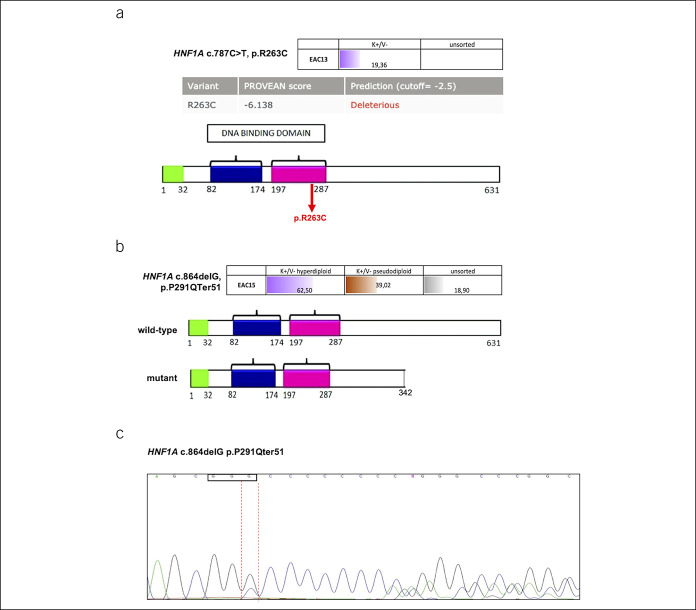
We identified mutations in HNF1A, a gene not previously found to be mutated in EAC. This gene encodes a transcription factor that acts as a tumor suppressor in pancreatic cancer (22). We identified 2 HNF1A mutations: a missense mutation (p.R263C), occurring in a residue important for DNA binding (Figure 2a) and a deletion (c.864delG) mutation, resulting in a frameshift mutation with a premature stop codon (Figure 2b). The HNF1A frameshift mutation, identified in the sorted tumor population, was confirmed with Sanger sequencing (Figure 2c). The mutations in this gene were found in conjunction with mutations in other genes: the p.R263C change was found in conjunction with a somatic mutation of phosphatidylinositol-4,5-bisphosphate 3-kinase catalytic subunit alpha. The frameshift change was found with TP53, epidermal growth factor receptor, FMS-like tyrosine kinase 3, and isocitrate dehydrogenase (NADP(+)) 2 mutations (Table 1).
Figure 2.
Hepatocyte nuclear factor-1 alpha (HNF1A) mutations identified in the sorted populations of tumors with hyperdiploid (violet) and pseudodiploid (brown) DNA content and in unsorted fractions (gray). Values represent the alternative allele frequency. (a) Frequency of the variant allele HNF1A missense mutation p.R263C in the hyperdiploid tumor cell population (violet) (upper panel). The variant pathogenicity was evaluated using Protein Variation Effect Analyzer. The protein domains are shown in the lower panel. The missense mutation (red arrow) is indicated. (b) Frequency of the variant allele HNF1A deletion (c.864delG) in the different sorted tumor populations (hyperdiploid in violet and pseudodiploid in brown) (upper panel) and prediction of the stop codon inserted by the frameshift mutation into the mutant protein (lower panel). (c) Sanger sequencing of the HNF1A p.P291Qter51 frameshift mutation in DNA isolated from the corresponding formalin-fixed, paraffin-embedded block of EAC15.
Identification of mutations in TP53 and p53-regulated genes
We detected mutations in TP53 in 28/38 cases (73.7%). In 4 cases, we observed mutations in cyclin dependent kinase inhibitor 2A, a p53-regulated target (Table 1).
The TP53 p.R273H hotspot mutation—found at a low percentage in unsorted tumor tissue samples of EAC6, EAC11, and EAC26—and the nonsense mutation in cyclin dependent kinase inhibitor 2A (p.R58*)—detected in sample EAC4—were confirmed by droplet digital PCR (see Figures 2a,b, Supplementary Digital Content 3, http://links.lww.com/CTG/A377).
A total of 22 TP53 missense changes, 2 of which are classified as functional in International Agency for Research on Cancer TP53 database (http://p53.iarc.fr/) based on overall transcriptional activity, and 8 loss-of-function (stop codon/frameshift) changes were detected in our EAC samples. In 2 cases, both missense and loss-of-function changes were present in the samples (see Table 2, Supplementary Digital Content 1, http://links.lww.com/CTG/A379).
Selective sorting identifies high intratumor heterogeneity
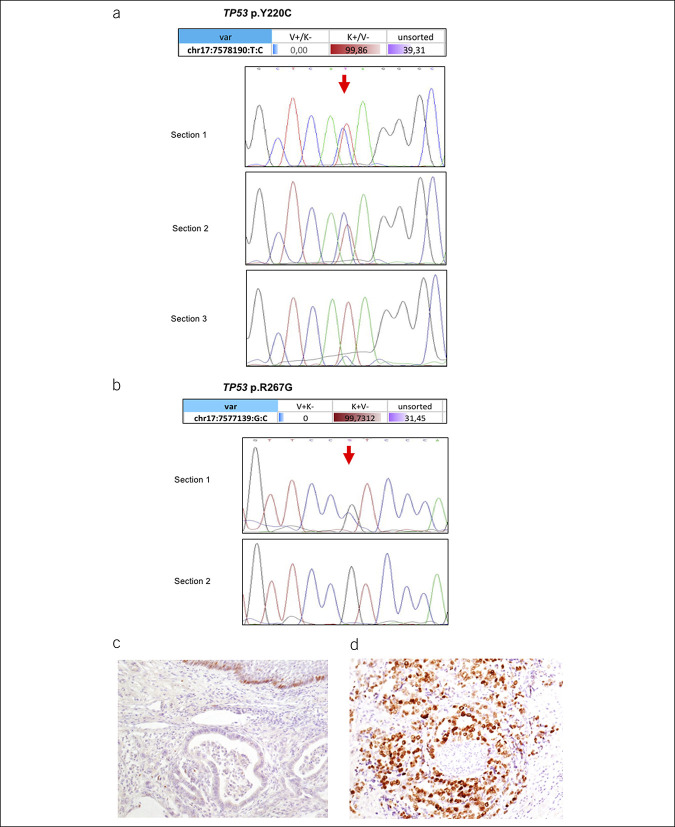
The presence of high intratumor heterogeneity was supported by further validation of the mutations identified in the sorted cell populations. In particular, in EAC36, we found the TP53 missense mutation p.Y220C in 59.77% and in 99.86% of the NGS reads obtained from the 2 subclones of the sorted tumor cells. We confirmed the mutation with Sanger sequencing in 2 of 3 sections from the same formalin-fixed, paraffin-embedded block. Analysis of the third section revealed a very low variant allele peak, almost below the detection threshold of Sanger sequencing, because of the presence of different cell types within the cancer area (Figure 3a).
Figure 3.
Tumor protein 53 (TP53) mutations and correlation with expression in EAC. (a) TP53 p.Y220C mutation in the sorted pure populations of tumor cells (red), stromal cells (blue), and unsorted cell fractions (violet). Values represent the alternative allele frequency (upper panel). Lower panel: Sanger sequencing of DNA isolated from 3 different tissue sections of the same tumor tissue block, showing the presence of the mutation as a heterozygous change in only sections 1 and 2 (red arrow). (b) TP53 p.R267G mutation in the sorted pure populations of tumor cells (red), stromal cells (blue), and unsorted cell fractions (violet). (c) Immunohistochemistry indicating low p53 protein expression in a case with a normal p53 gene status (hematoxylin was used as a counterstain). (d) Immunohistochemistry for p53 in a case of gene mutation and protein overexpression.
We identified a TP53 mutation (p.R267G) in EAC32 in a homozygous state in the sorted tumor cell population. Sanger sequencing of 2 different sections (unsorted material) from the same tumor tissue block identified this TP53 mutation only in one section, confirming the intratumor heterogeneity of these cancers (Figure 3b).
Correlation between TP53 mutations and survival
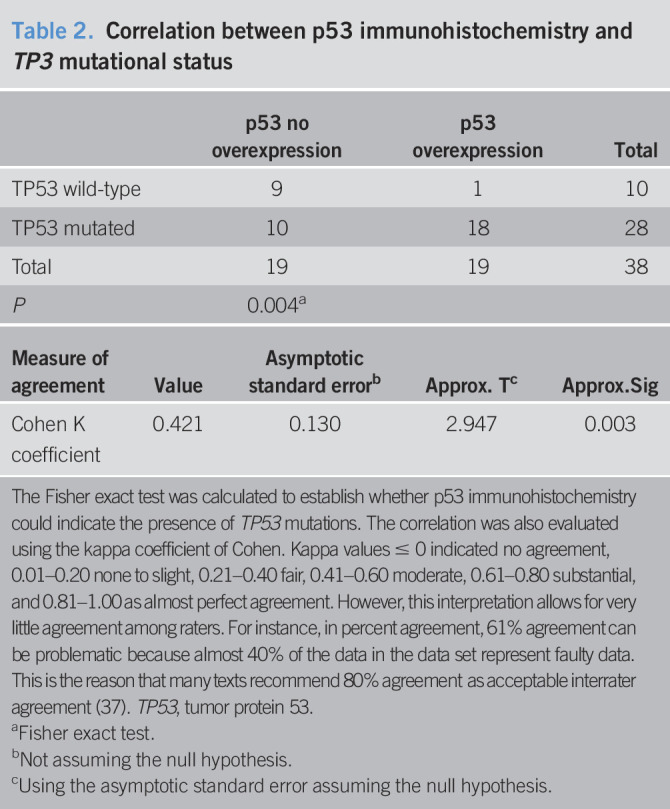
We performed an immunohistochemical analysis for the p53 protein in all 38 cases and observed a significant correlation between p53 protein overexpression and the presence of mutations, in line with previous data (P = 0.004, Fisher exact test; Table 2; Figure 3c,d) (23,24).
Table 2.
Correlation between p53 immunohistochemistry and TP3 mutational status
| p53 no overexpression | p53 overexpression | Total | |
| TP53 wild-type | 9 | 1 | 10 |
| TP53 mutated | 10 | 18 | 28 |
| Total | 19 | 19 | 38 |
| P | 0.004a |
| Measure of agreement | Value | Asymptotic standard errorb | Approx. Tc | Approx.Sig |
| Cohen K coefficient | 0.421 | 0.130 | 2.947 | 0.003 |
The Fisher exact test was calculated to establish whether p53 immunohistochemistry could indicate the presence of TP53 mutations. The correlation was also evaluated using the kappa coefficient of Cohen. Kappa values ≤ 0 indicated no agreement, 0.01–0.20 none to slight, 0.21–0.40 fair, 0.41–0.60 moderate, 0.61–0.80 substantial, and 0.81–1.00 as almost perfect agreement. However, this interpretation allows for very little agreement among raters. For instance, in percent agreement, 61% agreement can be problematic because almost 40% of the data in the data set represent faulty data. This is the reason that many texts recommend 80% agreement as acceptable interrater agreement (37). TP53, tumor protein 53.
Fisher exact test.
Not assuming the null hypothesis.
Using the asymptotic standard error assuming the null hypothesis.
Nevertheless, there was a discordance between IHC immunoreactivity and the presence of mutations in 10 cases. In these 10 EACs, we identified 6 truncating mutations (stop codon or frameshift changes) and 5 missense mutations, 3 of which classified as nonfunctional according to International Agency for Research on Cancer TP53 database (see Table 2, Supplementary Digital Content 1, http://links.lww.com/CTG/A379). We evaluated the concordance between p53 IHC and TP53 mutational status also using the Cohen κ coefficient. The level of agreement was moderate (κ coefficient = 0.421, P = 0.003; Table 2). Based on our results, p53 IHC staining showed a sensitivity of 64% and a specificity of 90%, with a positive predictive value of 95% and a negative predictive value of 47%, leading to an accuracy of 71% for the estimation of mutations in TP53 gene (see Table 3, Supplementary Digital Content 1, http://links.lww.com/CTG/A379). Although the small sample size would impair a robust statistical assessment of recurrence and survival, we carried out a preliminary analysis for these clinical outcomes. In our cohort of cancers, not treated with preoperative radiotherapy or chemotherapy, p53 immunostaining could not predict survival outcomes (see Figure 3a,b, Supplementary Digital Content 4, http://links.lww.com/CTG/A378), whereas TP53 mutation status seemed to correlate with cancer-specific and disease-free survival (5-year survival rates of 15% and 15% for patients with normal TP53 status vs 43% and 40.2% for patients with TP53 mutations; logrank P = 0.028 and P = 0.037, respectively, see Figure 3c,d, Supplementary Digital Content 4, http://links.lww.com/CTG/A378).
We observed a different distribution of TP53 mutations in the histological subtypes defined according to the Lauren classification, i.e., intestinal vs diffuse types. In our sample, 77.4% of intestinal cases (a histological type associated with better outcomes) (6–8) had TP53 mutations, with a statistically significant differences in frequency distribution (χ2 test: P = 0.0023). This finding was not observed for the diffuse type of cancers (χ2 test: P = 0.7055); however, the number of diffuse cases was relatively small (see Table 4, Supplementary Digital Content 1, http://links.lww.com/CTG/A379).
SMAD4 loss is associated with cancer recurrence
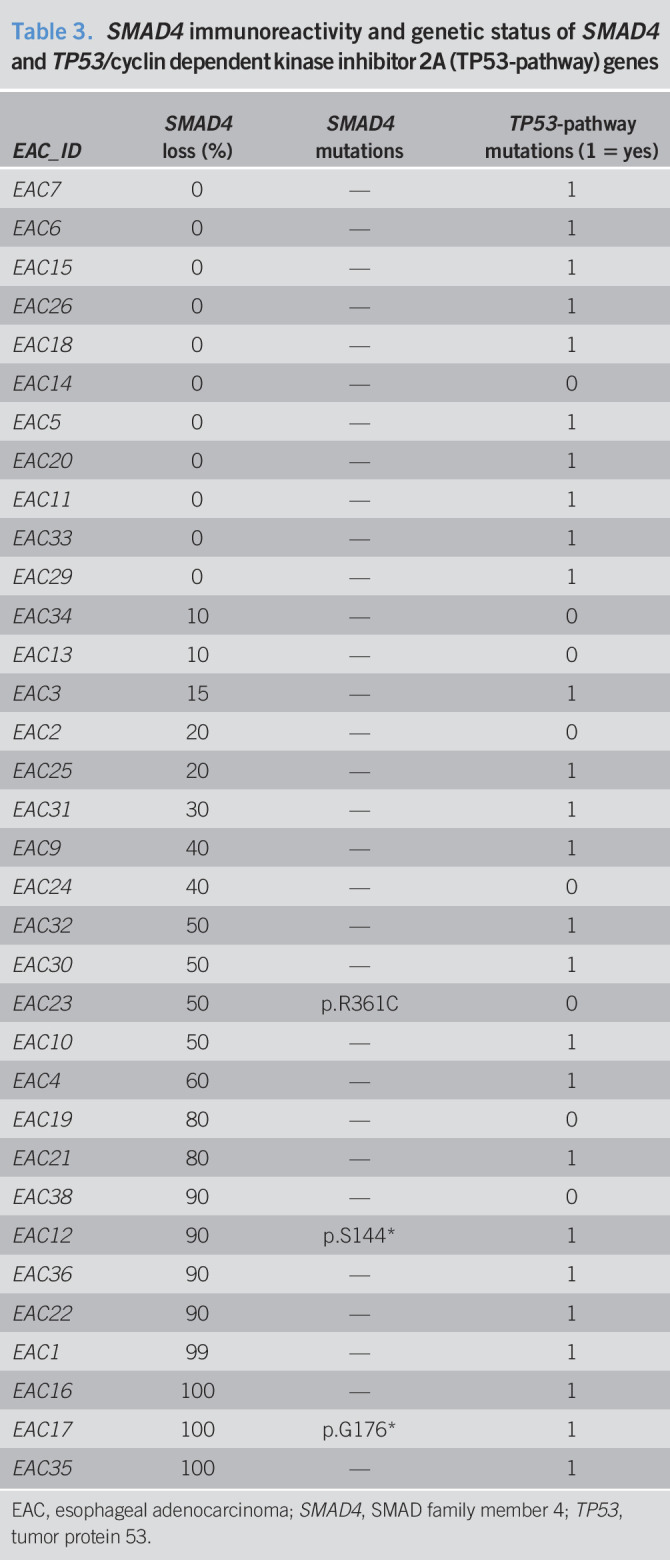
SMAD4 was one of the most frequently mutated genes in our EAC cohort, occurring in 10.5% of patient. SMAD4 is an important tumor suppressor frequently altered in cancers; therefore, we also evaluated its expression by IHC in 34 of the 38 EAC samples (4 cases could not be analyzed because of poor tissue quality).
The samples mutated in SMAD4 showed a clear signal reduction (Figure 4a). However, a signal reduction was also observed in a substantial number of cases with no mutations in SMAD4 (18/34, 52.9%) (Table 3), when using a cutoff of 30% of SMAD4 to classify samples. The cutoff was based on our previous work on colon cancer (18,19). We observed a significant correlation between SMAD4 loss and cancer recurrence, with 29% patients having recurrence when SMAD4 immunoreactivity was normal and 75% patients relapsing when SMAD4 was lost (P = 0.015, Fisher exact test; Figure 4b). Although Kaplan-Meier analysis did not reach statistical significance for cancer-specific and disease-free survival (logrank P = 0.383 and P = 0.211, respectively), the survival patterns were different for patients with SMAD4 loss vs normal SMAD4 expression (5-year cancer-specific survival 25.1% vs 62.5%; 5-year disease-free survival 22.9% vs 62.5%).
Figure 4.
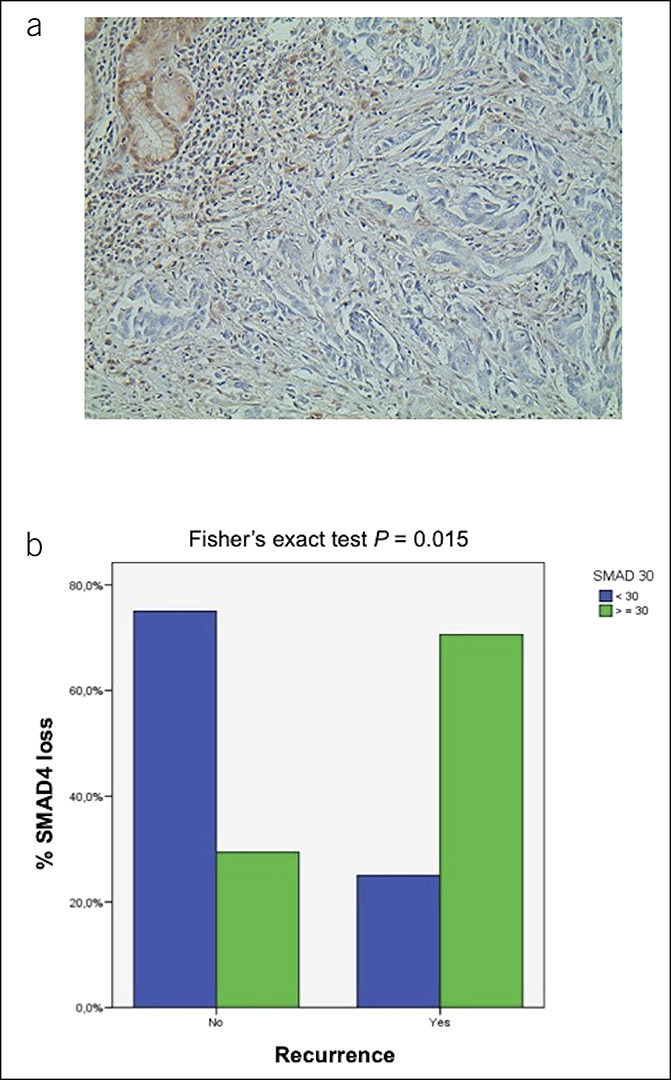
SMAD family member 4 (SMAD4) expression and correlation with clinical outcomes in EAC. (a) Immunohistochemical profile of a case with SMAD4 loss in tumor cells vs normally expressed SMAD4 in non-neoplastic glands and in stromal cells (upper left corner) (hematoxylin was used as a counterstain) (×20). (b) EAC grouped according to cancer with high SMAD4 (<30% loss of protein expression; green bars) and low SMAD4 (>30% loss of protein expression; blue bars) and disease recurrence (Fisher exact test; P = 0.015). EAC, esophageal adenocarcinoma.
Table 3.
SMAD4 immunoreactivity and genetic status of SMAD4 and TP53/cyclin dependent kinase inhibitor 2A (TP53-pathway) genes
| EAC_ID | SMAD4 loss (%) | SMAD4 mutations | TP53-pathway mutations (1 = yes) |
| EAC7 | 0 | — | 1 |
| EAC6 | 0 | — | 1 |
| EAC15 | 0 | — | 1 |
| EAC26 | 0 | — | 1 |
| EAC18 | 0 | — | 1 |
| EAC14 | 0 | — | 0 |
| EAC5 | 0 | — | 1 |
| EAC20 | 0 | — | 1 |
| EAC11 | 0 | — | 1 |
| EAC33 | 0 | — | 1 |
| EAC29 | 0 | — | 1 |
| EAC34 | 10 | — | 0 |
| EAC13 | 10 | — | 0 |
| EAC3 | 15 | — | 1 |
| EAC2 | 20 | — | 0 |
| EAC25 | 20 | — | 1 |
| EAC31 | 30 | — | 1 |
| EAC9 | 40 | — | 1 |
| EAC24 | 40 | — | 0 |
| EAC32 | 50 | — | 1 |
| EAC30 | 50 | — | 1 |
| EAC23 | 50 | p.R361C | 0 |
| EAC10 | 50 | — | 1 |
| EAC4 | 60 | — | 1 |
| EAC19 | 80 | — | 0 |
| EAC21 | 80 | — | 1 |
| EAC38 | 90 | — | 0 |
| EAC12 | 90 | p.S144* | 1 |
| EAC36 | 90 | — | 1 |
| EAC22 | 90 | — | 1 |
| EAC1 | 99 | — | 1 |
| EAC16 | 100 | — | 1 |
| EAC17 | 100 | p.G176* | 1 |
| EAC35 | 100 | — | 1 |
EAC, esophageal adenocarcinoma; SMAD4, SMAD family member 4; TP53, tumor protein 53.
DISCUSSION
TP53 is the most commonly altered gene in EAC, a cancer characterized by a considerable level of genetic heterogeneity, chromosomal instability, and associated genome doubling (13).
Genome instability is considered to occur as an early event in EAC tumorigenesis (3). Except for TP53, other genes are altered in multiple EAC tumor samples but at a lower frequency. It has been suggested that EAC heterogeneity, exemplified by the amplification of multiple receptor tyrosine kinase genes and genes involved in downstream mitogenic pathways, may be responsible for the poor response of EACs to drugs targeting isolated receptor tyrosine kinases and mitogenic pathways (25). Therefore, identifying the major mutational profile of patients with EAC would allow to stratify patients into specific mutational groups for targeting using more specific therapeutic interventions.
In our study, we took advantage of a high throughput selective sorting technology to investigate the different mutational patterns of the diverse cell populations within the tumor. In this line, we were able to investigate genomic alterations present in different types of tumor cells and exclude stromal cells from these analyses. All stromal populations were characterized by a normal diploid profile. In 7 cases, we identified different tumor cell populations with hyperdiploid or pseudodiploid DNA content that showed aberrant copy number profiles and diverse somatic mutational loads. This finding indicates the existence of different cell clones within the same tumor, each of which can have different tumor behavior and response to conventional chemoradiotherapy, although several might be relevant for targeted drug therapy.
We observed that the mutations present in 50% of the unsorted tumor DNA were present as almost unique alleles in the sorted tumor cell populations. These mutations were absent in the corresponding stromal cells recovered with the same technology.
We detected somatic mutations in the gene encoding the hepatocyte nuclear factor HNF1α. Constitutive mutations in this gene cause maturity-onset diabetes of the young (26). HNF1α regulates targets such as glucose transporter 2, pyruvate kinase, and collectrin (27). In pancreatic ductal adenocarcinoma, an aggressive cancer with poor prognosis, HNF1A acts as a tumor suppressor, and loss-of-function mutations in this gene have been reported (22). In a recent study, the long noncoding RNA HNF1A antisense RNA 1 was markedly upregulated in human primary EACs compared with the corresponding normal esophageal tissues, and HNF1A antisense RNA 1 knockdown significantly inhibited cell proliferation and anchorage-independent growth in vitro (28). However, mutations in EAC in the HNF1A gene have not been reported thus far; therefore, our study identified a new gene mutated in EAC. Mutations in this gene were found in conjunction with mutations in other genes; therefore, we expect that lost/mutated HNF1A might contribute to tumor severity/progression. Further analyses of additional cases are warranted to investigate the role of this gene in EAC to understand whether these mutations might act as a cancer driver or passenger.
In our study, most of the TP53 mutations were shifted to homozygosity in the sorted tumor populations, suggesting that they are early events in tumorigenesis, as highlighted also by studies in Barrett's esophagus (3). Interestingly, in one case, we detected the mutation p.Y220C in TP53 to be present in ∼100% of the sorted tumor cells but to be present as a heterozygous mutation in only one section from serial sections of the same tumor; DNA was extracted from the sections twice and was sequenced with Sanger sequencing, and these results reinforce the concept of high intratumor heterogeneity.
Mutations in TP53 pave the way for many different molecular derangements that lead to diverse histopathological features of the tumors (14). Immunostaining for p53 showed only a moderate correlation with the presence of gene mutations, in particular did not help us distinguish the presence of loss-of-function mutations such as stop codon or frameshift variants from normal p53 staining, in concordance with previous data (23,24).
Our study investigated a small number of EAC cases; thus, we had a low power in detecting a strong correlation with recurrence and survival. Nevertheless, our data suggest that a molecular analysis of the TP53 mutational status is relevant to select patients who would be more suitable for selected therapies. Our patients were not treated with neoadjuvant cisplatin/fluorouracil chemotherapy, a treatment associated with poor response when p53 is mutated. This therapy requires a wild-type protein to be effective (29). On the other hand, the pharmacological reactivation of mutant p53 has emerged as a promising strategy for improved cancer therapy using small molecules that restore its wild-type activity, such as APR-246/PRIMA-1Met. This molecule acts in the presence of p53 missense mutations and regulates several p53-related pathways (30,31).
APR246/PRIMA-1 is already in clinical trials for different types of cancers, including EAC (32).
In our study, we also identified SMAD4 expression as a good and promising predictive factor for EAC recurrence. We confirmed that SMAD4-mutated samples showed a clear signal reduction, confirming a close correlation between the SMAD4 genotype and protein detection.
However, SMAD4 loss was also detected in a number of cases without SMAD4 gene mutations, and its expression significantly correlated with tumor recurrence. We presume that additional regulatory mechanisms might be involved, such as promoter hypermethylation, that can downregulate SMAD4 expression (33). Our data are in line with previous studies on SMAD4 loss in EAC, although those studies identified this loss in fewer cases (34), with studies indicating epigenetic mechanisms of gene silencing (33). Similarly, the early detection of SMAD4 molecular defects may help direct targeted therapies, e.g., in the future, SMAD4-deficient EAC may benefit from transforming growth factor-beta pathway inhibitors (35,36).
In conclusion, our study showed that a combination of high-throughput sorting technology and massive parallel sequencing led to a better definition of the EAC mutational status and intertumor and intratumor heterogeneity than does the analysis of whole-tumor samples. Further studies in larger patient cohorts will improve the accurate understanding of the different cell populations in the primary EAC tumors, i.e., the tumor clonality, and will allow to evaluate the predictive role of biomarkers, such as TP53 and SMAD4.
CONFLICTS OF INTEREST
Guarantor of the article: Elena Bonora, PhD.
Specific author contributions: F.I., I.B., L.M., D.M., C.M., AD, M.L., and R.F. conducted the experiments and analyzed the data. F.I., R.F., M.L., K.K.K.E.B., and S.M. wrote the manuscript. J.R. and S.M. operated on cases. H.S. collected samples and clinical data. K.K.K., E.B., and S.M. designed the project, and R.F., K.K.K. and S.M. supervised the experiments. All authors read and approved the final manuscript.
Financial support: The present study was developed and performed inside the EACSGE group (Esophageal Adenocarcinoma Study Group Europe) research program. The study was funded by SM's personal research funds, partially supplemented by Maria Cecilia Hospital/GVM to the University of Bologna, and partially funded by the AIRC IG1769 grant to M.S. F.I.'s PhD fellowship is supported by the University of Bologna/Regione Emilia-Romagna (Italy) for the “ONCOPENTA” project. K.K.K is supported by ERC-POC-737612.
Potential competing interests: None to report.
Study Highlights.
WHAT IS KNOWN
✓ The incidence of EACs is increasing, and the survival rate is low despite the adoption of aggressive therapeutic protocols.
✓ Recent studies at the genetic level have included EAC in a group of tumors with one of the most frequent rates of CNAs and somatic structural rearrangements. Moreover, EACs are characterized by a high mutation frequency.
WHAT IS NEW HERE
✓ In general, studies have thus far only analyzed DNA derived from whole-tumor samples that are composed of cancer cells and stromal and infiltrating immune cells. Therefore, the real status of somatic mutations in cancer cells is masked by the presence of stromal cells and/or different subclones carrying different cellular mutational profiles.
✓ Our study shows that a combination of high-throughput sorting technology and massive parallel sequencing leads to a better definition of the EAC mutation status and intertumor and intratumor heterogeneity than does the analysis of whole-tumor samples.
✓ We identified mutations in HNF1A (in 2/38 cases), a gene not previously found mutated in EAC. This gene encodes a transcription factor that acts as a tumor suppressor.
✓ We demonstrate that there is a mismatch between SMAD4 mutational status and protein expression as assessed by IHC, and a statistically significant correlation was observed between loss of SMAD4 protein (IHC) and cancer recurrence risk (P = 0.015).
TRANSLATIONAL IMPACT
✓ Because specific biomarkers, such as SMAD4 expression and TP53 mutation status, correlated with tumor recurrence and/or are targeted by specific drugs in vitro, the evaluation of such markers in future may help facilitate tailored therapies to improve the patient outcome.
Supplementary Material
ACKNOWLEDGEMENTS
We thank C. Bolognesi, G. Buson, and C. Forcato from Silicon Biosystems S.p.A. for technical help with the high-throughput cell sorting and with the bioinformatics analysis.
Footnotes
SUPPLEMENTARY MATERIAL accompanies this paper at https://links.lww.com/CTG/A376, links.lww.com/CTG/A377, links.lww.com/CTG/A378, links.lww.com/CTG/A379
Joint first authors.
Joint last authors.
Members of the Esophageal Adenocarcinoma Study Group Europe (EACSGE group).
References
- 1.Coleman HG, Xie SH, Lagergren J. The epidemiology of esophageal adenocarcinoma. Gastroenterology 2018;154:390–405. [DOI] [PubMed] [Google Scholar]
- 2.Rubenstein JH, Shaheen NJ. Epidemiology, diagnosis, and management of esophageal adenocarcinoma. Gastroenterology 2015;149:302–17. [DOI] [PMC free article] [PubMed] [Google Scholar]
- 3.Contino G, Vaughan TL, Whiteman D, et al. The evolving genomic landscape of Barrett's esophagus and esophageal adenocarcinoma. Gastroenterology 2017;135:657–73. [DOI] [PMC free article] [PubMed] [Google Scholar]
- 4.Nakamura T, Nekarda H, Hoelscher AH, et al. Prognostic value of DNA ploidy and c-ErbB-2 oncoprotein overexpression in adenocarcinoma of Barrett's esophagus. Cancer 1994;73:1785–94. [DOI] [PubMed] [Google Scholar]
- 5.Fle´jou JF, Paraf F, Muzeau F, et al. Expression of c-ErbB-2 oncogene product in Barrett's adenocarcinoma: Pathological and prognostic correlations. J Clin Pathol 1994;47:23–6. [DOI] [PMC free article] [PubMed] [Google Scholar]
- 6.Polkowski W, Van Sandick JW, Offerhaus GJA, et al. Prognostic value of Laurén classification and c-erbB-2 oncogene overexpression in adenocarcinoma of the esophagus and gastroesophageal junction. Ann Surg Oncol 1999;6:290–7. [DOI] [PubMed] [Google Scholar]
- 7.Van der Kaaij RT, Snaebjornsson P, Francine EM, et al. The prognostic and potentially predictive value of the Lauren classification in oesophageal adenocarcinoma. Eur J Cancer 2017;76:27–35. [DOI] [PubMed] [Google Scholar]
- 8.Al-Batran S, Hofheinz RD, Pauligk C, et al. Histopathological regression after neoadjuvant docetaxel, oxaliplatin, fluorouracil, and leucovorin versus epirubicin, cisplatin, and fluorouracil or capecitabine in patients with resectable gastric or gastro-oesophageal junction adenocarcinoma (FLOT4-AIO): Results from the phase 2 part of a multicentre, open-label, randomised phase 2/3 trial. Lancet Oncol 2016;17:1697–708. [DOI] [PubMed] [Google Scholar]
- 9.Rice TW, Blackstone EH, Rusch VW. 7th edition of the AJCC cancer staging manual: Esophagus and esophagogastric junction. Ann Surg Oncol 2010;17:1721–4. [DOI] [PubMed] [Google Scholar]
- 10.Rice TW, Ishwaran H, Ferguson MK, et al. Cancer of the esophagus and esophagogastric junction: An eighth edition staging primer. J Thorac Oncol 2017;12:36–42. [DOI] [PMC free article] [PubMed] [Google Scholar]
- 11.Mattioli S, Ruffato A, Di Simone MP, et al. Immunopathological patterns of the stomach in adenocarcinoma of esophagus, cardia, and gastric antrum: Gastric profiles in Siewert type I and II tumors. Ann Thorac Surg 2007;83:1814–9. [DOI] [PubMed] [Google Scholar]
- 12.Ruffato A, Mattioli S, Perrone O, et al. Esophagogastric metaplasia relates to nodal metastases in adenocarcinoma of esophagus and cardia. Ann Thorac Surg 2013;95:1147–53. [DOI] [PubMed] [Google Scholar]
- 13.The Cancer Genome Atlas Research Network. Integrated genomic characterization of oesophageal carcinoma. Nature 2017;541:169–75. [DOI] [PMC free article] [PubMed] [Google Scholar]
- 14.Secrier M, Li X, De Silva N, et al. Mutational signatures in esophageal adenocarcinoma define etiologically distinct subgroups with therapeutic relevance. Nat Genet 2016;48:1131–41. [DOI] [PMC free article] [PubMed] [Google Scholar]
- 15.Bolognesi C, Forcato C, Buson G, et al. Digital sorting of pure cell populations enables unambiguous genetic analysis of heterogeneous formalin-fixed paraffin-embedded tumors by next generation sequencing. Sci Rep 2016;6:20944. [DOI] [PMC free article] [PubMed] [Google Scholar]
- 16.Isidori F, Malvi D, Fittipaldi S, et al. Genomic profiles of primary and metastatic esophageal adenocarcinoma identified via digital sorting of pure cell populations: Results from a case report. BMC Cancer 2018;18:889. [DOI] [PMC free article] [PubMed] [Google Scholar]
- 17.Diquigiovanni C, Bergamini C, Diaz R, et al. A novel mutation in SPART gene causes a severe neurodevelopmental delay due to mitochondrial dysfunction with complex I impairments and altered pyruvate metabolism. FASEB J 2019;33:11284–302. [DOI] [PubMed] [Google Scholar]
- 18.Yan P, Klingbiel D, Saridaki Z, et al. Reduced expression of SMAD4 is associated with poor survival in colon cancer. Clin Cancer Res 2016;22:3037–47. [DOI] [PubMed] [Google Scholar]
- 19.Bosman FT, Yan P, Tejpar S, et al. Tissue biomarker development in a multicentre trial context: A feasibility study on the PETACC3 stage II and III colon cancer adjuvant treatment trial. Clin Cancer Res 2009;15:5528–33. [DOI] [PubMed] [Google Scholar]
- 20.Altman DG. Practical Statistics for Medical Research. Chapman & Hall/CRC Press: New York, 1999. [Google Scholar]
- 21.Landis JR, Koch GG. The measurement of observer agreement for categorical data. Biometrics 1977;33:159–74. [PubMed] [Google Scholar]
- 22.Lou Z, Li Y, Wang H, et al. Hepatocyte nuclear factor 1A (HNF1A) as a possible tumor suppressor in pancreatic cancer. PLoS One 2015;10:e0121082. [DOI] [PMC free article] [PubMed] [Google Scholar]
- 23.Tolbert DM, Noffsinger AE, Miller MA, et al. p53 immunoreactivity and single-strand conformational polymorphism analysis often fail to predict p53 mutational status. Mod Pathol 1999;12:54–60. [PubMed] [Google Scholar]
- 24.Eicheler W, Zips D, Dörfler A, et al. Splicing mutations in TP53 in human squamous cell carcinoma lines influence immunohistochemical detection. J Histochem Cytochem 2002;50:197–204. [DOI] [PubMed] [Google Scholar]
- 25.Frankell AM, Jammula S, Li X, et al. The landscape of selection in 551 esophageal adenocarcinomas defines genomic biomarkers for the clinic. Nat Genet 2019;51:506–16. [DOI] [PMC free article] [PubMed] [Google Scholar]
- 26.Ellard S, Lango AH, De Franco E, et al. Improved genetic testing for monogenic diabetes using targeted next-generation sequencing. Diabetologia 2013;56:1958–63. [DOI] [PMC free article] [PubMed] [Google Scholar]
- 27.Pontoglio M, Barra J, Hadchouel M, et al. Hepatocyte nuclear factor 1 inactivation results in hepatic dysfunction, phenylketonuria, and renal fanconi syndrome. Cell 1996;4:575–85. [DOI] [PubMed] [Google Scholar]
- 28.Yang X, Song JH, Cheng Y, et al. Long non-coding RNA HNF1A-AS1 regulates proliferation and migration in oesophageal adenocarcinoma cells. Gut 2014;63:881–90. [DOI] [PMC free article] [PubMed] [Google Scholar]
- 29.Kandioler D, Schoppmann SF, Zwrtek R, et al. The biomarker TP53 divides patients with neoadjuvantly treated esophageal cancer into 2 subgroups with markedly different outcomes. A p53 Research Group study. J Thorac Cardiovasc Surg 2014;148:2280–6. [DOI] [PubMed] [Google Scholar]
- 30.Parrales A, Iwakuma T. Targeting oncogenic mutant p53 for cancer therapy. Front Oncol 2015;5:288. [DOI] [PMC free article] [PubMed] [Google Scholar]
- 31.Bykov VJ, Issaeva N, Shilov A, et al. Restoration of the tumor suppressor function to mutant p53 by a low-molecular-weight compound. Nat Med 2002;8:282–8. [DOI] [PubMed] [Google Scholar]
- 32.Study of APR-246 in Oesophageal Cancer: APROC (ClinicalTrials.gov Identifier:NCT02999893). Peter MacCallum Cancer Centre: Australia. [Google Scholar]
- 33.Onwuegbusi BA, Aitchison A, Chin SF, et al. Impaired transforming growth factor β signalling in Barret's carcinogenesis due to frequent SMAD4 inactivation. Gut 2006;55:764–74. [DOI] [PMC free article] [PubMed] [Google Scholar]
- 34.Singhi AD, Foxwell TJ, Nason K, et al. Smad4 loss in esophageal adenocarcinoma is associated with an increased propensity for disease recurrence and poor survival. Am J Surg Pathol 2015;39:487–95. [DOI] [PMC free article] [PubMed] [Google Scholar]
- 35.Calpe S, Correia AC, Sancho-Serra Mdel C, et al. Comparison of newly developed anti-bone morphogenetic protein 4 llama-derived antibodies with commercially available BMP4 inhibitors. MAbs 2016;8:678–88. [DOI] [PMC free article] [PubMed] [Google Scholar]
- 36.Ebbing EA, Steins A, Fessler E, et al. Esophageal adenocarcinoma cells and xenograft tumors exposed to erb-b2 receptor tyrosine kinase 2 and 3 inhibitors activate transforming growth factor beta signaling, which induces epithelial to mesenchymal transition. Gastroenterology 2017;153:63–76.e14. [DOI] [PubMed] [Google Scholar]
- 37.McHugh ML. Interrater reliability: The kappa statistic. Biochem Med (Zagreb) 2012;22:276–82. [PMC free article] [PubMed] [Google Scholar]
- 38.Kato S, Han SY, Liu W, et al. Understanding the function-structure and function-mutation relationships of p53 tumor suppressor protein by high-resolution missense mutation analysis. Proc Natl Acad Sci U S A 2003;100:8424–9. [DOI] [PMC free article] [PubMed] [Google Scholar]
- 39.Fortuno C, James PA, Young EL, et al. Improved, ACMG-compliant, in silico prediction of pathogenicity for missense substitutions encoded by TP53 variants. Hum Mutat 2018;39:1061–9. [DOI] [PMC free article] [PubMed] [Google Scholar]
Associated Data
This section collects any data citations, data availability statements, or supplementary materials included in this article.


