Abstract
Biochemistry is about structure and function, but it is also about data and this is where computers come in. From my time as a graduate student and post-doc, whenever I encountered data I thought, “I can work this up by hand, but I think a computer could do a better job.” Since that time, I have been working at the interface of biochemistry and computers, by attracting talented students and collaborating with colleagues with complementary skills. This has resulted in several exciting projects: a simulation of 2D electrophoresis and tandem mass spectrometry, the human visualization project, and two different programs that enable biochemists to search protein structures for enzyme active sites: ProMOL (promol.org) and Moltimate (moltimate.appspot.com). The human side of software development for education involved finding the right students and colleagues, communicating effectively across disciplines, building and managing effective teams and the importance of serendipity throughout the process.
I began using computers during graduate school in 1984, where I entered my text on an IBM PC and created publication quality figures using Tell-A-Graf software[1]. After discovering spreadsheets (1986) and presentation programs (1988), I applied for an assistant professor position at the Rochester Institute of Technology, planning to use computers to teach biochemistry (1993), not knowing what that meant at all. Support from my peers and the help of many excellent collaborators and students have led to computer simulations, molecular visualization and a project on human visualization.
Starting in 1993, faculty members at RIT helped me pursue the use of computers in biochemistry education.
Bob Gilman championed my proposal for an internal grant to develop a simulation of enzyme kinetics.
Jerry Takacs sent me to a molecular visualization workshop at Cornell.
Ed Cain supported my trip to an ACS conference with a symposium about “Lone Ranger” biochemists in chemistry departments.
Joe Hornak told me about Nan Shaller’s computer graphics course at RIT, where her computer science students joined my projects.
Protein Separation Simulations.
Two computer graphics students produced simulations of ion exchange chromatography and protein electrophoresis during a computer graphics course. One of these students then approached me about a graduate project and asked, “What would you like me to do?” I quickly responded that I would love to have a “killer web page that simulated protein electrophoresis.” In six months, he developed a web application for protein and DNA electrophoresis based on the Java programming language, which was quite novel in 1997. He included animation, multiple display options, sound and even some molecular visualization.
Two years later, a gifted biochemistry major taking computer science courses asked me, “Do you have a problem that I can solve?” I challenged her to write code to predict protein behavior in 2D electrophoresis. Following some literature work, she wrote Java code that calculated pI and MW for proteins, with results quite similar to those that can be obtained on Expasy protparam web application (https://web.expasy.org/protparam/).
The project underwent two major advances in the next several years. A computer science student enrolled in a team-taught bioinformatics course for computer science majors and suggested that we create a graphic 2D electrophoresis application based on these equations. She created a program that would accept bacterial proteomes in Genbank[2], FASTA[3] or PDB[4] formats, and simulate isoelectric focusing and sodium dodecyl sulfate polyacrylamide gel electrophoresis, resulting a 2D grid of protein spots (Figure 1A) with each spot linked out to BLAST[5], NCBI[6], and Uniprot[7].
Figure 1.
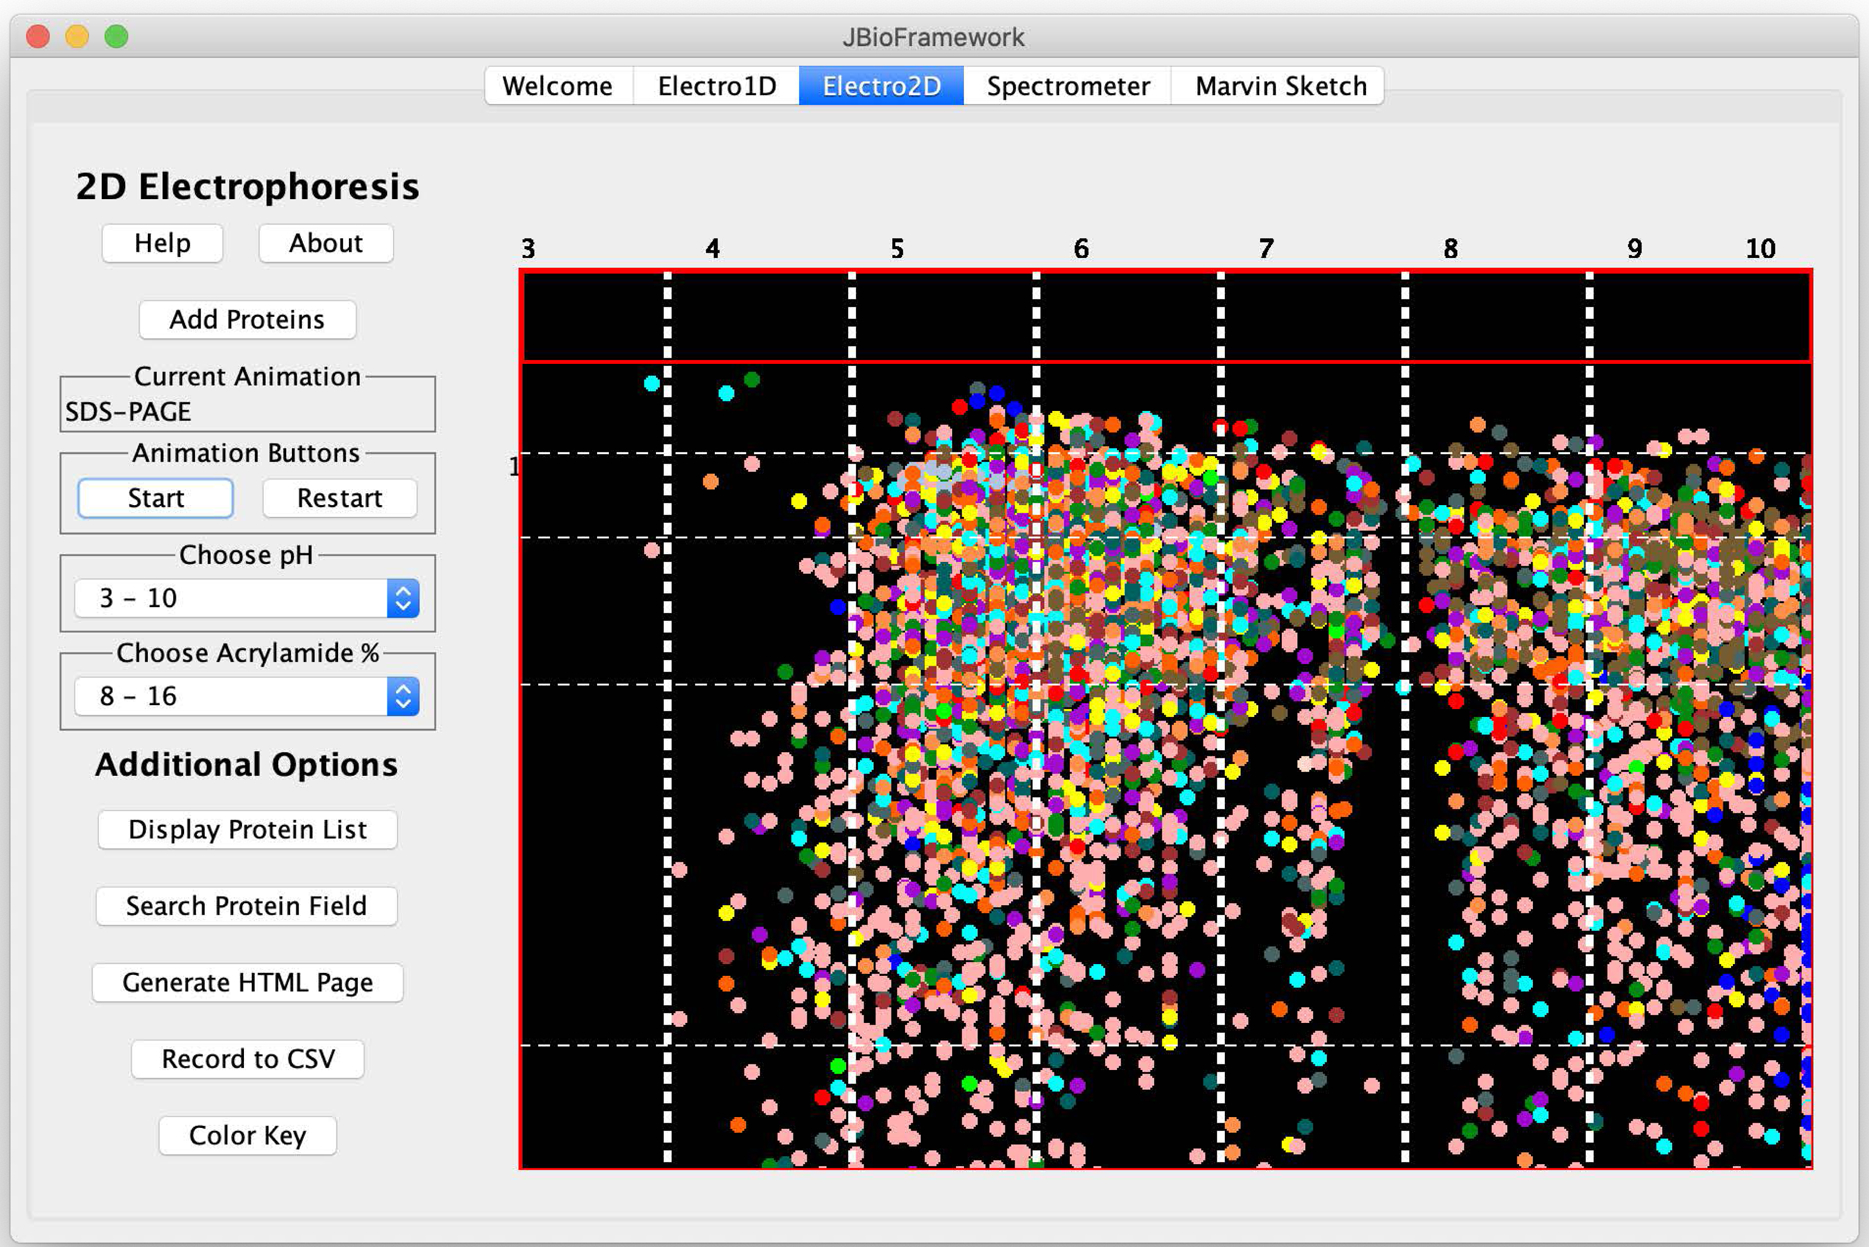
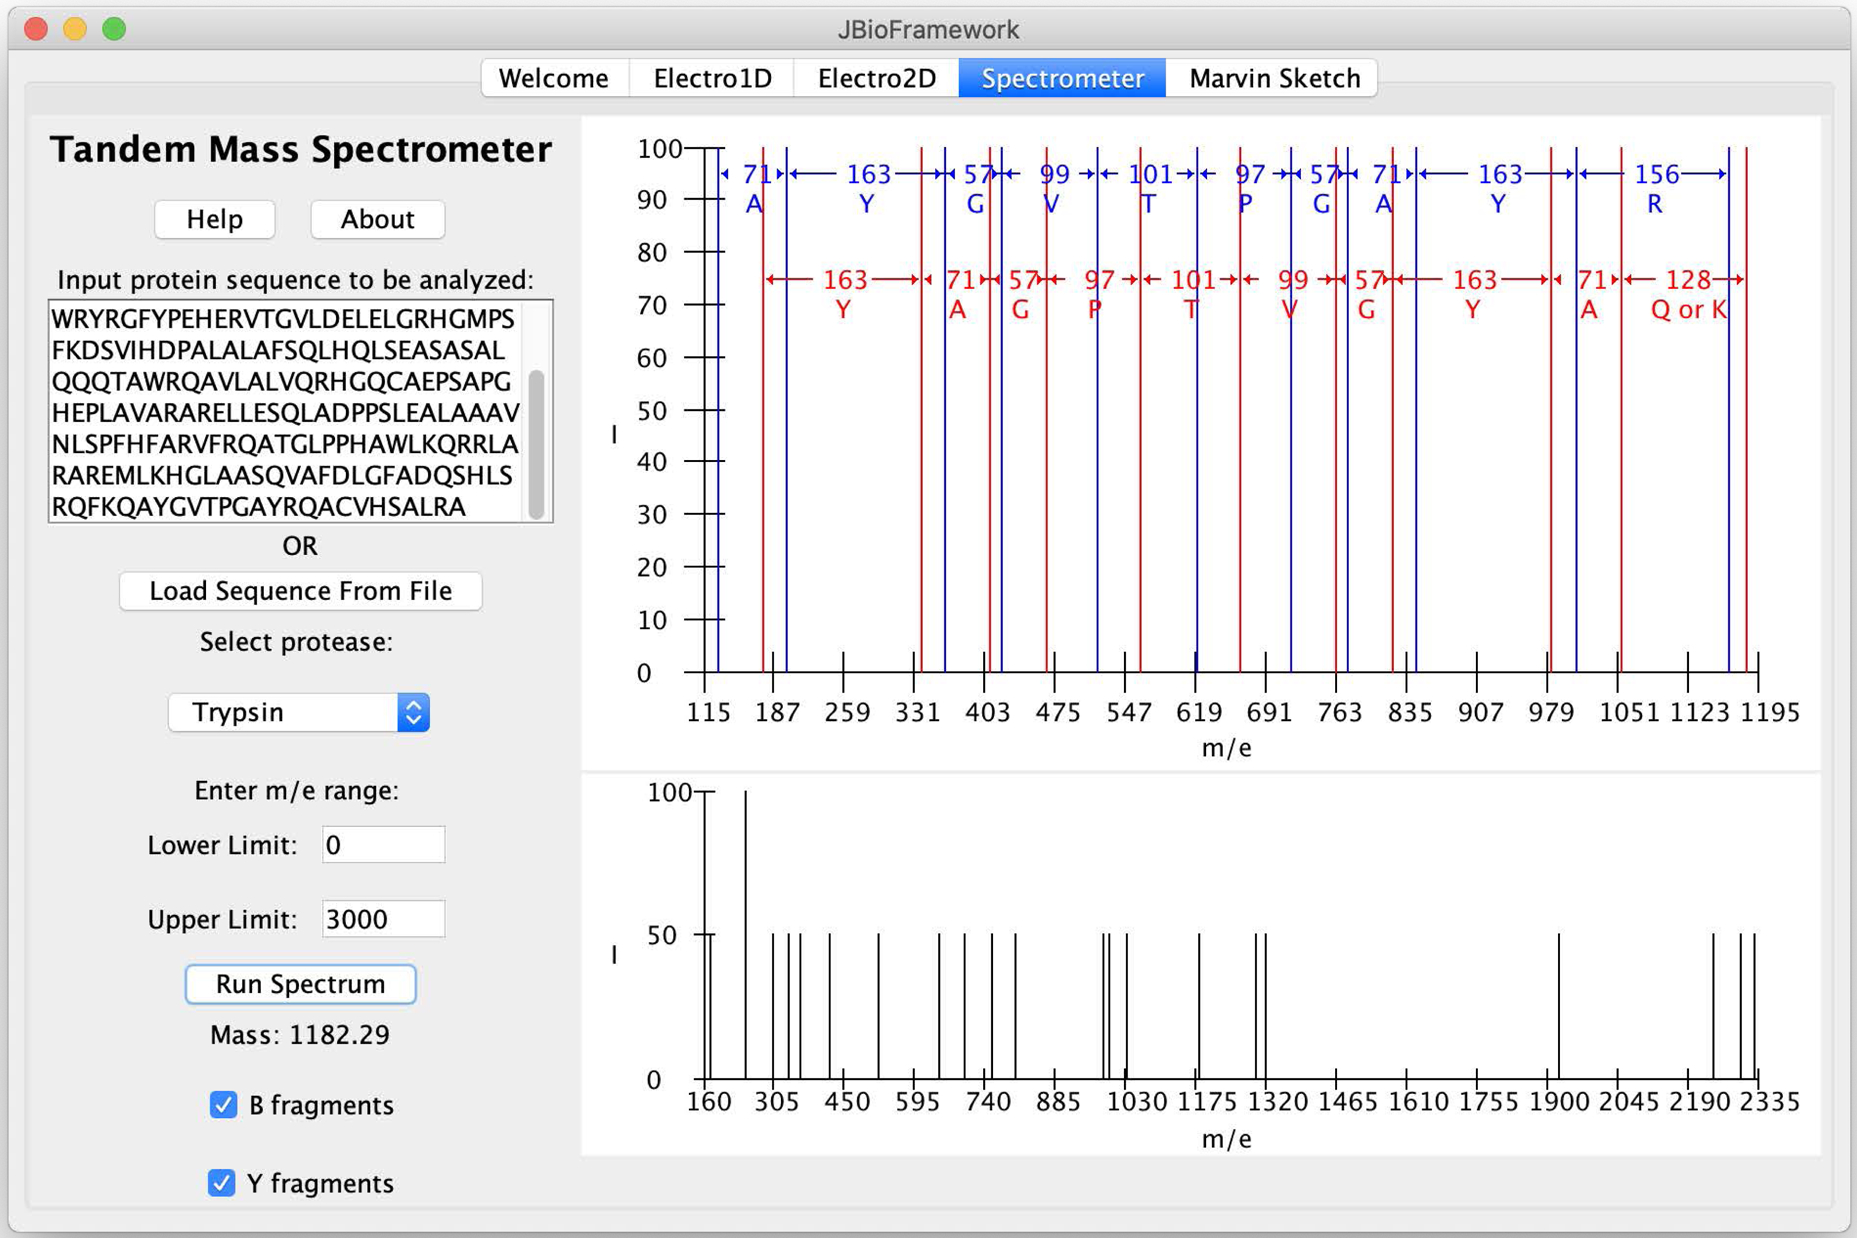
A simulation of two-dimensional electrophoresis and tandem mass spectrometry of proteins. A. Isoelectric focusing (pH 3–10) of the proteome of P. putida KT2440. B. AraC transcriptional regulator from 2DE was subjected to tandem MS.
A second major advance occurred when I was unable to identify a project suitable for a biochemistry major with no coding experience who asked to join my lab at the end of her first year. After some discussion, I sent her home for the summer with the suggestion, “Learn to write Java code.” So she did. Over the next two years, she added a simulation of tandem mass spectrometry for protein sequence determination (Figure 1B) to the 2D electrophoresis application [8]. The simulation suite, JBioFramework, can be downloaded from Sourceforge (https://sourceforge.net/projects/jbf/) and includes 1D electrophoresis, 2D electrophoresis, the tandem mass spectrometer and an embedded version of Marvin Sketch from Chemaxon (https://chemaxon.com/; included with permission from the authors).
Human Visualization Project.
In 2004, a group of educators received NSF ATE funding for 3D visualization in science, engineering and architecture. I focused on 3D molecular visualization (see below), but when I mentioned the 3D projector to Dick Doolittle, a professor of human anatomy at RIT, he immediately suggested we start developing a project on human visualization. We recruited some medical illustration B.S. and M.S. students, who combine artistic excellence with a robust background in human anatomy. They created an animated movie of the human pancreas one level at a time: organism to system to organ to tissue to molecules (Figure 2). Subsequent students on the project have resulted in videos of the spleen, skull and skeleton, liver, kidney, and inner ear.
Figure 2.
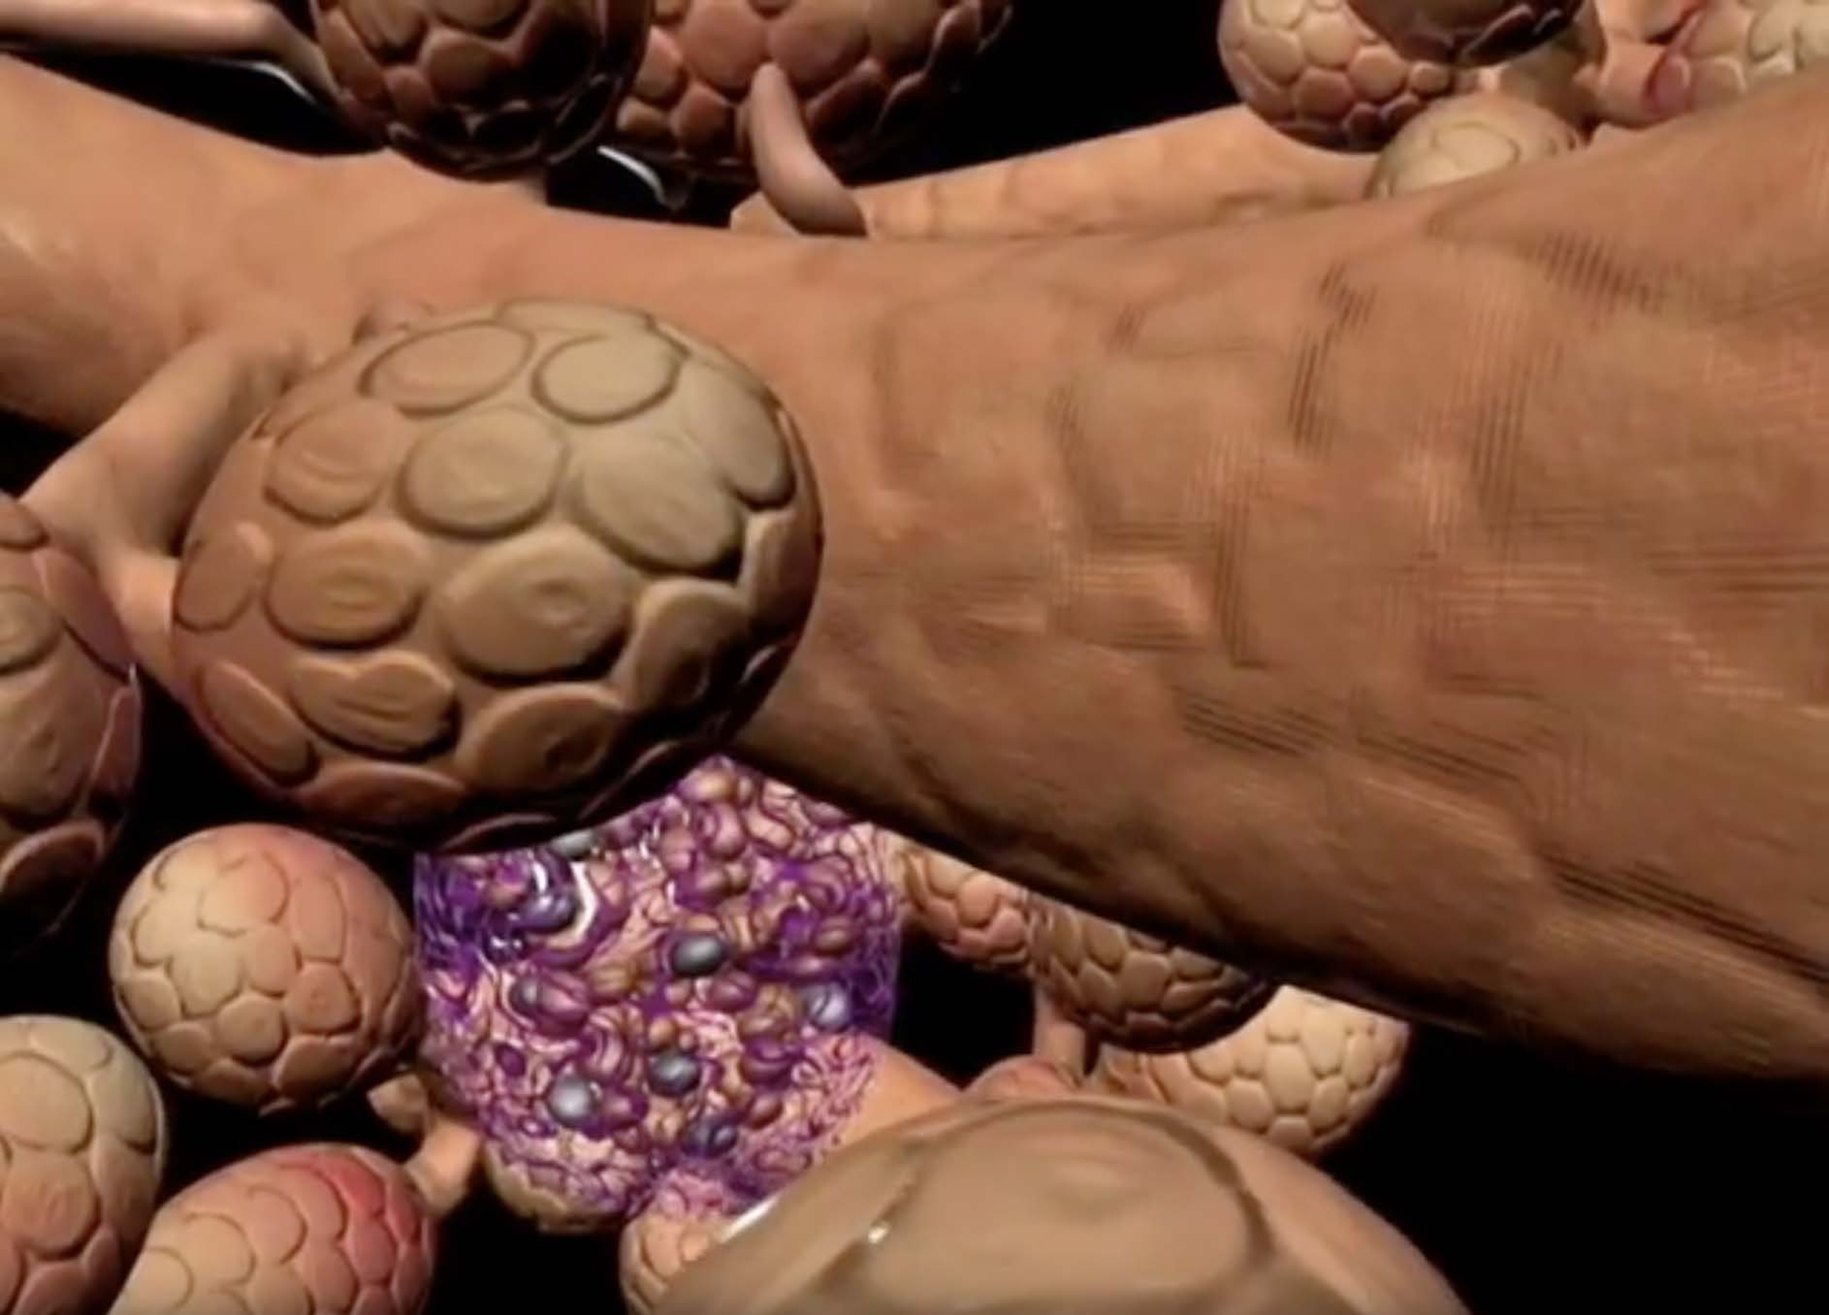
Screen capture of exocrine pancreatic function from the Human Visualization Project (https://www.youtube.com/watch?v=xD7eZrPUUls).
Molecular visualization
Molecular visualization has been a core emphasis throughout my career and will be the focus of the remainder of this manuscript. In 1994, I attended a presentation about Kinemage [9] at an American Chemical Society symposium, and taught my students to use the program to prepare protein structure documentaries. Subsequently the student projects were transitioned to Rasmol [10], Chime (MDL Information Systems), Jmol[11], and PyMOL [12]. In 2001–2002, I spent a sabbatical with Phil Bourne, a member of the Protein Data Bank leadership team, where we focused on protein documentaries. In 2003, one of my RIT colleagues introduced me to Jerry Fong from Alfred State College of Technology to discuss an NSF ATE proposal about 3D visualization. NSF funding provided RIT with a 3D projection system and funding for three students to spend each of the next two summers at Brookhaven National Lab in a 3D visualization incubator that included engineering, architecture and science projects. An RIT student discovered the true 3D graphics mode in PyMOL and that was our starting point. The main challenge was that PyMOL had a steep learning curve. The first summer at Brookhaven, two of the students created a better user interface for PyMOL. I gave them clear instructions on how it should be done and they came back with a different idea, “Can we make a plug-in for PyMOL?” There were two major outcomes from that summer: (a) they created the EZ-Viz plug-in for PyMOL [13] and (b) I met Herbert Bernstein, a computer scientist with great expertise on biological data, at the students’ presentation and we began a 15-year (and counting) collaboration.
The following summer, two biotechnology majors went to Brookhaven with instructions to develop instructional materials for biochemistry lectures using EZ-Viz and PyMOL. Though I thought this would take all summer, at the end of the first week (having completed that task) they asked, “What else can we do?” They suggested that we add active site alignments to EZ-Viz that could be viewed in PyMOL. They were undaunted by the need to learn to program in Python (they taught themselves over the summer) and created tools for active site alignments, upgrading the EZ-Viz plug-in to create ProMOL (Figure 3A; [14]). They then demonstrated the functionality of ProMOL/PyMOL to the senior scientists at Brookhaven by showing them how the program pinpointed the active site in a viral protein of unknown function in just a few seconds.
Figure 3.
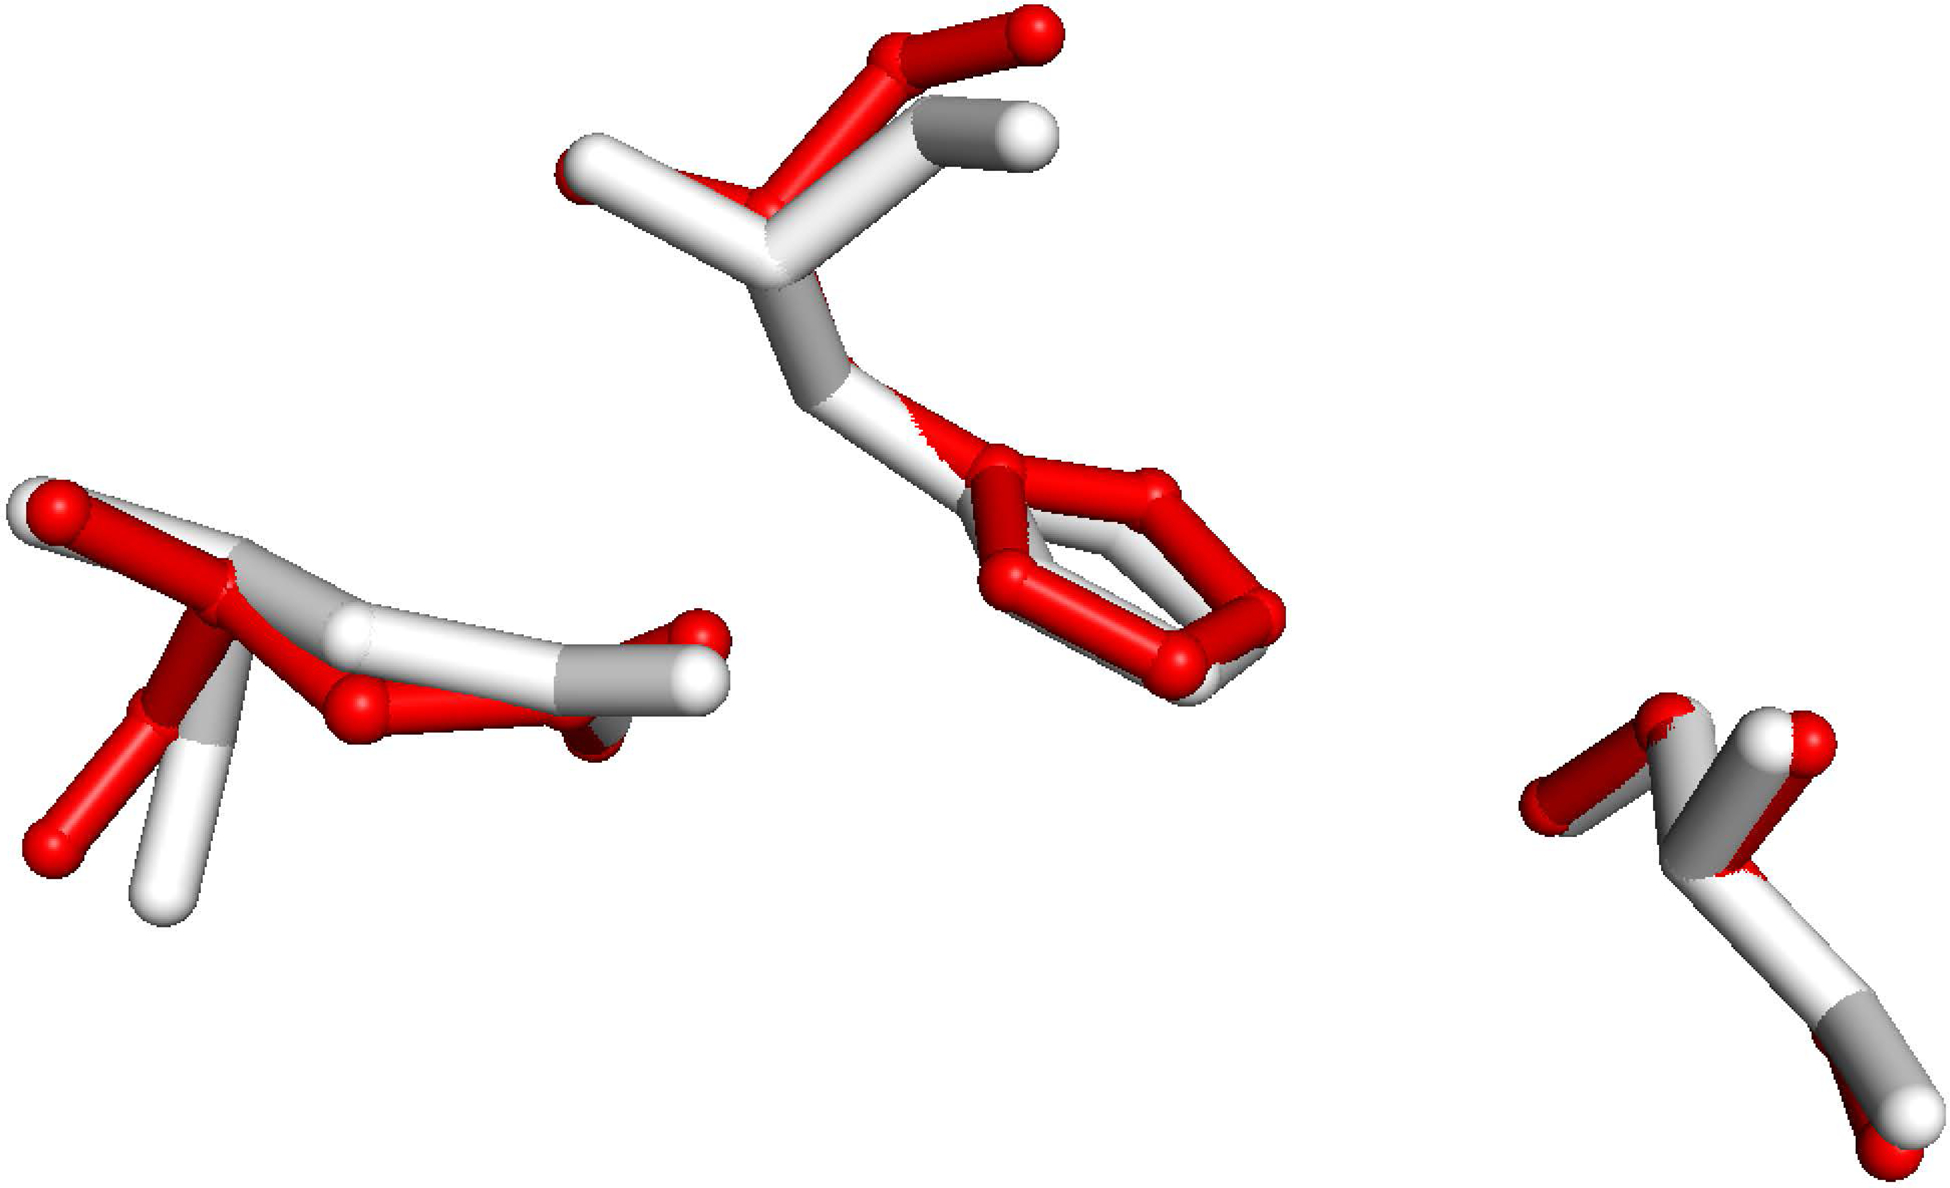
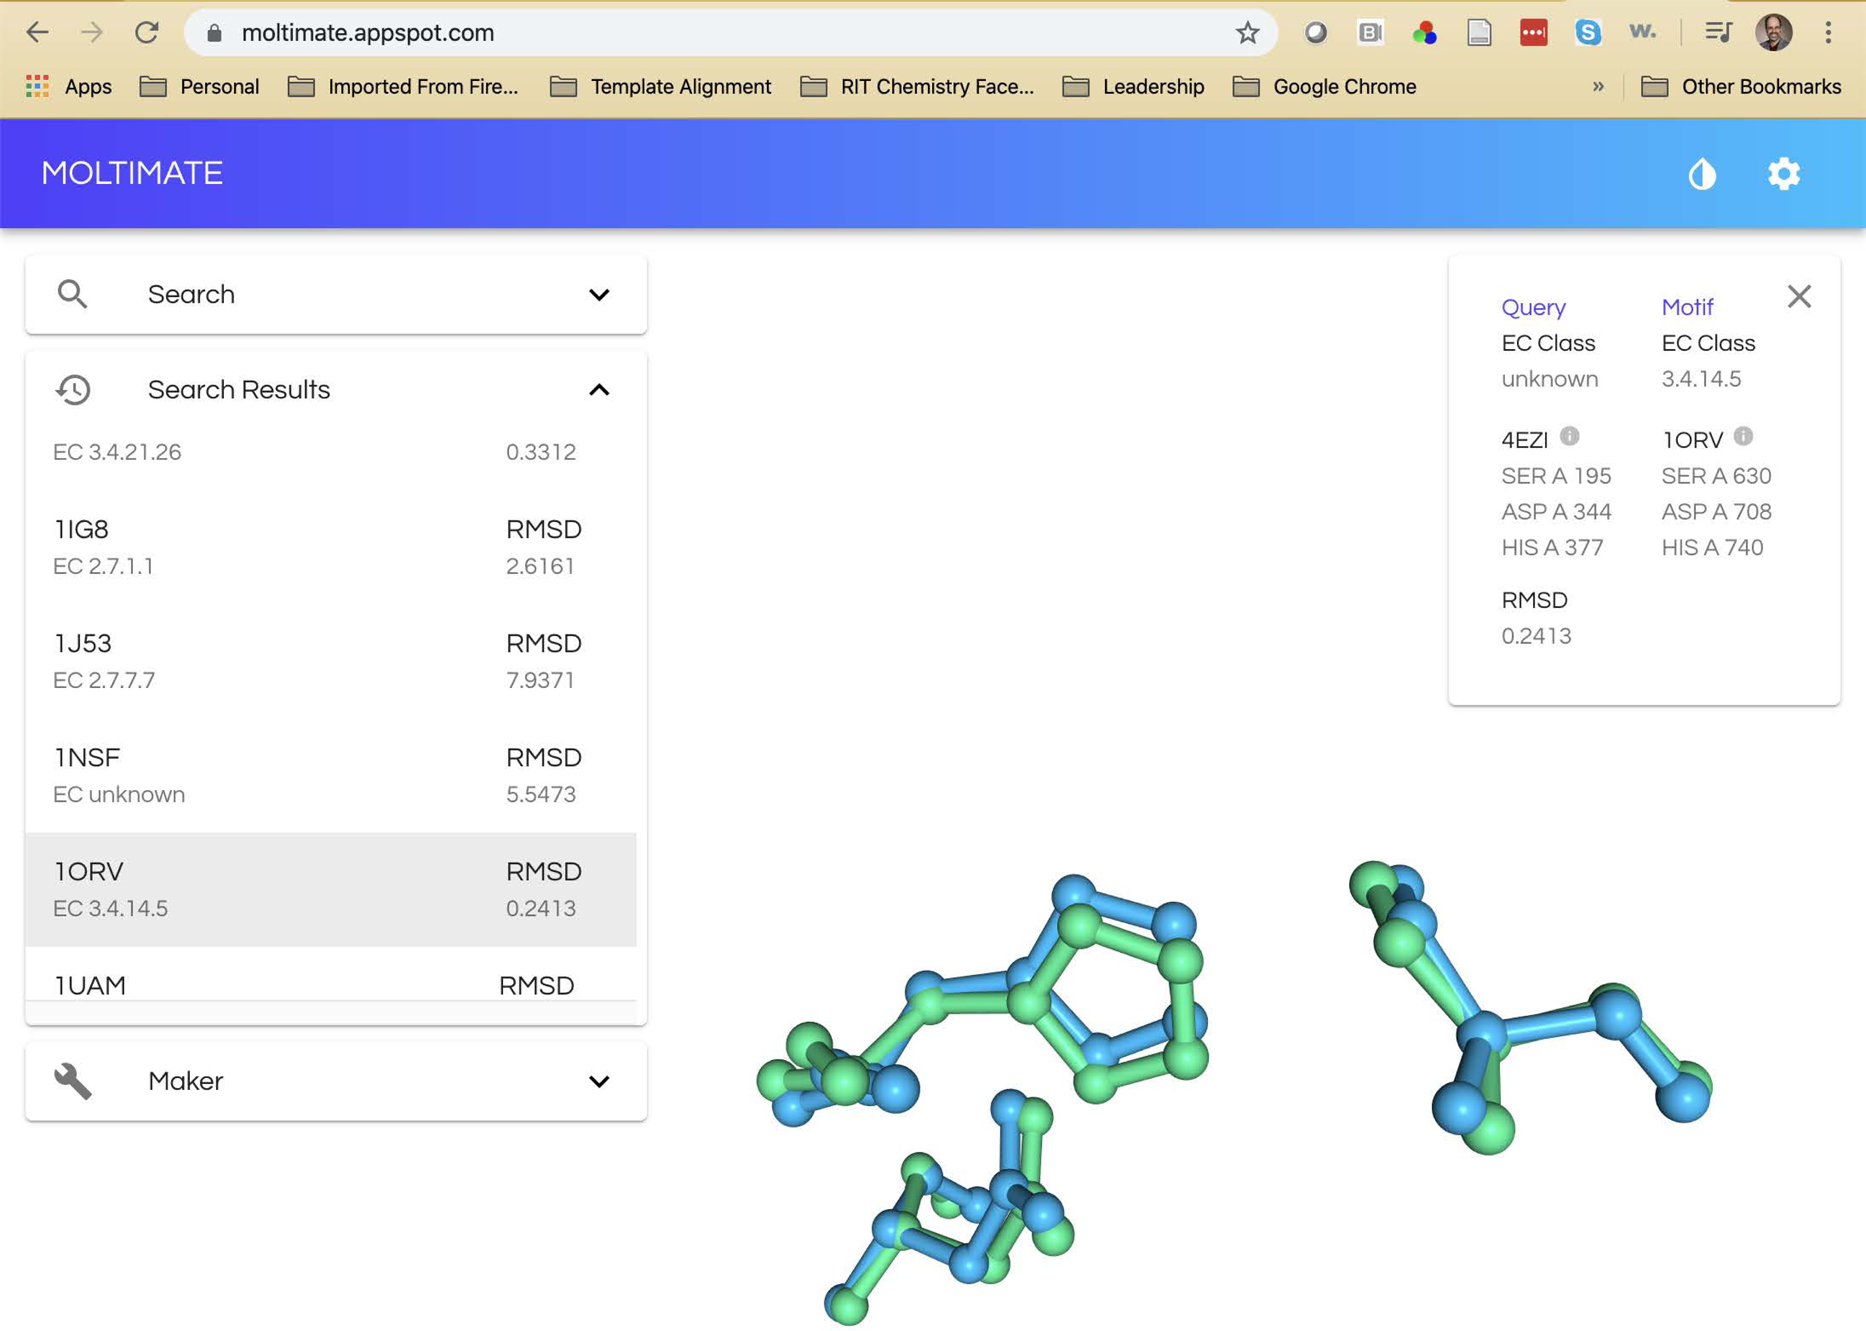
Active site alignments for PDB entries 4EZI (putative hydrolase; [25]) and 1ORV (porcine dipeptidyl peptidase IV; [26]). A. The alignment with ProMOL and PyMOL displays the active site aspartate, histidine and serine residues between the query (4EZI in red) and template (1ORV in white). B. The alignment with the web applications Moltimate displays the same three active site residues between the query (4EZI in green) and template (1ORV in blue).
Over the next several years, research students at RIT and Dowling college cleaned up the computer code, built an extensive library of enzyme active site motifs in ProMOL, using the resources of the Mechanism and Catalytic Site Atlas [15,16], and then used ProMOL/PyMOL to predict functions for more than 3500 structures in the PDB lacking functional annotation. In this process, the students demonstrated tremendous initiative by asking, “What other tools can we use?” and “How can we integrate our results?” They then developed a pipeline that combined in silico analysis with ProMOL[14]/PyMOL[12], BLAST [5], Pfam [17], and Dali [18], with in vitro analysis in the lab where they employed protein expression, purification, electrophoresis, and activity assays. In the process, a pattern emerged:
Undergraduate students joined our lab and learned our tools.
They started asking questions.
They expanded and redirected the project based on their learning and intuition.
They then advanced to further academic or professional careers.
In short, the students engaged in this project were becoming scientists. On the advice of our NIH program officer, we submitted a proposal to the NSF to support development of a Course-based Undergraduate Research Experience in which students would combine computational and wet lab approaches to predict protein function. The initial team consisted of other biochemistry faculty from RIT, and friends from my undergraduate and graduate career. Before funding the project (it took two attempts), NSF insisted that we assemble a larger team, so a recruiting poster was presented at the 2014 ASBMB meeting, disguised as a scientific presentation. Over the course of the next three years, the BASIL team (Table 1) created formal protocols for six wet lab and five computational modules (Table 2).
Table 1.
The BASIL Leadership Team
| Institution | Members |
|---|---|
| Cal Poly San Luis Obispo | Anya Goodman, Ashley Ringer McDonald |
| Grand View University | Bonnie Hall |
| Hope College | Mike Pikaart |
| Nova Southeastern | Arthur Sikora |
| Purdue University | Trevor Anderson, Stefan Irby |
| RIT | Herbert Bernstein, Paul Craig, Jeff Mills, Suzanne O’Handley |
| St. Mary’s University | Colette Daubner |
| SUNY Oswego | Julia Koeppe |
| Ursinus College | Rebecca Roberts |
Table 2.
The BASIL Modules*
| In vitro modules | In silico modules |
|---|---|
| Protein expression | BLAST [5]– sequence alignment |
| Protein purification | Dali [18]– full backbone protein alignment |
| Protein concentration | Pfam [17]– protein family assignment based on sequence |
| SDS-PAGE | PyMOL [12]& ProMOL [14]– enzyme active site alignment |
| Enzyme activity | PyRx [19]– molecular docking |
| Enzyme kinetics |
The BASIL modules are freely available at (https://basilbiochem.github.io/basil/). Video tutorials were created for each of the in silico modules to facilitate training for students and faculty.
As we developed the modules and began implementing the BASIL curriculum in undergraduate biochemistry labs, we encountered a number of challenges, particularly with the learning curve and installation of the programs, especially ProMOL. To address these concerns, a team of software engineering students at RIT developed a web application for enzyme active site alignments as their year-long senior capstone project. The result was the Moltimate web application (Figure 3B; moltimate.appspot.com).
While most of the BASIL team focused on implementing the BASIL curriculum on our campuses, the educational researchers at Purdue (Anderson & Irby) studied student growth during the BASIL curriculum. They identified skills that students are expected to gain in this curriculum (termed Course-based Undergraduate Research Abilities or CURAs [20,21]) and reported on students’ perceived knowledge, experience and confidence for these abilities [22].
Summary.
Many things are needed for successful creation and deployment of software for biochemistry education:
passion and persistence [23];
the commitment of colleagues and friends who begin by testing the software and proceed to employ it in their courses;
seemingly chance encounters with people with widely diverse and essential skillsets;
a growth mindset [24]; and
the willingness to empower other team members to demonstrate their expertise and leadership.
In the end it is always about student learning and growth.
Acknowledgments.
Many thanks to all of the students who contributed to the software development and to all members of the BASIL Consortium. This work was supported by Rochester Institute of Technology, NIGMS award R15GM078077, and National Science Foundation awards 0402408, 1503811, and 1709170. The author declares that he has no conflicts of interest with the contents of this article. The content is solely the responsibility of the author and does not necessarily represent the official views of the National Institute of Health and the National Science Foundation.
References
- 1.Clark BA. (1981) DISSPLA/TELLAGRAF enhancements committee report. Oak Ridge National Lab, TN (USA). [Google Scholar]
- 2.Benson DA, Karsch-Mizrachi I, Clark K, Lipman DJ, Ostell J, Sayers EW. GenBank. (2012) Nucleic Acids Res. 40, D48–D53. [DOI] [PMC free article] [PubMed] [Google Scholar]
- 3.Pearson WR, Lipman DJ. Improved tools for biological sequence comparison. (1988) PNAS. 85, 2444–2448. [DOI] [PMC free article] [PubMed] [Google Scholar]
- 4.Berman HM, Westbrook J, Feng Z, Gilliland G, Bhat TN, Weissig H, et al. The Protein Data Bank. (2000) Nucleic Acids Research. 28, 235–242. [DOI] [PMC free article] [PubMed] [Google Scholar]
- 5.Altschul SF, Madden TL, Schäffer AA, Zhang J, Zhang Z, Miller W, et al. Gapped BLAST and PSI-BLAST: a new generation of protein database search programs. (1997) Nucl. Acids Res 25, 3389–3402. [DOI] [PMC free article] [PubMed] [Google Scholar]
- 6.NCBI Resource Coordinators. Database resources of the National Center for Biotechnology Information. (2016) Nucleic Acids Res. 44, D7–D19. [DOI] [PMC free article] [PubMed] [Google Scholar]
- 7.Consortium Uniprot. UniProt: a hub for protein information. (2015) Nucleic Acids Res. 43, D204–D212. [DOI] [PMC free article] [PubMed] [Google Scholar]
- 8.Fisher A, Sekera E, Payne J, Craig P. Simulation of two-dimensional electrophoresis and tandem mass spectrometry for teaching proteomics. (2012) Biochem. Mol. Biol. Educ 40, 393–399. [DOI] [PubMed] [Google Scholar]
- 9.Richardson DC, Richardson JS. Kinemages--simple macromolecular graphics for interactive teaching and publication. (1994) Trends Biochem. Sci 19, 135–138. [DOI] [PubMed] [Google Scholar]
- 10.Sayle RA, Milner-White EJ. RASMOL: biomolecular graphics for all. (1995) Trends Biochem. Sci 20, 374. [DOI] [PubMed] [Google Scholar]
- 11.Herraez A. Biomolecules in the computer. Jmol to the rescue. (2006) Biochemistry and Molecular Biology Education. 34, 255–261. [DOI] [PubMed] [Google Scholar]
- 12.Delano W. Pymol: An open-source molecular graphics tool. (2002) CCP4 Newsletter On Protein Crystallography. 40, 44–53. [Google Scholar]
- 13.Grell L, Parkin C, Slatest L, Craig PA. EZ-Viz, a tool for simplifying molecular viewing in PyMOL. (2006) Biochem. Mol. Biol. Educ 34, 402–407. [DOI] [PubMed] [Google Scholar]
- 14.Hanson B, Westin C, Rosa M, Grier A, Osipovitch M, MacDonald ML, et al. Estimation of protein function using template-based alignment of enzyme active sites. (2014) BMC Bioinformatics. 15, 87. [DOI] [PMC free article] [PubMed] [Google Scholar]
- 15.Porter CT. The Catalytic Site Atlas: a resource of catalytic sites and residues identified in enzymes using structural data. (2004) Nucleic Acids Research. 32, 129D–133. [DOI] [PMC free article] [PubMed] [Google Scholar]
- 16.Ribeiro AJM, Holliday GL, Furnham N, Tyzack JD, Ferris K, Thornton JM. Mechanism and Catalytic Site Atlas (M-CSA): a database of enzyme reaction mechanisms and active sites. (2018) Nucleic Acids Res. 46, D618–D623. [DOI] [PMC free article] [PubMed] [Google Scholar]
- 17.El-Gebali S, Mistry J, Bateman A, Eddy SR, Luciani A, Potter SC, et al. The Pfam protein families database in 2019. (2019) Nucleic Acids Res. 47, D427–D432. [DOI] [PMC free article] [PubMed] [Google Scholar]
- 18.Holm L, Laakso LM. Dali server update. (2016) Nucleic Acids Res. 44, W351–W355. [DOI] [PMC free article] [PubMed] [Google Scholar]
- 19.Dallakyan S, Olson AJ. Small-molecule library screening by docking with PyRx. (2015) Methods Mol. Biol 1263, 243–250. [DOI] [PubMed] [Google Scholar]
- 20.Irby SM, Pelaez NJ, Anderson TR. How to Identify the Research Abilities That Instructors Anticipate Students Will Develop in a Biochemistry Course-Based Undergraduate Research Experience (CURE). (2018) CBE—Life Sciences Education. 17, es4. [DOI] [PMC free article] [PubMed] [Google Scholar]
- 21.Irby SM, Pelaez NJ, Anderson TR. Anticipated learning outcomes for a biochemistry course-based undergraduate research experience aimed at predicting protein function from structure: Implications for assessment design. (2018) Biochemistry and Molecular Biology Education. 46, 478–492. [DOI] [PubMed] [Google Scholar]
- 22.Irby SM, Pelaez NJ, Anderson TR. Student Perceptions of Their Gains in Course-Based Undergraduate Research Abilities Identified as the Anticipated Learning Outcomes for a Biochemistry CURE. (2020) J. Chem. Educ 97, 56–65. [Google Scholar]
- 23.Duckworth A. (2016) Grit: The power of passion and perseverance. Scribner; New York, NY. [Google Scholar]
- 24.Dweck CS. (2008) Mindset: The new psychology of success. Random House Digital, Inc. [Google Scholar]
- 25.Joint Center for Structural Genomics (JCSG). Crystal structure of a hypothetical protein (lpg1103) from Legionella pneumophila subsp. pneumophila str. Philadelphia 1 at 1.15 A resolution. DOI: 10.2210/pdb4EZI/pdb (2012). [DOI] [Google Scholar]
- 26.Engel M, Hoffmann T, Wagner L, Wermann M, Heiser U, Kiefersauer R, et al. The Crystal Structure of Dipeptidyl Peptidase IV (CD26) Reveals its Functional Regulation and Enzymatic Mechanism. (2003) PNAS. 100, 5063–5068. [DOI] [PMC free article] [PubMed] [Google Scholar]


