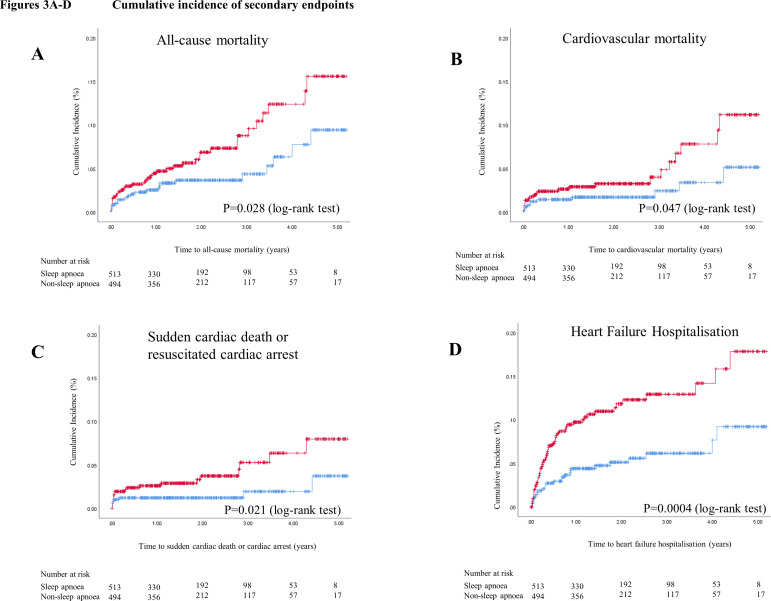
Figure 3.
Cumulative incidence of secondary endpoints. Kaplan–Meier plots showing the cumulative incidences of all-cause mortality (A), cardiovascular mortality (B), sudden cardiac death or resuscitated cardiac arrest (C), and hospitalisation for heart failure (D), respectively, in patients with sleep apnoea (in red) and in patients without sleep apnoea (in blue).

