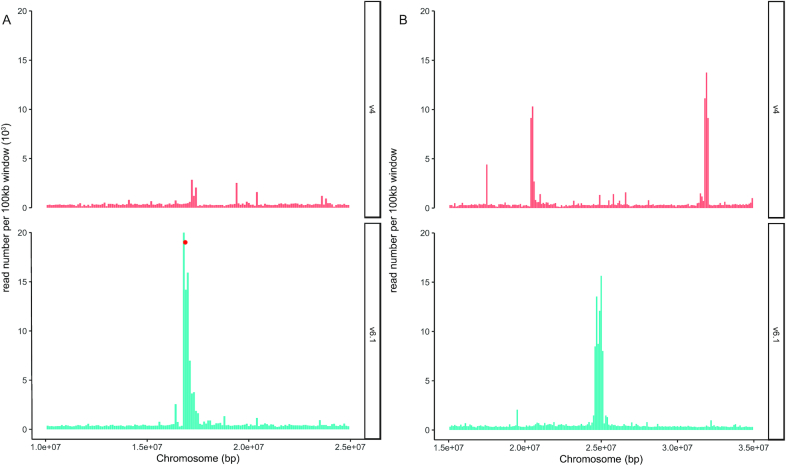
Figure 4:
Improved assembly of the centromeric regions in DM v6.1. (A) CENH3 read distribution on centromere 7. (B) CENH3 read distribution on centromere 10. Chromosomes were divided into 100-kb windows and the CENH3 ChIP-seq read number [45] in each window was calculated and plotted. Red dots represent centromeric repeats. Upper panel shows the CENH3 ChIP-seq read distribution in the DM v4.04 assembly; lower panel shows the distribution in the DM v6.1 assembly.

