

Abstract
The gut–brain axis has attracted increasing attention in recent years, fueled by accumulating symptomatic, physiological, and pathological findings. In this study, the aggregation and toxicity of amyloid beta (Aβ), the pathogenic peptide associated with Alzheimer's disease (AD), seeded by FapC amyloid fragments (FapCS) of Pseudomonas aeruginosa that colonizes the gut microbiome through infections are examined. FapCS display favorable binding with Aβ and a catalytic capacity in seeding the peptide amyloidosis. Upon seeding, twisted Aβ fibrils assume a much‐shortened periodicity approximating that of FapC fibrils, accompanied by a 37% sharp rise in the fibrillar diameter, compared with the control. The robust seeding capacity for Aβ by FapCS and the biofilm fragments derived from P. aeruginosa entail abnormal behavior pathology and immunohistology, as well as impaired cognitive function of zebrafish. Together, the data offer the first concrete evidence of structural integration and inheritance in peptide cross‐seeding, a crucial knowledge gap in understanding the pathological correlations between different amyloid diseases. The catalytic role of infectious bacteria in promoting Aβ amyloidosis may be exploited as a potential therapeutic target, while the altered mesoscopic signatures of Aβ fibrils may serve as a prototype for molecular assembly and a biomarker for screening bacterial infections in AD.
Keywords: amyloid diseases, amyloidosis, brain health cross seeding, gut–brain axis, neurotoxicity
This study reveals a direct cross‐seeding linkage between bacterial amyloid protein FapC seeds and elevated Aβ fibrillization in vitro and in silico, and demonstrates the effects of such cross‐seeding on Aβ‐elicited neurotoxicity and Alzheimer's‐like pathology in a zebrafish model. This study points to the role of infectious bacteria in mediating brain health.
1. Introduction
The gut microbiome is essential for regulating the homeostasis in the body and plays subtle to pivotal roles in the pathogeneses of a wide range of human disorders, from dementia and inflammation to obesity, depression, and cancer.[ 1 , 2 , 3 , 4 ] The relevance of the gut–brain axis to human health has been proposed for more than a decade,[ 5 ] and has recently come to the fore as a mainstream paradigm in the study of neurological disorders. Indeed, the discovery of the gut–brain axis has exposed a linkage between the gut microbiome, their metabolites, and neurological disorders such as Alzheimer's disease (AD) and Parkinson's disease (PD).[ 6 , 7 , 8 ] Different anatomical and physiological connections, majorly from autonomic innervation of the gut, can communicate the influence of the gut microbiome toward the pathogenesis of neurological disorders.[ 9 , 10 , 11 ] Ample evidence indicates that compromised gut‐microbiome can indirectly prompt the pathogenesis and progression of AD via maturation of autoimmune response against amyloid β (Aβ), BDNF expression, upregulation of NMDA receptors, and activation of proinflammatory cytokines like IL‐17A and NF‐kB.[ 12 , 13 , 14 , 15 ] On the other hand, alpha‐synuclein (αS), associated with PD, has been shown to shuttle from the gastrointestinal tract to the lower brain via the vagus nerve.[ 16 , 17 , 18 ] A gut–brain neural circuit has been recently identified for nutrient and microglial sensory transduction, further implicating the gut microbiome as central to the signaling of the brain.[ 19 , 20 , 21 ]
AD is a major neurodegenerative disorder, characterized by the presence of extracellular Aβ plaques and intracellular hyperphosphorylated tau tangles.[ 22 ] Aβ not only exists in the brain, but also in the circulation and in cerebrospinal fluid,[ 23 ] raising the possibilities of its coaggregation and cross‐seeding with other amyloidogenic proteins.[ 24 , 25 ] Indeed, cytoplasmic Aβ and tau deposits have been found in the pancreatic β cells of AD and type 2 diabetes (T2D) subjects,[ 26 ] and oligomeric and fibrillar Aβ and αS promoted each other's amyloidosis through in vitro cross‐seeding.[ 27 ] Deposition of Aβ has induced enhanced cortical αS lesions in the brain autopsy of PD and Lewy body disease cases,[ 28 ] while crossing transgenic (Tg) AD mice with αS Tg mice carrying an A53T mutation synergistically accelerated both AD and PD neuropathologies.[ 29 ] Natural silk from Bombyx mori, prion protein Sup35 from Saccharomyces cerevisiae, and the bacterial curli protein CsgA from Escherichia coli all enhanced the amyloidosis of amyloid protein A (AA) in mice,[ 30 ] suggesting that cross‐seeding proteins of distinctly different domains and pathogenic relevance is a plausible disease mechanism. Furthermore, curli stimulated aggregation of αS in biochemical assays as well as in vivo,[ 31 ] and CsgC, which inhibited CsgA fibrillation both in vivo and in vitro, also inhibited aggregation of αS though not Aβ.[ 32 ]
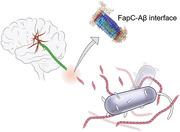
While resemblances in sequence and aggregation state seemingly play a role, the molecular mechanisms of cross‐seeding amyloid proteins remain crucially lacking.[ 33 , 34 , 35 ] As bacterial endotoxins and bacterial amyloid fragments possess realistic possibilities of accessing the brain via gastric autonomic innervation,[ 9 , 10 ] and crossing the compromised gut‐blood barrier and the blood‐brain barrier,[ 36 , 37 , 38 ] especially for those having gut infections and/or aged population groups, here we examined the cross‐seeding capacity of FapC, a major protein constituent of the extracellular amyloid matrix of bacteria Pseudomonas aeruginosa, for Aβ (Scheme 1 ). Our results collectively implicated that FapC seeds (FapCS) propagated their structural characteristics and acted as a catalyst for promoting Aβ amyloidogenesis in vitro, in silico and in a zebrafish AD model.
Scheme 1.
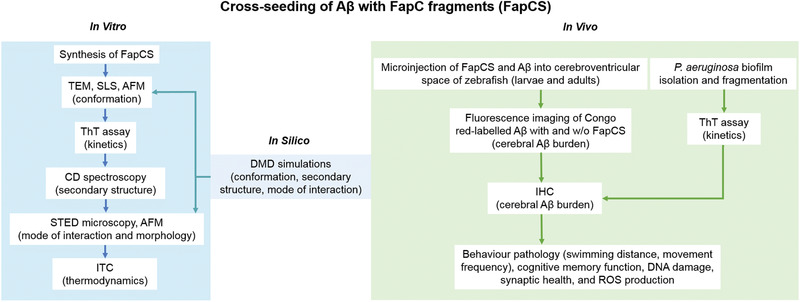
Cross‐seeding of Aβ and FapC fragments (FapCS), involving complementary in vitro and in silico techniques as well as in vivo assays.
2. Results and Discussion
2.1. Scheme of Study
P. aeruginosa, though not a regular member of the physiological gut‐microbiota, is frequently involved in intestinal infections and inflammatory conditions like colitis, gastroenteritis, and diarrhea.[ 39 , 40 , 41 ] P. aeruginosa secretes protein FapC, which self‐assembles into functional amyloid fibrils to constitute the biofilm scaffold.[ 40 , 42 ] The Fap operon is also shared by other opportunistic gastric pathogens like Aeromonas caviae and Laribacter hongkongensis.[ 43 , 44 ] To understand the gut–brain connection on the molecular level, here we first examined the cross‐seeding capacity of FapC fragments (obtained by sonication of mature fibrils to generate small seeds) on Aβ aggregation in vitro. In vivo cross‐seeding was studied by coinjecting FapC seeds (FapCS) and Aβ to the cerebroventricular space of larval and adult zebrafish. Pathological indicators such as behavior, cognitive memory function, cerebral Aβ burden, synaptic health, production of reactive oxygen species (ROS), as well as cell degeneration were examined. Finally, the biofilm from P. aeruginosa colonies containing FapC amyloid was isolated, fragmented and coinjected with Aβ fragments to the cerebrovascular space of adult zebrafish to study their compound pathologies (Scheme 1).
2.2. In Vitro Cross‐Seeding of FapCS and Aβ
FapCS was obtained by sonication of mature FapC fibrils (formed by 1 week of incubation of the protein in water, at 37 °C). The sonication settings (see Experimental Section) provided with finely dispersed FapCS seeds and maximum number of catalytic surfaces to interact with Aβ. Higher sonication power and time would have provided no notable differences and lower settings would increase the seed size and lower the availability of catalytic surfaces. Also, larger seeds could sequester Aβ on the longitudinal axis, decreasing the interaction with Aβ from the catalytic sites of the seeds. FapCS was then cross‐seeded with Aβ (50 ×10−6 m) at a 1:10 molar ratio, inducing an acceleration of Aβ fibrillization as indicated by a thioflavin T (ThT) kinetic assay (Figure 1A). The rationale for using this molar ratio was to expose Aβ with a minimum amount of FapCS. As this ratio provided sufficient acceleration to bypass the lag phase of Aβ fibrillization, we opted for this ratio for the following experiments. In contrast, FapC monomers or fibrils lacked such acceleratory effect, suggesting the cross‐seeding capacity was specific to FapCS. This may be attributed to the high concentration of truncated ends in FapCS, which can stimulate the binding and fibrillization of Aβ monomers. In addition to that, the physical presence of FapC monomers and fibrils could reduce mutual Aβ–Aβ interactions to slow down the peptide fibrillization. Specifically, the fibrillization rate constant (k) of Aβ was markedly increased from 0.7 to 1.6 h−1 in the presence of FapCS (Figure 1B), while the lag time of Aβ was essentially abolished and the fibrillization half‐life was decreased by 86% (Figure 1C,D). Static light scattering (SLS) also reflected a significantly more rapid Aβ fibrillar growth when incubated with FapCS (Figure 1E). Transmission electron microscopy (TEM) imaging revealed that, when fibrillated alone, Aβ existed in the form of prefibrillary oligomers after 12 h of incubation (Figure 1F). A TEM image of FapCS is presented in Figure 1G. The molecular weight of FapC (PAO1) is 31.5 kDa,[ 45 ] however during amyloid formation the protein molecules are tightly packed into the contour of their fibril.[ 46 , 47 , 48 ] This can explain the formation of small‐sized spherical FapCS from mature and brittle FapC fibrils. In comparison, fully formed Aβ amyloid fibrils were observed in the Aβ + FapCS sample at 12 h (Figure 1H), where some FapCS appeared to adsorb onto the growing Aβ fibers. Atomic force microscopy (AFM) also displayed adsorption of FapCS on Aβ (Figure 1I), as well as further mesoscopic transformations of the Aβ fibrils upon cross seeding, as revealed by statistical analysis of the AFM images with FiberApp.[ 49 ] Specifically, the pitch size of the Aβ fibrils was significantly shortened from 43 nm for native Aβ fibrils to 23 nm for Aβ fibrils seeded by FapCS, with the latter approximating that of FapC fibrils at 26 nm (Figure S1, Supporting Information). Furthermore, the Aβ fibrils seeded by FapCS possessed a diameter of 7.0 ± 2.1 nm, considerably thicker than that of native Aβ fibrils (5.1 ± 1.0 nm) or FapC fibrils (3.6 ± 1.0 nm) (Figure S1, Supporting Information, indicated accurately by fibril heights in AFM). This indicates that FapCS has major consequences on the mesoscopic properties of Aβ fibrils. The TEM images of Aβ incubated with FapC fibrils and monomers are presented in Figure S2 (Supporting Information). The FapC monomers appeared to aggregate on top of Aβ fibrils. Aβ, when incubated with preformed but nonsonicated FapC fibrils, did not coat FapC fibrils. However, the fibrillization of Aβ was significantly suppressed according to ThT fluorescence. In amyloidosis, physical properties like the pitch size and stiffness of amyloid fibrils evolve over time to yield increased fibrillar stiffness.[ 50 , 51 , 52 ] Indeed, FapCS derived from younger FapC fibrils (fibrillated for 4 d at 37 °C and 25 °C) accelerated Aβ fibrillization (Figure S3, Supporting Information), but less than the seeds derived from mature FapC fibrils (fibrillated for 7 d at 37 °C) (Figure 1A). This age dependence can be explained by the brittle nature of mature fibrils,[ 53 ] or simply by the greater population of mature fibrils to yield more seeds. In addition, Aβ seeds promoted an early onset of the peptide fibrillization as well (lag time: 1.9 h), but with a slower elongation than with FapCS (k: 0.03 h−1). This implies a lower seeding capacity of Aβ seeds than FapCS for the peptide aggregation (Figure S3, Supporting Information). In contrast to FapCS, the seeds from whey protein β‐lactoglobulin amyloids (bLgS) did not render any acceleration of Aβ fibrillization, as corroborated by ThT, SLS, and TEM assays (Figure S4, Supporting Information). The controls for the ThT and SLS assays are presented in Figure S5 (Supporting Information). A TEM image of control FapC and mature Aβ fibers is presented in Figure S6A (Supporting Information), while the ThT assay and the kinetic parameters of FapC alone are displayed in Figure S6B–E (Supporting Information). We further analyzed the secondary structural content of Aβ, in the presence or absence of FapCS, using circular dichroism (CD) spectroscopy (Figure 1J,K). The β‐sheet content of Aβ increased from 28% at 0 h to 33% at 12 h and 54% at 48 h, when incubated at 37 °C. However, coincubation of Aβ with FapCS resulted in an abrupt increase of the β‐sheet content to 59% at 12 h, indicating accelerated Aβ fibrillization (Figure 1K). In contrary to FapCS, bLgS did not induce β‐sheet formation in Aβ; instead the α‐helical and random‐coil structures of bLgS were slightly increased after incubation with Aβ indicating sequestration of Aβ monomers by bLgS (Figure S7, Supporting Information).[ 54 ] Although both bLg and FapC are functional amyloids, the Aβ cross‐seeding was only observed with FapCS. This specificity of cross‐seeding with FapCS can be attributed to the intrinsic property of bacterial biofilms to dynamically communicate and cross‐seed, at inter and intra species level, to update their biofilms.[ 55 , 56 , 57 ] The binding affinity between FapCS and Aβ monomers was further studied via isothermal titration calorimetry (ITC). The ITC data were corrected for Aβ against the diluent. The binding free energy (ΔG = −7.9 ± 3.5 kcal mol−1) indicated a weak but favorable interaction, in which a stabilizing (negative) contribution from enthalpy was partially cancelled out by a destabilizing (also negative) contribution from the entropic factor (TΔS = −172 ± 12.4 kcal mol−1) (Figure 1L,M). The stabilizing enthalpic interaction between Aβ and FapCS could involve hydrogen bonding and electrostatic interaction. The stronger binding likely resulted in sequestration of Aβ and hence its aggregation mitigation, as verified by bLgS ( Figure S4A, Supporting Information). Insubstantial binding was observed for bLgS and Aβ by ITC (Figure S8, Supporting Information), which can be attributed to the non‐uniform nature of bLgS. Furthermore, we performed immunostaining of Aβ and Aβ + FapCS after 12 h of incubation (Figure 1N) using an antibody specific for Aβ fibrils. Aβ incubated with FapCS showed a much stronger antibody recognition than Aβ alone (Figure 1O), indicating faster Aβ fibrillization into immune‐recognizable amyloids in the presence of FapCS.[ 58 ] Stimulated emission depletion (STED) microscopy, a super‐resolution imaging technique, revealed adsorption of FapCS (labeled with Alexa 647) onto Aβ amyloid fibrils (labeled with ThT) (Figure 1P). It can be deduced that, similar to TEM and AFM (Figure 1H,I), FapCS provided a catalytic surface through a mechanism similar to that of heterogeneous nucleation to initiate Aβ fibrillization.[ 59 ] In addition to adsorption, intercalation of FapCS inside the Aβ fibrils was also observed (Figure 1P). This could occur when FapCS were smaller in size and were oriented in the right directions upon interacting with Aβ in fibrillization, as corroborated by the altered mesoscopic properties of Aβ fibrils upon cross seeding (Figure S1, Supporting Information). Finally, X‐ray diffraction on oriented fibrils revealed an intersheet and interstrand distance of 9.6 and 4.7 Å, respectively, comparable for native Aβ, FapCS‐seeded Aβ and FapC fibrils ( Figure S9, Supporting Information). The two distances were clearly separated into equatorial (9.6Å) and meridional (4.7Å) reflections as expected for a classic cross‐β structure.[ 60 ]
Figure 1.
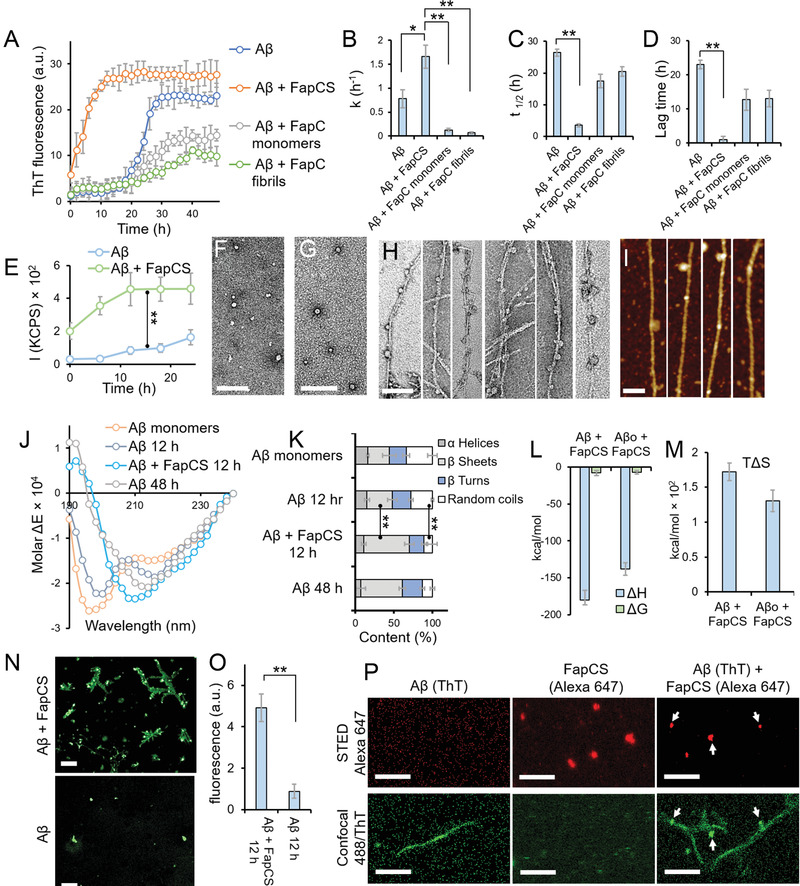
In vitro cross‐seeding between FapC fragments (FapCS) and Aβ. A) ThT assay of Aβ (50 × 10−6 m, incubated at 37 °C) in the presence or absence of FapCS, FapC monomers or preformed FapC fibrils (5 × 10⁻⁶ m) (n = 3). B‐D) ThT kinetic parameters of fibrillization rate constant k (B), half‐life t 1/2 (C) and lag time (D) (n = 3). FapCS significantly increased (*, p < 0.05) k of Aβ, while the parameter was significantly suppressed (**, p < 0.005) with FapC monomer and fibrils. t 1/2 and lag time of Aβ were significantly shortened (**, p < 0.005) by FapCS. E) Static light scattering (SLS) indicating a rapid growth in the size of Aβ fibrils, immediately after mixing with FapCS (n = 3). F) TEM images of Aβ (at 12 h showing prefibrillar species) and G) FapCS (scale bar: 100 nm). H) TEM and I) AFM images of Aβ incubated with FapCS at 12 h (scale bar: 100 nm). J) CD spectra and K) secondary structure of Aβ alone and with FapCS (n = 3). After 12 h of incubation, the negative peaks of Aβ at 215 and 198 nm were slightly increased and decreased in intensity, respectively, indicating a transition from random coil (decreased from 34 ± 6 to 28 ± 1.5%) to β‐sheet (slightly increased from 28 ± 9 to 33 ± 6%). At 48 h, a strong negative peak appeared at 201 nm representing formation β‐sheets rich (54 ± 4.5%) fibrils. However, similar β‐sheets rich structure (59 ± 6%) were observed in Aβ + FapCS sample at 12 h time point. L) Enthalpy (ΔH) and free energy (ΔG), M) entropic factor (TΔS) for binding between FapCS and Aβ monomers or oligomers (Aβo) (n = 3). N) Immunolabeling of Aβ with β‐amyloid specific antibodies (scale bar: 10 × 10−6 m). O) Quantification of green fluorescence intensity from (N) (n = 3). Significantly higher immune‐recognition (**, p < 0.005) was observed with Aβ + FapCS than Aβ alone, after 12 h incubation. P) STED microscopy of Aβ + FapCS (scale bar: 1 × 10⁻⁶ m). FapCS labeled with Alexa 647 appeared to be adsorbed onto or integrated into Aβ fibrils that were labeled with ThT.
2.3. DMD Simulations Revealed the Molecular Interactions between FapCS and Aβ
We applied all‐atom discrete molecular dynamics (DMD) simulations—a rapid and accurate molecular dynamics algorithm[ 61 ]—to understand the molecular interactions between FapC and Aβ. This was done by mimicking the experimental identification of the binding hotspot regions between Aβ and human islet amyloid polypeptide in an earlier study.[ 62 ] Briefly, the full‐length FapC sequence was divided into ten‐residue fragments with overlapping sequences, and binding simulations of each fragment with an Aβ42 monomer (abbreviated as Aβ hereafter) were performed (see Experimental Section). Three hotspot regions with residues 41–50, 91–100, and 131–140 were found to entail high binding frequencies with Aβ (Figure 2A). These hotspot fragments tended to bind Aβ in the latter's central hydrophobic core of residues 16–22 and the C‐terminus 31–42, as indicated by the intermolecular contact frequency maps (Figure S10, Supporting Information). Driven by hydrophobic interactions, these peptides featured a relatively high β‐sheet content upon binding with Aβ (lower panel in Figure 2A).
Figure 2.
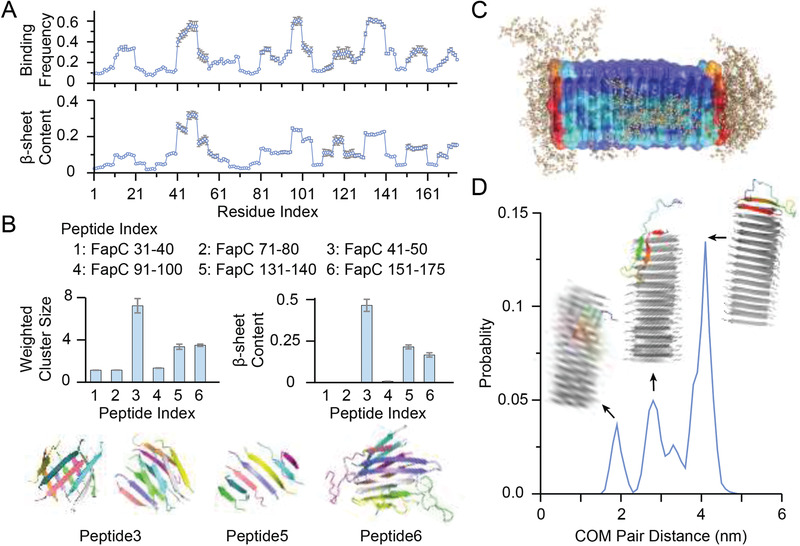
DMD simulations of molecular interactions between FapC and Aβ. A) The averaged binding frequency of each FapC with Aβ42 monomer (top) and the corresponding β‐sheet structure propensity (bottom). The results were obtained from binding simulations of Aβ42 with 10‐residue FapC with overlapping sequences. B) Mass‐weighted average cluster or aggregate sizes (top left) and β‐sheet contents (top right) obtained from aggregation simulations of six tested peptides, including three Aβ‐binding hotspot fragments and three controls for comparison. Typical snapshots of these cases formed β‐sheet rich aggregates (bottom). FapC was individually colored. C) Overlaying of final snapshots from ten independent cross‐seeding simulations, where preformed nanofibril by FapC41‐50 was shown as cartoon with molecular surface colored according to each residue's binding probability with Aβ from low (blue) to high (red). Aβ42 atoms were shown in wheat spheres. D) The intermolecular center‐of‐mass (COM) distance distribution between Aβ42 and the FapC nanofibril. Representative structures as cartoon were shown for each peak as inset with FapCS colored in gray and Aβ42 in rainbow.
To evaluate whether the Aβ‐binding hotspot fragments of FapC were amyloidogenic, the self‐assembly of multiple Aβ peptides was simulated. For comparison, three other nonhotspot fragments of residues 31–40, 71–80, and 151–175 were also tested. The C‐terminal 25‐residue fragment was selected from the repeat 3 region of FapC (R3), which is experimentally known to contribute to the fibrillization of FapC.[ 63 ] For each 10‐residue fragment, ten peptides were used for the aggregation simulations while seven peptides were simulated for the 25‐residue R3 fragment. The hotspot fragment FapC41‐50 formed large aggregates with high β‐sheet contents, where both multilayer β‐sheets and β‐barrels were observed (Figure 2B). FapC131‐140 only formed small single‐layer β‐sheets, while FapC91‐100 stayed as monomers. For the nonhotspot fragments tested, only FapC150‐175 from the R3 region formed multilayer β‐sheets, in agreement with prior experimental studies.[ 63 ]
Since only FapC41‐50 among the Aβ‐binding hotspot regions was amyloidogenic, a preformed FapC41‐50 nanofibril was used to seed Aβ in the simulation. Starting from the dissociated state with random initial positions and orientations, Aβ bound the FapC nanofibril in all ten independent simulations. The nanofibril surfaces with strongest binding for Aβ were the two exposed ends with unsaturated backbone H‐bond donors and acceptors (Figure 2C). In most simulations, Aβ initially bound to the lateral surface and underwent random diffusion along the lateral surface towards the ends (Figure S11, Supporting Information), where both the central hydrophobic core around residues 16–22 and the C‐terminal residues 31–42 formed β‐sheets via H‐bonding with the exposed FapC backbone. Only in one out of the ten independent simulations Aβ stayed on the lateral surface of the FapC nanofibril. As a result, the probability distribution of center‐of‐mass (COM) distances between the Aβ monomers and the FapC41‐50 nanofibril featured three peaks (Figure 2D), where the highest peak corresponded to binding of the peptide at the two nanofibril ends. The other two minor peaks resulted from Aβ binding on the lateral nanofibril surface with the smallest intermolecular distances and the intermediate state with Aβ partially bound to the ends forming only one β‐strand with the nanofibril (Figure S11, Supporting Information). The simulation observations that the exposed FapC41‐50 nanofibril ends were more active than lateral surfaces in terms of Aβ binding and β‐sheet conversion were consistent with our experimental observation that FapCS, instead of FapC fibrils, accelerated Aβ aggregation (Figure 1A).
Our simulations demonstrated that FapC had several Aβ‐binding hotspots scattered along the protein sequence, among which only FapC41‐50 was amyloidogenic to allow incorporation of Aβ into the corresponding nanofibril, i.e., seeding the fibrillization of Aβ. These results were consistent with the experimental observation that a fraction of FapCS was incorporated into Aβ fibrils while other FapCS adsorbed to the sides of Aβ fibrils. Together, our computational and experimental results suggested that the exposed surfaces of FapCS upon sonication were likely heterogeneous and only a subset of FapCS with the “seeding‐competent” hotspots exposed could nucleate the formation of Aβ fibrils, while the rest bound to Aβ via other hotspot sequences.
2.4. FapCS Accelerated Aβ Pathology in Zebrafish Larvae
The zebrafish has recently been developed as a high‐throughput animal model to study Aβ toxicity and its associated AD pathologies.[ 64 , 65 ] Taking advantage of the optical transparency of zebrafish larvae, Aβ fibrillization after cerebroventricular injection can be monitored directly in the brain via Congo red.[ 65 ] Here, one week old zebrafish larvae were injected with Aβ (100 × 10−15 m) or Aβ + FapCS at a 10:1 molar ratio. One week or 2 d postinjection, Congo red (100 × 10−15 m) was injected in the cerebroventricular space of the larvae and the presence of Congo‐red‐tagged Aβ amyloids in the larval brain tissues was imaged (Figure 3A). Congo red is highly specific in staining of amyloid fibrils and is extensively used for fluorescence imaging of amyloid deposits in tissue samples.[ 66 , 67 , 68 ] Higher levels of Congo red fluorescence (relative intensity: lateral/dorsal, 1/0.94), indicative of Aβ fibrillization, was observed 2 d postinjection with the sample of Aβ + FapCS (Figure 3B). However, it took one week for Aβ to fibrillate in the larval brain (relative intensity: lateral/dorsal, 0.98/0.68), while no fibrillization was observed 2 d postinjection (relative intensity: lateral/dorsal, 0.17/0.1). This indicates that FapCS was able to seed and effectively accelerate Aβ fibrillization in vivo. FapCS alone and the buffer control were unable to retain Congo red in the brain and insignificant fluorescence was observed at 2 d (Figure 3A) or one week time point (Figure S12A, Supporting Information). The neuronal toxicity of Aβ fibrillization was further evident in terms of behavioral pathology, i.e., movement frequency and distance traveled by zebrafish (Figure 3C,D). Specifically, Aβ coinjected with FapCS impaired the larval swimming behavior and the total distance traveled 2 d postinjection. The larvae injected with Aβ + FapCS swam 6.4 ± 4.4 cm h−1 as compared to 36 ± 4 cm h−1 for the buffer control. It took one week for Aβ alone to induce a similar extent of behavioral pathology. The slightly lower movement frequency for Aβ at 2 d can be attributed to the toxicity associated with Aβ fibrillization, which was insignificant at 2 d (first affecting movement frequency) but became more potent after one week. The larval movement frequency for the buffer control is presented in Figure S12B (Supporting Information). Aβ aggregation is associated with ROS, NO, and inflammatory cytokine generation via mitochondrial dependent or independent pathways to aggravate AD insults.[ 69 , 70 ] The ROS generation in the brain homogenates of larvae, treated with Aβ, Aβ + FapCS, or FapCS, was measured by a dichlorofluorescein (DCF) assay. The ROS induced by Aβ + FapCS 2 d postinjection (DCF fluorescence: 55.3 ± 11 a.u.) was comparable to that by Aβ alone at one week (59.1 ± 11 a.u.), and was significantly higher than that by Aβ alone at 2 days (8.9 ± 2.5 a.u.) (Figure 3E).
Figure 3.
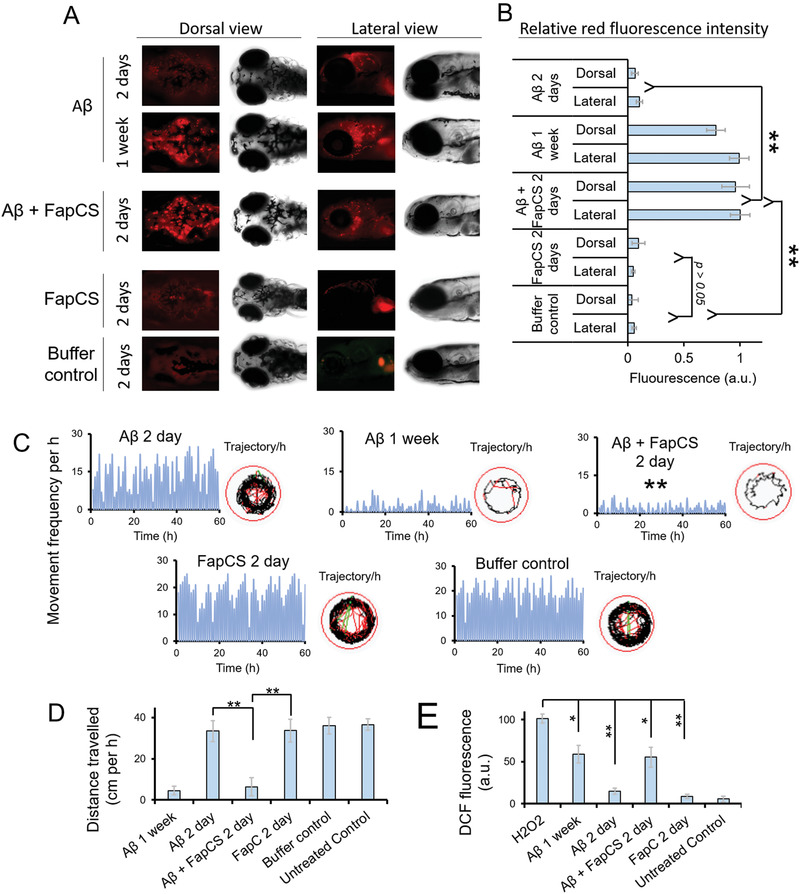
FapCS accelerated Aβ fibrillization and associated pathology in zebrafish larvae. Aβ (100 × 10−15 m), FapCS (10 × 10−15 m) or Aβ + FapCS at a 10:1 molar ratio (100:10 × 10−15 m) were injected to the cerebroventricular space of one week old zebrafish larvae. Congo red (100 × 10−15 m) was injected at 2 d or one week post Aβ injection to stain and monitor the Aβ fibrillization. A) The fluorescence images recorded via the brightfield and red fluorescence channel of a microscope for the whole‐mount dorsal and lateral side of larvae. B) Quantitative measurement of the relative red fluorescence intensity, indicative of Congo‐red‐stained Aβ plaques, from the cerebral region of larvae (n = 10). Aβ injected together with FapCS presented significantly stronger (**, p < 0.005) fluorescence and thus elevated Aβ fibrillization compared to Aβ alone or buffer, at 2 d postinjection. FapCS did not show any retention of Congo red fluorescence in the brain. C,D) Aβ‐induced behavioral pathology in terms of movement frequency (C) and total distance traveled by zebrafish larvae (D) (n = 10 per group and three groups per sample). The measurements were made for the observation period of 1 h at 2 d and one week postinjection. FapCS significantly aggravated (**, P < 0.005) Aβ toxicity and reduced the movement frequency and total travel distance of the larvae at 2 d postinjection. E) ROS generation in the brain homogenates of zebrafish larvae presented as relative DFC fluorescence. H2O2 was used as positive control. Similar to behavioral toxicity, Aβ + FapCS significantly enhanced ROS production in the larval brain (n = 10 per group and 3 groups per sample).
2.5. FapCS Accelerated Aβ‐Induced Cognitive Pathology in Adult Zebrafish
Zebrafish larvae offer a transparent in vivo model to characterize Aβ fibrillization and ROS generation for the study of Aβ neurotoxicity. Other advantages of this model include the feasibility of imaging Aβ deposition, allowing high‐throughput assays, and offering an in vivo vertebrate nervous system with all the protein machinery to study the neuropathology of AD. Quick development of Aβ‐toxicity phenotype (in 2–7 d) with small sample volumes is also an advantage of zebrafish as compared to rodent models.[ 65 , 71 ] However, zebrafish larvae are a developing organism, and hence are not optimal for probing the aging‐related clinical pathologies of AD.[ 65 ] We therefore further studied the pathology of FapCS seeded Aβ in adult zebrafish that offer fully developed neuronal and behavioral systems that is clinically relevant to Alzheimer's pathologies.[ 72 ] Aβ (1 µL, 40 × 10−6 m) alone or together with FapCS at a 10:1 molar ratio (Aβ:FapCS) was microinjected to the cerebroventricular space of adult zebrafish. The behavioral pathology, in terms of movement frequency and total distance traveled in a swimming tank, was monitored 4 d and 2 weeks postinjection (Figure 4A,B). Aβ injected along with FapCS suppressed the zebrafish swimming behavior 4 d postinjection (movement frequency: 4 ± 2 per min, distance traveled: 41 ± 5.1 cm per min), which was insignificantly different to what was observed with Aβ alone 2 weeks postinjection (movement frequency: 6 ± 2 per min, distance traveled: 57 ± 6.9 cm per min). However, at 4 d postinjection Aβ did not produce significant difference in the swimming behavior compared to the buffer control (Figure 4B). Zebrafish express human orthologues for AD associated neuronal proteins, i.e., tau, γ‐secretase complex, presenilins and Aβ precursor orthologues, and adopt depression and anxiety associated behavior against environmental insults. This justifies the suitability of zebrafish as an animal model to study the clinically relevant AD pathology.[ 73 , 74 ] Therefore, we further assessed the impact of FapCS‐seeded Aβ on the cognitive memory function of adult zebrafish. The swimming tank was hypothetically divided into two halves (arenas 1 and 2), while one half (arena 2) was labeled with red paper and adult fish was trained to avoid arena 2 by electric shocks (dipping 9 V electrodes into the tank; see Experimental Section). After training, the buffer‐treated control fish avoided swimming into arena 2 (movement frequency: 0 per min, distance traveled: 0 cm per min) and retained their swimming activity within arena 1 (movement frequency: 18 ± 3 per min, distance traveled: 245 ± 38.9 cm per min) (Figure 4C). The fish injected with Aβ + FapCS were not able to avoid arena 2 at 4 d postinjection, and no difference was observed in their swimming activity in arena 1 versus arena 2 (Figure 4D). However, 4 d postinjection, Aβ‐injected fish were able to retain cognitive function and avoid swimming into arena 2. It took 2 weeks for the Aβ‐injected fish to produce a similar cognitively deficit behavior that was induced by FapCS + Aβ 4 d postinjection. FapCS alone did not induce any cognitive deficiencies.
Figure 4.
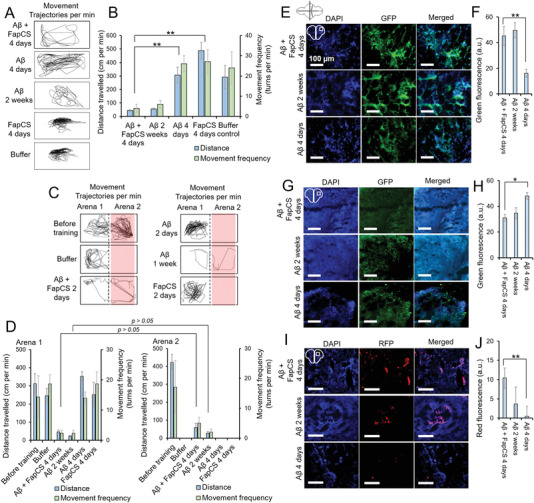
FapCS accelerated Aβ‐induced cognitive and neuronal pathology in adult zebrafish. Aβ (1 µL, 40 × 10−6 m) was injected to the cerebroventricular space of 10 months old adult zebrafish. A) Representative movement trajectories of adult fish after injection with FapCS, Aβ, or Aβ + FapCS. B) The quantitative measurements of movement frequency and total distance traveled by the fish (n = 3 per group and three groups per sample). Aβ + FapCS significantly suppressed (**, p < 0.005) the swimming behavior of adult fish, compared to Aβ alone at 4 d posttreatment. C) Cognitive memory function of the adult fish. The swimming tank was divided into arenas 1 and 2. Arena 2 was labeled with red paper from the bottom and fish was trained to avoid swimming into arena 2. The fish was shocked (9 V) whenever it swam into arena 2. D) Quantitative measurement of movement frequency and distance traveled in arena 1 versus arena 2. Before training, fish were able to freely swim in both arenas and no difference per arena was observed. After training, buffer injected and Aβ (4 d postinjection) fish were able to cognitively avoid swimming into arena 2. However, FapCS + Aβ and Aβ alone at 4 d and 2 weeks postinjection, respectively, were unable to avoid arena 2 and no significant difference in the swimming activities was observed in arena 1 versus arena 2 (n = 3 per group and 3 groups per sample). E) IHC for Aβ deposition in the brain of zebrafish. F) Quantitative measurement of green fluorescence for antibody staining (n = 3). G) Synaptophysin positive cells, H) quantitative measurement of anti‐synaptophysin antibodies labeling (n = 3), I) TUNEL assay and J) quantitative measurement for antibodies labeling in TUNEL assay (n = 3). Aβ alone at 2 weeks and Aβ + FapCS at 4 d presented a similar level of Aβ burden, neurodegeneration of synaptophysin positive cells and neuronal cell death in the fish brain, that were significantly different (**, p < 0.005) than Aβ alone at 4 d postinjection.
We further performed immunohistochemistry (IHC) on the brain slices of adult zebrafish. Aβ deposition was significant in the brain of FapCS + Aβ treated fish 4 d postinjection, similar to the case of Aβ alone 2 weeks postinjection (Figure 4E,F). Two days postinjection Aβ alone did not render any deposition in the fish brain, corroborating the behavioral pathology data. In humans, Aβ deposition in the brain is associated with synaptic degeneration and neuronal cell death.[ 75 , 76 ] FapCS + Aβ and Aβ alone, at 4 d and 2 week postinjection respectively, were able to degenerate synaptophysin‐positive synapses and DNA damage per the TUNEL assay (Figure 4G–J). However, synaptophysin positive neuronal cells and negative TUNEL assay were observed in Aβ‐alone treated fish 4 days post injection. Aβ deposition, synaptophysin staining and TUNEL assay of FapCS alone and buffer‐treated control fish are presented in Figure S13 (Supporting Information). Healthy synapses and no DNA damage were observed with FapCS alone, indicating the non‐toxic nature of FapCS at 4 × 10⁻⁶ m of concentration.
2.6. P. Aeruginosa Biofilm Samples Elevated Aβ Pathology in Adult Zebrafish
To further demonstrate the cross‐seeding influence of bacterial biofilm samples on the pathogenesis of Aβ, we microinjected adult zebrafish with Aβ (1 µL, 40 × 10−6 m) and P. aeruginosa biofilm fragments (protein content) at a 10:1 molar ratio. The P. aeruginosa biofilms were isolated and fragmented via sonication. The biofilm fragments, like FapCS, accelerated Aβ fibrillization in vitro, as indicated by the ThT assay (Figure 5A). The fibrillization rate constant decreased from 0.78 ± 0.19 to 0.45 ± 0.07 h−1. However, the lag time decreased more drastically from 23 h for Aβ to 2.4 h for Aβ + biofilm fragments (Figure S14, Supporting Information). Similar to FapCS, the biofilm fragments appeared to be adsorbed onto the growing Aβ fibrils (Figure 5B). TEM images of P. aeruginosa biofilms and their sonicated fragments are presented in Figure S15 (Supporting Information). The morphology of the biofilm seeds appeared to be different from FapCS, which can be attributed to the presence of other structural components in the bacterial biofilms.[ 77 , 78 ] Following the procedures with FapCS, we coinjected the biofilm fragments with Aβ to the cerebroventricular space of adult zebrafish. The biofilm fragments accelerated the Aβ‐induced behavioral and cognitive pathology 4 d postinjection, while the biofilm fragments themselves did not induce any toxicity (Figure 5C–F). Alongside the behavioral and cognitive dysfunctions, the biofilm fragments also aggravated Aβ deposition and caused damage to synaptophysin‐positive neurons and cell death, as indicated by IHC of the zebrafish brain slices (Figure 5G–L).
Figure 5.
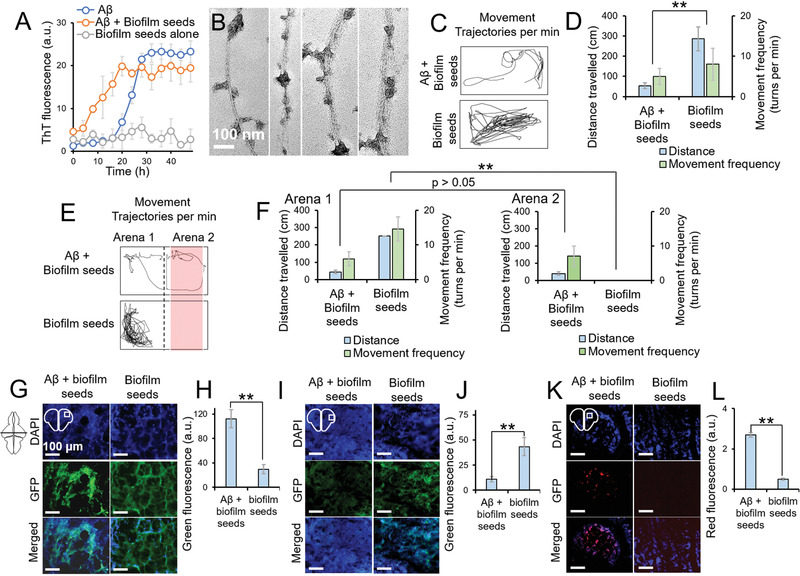
P. aeruginosa biofilm fragments elevated the Aβ pathology in adult zebrafish. ThT assay of Aβ (50 × 10−6 m, 37 °C) in the presence or absence of biofilm fragments (5 × 10⁻⁶ m, with respect to protein contents) (n = 3). Like FapCS, biofilm fragments significantly accelerated Aβ fibrillization. B) TEM images of Aβ fibrillized with biofilm fragments. The fragments appeared to be adsorbed onto Aβ fibrils. C) Movement trajectories and D) quantification of behavioral pathology, at 4 d postinjection, when Aβ was injected together with biofilm fragments (n = 3 per group and 3 groups per sample). Biofilm fragments enhanced Aβ toxicity and significantly (**, p < 0.005) suppressed the swimming behavior of adult zebrafish. E) Movement trajectory and F) quantification of the cognitive behavior of the fish in arena 1 versus arena 2 of the swimming tank (n = 3 per group and 3 groups per sample). Fish injected with biofilm fragments + Aβ presented deteriorated cognitive memory function at 4 d postinjection while biofilm fragments alone did not induce any behavioral toxicity. At 4 days postinjection, adult fish brains were subjected to IHC. H) Aβ deposition and I) quantification of Aβ deposition as green fluorescence of antibody labeling (n = 3), J) synaptophysin positive cells, K) quantification of antibody labeling of synaptophysin positive cells (n = 3), L) TUNEL assay and M) quantification of cell death in TUNEL assay (n = 3). Like FapCS, biofilm fragments enhanced Aβ deposition, accelerated the depletion of synaptophysin positive neurons and induced cell death in the brain of adult zebrafish.
Although the zebrafish does not offer advanced cognitive learning and memory function, as with the rodent AD models, it offers direct imaging of Aβ deposition, quick disease modeling (2–7 d for larvae and 2 weeks for adult) with small sample volumes and neurobehavioral pathologies to study AD. These features can be attributed to the human orthologue genes for Aβ‐associated neuronal machinery and neurobehavioral physiology of zebrafish.[ 65 , 74 , 79 , 80 ]
3. Conclusion
Amyloid fibrils are prone to fragmentation under agitation,[ 81 ] and bacterial colonies along with their biofilms are under constant strain of peristalsis movement and enzymatic stress in the gut.[ 82 , 83 , 84 ] In addition, bacterial amyloid proteins have the propensity to cross‐seed with other secreted proteins of the same colony,[ 85 , 86 ] and may translocate across the leaky gut–blood–brain barrier in aged or gut‐infected subjects[ 87 ] or through autonomic innervation of the gut. Similarly, pathogenic amyloids can also cross‐seed, despite having different sequences, but following similar molecular mimicry of cross‐β stacking.[ 24 , 25 , 27 , 88 , 89 ]
The gut microbiome has been linked to neurological disorders and cancer via the metabolic and autoimmune pathways.[ 90 , 91 , 92 ] In comparison, this study revealed a direct cross‐seeding linkage between pathogenic bacterial amyloid protein seeds and elevated Aβ fibrillization, neurotoxicity, and AD‐like pathologies in a zebrafish model. Structurally, FapC possessed several Aβ‐binding hotspots scattered along its sequence, with only one hotspot being amyloidogenic to allow the incorporation of FapC into Aβ nanofibrils via seeding. The exposed FapCS surfaces were heterogeneous, and therefore only a subset of FapCS exposing the “seeding‐competent” sequence of residues 41–50 could nucleate Aβ fibrillization. Accordingly, FapCS were incorporated into Aβ fibrils as well as adsorbed onto the Aβ fibril surface as observed experimentally (Figure 1). The seeding effects of FapC were further signified by the drastically altered morphology of Aβ fibrils in both pitch size and thickness. In addition to inducing structural integration and inheritance, as first revealed by this study, cross seeding with FapC further elevated the toxicity of Aβ in a zebrafish AD model, yielding severed behavioral and cognitive impairments.
In consideration of recent evidence of the gut–brain axis, together with the results from this study, it can be postulated that fragmented amyloids from infectious bacteria may cross‐seed pathogenic amyloidosis that underlies neurological disorders, thus playing a role in mediating brain health. The mesoscopic transformations of pathogenic amyloid fibrils resulting from cross seeding with bacterial amyloid proteins may stimulate the design of new biomolecular assemblies and facilitate clinical diagnosis of the causative origins of AD.
4. Experimental Section
Animal Husbandry and Ethics Statement
The wild‐type zebrafish (AB, Danio rerio) was bred in a circulatory system (Haisheng, Shanghai, China) at 28 ± 0.5 °C under a 14:10 h light and dark cycle. The experiments with the larvae were performed in Holtfreter's buffer. Tricaine (0.4%) in Holtfreter's buffer was used for anesthesia. For excision of the head from adult fish, the fish was placed in an ice‐chilled Holtfreter's buffer (0.4% tricaine) and the head was separated from the trunk using a sharp surgical knife. The excision was performed under a stereomicroscope and the heads were washed thrice in phosphate‐buffered saline (PBS, pH 7.4) and then stored in 2.5% paraformaldehyde. All in vivo experiments with zebrafish were performed according to Tongji University's ethical guidelines and the protocols were approved by the Animal Center of Tongji University (TJLAC‐019‐113). All other experiments, including in vitro, were performed according to the Occupational Health & Safety (OHS) guidelines of Monash University.
Synthesis of FapCS and Cross‐Seeding with Aβ
FapC seeds (FapCS) were produced by FapC fibrils of three different ages. The FapC monomers were produced as described[ 45 ] and stored in 6 m GdmCl. Prior to fibrillization, the FapC monomers were purified via a PD10 desalting column. FapC monomers (1 mg mL−1 or 40 × 10−6 m) were incubated in deionized water at 37 °C for 1 week to produce mature fibrils and at 37 °C or 25 °C for 4 d to obtain young fibrils. Deionized water was used to make FapC fibrils as it is convenient to transfer the samples to other experimental conditions, i.e., buffered Aβ solution or PBS for in vivo microinjection. However, bacterial amyloids like FapC and curli can make amyloids over a range of conditions.[ 93 ] FapCS were produced by sonicating an aqueous solution of FapC fibrils (10 × 10−6 m) at 20 power of a probe sonicator (Sonics Vibracell: 750 watts and 20 kHz) for 2 min with 1 s on/off cycle. For in vitro cross‐seeding experiments, 50 × 10−6 m of Aβ monomers were incubated with 5 × 10⁻⁶ m of FapCS (10:1 molar ratio, Aβ:FapCS) at 37 °C. bLg amyloids were synthesized by heating of bLg monomers (80 °C, pH 2) of 10 mg mL−1 solution for 24 h. Prior to the production of bLgS, the bLg amyloid solution was brought to pH 7 and then sonicated, similar to FapC, to generate bLgS.
P. aeruginosa biofilm fragments were generated by incubating fresh subcultures of bacteria (wild‐type reference strain PAO1) in cation‐adjusted Mueller‐Hinton broth (CAMHB) overnight in a 96‐well plate. After 48 h of incubation, the planktonic bacteria were pipetted out from the culture and replaced with fresh PBS (pH 7.4). The surface pellicle biofilm and ring biofilm attached to the well walls were scooped out and dispersed in PBS. The separated biofilm chunks were purified from the embodied bacteria by vortexing (10 min) with 20 µm glass beads and then repeated centrifugal washing (3 min, 2000 g) with PBS (pH 7.4). The biofilm containing supernatant was collected, concentrated, and adjusted to the concentration of 5 mg mL−1 in deionized water. The concentration was adjusted with respect to the protein contents of biofilm via the BCA assay. The biofilm fragments were subjected to sonication, same as FapC, to generate biofilm fragments.
ThT Kinetic Assay
Aβ (Anaspec Inc., purity ≥ 95%) was dissolved in 100 µL of hexafluoro‐2‐propanol (HFIP) and incubated at room temperature for 3 h. The acquired aliquots of this solution were freeze dried and stored at −20 °C for further experimentation. Before experiments, Aβ was dissolved in 0.1% NH4OH and then NH4OH was evaporated by opening the vial for 20 min. For the ThT kinetic assay, a 100 µL of aqueous solution containing Aβ (50 × 10−6 m), FapCS or bLgS (5 × 10⁻⁶ m) and ThT dye (100 × 10−6 m) was incubated (37 °C) in a 96‐well plate. The ThT fluorescence (excitation: 445 nm/ emission: 485 nm) was recorded at specified time intervals for 50 h. Kinetic parameters (rate constant k, half‐life t 1/2 and lag‐time) were calculated as described.[ 94 ] Briefly, kinetic curves were fitted to a sigmoidal curve , where y 0 and y max are initial and final ThT fluorescence values, allowing us to calculate lag time = t 1/2 − 2/k.
Static Light Scattering (SLS)
Increases in the size of Aβ in the presence and absence of FapCS or bLgS were monitored by SLS. Solution of Aβ with FapCS or bLgS, at a similar ratio as for the ThT assay, was prepared and incubated. SLS measurements were performed at different time intervals using a Malvern Zetasizer Nano. The parameters were fixed at 7 for attenuator and 4.20 mm for cell position. Quartz cells with low volume capacity (100 µL) were used. The light scattering intensities (kilo counts per sec) and the refractive indices of the samples, buffer alone and toluene were measured.
Transmission and Atomic Force Microscopy
Aβ incubated in the presence or absence of FapCS, FapC monomers, FapC fibrils or bLgS were subjected to TEM imaging. After incubation for 12 h, a drop of sample was applied on a glow‐discharged carbon‐coated copper grid. After 1 min, the sample was blotted and then negatively stained with uranyl acetate (1%) for 30 s. The dried grid was then imaged with a Technei F20 TEM at 200 kV. For AFM, a drop of sample was placed on freshly cleaved mica surface and rinsed with water after 2 min and dried with pressurized air. The sample was scanned with an AFM (Nanoscope VIII Multimode Scanning Force Microscopes, Bruker), covered with an acoustic hood to minimize the vibrational noise. Images were acquired under the tapping mode with a silicon nitride cantilever (Bruker). AFM images were processed with Nanoscope Analysis 1.5 software to flatten the background and to calculate the statistical parameters.
Circular Dichroism Spectroscopy
The secondary structural contents of Aβ and Aβ fibrillized in the presence or absence of FapC or bLg species were determined by circular dichroism (CD) spectroscopy. Solutions of 200 µL, at similar molar ratios as for ThT assay, were prepared and incubated at 37 °C. CD spectra for different samples at 0, 12 and 48 h were measured with a CD spectrophotometer (Jasco) from 190 to 240 nm (1 nm step size). The percentage secondary structure was calculated by the CD data via Dichroweb analysis with parameters of Contin/reference set 4.[ 95 ] For CD spectroscopy, Aβ was dissolved in 5 µL of 1% NH4OH buffer and then made up with deionized water for the rest of the experiment.
Isothermal Titration Calorimetry (ITC)
ITC (Malvern MicroCal iTC200) was used to explore the interaction between Aβ monomers and oligomers (Aβo) with FapCS. Sample solutions were degassed at 25 °C while stirring (100 rpm). Aβ (200 × 10−6 m, 40 µL) was filled into the syringe while FapCS or bLgS (20 × 10−6 m, 200 µL) were filled in the cell (coin shaped). 0.1% NH4OH buffer solution was used for both solutions. Aβ was injected into the cell at an injection volume of 2 µL at the duration of 4 s and with a spacing of 180 s. First injection was 0.2 µL for 0.4 s duration and a total of 16 injections were programed. The heat exchange was recorded with a Microcal analysis (origin v7) software. The heat of dilution (Aβ against buffer) was subtracted from the interaction heat of samples. The acquired curves were fitted to a sequential binding model and thermodynamic parameters of binding energy (ΔH), free energy (ΔG), and entropic factor (TΔS) were calculated. Aβo for the ITC experiments was prepared by incubating Aβ aqueous solution (200 × 10−6 m) at 4 °C for 48 h.[ 65 ]
Stimulated Emission Depletion (STED) Microscopy
STED microscopy was employed to study the interaction of FapCS with Aβ. FapCS was labeled with Alexa 647 NHS ester via carbodiimide coupling reaction (1:1 molar ratio) in PBS (pH 8) for a duration of 5 h. The labeled fragments were purified via centrifugal filters (3000 kDa). Labeled FapCS was incubated with Aβ at the same molar ratio as for the ThT assay. After 12 h of incubation, the FapCS‐seeded Aβ fibrils were incubated with ThT dye (100 × 10−6 m) for 30 min to label the Aβ backbone and then purified via centrifugal filters (3000 kDa). A drop of 20 µL of the sample was placed on a poly‐l‐lysine coated coverslip, flipped on a glass slide and then imaged under STED microscope. Alexa and ThT fluorescence were imaged under the excitations of 647 and 488 nm and emissions of 665 and 525 nm, respectively.
For immune recognition of FapCS‐seeded Aβ, a drop of Aβ alone or Aβ + FapCS at 12 h incubation was placed and dried on a glass slide. The spot was washed with deionized water and then stained with primary and secondary anti‐Aβ antibodies as described in the IHC method. The labeled Aβ slides were imaged via the red channel of a fluorescence microscope.
Microinjection to Zebrafish Larvae and In Vivo Aβ Fibrillization
Aβ (HFIP‐treated) was dissolved in PBS (pH 7.4) to make a stock solution. Aβ (100 × 10−15 m) was injected into the cerebroventricular space of one week old zebrafish larvae. Aβ with FapCS was injected at a 10:1 molar ratio (Aβ:FapCS, 100 × 10−15:10 × 10−15 m). PBS alone and untreated larvae were used as negative controls. Zebrafish larvae were anesthetized by adding a few drops of tricaine (0.4%) in the petri dish. When larvae stopped to move in response to the tapping stimuli, the larvae were transferred to an injection template made from 1% agarose gel. Microinjection of Aβ was performed with a calibrated microneedle and pneumatic microinjection system (PV830 WPI), under a stereomicroscope. The injection pressure was set to 20 psi, the injection volume was 10 nL, and the injections were made with a micromanipulator. The tip of the needle was inserted into the ventricular space of larvae and penetration across the soft skin of dorsal tissue (central meeting point of both telencephalons) was not more than 0.3 mm. After microinjection, the larvae were transferred to the fresh Holtfreter's buffer in petri dish and incubated at 28 ± 0.5 °C for further observation.
To monitor Aβ fibrillization in the brain of zebrafish larvae, the Aβ or Aβ + FapCS injected larvae were further injected with Congo red 2 days or one week posttreatment. Congo red (100 × 10−15 m) was injected to the cerebroventricular space of the zebrafish larvae and placed back in Holtfreter's buffer (1 h) to allow staining of Aβ plaques in the brain tissues of larvae and elimination of excess dye. Whole mount imaging of zebrafish larvae was performed via the brightfield and red fluorescence channels of a fluorescence microscope. All images were captured under the same exposure and intensity settings of the microscope. Relative red fluorescence intensities were measured from the images by using Fiji ImageJ and represented as fraction of 1. Aβ at one week was considered as a positive control (100% or fraction 1) while buffer only was considered as a negative control (0% or fraction 0).
Behavioral Pathology and ROS Measurement in Zebrafish Larvae
Behavior of zebrafish larvae was observed by an automated zebrafish behavior recording system Zebrabox (Viewpoint). The behavior was characterized by total distance traveled (cm) and movement frequency, i.e., number of movements that were >90°, clock or anticlockwise. The trajectories of the zebrafish movements were also recorded by the instrument and all behavior measurements were done in a 96‐well plate with one larva per well. The observation period was 1 h and the number of larvae per group was 10 while three groups per sample were used. Untreated or buffer injected larvae were used as positive controls.
Reactive oxygen species (ROS) were measured by 2′,7′‐dichlorofluorescin diacetate (DCF). Zebrafish larvae were injected with samples as described for the behavior assay. At 2 d or one week posttreatment, the larvae were euthanized and heads of the larvae were separated from the trunks. For euthanizing, a few drops of concentrated (1%) tricaine were added to the petri dish of larvae. The truncated heads were collected, homogenized (70 Hz homogenizer for 5 min) and brought to an equal volume of 100 µL via PBS (pH 7.4). Then 100 µL of 2 × 10⁻⁶ m DCF was added to the homogenates and vortexed for 5 min in the dark. The DCF fluorescence was recorded with a microplate reader with excitation/emission of 495/529 nm. The number of larvae per group was 10 and three groups per sample were used to measure the ROS production.
Microinjection of Adult Zebrafish and Pathological Behavior
Adult zebrafish (10 months) were employed for the study. Prior to microinjection, adult zebrafish were anesthetized by placing them in a beaker filled with ice‐chilled tricaine (0.01% in Holtfreter's buffer) for 20 s. The samples of Aβ alone and Aβ with FapCS or bacterial biofilm fragments were injected to the cerebroventricular space of adult fish with a 1 µL Hamilton glass syringe. The concentration of the Aβ peptide was 40 × 10−6 m (in PBS, pH 7.4) while FapCS or biofilm fragments were included at a 10:1 ratio (Aβ:FapCS or biofilm fragments). The needle penetrated between left and right telencephalon for not more than 1 mm and injection volume was 1 µL. The syringe was washed with ethanol and PBS in between the injections. The injections were made under a stereomicroscope and fish were held in place with forceps. After microinjection, the fish was placed back in the water tank for recovery.
The behavioral pathology of the adult fish was observed after 4 d and 2 weeks of microinjection. The behavioral pathology of movement frequency and traveled distance was recorded with a zebrabox (Viewpoint) in a 1 L swimming tank. For cognitive function test, the tank was hypothetically divided into two parts of arena 1 and arena 2, and arena 2 was labeled by pasting a red paper at the bottom of the tank. The behavior of the untreated fish was recorded as positive control, in both arenas. Then fish from each sample were trained to avoid swimming in arena 2 by shocking with a 9 V battery electrodes, whenever the fish swim into arena 2. The fish were allowed to familiarize with the tank for 30 min and then trained for 20 min. After training, the swimming behavior of the fish was recorded in whole tank and then analyzed for arena 1 versus arena 2 with software EthnoVision X1.
The observations were made for 1 min with three fish per samples. The measurements were made three times in a day and then averaged together. The analysis parameters for the software were fixed as follows: animal: adult zebrafish, arena: open field square template (divided into two halves for the cognitive test); and the tracking features were set at central point, the sampling rate was 5 per s, the detection levels were sensitive enough to detect the fish in whole tank, and the threshold for movement frequency was 50° turn clock or counter clockwise and for travel distance was 0.5 cm. Movement trajectories were also recorded with the instrument's camera.
Immunohistochemistry (IHC)
The deposition of Aβ, depletion of synaptophysin positive cells and TUNEL assay were measured by IHC. The adult fish, at 4 d or 2 weeks postinjection with Aβ and Aβ with FapCS or biofilm fragments, were euthanized by placing in ice‐chilled tricaine (0.4% in Holtfreter's buffer) for 1 min. The head of the fish was separated at pectoral fin point with a sharp blade and fixed in paraformaldehyde as described in the “Animal husbandry and ethics statement” section. The fixed heads were dehydrated by dipping in gradual concentration of ethanol, i.e., 20%, 40%, 60%, 80%, and 100% with 10 min at each step. The heads were treated with 20% sucrose overnight, mounted with Tissue Trek OCT mounting medium at −20 °C. The heads were then sectioned into 20 × 10−6 m thick section with a cryostat. The sections were mounted on a gelatinized glass slide and immunostained with antibodies. The sections were dried, washed thrice in PBS (pH 7.4), and TritonX‐100 (0.05% in PBS) for 5 min each. The sections were dried and then a drop of primary antibody was placed on each section. Anti‐amyloid β42 (mouse monoclonal, Anaspec, AS‐55922) for Aβ deposition and antisynaptophysin antibody (Abcam, ab32594) for synaptophysin were used as primary antibodies. The slides were stored at 4 °C in a humidified chamber. After overnight incubation, the primary antibodies were washed with PBS and TritonX‐100 thrice and dried. A drop of secondary antibodies was placed on the sections and incubated for 4 h in a humidified chamber at 4 °C. Secondary antibodies of rabbit anti‐mouse IgG (H+L), HiLyte Fluor 488‐labeled (Anaspec AS‐28164‐05‐H488) for Aβ while goat antirabbit IgG H&L (Alexa Fluor 488) (Abcam, ab150077) were used for synaptophysin. For the TUNEL assay, Click‐iT Plus kit (Invitrogen C10619) was used. After incubation with secondary antibodies, the slides were washed with PBS and TritonX‐100 and dried. The concentration for primary and secondary antibodies was 1 µg mL−1 while DAPI at the concentration 1 µg mL−1 was included in secondary antibodies solution. The sections were imaged by a fluorescence microscope and fluorescence intensities were measured from the images with Fiji ImageJ analysis.
Discrete Molecular Dynamics Simulations
All‐atom DMD simulations with implicit solvent were applied to determine the hotspot regions in FapC that bound Aβ42, to evaluate the propensity of aggregation of various FapC fragments, and to test the cross‐seeding of Aβ42 by preformed FapC nanofibrils. All‐atom DMD simulations have been widely used[ 96 , 97 ] to study amyloid aggregation, including our recent study of FapC aggregation inhibition with nanosilver.[ 98 ] Details of all‐atom DMD algorithms have been described in early studies.[ 61 , 99 ] To identify the Aβ‐binding hotspots in FapC, full‐length FapC was divided into 10‐residue peptides with five overlapping residues. For each 10‐residue fragment, twenty independent simulations were performed with an Aβ42 monomer starting with random intermolecular distances, orientations, and velocities. A cubic box with the periodic boundary condition and the dimension of 8 nm were used. Each independent simulation lasted 200 ns at room temperature 300 K. The final 150 ns simulation trajectories after reaching the steady states were utilized for data analysis. To investigate the amyloidogenic propensity of various FapC fragments, ten independent self‐assembling simulations were performed. Ten peptides, each of the following five sequences: FapC31‐40, FapC41‐50, FapC71‐80, FapC91‐100, FapC131‐140, and seven peptides, each of the 25‐residue sequence of FapC151‐175, were used in the aggregation simulations. A cubic box with a dimension of 12 nm was used, and each independent simulation lasted 350 ns at room temperature. The last 100 ns simulation trajectories after reaching the steady states were used for analysis. For the amyloidogenic and Aβ‐binding hotspot fragment FapC41‐50, an ideal double‐layer β‐sheet nanofibril with 34 peptides was built based on the zipperDB amyloid model of short peptides,[ 100 ] which resembled the double‐layer β‐sheets from our self‐assembling simulations. The ideal preformed FapC fibril was then used for the cross‐seeding simulations with an Aβ42 monomer, where the nanofibril was kept static and Aβ42 was free to diffuse and undergo conformation changes. Ten independent 450 ns simulations were performed starting with the Aβ42 monomer randomly positioning away from the FapC41‐50 nanofibril in a 10.5 nm cubic box with the periodic boundary condition. The last 50 ns trajectories from all independent simulations were used for the analysis when the steady states were achieved. The interatomic distance cutoff of 0.65 nm was used to define an atomic contact. Two residues were considered in contact if they possess at least one intermolecular contact. Peptides were considered belonging to one aggregated cluster if they were all interconnected via single linkages. Protein secondary structures were defined according to the DSSP algorithm.[ 101 ]
Statistical Analysis
All experiments were repeated in triplicate, unless specified. Data are presented as mean ± standard deviation (SD). For zebrafish larvae experiments, 10 larvae per group and three groups per sample were used for measurement. For behavioral experiments with adults, three adult fish per samples were used and measurements were made three different times of a day. The significance was determined by one‐way ANOVA followed by Turkey's test and p values less than 0.05 (*) and 0.005 (**) were considered significant and highly significant, respectively. p value greater than 0.05 was considered insignificant. Data were analyzed via SPSS Statistics.
Conflict of Interest
The authors declare no conflict of interest.
Author Contributions
I.J. and P.C.K. conceived the project. I.J., P.C.K., and Z.Z. wrote the manuscript. I.J. performed seed preparation, cross‐seeding, ThT, TEM, CD, ITC, in vivo microinjection, adult and larval zebrafish behavioral, cognitive, ROS and immunostaining assays and data analyses. N.A. and Y.L. conducted the ThT kinetic assay on Aβ self‐seeding. J.A. and R.M. performed AFM and data analysis. Z.Z. and F.D. performed DMD simulation studies. D.O. provided reagents and edited the manuscript. All authors agreed on the presentation of the manuscript.
Supporting information
Supporting Information
Acknowledgements
This work was supported by ARC Project No. CE140100036 (Davis), NSF CAREER CBET‐1553945 (Ding) and NIH MIRA R35GM119691 (Ding). TEM imaging was performed at Bio21 Advanced Microscopy Facility, University of Melbourne. The authors thank Dr. Alex Fulcher for assistance with STED imaging.
Javed I., Zhang Z., Adamcik J., Andrikopoulos N., Li Y., Otzen D. E., Lin S., Mezzenga R., Davis T. P., Ding F., Ke P. C., Accelerated Amyloid Beta Pathogenesis by Bacterial Amyloid FapC. Adv. Sci. 2020, 7, 2001299 10.1002/advs.202001299
Contributor Information
Thomas P. Davis, Email: t.davis@uq.edu.au.
Feng Ding, Email: fding@clemson.edu.
Pu Chun Ke, Email: pu-chun.ke@monash.edu.
References
- 1. Koh A., Molinaro A., Ståhlman M., Khan M. T., Schmidt C., Mannerås‐Holm L., Wu H., Carreras A., Jeong H., Olofsson L. E., Cell 2018, 175, 947. [DOI] [PubMed] [Google Scholar]
- 2. Meijnikman A. S., Gerdes V. E., Nieuwdorp M., Herrema H., Endocr. Rev. 2018, 39, 133. [DOI] [PubMed] [Google Scholar]
- 3. Valles‐Colomer M., Falony G., Darzi Y., Tigchelaar E. F., Wang J., Tito R. Y., Schiweck C., Kurilshikov A., Joossens M., Wijmenga C., Nat. Microbiol. 2019, 4, 623. [DOI] [PubMed] [Google Scholar]
- 4. Wilson M. R., Jiang Y., Villalta P. W., Stornetta A., Boudreau P. D., Carrá A., Brennan C. A., Chun E., Ngo L., Samson L. D., Science 2019, 363, eaar7785. [DOI] [PMC free article] [PubMed] [Google Scholar]
- 5. Sudo N., Chida Y., Aiba Y., Sonoda J., Oyama N., Yu X. N., Kubo C., Koga Y., J. Physiol. 2004, 558, 263. [DOI] [PMC free article] [PubMed] [Google Scholar]
- 6. Zhao Y., Dua P., Lukiw W., J. Alzheimer's Dis. Parkinsonism 2015, 5, 177. [DOI] [PMC free article] [PubMed] [Google Scholar]
- 7. Jiang C., Li G., Huang P., Liu Z., Zhao B., J. Alzheimers Dis. 2017, 58, 1. [DOI] [PubMed] [Google Scholar]
- 8. Koppel K., Tang H., Javed I., Parsa M., Mortimer M., Davis T. P., Lin S., Chaffee A. L., Ding F., Ke P. C., Nanoscale 2020, 12, 12317. [DOI] [PMC free article] [PubMed] [Google Scholar]
- 9. Braak H., Del Tredici K., Rüb U., De Vos R. A., Steur E. N. J., Braak E., Neurobiol. Aging 2003, 24, 197. [DOI] [PubMed] [Google Scholar]
- 10. Braak H., Ghebremedhin E., Rüb U., Bratzke H., Del Tredici K., Cell Tissue Res. 2004, 318, 121. [DOI] [PubMed] [Google Scholar]
- 11. Jones M., Dilley J., Drossman D., Crowell M., Neurogastroenterol. Motil. 2006, 18, 91. [DOI] [PubMed] [Google Scholar]
- 12. Gareau M. G., Wine E., Rodrigues D. M., Cho J. H., Whary M. T., Philpott D. J., MacQueen G., Sherman P. M., Gut 2011, 60, 307. [DOI] [PubMed] [Google Scholar]
- 13. Wang T., Hu X., Liang S., Li W., Wu X., Wang L., Jin F., Benef. Microbes 2015, 6, 707. [DOI] [PubMed] [Google Scholar]
- 14. Fellner L., Irschick R., Schanda K., Reindl M., Klimaschewski L., Poewe W., Wenning G. K., Stefanova N., Glia 2013, 61, 349. [DOI] [PMC free article] [PubMed] [Google Scholar]
- 15. Friedland R. P., Chapman M. R., PLoS Pathog. 2017, 13, e1006654. [DOI] [PMC free article] [PubMed] [Google Scholar]
- 16. Kim S., Kwon S.‐H., Kam T.‐I., Panicker N., Karuppagounder S. S., Lee S., Lee J. H., Kim W. R., Kook M., Foss C. A., Neuron 2019, 103, 627. [DOI] [PMC free article] [PubMed] [Google Scholar]
- 17. Uemura N., Yagi H., Uemura M. T., Hatanaka Y., Yamakado H., Takahashi R., Mol. Neurodegener. 2018, 13, 21. [DOI] [PMC free article] [PubMed] [Google Scholar]
- 18. Holmqvist S., Chutna O., Bousset L., Aldrin‐Kirk P., Li W., Björklund T., Wang Z.‐Y., Roybon L., Melki R., Li J.‐Y., Acta Neuropathol. 2014, 128, 805. [DOI] [PubMed] [Google Scholar]
- 19. Abdel‐Haq R., Schlachetzki J. C., Glass C. K., Mazmanian S. K., J. Exp. Med. 2019, 216, 41. [DOI] [PMC free article] [PubMed] [Google Scholar]
- 20. Hulme H., Meikle L. M., Strittmatter N., van der Hooft J. J., Swales J., Bragg R. A., Villar V. H., Ormsby M. J., Barnes S., Brown S. L., Sci. Adv. 2020, 6, eaax6328. [DOI] [PMC free article] [PubMed] [Google Scholar]
- 21. Kaelberer M. M., Buchanan K. L., Klein M. E., Barth B. B., Montoya M. M., Shen X., Bohórquez D. V., Science 2018, 361, eaat5236. [DOI] [PMC free article] [PubMed] [Google Scholar]
- 22. Ke P. C., Sani M.‐A., Ding F., Kakinen A., Javed I., Separovic F., Davis T. P., Mezzenga R., Chem. Soc. Rev. 2017, 46, 6492. [DOI] [PMC free article] [PubMed] [Google Scholar]
- 23. Tublin J. M., Adelstein J. M., del Monte F., Combs C. K., Wold L. E., Circ. Res. 2019, 124, 142. [DOI] [PMC free article] [PubMed] [Google Scholar]
- 24. Oskarsson M. E., Paulsson J. F., Schultz S. W., Ingelsson M., Westermark P., Westermark G. T., Am. J. Pathol. 2015, 185, 834. [DOI] [PubMed] [Google Scholar]
- 25. Moreno‐Gonzalez I., Edwards G. III, Salvadores N., Shahnawaz M., Diaz‐Espinoza R., Soto C., Mol. Psychiatry 2017, 22, 1327. [DOI] [PMC free article] [PubMed] [Google Scholar]
- 26. Martinez‐Valbuena I., Valenti‐Azcarate R., Amat‐Villegas I., Riverol M., Marcilla I., de Andrea C. E., Sánchez‐Arias J. A., del Mar Carmona‐Abellan M., Marti G., Erro M. E., Ann. Neurol. 2019, 86, 539. [DOI] [PubMed] [Google Scholar]
- 27. Ono K., Takahashi R., Ikeda T., Yamada M., J. Neurochem. 2012, 122, 883. [DOI] [PubMed] [Google Scholar]
- 28. Pletnikova O., West N., Lee M. K., Rudow G. L., Skolasky R. L., Dawson T. M., Marsh L., Troncoso J. C., Neurobiol. Aging 2005, 26, 1183. [DOI] [PubMed] [Google Scholar]
- 29. Clinton L. K., Blurton‐Jones M., Myczek K., Trojanowski J. Q., LaFerla F. M., J. Neurosci. 2010, 30, 7281. [DOI] [PMC free article] [PubMed] [Google Scholar]
- 30. Lundmark K., Westermark G. T., Olsén A., Westermark P., Proc. Natl. Acad. Sci. USA 2005, 102, 6098. [DOI] [PMC free article] [PubMed] [Google Scholar]
- 31. Sampson T. R., Challis C., Jain N., Moiseyenko A., Ladinsky M. S., Shastri G. G., Thron T., Needham B. D., Horvath I., Debelius J. W. J. E., eLife 2020, 9, e53111. [DOI] [PMC free article] [PubMed] [Google Scholar]
- 32. Evans M. L., Chorell E., Taylor J. D., Åden J., Götheson A., Li F., Koch M., Sefer L., Matthews S. J., c. Wittung‐Stafshede P. J. M., Mol. Cell 2015, 57, 445. [DOI] [PMC free article] [PubMed] [Google Scholar]
- 33. Morales R., Moreno‐Gonzalez I., Soto C., PLoS Pathog. 2013, 9, e1003537. [DOI] [PMC free article] [PubMed] [Google Scholar]
- 34. Morales R., Estrada L. D., Diaz‐Espinoza R., Morales‐Scheihing D., Jara M. C., Castilla J., Soto C., J. Neurosci. 2010, 30, 4528. [DOI] [PMC free article] [PubMed] [Google Scholar]
- 35. Jain N., Ådén J., Nagamatsu K., Evans M. L., Li X., McMichael B., Ivanova M. I., Almqvist F., Buxbaum J. N., Chapman M. R., Proc. Natl. Acad. Sci. USA 2017, 114, 12184. [DOI] [PMC free article] [PubMed] [Google Scholar]
- 36. Barton S. M., Janve V. A., McClure R., Anderson A., Matsubara J. A., Gore J. C., Pham W., J. Alzheimer's Dis. 2019, 67, 503. [DOI] [PMC free article] [PubMed] [Google Scholar]
- 37. Dicks L. M., Dreyer L., Smith C., Van Staden A. D., Front. Microbiol. 2018, 9, 2297. [DOI] [PMC free article] [PubMed] [Google Scholar]
- 38. Schwartz K., Boles B. R., Curr. Opin. Microbiol. 2013, 16, 93. [DOI] [PMC free article] [PubMed] [Google Scholar]
- 39. Christofi T., Panayidou S., Dieronitou I., Michael C., Apidianakis Y., Sci. Rep. 2019, 9, 14463. [DOI] [PMC free article] [PubMed] [Google Scholar]
- 40. Hwang I. Y., Koh E., Wong A., March J. C., Bentley W. E., Lee Y. S., Chang M. W., Nat. Commun. 2017, 8, 15028. [DOI] [PMC free article] [PubMed] [Google Scholar]
- 41. von Klitzing E., Ekmekciu I., Kühl A. A., Bereswill S., Heimesaat M. M., Sci. Rep. 2018, 8, 6685. [DOI] [PMC free article] [PubMed] [Google Scholar]
- 42. Dueholm M. S., Petersen S. V., Sønderkær M., Larsen P., Christiansen G., Hein K. L., Enghild J. J., Nielsen J. L., Nielsen K. L., Nielsen P. H., Mol. Microbiol. 2010, 77, 1009. [DOI] [PubMed] [Google Scholar]
- 43. Woo P. C., Lau S. K., Tse H., Teng J. L., Curreem S. O., Tsang A. K., Fan R. Y., Wong G. K., Huang Y., Loman N. J., PLoS Genet. 2009, 5, e1000416. [DOI] [PMC free article] [PubMed] [Google Scholar]
- 44. Beatson S. A., de Luna M. d. G., Bachmann N. L., Alikhan N.‐F., Hanks K. R., Sullivan M. J., Wee B. A., Freitas‐Almeida A. C., dos Santos P. A., de Melo J. T., J. Bacteriol. 2011, 193, 1286. [DOI] [PMC free article] [PubMed] [Google Scholar]
- 45. Dueholm M. S., Søndergaard M. T., Nilsson M., Christiansen G., Stensballe A., Overgaard M. T., Givskov M., Tolker‐Nielsen T., Otzen D. E., Nielsen P. H., MicrobiologyOpen 2013, 2, 365. [DOI] [PMC free article] [PubMed] [Google Scholar]
- 46. Peng D., Yang J., Li J., Tang C., Li B., J. Agric. Food Chem. 2017, 65, 10658. [DOI] [PubMed] [Google Scholar]
- 47. Jansens K. J., Brijs K., Delcour J. A., Scanlon M. G., Food Hydrocolloids 2016, 61, 914. [Google Scholar]
- 48. Lee Y.‐H., Chatani E., Sasahara K., Naiki H., Goto Y., J. Biol. Chem. 2009, 284, 2169. [DOI] [PubMed] [Google Scholar]
- 49. Usov I., Mezzenga R., Macromolecules. 2015, 48, 1269. [Google Scholar]
- 50. Ruggeri F. S., Adamcik J., Jeong J. S., Lashuel H. A., Mezzenga R., Dietler G., Angew. Chem., Int. Ed. 2015, 54, 2462. [DOI] [PubMed] [Google Scholar]
- 51. Witte T., Haller L. A., Luttmann E., Krüger J., Fels G., Huber K., J. Struct. Biol. 2007, 159, 71. [DOI] [PubMed] [Google Scholar]
- 52. Bolisetty S., Adamcik J., Mezzenga R., Soft Matter 2011, 7, 493. [Google Scholar]
- 53. Kakinen A., Sun Y., Javed I., Faridi A., Pilkington E. H., Faridi P., Purcell A. W., Zhou R., Ding F., Lin S., Ke P. C., Davis T. P., Sci. Bull. 2019, 64, 26. [DOI] [PMC free article] [PubMed] [Google Scholar]
- 54. Javed I., Yu T., Peng G., Sánchez‐Ferrer A., Faridi A., Kakinen A., Zhao M., Mezzenga R., Davis T. P., Lin S., Ke P. C., Nano Lett. 2018, 18, 5797. [DOI] [PubMed] [Google Scholar]
- 55. Hammer N. D., Schmidt J. C., Chapman M. R., Proc. Natl. Acad. Sci. USA 2007, 104, 12494. [DOI] [PMC free article] [PubMed] [Google Scholar]
- 56. Shu Q., Crick S. L., Pinkner J. S., Ford B., Hultgren S. J., Frieden C., Proc. Natl. Acad. Sci. USA 2012, 109, 6502. [DOI] [PMC free article] [PubMed] [Google Scholar]
- 57. Zhou Y., Smith D., Leong B. J., Brännström K., Almqvist F., Chapman M. R., J. Biol. Chem. 2012, 287, 35092. [DOI] [PMC free article] [PubMed] [Google Scholar]
- 58. Wu Y., Du S., Johnson J. L., Tung H.‐Y., Landers C. T., Liu Y., Seman B. G., Wheeler R. T., Costa‐Mattioli M., Kheradmand F., Zheng H., Corry D. B., Nat. Commun. 2019, 10, 58. [DOI] [PMC free article] [PubMed] [Google Scholar]
- 59. Cohen S. I., Linse S., Luheshi L. M., Hellstrand E., White D. A., Rajah L., Otzen D. E., Vendruscolo M., Dobson C. M., Knowles T. P., Proc. Natl. Acad. Sci. USA 2013, 110, 9758. [DOI] [PMC free article] [PubMed] [Google Scholar]
- 60. Sunde M., Serpell L. C., Bartlam M., Fraser P. E., Pepys M. B., Blake C. C., J. Mol. Biol. 1997, 273, 729. [DOI] [PubMed] [Google Scholar]
- 61. Shirvanyants D., Ding F., Tsao D., Ramachandran S., Dokholyan N. V., J. Phys. Chem. B 2012, 116, 8375. [DOI] [PMC free article] [PubMed] [Google Scholar]
- 62. Andreetto E., Yan L. M., Tatarek‐Nossol M., Velkova A., Frank R., Kapurniotu A., Angew. Chem., Int. Ed. 2010, 49, 3081. [DOI] [PubMed] [Google Scholar]
- 63. Rasmussen C. B., Christiansen G., Vad B. S., Lynggaard C., Enghild J. J., Andreasen M., Otzen D., Protein Sci. 2019, 28, 633. [DOI] [PMC free article] [PubMed] [Google Scholar]
- 64. Bhattarai P., Thomas A. K., Cosacak M. I., Papadimitriou C., Mashkaryan V., Froc C., Reinhardt S., Kurth T., Dahl A., Zhang Y., Cell Rep. 2016, 17, 941. [DOI] [PubMed] [Google Scholar]
- 65. Javed I., Peng G., Xing Y., Yu T., Zhao M., Kakinen A., Faridi A., Parish C. L., Ding F., Davis T. P., Ke P. C., Lin S., Nat. Commun. 2019, 10, 3780. [DOI] [PMC free article] [PubMed] [Google Scholar]
- 66. Clement C. G., Truong L. D., Hum. Pathol. 2014, 45, 1766. [DOI] [PubMed] [Google Scholar]
- 67. Marcus A., Sadimin E., Richardson M., Goodell L., Fyfe B., Am. J. Clin. Pathol. 2012, 138, 590. [DOI] [PubMed] [Google Scholar]
- 68. Greenberg S. M., Vonsattel J.‐P. G., Stroke 1997, 28, 1418. [DOI] [PubMed] [Google Scholar]
- 69. Reddy P. H., J. Neurochem. 2006, 96, 1. [DOI] [PubMed] [Google Scholar]
- 70. Praticò D., Sung S., J. Alzheimer's Dis. 2004, 6, 171. [DOI] [PubMed] [Google Scholar]
- 71. Ke P. C., Pilkington E. H., Sun Y., Javed I., Kakinen A., Peng G., Ding F., Davis T. P., Adv. Mater. 2020, 32, 1901690. [DOI] [PMC free article] [PubMed] [Google Scholar]
- 72. Lau B. Y., Mathur P., Gould G. G., Guo S., Proc. Natl. Acad. Sci. USA 2011, 108, 2581. [DOI] [PMC free article] [PubMed] [Google Scholar]
- 73. Geling A., Steiner H., Willem M., Bally‐Cuif L., Haass C., EMBO Rep. 2002, 3, 688. [DOI] [PMC free article] [PubMed] [Google Scholar]
- 74. Newman M., Ebrahimie E., Lardelli M., Front. Genet. 2014, 5, 189. [DOI] [PMC free article] [PubMed] [Google Scholar]
- 75. Selkoe D. J., Science 2002, 298, 789. [DOI] [PubMed] [Google Scholar]
- 76. Shaked G., Kummer M., Lu D., Galvan V., Bredesen D., Koo E., Shaked G., Kummer M., Lu D., Galvan V., FASEB J. 2006, 20, 1254. [DOI] [PMC free article] [PubMed] [Google Scholar]
- 77. Gallo P. M., Rapsinski G. J., Wilson R. P., Oppong G. O., Sriram U., Goulian M., Buttaro B., Caricchio R., Gallucci S., Tükel Ç., Immunity 2015, 42, 1171. [DOI] [PMC free article] [PubMed] [Google Scholar]
- 78. Zeng G., Vad B. S., Dueholm M. S., Christiansen G., Nilsson M., Tolker‐Nielsen T., Nielsen P. H., Meyer R. L., Otzen D. E., Front. Microbiol. 2015, 6, 1099. [DOI] [PMC free article] [PubMed] [Google Scholar]
- 79. Howe K., Clark M. D., Torroja C. F., Torrance J., Berthelot C., Muffato M., Collins J. E., Humphray S., McLaren K., Matthews L., Nature 2013, 496, 498. [DOI] [PMC free article] [PubMed] [Google Scholar]
- 80. Mathuru A. S., Jesuthasan S., Front. Neural Circuits 2013, 7, 99. [DOI] [PMC free article] [PubMed] [Google Scholar]
- 81. Nicoud L., Lazzari S., Balderas Barragán D., Morbidelli M., J. Phys. Chem. B 2015, 119, 4644. [DOI] [PubMed] [Google Scholar]
- 82. Macfarlane S., Macfarlane G. T., Appl. Environ. Microbiol. 2006, 72, 6204. [DOI] [PMC free article] [PubMed] [Google Scholar]
- 83. Palestrant D., Holzknecht Z. E., Collins B. H., Parker W., Miller S. E., Bollinger R. R., Ultrastruct. Pathol. 2004, 28, 23. [PubMed] [Google Scholar]
- 84. Macfarlane S., Dillon J., J. Appl. Microbiol. 2007, 102, 1187. [DOI] [PubMed] [Google Scholar]
- 85. Shewmaker F., McGlinchey R. P., Thurber K. R., McPhie P., Dyda F., Tycko R., Wickner R. B., J. Biol. Chem. 2009, 284, 25065. [DOI] [PMC free article] [PubMed] [Google Scholar]
- 86. Rouse S. L., Hawthorne W. J., Berry J.‐L., Chorev D. S., Ionescu S. A., Lambert S., Stylianou F., Ewert W., Mackie U., Morgan R. M. L., Nat. Commun. 2017, 8, 263. [DOI] [PMC free article] [PubMed] [Google Scholar]
- 87. Cao Y., Mezzenga R., Adv. Colloid Interface Sci. 2019, 269, 334. [DOI] [PubMed] [Google Scholar]
- 88. Kakinen A., Xing Y., Hegoda Arachchi N., Javed I., Feng L., Faridi A., Douek A. M., Sun Y., Kaslin J., Davis T. P., Higgins M. J., Ding F., Ke P. C., Nano Lett. 2019, 19, 6535. [DOI] [PMC free article] [PubMed] [Google Scholar]
- 89. Nandakumar A., Xing Y., Aranha R. R., Faridi A., Kakinen A., Javed I., Koppel K., Pilkington E. H., Purcell A. W., Davis T. P., Faridi P., Ding F., Ke P. C., Biomacromolecules 2020, 21, 988. [DOI] [PMC free article] [PubMed] [Google Scholar]
- 90. Matheoud D., Cannon T., Voisin A., Penttinen A.‐M., Ramet L., Fahmy A. M., Ducrot C., Laplante A., Bourque M.‐J., Zhu L., Nature 2019, 571, 565. [DOI] [PubMed] [Google Scholar]
- 91. Canfora E. E., Meex R. C., Venema K., Blaak E. E., Nat. Rev. Endocrinol. 2019, 15, 261. [DOI] [PubMed] [Google Scholar]
- 92. Martinez K. B., Leone V., Chang E. B., J. Biol. Chem. 2017, 292, 8553. [DOI] [PMC free article] [PubMed] [Google Scholar]
- 93. Dueholm M. S., Nielsen S. B., Hein K. L., Nissen P., Chapman M., Christiansen G., Nielsen P. H., Otzen D. E., Biochemistry 2011, 50, 8281. [DOI] [PMC free article] [PubMed] [Google Scholar]
- 94. Cabaleiro‐Lago C., Quinlan‐Pluck F., Lynch I., Lindman S., Minogue A. M., Thulin E., Walsh D. M., Dawson K. A., Linse S., J. Am. Chem. Soc. 2008, 130, 15437. [DOI] [PubMed] [Google Scholar]
- 95. Whitmore L., Wallace B. A., Biopolymers 2008, 89, 392. [DOI] [PubMed] [Google Scholar]
- 96. Ding F., Dokholyan N. V., in Computational Modeling of Biological Systems, (Ed: Dokholyan N.V.), Springer, Berlin, Germany: 2012, pp 55–73. [Google Scholar]
- 97. Proctor E. A., Dokholyan N. V., Curr. Opin. Struct. Biol. 2016, 37, 9. [DOI] [PMC free article] [PubMed] [Google Scholar]
- 98. Huma Z. E., Javed I., Zhang Z., Bilal H., Sun Y., Hussain S. Z., Davis T. P., Otzen D. E., Landersdorfer C. B., Ding F., Hussain I., Ke P. C., Small 2020, 16, 1906674. [DOI] [PMC free article] [PubMed] [Google Scholar]
- 99. Ding F., Tsao D., Nie H., Dokholyan N. V., Structure 2008, 16, 1010. [DOI] [PMC free article] [PubMed] [Google Scholar]
- 100. Goldschmidt L., Teng P. K., Riek R., Eisenberg D., Proc. Natl. Acad. Sci. USA 2010, 107, 3487. [DOI] [PMC free article] [PubMed] [Google Scholar]
- 101. Kabsch W., Sander C., Biopolymers 1983, 22, 2577. [DOI] [PubMed] [Google Scholar]
Associated Data
This section collects any data citations, data availability statements, or supplementary materials included in this article.
Supplementary Materials
Supporting Information