

Abstract
Purpose
To investigate the prevalence of epiretinal membranes (ERMs) and their risk factors in a Chinese population.
Methods
The community-based Kailuan Eye Study included 14,440 participants (9835 male, 4605 female) with a mean age of 54.0 ± 13.3 years (range, 20–110 years). They underwent a systemic and ophthalmologic examination. ERMs were diagnosed on fundus photographs.
Results
Retinal photographs assessable for the presence of ERMs were available for 13,295 (92.0%) individuals (9094 male) with a mean age of 53.6 ± 13.3 years (range, 20–110 years). ERMs were found in 1013 participants (1489 eyes) with a prevalence of 7.6% (95% confidence interval [CI], 7.1%–8.1%). Secondary ERMs caused by intraocular reasons were found 46 (4.5%) individuals (69 [4.6%] eyes). A higher prevalence of any ERMs (and of primary ERMs) was associated with older age (odds ratio [OR]: 1.08; 95% CI:1.07–1.10), higher body mass index (OR: 1.05; 95% CI: 1.00–1.11), higher prevalence of smoking (OR:1.43; 95% CI: 1.01–2.03), higher serum concentration of glucose (OR: 1.08; 95% CI: 1.04–1.13), and lower serum concentration of uric acid (OR: 0.99; 95% CI: 0.99–1.00). Visual acuity was significantly (P = 0.002) lower in eyes with premacular fibroses than in eyes with cellophane macular reflexes.
Conclusions
In our cross-sectional community-based study, the prevalence of all ERMs was 7.6%. Among the group of participants with ERMs, secondary ERMs caused by intraocular reasons were detected in 46 (4.5%) individuals (69 [4.6%] eyes). A higher prevalence of any ERM and of primary ERMs was associated with older age, higher body mass index, higher prevalence of smoking, a higher serum concentration of glucose, and a lower serum concentration of uric acid.
Keywords: ERMs, prevalence, risk factor
Epiretinal membranes (ERMs) are located on the inner surface of the retina and their severe forms can lead to marked loss in central vision.1–5 A contraction of the ERMs in the macular zone is an important sight-threatening sign and is due to a fibrotic remodeling.3 Histopathologic examinations revealed that the cellular components of ERMs vary with the stage of the ERMs.2 Laminocytes are the fundamental cell type in idiopathic ERMs.2 Prevalence and risk factors of ERMs have been examined in various examinations, in which the prevalence of ERMs ranged between 1.02% and 39%.6–24 The main reasons for these marked discrepancies between the studies may be differences in the age and ethnic background of the study populations and diagnostic criteria. Most of the studies used fundus photographs to diagnose ERMs, whereas some investigations were based on fundus photographs and optical coherence tomographic (OCT) images.6–24
ERMs cause a wrinkling of the retinal surface and are characterized by retinal cell migration and proliferation.4–6 At the early stage of ERMs, most patients do not experience a loss in their vision. Idiopathic ERMs have no known cause. They are transparent membranes located on the surface of the retina and are composed of reactive cell components, vitreous structures, and fibrotic elements.22 Secondary ERMs may occur after a retinal tear and retinal detachment, after intraocular surgeries, trauma or retinal laser treatment, in eyes with retinal vascular diseases, such as diabetic retinopathy and retinal vein occlusions, and in eyes with posterior uveitis.1,6 ERM-induced thickening of the macular retina is correlated with a decrease in central visual acuity.25,26
It has been hypothesized that ERMs occur when a posterior vitreous detachment causes tiny gaps in the retinal internal limiting membrane, which in turn allows glial cells or possibly retinal pigment epithelium (RPE) cells to migrate to the surface of the retina where they proliferate.27,28 This hypothesis was supported when RPE cells, astrocytes, and fibroblasts were observed in eyes with ERMs but without obvious membrane holes, without previous laser therapies or without having undergone other intraocular surgeries.24
Because the sample size of some of the previous studies was relatively small and because the reported values of the ERM prevalence showed a marked variation from 1.02% to 39% or about 1:39, we conducted this study to assess the prevalence of ERMs in a relatively large community-based study population.6–24
Methods
The Kailuan Eye Study is a cross-sectional study which included participants of the longitudinal Kailuan Study. The research followed the tenets of the Declaration of Helsinki. The Medical Ethics Committee of the Beijing Tongren Hospital approved the study protocol and informed consent was obtained from the individuals after explanation of the nature and possible consequences of the study. The community of Kailuan is located in the city of Tangshan with approximately 7.2 million inhabitants. Tangshan is situated about 150 km southeast of Beijing and is a center of the coal mining industry. The study population included employees and retirees of a coal mining company (Kailuan Group Company). At baseline, the study population consisted of 101,510 individuals with an age ranging between 20 years and 110 years. The study participants were repeatedly and prospectively examined at two-year intervals.29–31 All participants underwent an interview with standardized questions on their socioeconomic background, educational level, psychic depression, physical activity, known major systemic diseases such as arterial hypertension and diabetes mellitus, living habit (including sleep condition, alcohol consumption and smoking. Using an examination unit-based cluster random sampling method, we randomly selected a sample of 14,440 subjects out of the Kailuan cohort to participate in the Kailuan Eye Study.
Smoking was defined as smoking at least one cigarette per day for more than a year. Alcohol consumption included the intake of at least 80 g of liquor a day for more than one year. Under fasting conditions, blood samples were collected to determine the serum concentrations of blood glucose, high-density lipoprotein cholesterol, low-density lipoprotein cholesterol, triglyceride, total cholesterol, hemoglobin, uric acid, hypersensitive C-reactive protein, total protein, albumin, alanine amino transaminase, total bilirubin, direct bilirubin, creatinine and urea, to determine the red blood count, white blood count and blood platelet count. Body height and weight and the circumference of the waist and hip were measured and the body mass index (BMI) were calculated. The blood pressure and heart rate were assessed with the participants sitting for at least five minutes.
All participants underwent a comprehensive ophthalmic examination. Presenting visual acuity was measured in participants in either eye using the log of the minimum angle of resolution (LogMAR). A digital 45° nonmydriatic retinal camera (Type CR6-45NM; Canon Inc., Tokyo, Japan) was used to obtain color fundus photographs centered on the macula and on optic disc. Ocular biometry applying optical low-coherence reflectometry (Lenstar 900 Optical Biometer; Haag- Streit, Koeniz, Switzerland) was used to obtain ocular biological parameters (including central cornea thickness, axial length, anterior chamber depth, lens thickness and corneal curvature, corneal diameter white to white, and pupil diameter). Spectral-domain optical coherence tomography (Spectralis; Heidelberg Engineering Co, Heidelberg, Germany) collected images of the macula, optic disc and periorbital region. The photographers and operators of the OCT device and Lenstar were trained and certified by retinal specialists and experienced ophthalmic examiner in Beijing Tongren Eye Center, Beijing Tongren Hospital.
According to the classification of ERMs proposed by Klein and colleagues, the ERMs were divided into two forms, one defined by the presence of a cellophane macular reflex (CMR) and characterized by a patch or patches of irregular increased reflection from the inner surface of the retina, and the other form, defined by the presence of a premacular fibrosis (PMF) and characterized as a thickening and contraction of the epiretinal membrane, with opaque or gray superficial retinal folds or traction lines.6–24 If both forms of ERMs were detected in the eyes of the same individual, the participant was graded as having the PMF form. The OCT images were used in the case of doubt which type of ERM was present. Two experienced graders (ZXB, YYN) initially assessed the fundus photographs. They were masked to the history, and the clinical data and medical records were not available during the grading process. Image enhancement tools were not used and any manipulation of the images was not allowed for the detail grading. The intrarater and interrater reliability were evaluated by assessing the kappa coefficient (ERM κ = 0.93, CMR κ = 0.90, PMF κ = 1). All eyes with the diagnosis of ERMs were rechecked and the diagnosis was verified by a senior grader (WYX). In unclear situations, a panel of ophthalmologists (WYX, JBJ) reassessed the fundus photographs and the OCT images to arrive at a final consensus.
A commercially available statistical software package (SPSS for Windows, version 25.0; SPSS, Chicago, IL, USA) was used for statistical analyses. Logistic regression was used to investigate the associated factors of the ERMs. Univariate analyses were used to assess the associations between the prevalence of ERMs and other systemic and ocular parameters. Multiple logistic regression models were subsequently calculated with variables such as age and gender as independent variables. Odds ratios (OR) and their 95% confidence intervals (CI) were calculated.
Results
A total of 14,440 participants (9835 male, 68.1%) with a mean age of 54.0 ± 13.3 years (range, 20–110 years) underwent the ophthalmologic examinations. Among them, 13,295 (92.1%) (9094 male [68.4%]) individuals (mean age: 53.6 ± 13.3 years; range, 20–110 years) had gradable photographs in at least one eye and were included into the study (Fig.).
Figure.
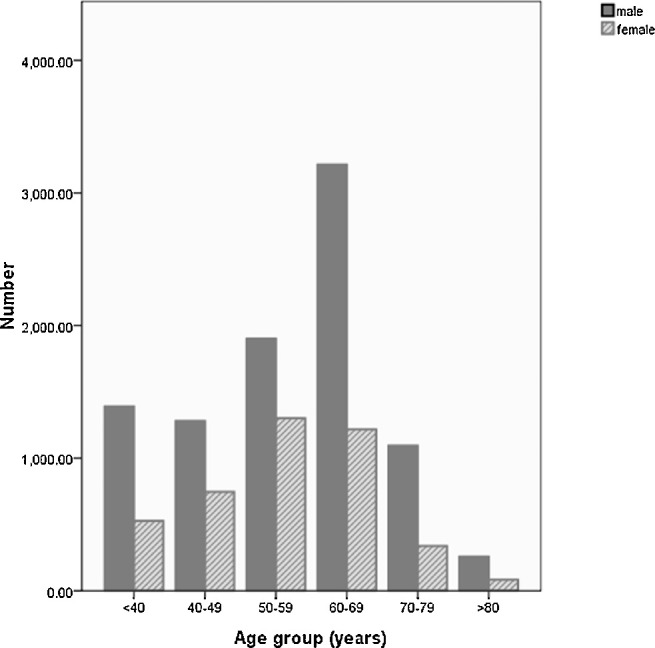
Age and gender distribution of participant in the Kailuan eye study
ERMs were found in 1013 participants (1489 eyes) with a prevalence of 7.6% (95% CI, 7.1%–8.1%). Bilateral and unilateral ERMs were found in 476 subjects (47.0%) and 537 subjects (53.0%), respectively. The prevalence of ERMs was similar in men and women, with 7.8% (95% CI, 7.3%–8.3%), and 7.3% (95% CI, 6.9%–7.7%), respectively (P = 0.24). CMR and PMF were found in 5.6% (95% CI, 5.2%–6.0%) and in 2.0% (95% CI, 1.8%–2.2%) of the study population, in which gender differences were not significant (P > 0.15). The presence of ERMs in right eyes 5.8% (95% CI, 5.4%–6.2%) did not differ significantly from the ERM presence in left eyes 5.8% (95% CI, 5.4%–6.2%) (P = 0.12). Visual acuity was significantly (P = 0.002) lower in eyes with PMFs than in eyes with CMRs.
The prevalence of ERMs increased significantly with older age, from 0.4% (95% CI, 0.15%–0.65%) in participants with an age of 20 to 39 years, to 5.5% (95% CI, 4.8%–6.2%) in persons aged 50 to 59 years, and to 17.6% (95% CI, 15.3%–19.9%) in individuals aged 70 to 79 years (Table 1). In univariate analyses, a higher ERM prevalence was associated with ocular and systemic parameters such as older age; higher BMI; larger hip, neck, and waist circumference; higher systolic blood pressure; higher prevalence of smoking; higher serum concentrations of glucose; lower serum concentrations of albumin, alanine amino transaminase, hemoglobin and uric acid; lower count of red blood cells and platelets; and shorter axial length (Table 2).
Table 1.
Prevalence of Epiretinal Membranes in the Kailuan Eye Study
| Any Epiretinal Membrane | ||||
|---|---|---|---|---|
| Cellophane Macular | Preretinal Macular | |||
| Age Group (Years) | Reflex Type, n (%) | Fibrosis Type, n (%) | n(%) | 95% CI |
| <40 (n = 2353) | 6 (0.3%) | 3 (0.1%) | 9 (0.4%) | 0.2%–0.7% |
| 40–49 (n = 2253) | 24 (1.0%) | 4 (0.2%) | 28 (1.2%) | 0.7%–1.7% |
| 50–59 (n = 3681) | 154 (4.2%) | 49 (1.3%) | 203 (5.5%) | 4.8%–6.2% |
| 60–69 (n = 3798) | 427 (11.2%) | 144 (3.8%) | 571 (15.0%) | 13.9%–16.1% |
| 70–79 (n = 1024) | 123 (12.0%) | 57 (5.6%) | 180 (17.6%) | 15.3%–19.9% |
| >80 (n = 186) | 15 (8.0%) | 7 (3.8%) | 22 (11.8%) | 7.2%–16.4% |
| Total (n = 13,295) | 749 (5.6%) | 264 (2.0%) | 1013 (7.6%) | 7.1%–8.1% |
Table 2.
Results of the Logistic Regression Analysis (Univariate Analysis) Between The Presence Of Epiretinal Membranes And Ocular And Systemic Parameters in the Kailuan Eye Study
| P Value | Odds Ratio | 95% CI | |
|---|---|---|---|
| Age (years) | <0.001 | 1.08 | 1.07, 1.08 |
| Gender | 0.23 | 0.92 | 0.80, 1.05 |
| Body mass index (kg/m2) | 0.03 | 1.02 | 1.00, 1.04 |
| Hip circumference (cm) | <0.001 | 1.02 | 1.01, 1.03 |
| Neck circumference (cm) | 0.02 | 1.04 | 1.01, 1.07 |
| Waist circumference (cm) | <0.001 | 1.02 | 1.01, 1.03 |
| Systolic blood pressure (mm Hg) | <0.001 | 1.02 | 1.01, 1.02 |
| Diastolic blood pressure (mm Hg) | 0.64 | 1.00 | 0.99, 1.01 |
| Heart rate (beats/min) | 0.75 | 1.00 | 0.99, 1.01 |
| Smoking | <0.001 | 1.6 | 1.34, 1.92 |
| Education level | 0.11 | 0.85 | 0.69, 1.04 |
| Occupation | 0.69 | 1.08 | 0.74, 1.59 |
| Ankylosing spondylitis | 0.42 | 0.44 | 0.06, 3.22 |
| Axial length (mm) | 0.002 | 0.93 | 0.90, 0.97 |
| Serum concentration of | |||
| Glucose (mmol/L) | <0.001 | 1.06 | 1.04, 1.08 |
| High-density lipoprotein (mmol/L) | 0.50 | 0.94 | 0.79, 1.13 |
| Low-density lipoprotein (mmol/L) | 0.29 | 0.96 | 0.88, 1.04 |
| Triglyceride (mmol/L) | 0.37 | 0.98 | 0.93, 1.03 |
| Total cholesterol (mmol/L) | 0.25 | 1.02 | 0.99, 1.06 |
| Total protein (g/L) | 0.54 | 1.00 | 0.99, 1.00 |
| Total bilirubin (mmol/L) | 0.81 | 1.00 | 0.99, 1.01 |
| Creatinine (mmol/L) | 0.31 | 1.00 | 1.00, 1.01 |
| Hypersensitive C-reactive protein (mg/L) | 0.10 | 1.01 | 1.00, 1.02 |
| Albumin (mmol/L) | <0.001 | 0.96 | 0.94, 0.98 |
| Alanine amino transferase (U/L) | <0.001 | 0.99 | 0.98, 0.99 |
| Red blood count (1012/L) | 0.003 | 0.81 | 0.70, 0.93 |
| Hemoglobin (mmol/L) | 0.02 | 1.00 | 0.99, 1.00 |
| Uric acid (μmol/L) | 0.02 | 1.00 | 0.99, 1.00 |
| Blood platelet count (109 /L) | 0.03 | 1.00 | 0.99, 1.00 |
In multiple logistic regression analysis, a higher prevalence of ERMs remained significantly associated with older age (OR: 1.08; 95% CI: 1.07%–1.10), higher BMI (OR: 1.05; 95% CI: 1.00–1.11), higher prevalence of smoking (OR: 1.43; 95% CI: 1.01–2.03), higher serum concentration of glucose (OR: 1.08; 95% CI: 1.04–1.13) and lower serum concentration of uric acid (OR: 0.99; 95% CI: 0.99–1.00) (Table 3).
Table 3.
Results of the Logistic Regression Analysis (Multivariate Binary Regression) Between the Presence of Epiretinal Membranes and Ocular and Systemic Parameters in the Kailuan Eye Study
| P Value | Odds Ratio | 95% CI | |
|---|---|---|---|
| Age (years) | <0.001 | 1.08 | 1.07, 1.10 |
| Gender | 0.67 | 0.91 | 0.60, 1.39 |
| Body mass index (kg/m2) | 0.04 | 1.05 | 1.00, 1.11 |
| Hip circumference (cm) | 0.94 | 1.00 | 0.98, 1.02 |
| Neck circumference (cm) | 0.16 | 1.05 | 0.98, 1.11 |
| Waist circumference (cm) | 0.92 | 1.00 | 0.98, 1.03 |
| Systolic blood pressure (mm Hg) | 0.69 | 0.99 | 0.99, 1.01 |
| Smoking | 0.04 | 1.43 | 1.01, 2.03 |
| Axial length (mm) | 0.66 | 1.03 | 0.91, 1.16 |
| Serum concentration of | |||
| Glucose (mmol/L) | <0.001 | 1.08 | 1.04,1.13 |
| Albumin (mmol/L) | 0.26 | 0.98 | 0.93, 1.02 |
| Alanine amino transferase (U/L) | 0.25 | 0.99 | 0.98, 1.01 |
| Red blood count (1012/L) | 0.89 | 0.98 | 0.68, 1.39 |
| Hemoglobin (mmol/L) | 0.15 | 1.00 | 0.99, 1.00 |
| Uric acid (μmol/L) | 0.002 | 0.99 | 0.99, 1.00 |
| Blood platelet count (109/L) | 0.91 | 1.00 | 0.99, 1.00 |
Performing the analysis separately for CMRs and PRFs showed that a higher prevalence of CMRs was associated with older age (P < 0.001; OR: 1.08; 95% CI: 1.06–1.10), lower serum concentration of uric acid (P < 0.001; OR: 0.99; 95% CI: 0.99–1.00), and larger neck circumference (P = 0.03; OR: 1.08; 95% CI: 1.01–1.16). A higher prevalence of PMFs was associated with older age (P < 0.001; OR: 1.08; 95% CI: 1.05–1.11) and higher serum concentration of glucose (P < 0.001; OR: 1.10; 95% CI: 1.05–1.16).
The whole group of ERMs was differentiated in primary ERMs without evident intraocular cause for their development, and into secondary ERMs due to intraocular causes such as retinal vascular disorders or intraocular surgeries. Out of all individuals with ERMs (n = 1013), the ERMs were due to intraocular reasons in 46 (4.5%) individuals (69 [4.6%] eyes), including diabetic retinopathy with laser treatment in 18 participants (28 eyes), diabetic retinopathy without previous laser therapy in nine participants (16 eyes), retinal vein occlusion with laser treatment in 11 participants (14 eyes), and retinal vein occlusions without previous laser therapy in eight participants (11 eyes). Excluding these eyes with secondary ERMs and reperforming the statistical analysis revealed that after adjustment for age and gender, a higher prevalence of primary ERMs was associated with older age; higher BMI; larger circumference of hip, neck and waist; higher systolic blood pressure; higher prevalence of smoking; the serum concentrations of hemoglobin, albumin, uric acid, alanine amino transferase, and blood lipids; red blood cell count; platelet count; and axial length. In a multiple logistic regression analysis, a higher prevalence of primary ERMs remained to be significantly associated with older age (OR: 1.09; 95% CI: 1.07–1.10), higher BMI (OR: 1.04; 95% CI: 1.00–1.07), higher prevalence of smoking (OR:1.23; 95% CI: 1.01–1.50), higher serum concentration of glucose (OR: 1.08; 95% CI: 1.03–1.14), and lower serum concentration of uric acid (OR: 0.99; 95% CI: 0.97–1.00).
Discussion
In our cross-sectional, community-based study, the prevalence of all ERMs was 7.6%. Among the group of participants with ERMs, secondary ERMs due to intraocular reasons were detected in 46 (4.5%) individuals (69 [4.6%] eyes). A higher prevalence of any ERM and of primary ERMs was associated with older age, higher BMI, higher prevalence of smoking, a higher serum concentration of glucose, and a lower serum concentration of uric acid.
The ERM prevalence found in our study population was lower than in the population of the Multi-Ethnic Study of Atherosclerosis Study (39%),16 the Singapore Epidemiology of Eye Disease Study (12.1%), and the Los Angeles Latino Eye Study LALES (18.5%).13,19 The prevalence in our study population (7.6%) was higher than reported in the study samples of the Japanese Funagata Study (5.44%),20 the Chinese Handan Eye Study (3.4%),14 and the Beixinjing Blocks Study in Shanghai (1.02%).19 The prevalence was similar with the one found in the Blue Mountains Eye Study (7%)6 and the Beijing Eye Study (8.4%).23 The differences in the prevalence of detected ERMS between the study populations may be due to differences in age, the ethnic background, the population distribution, screening methods, and diagnostic criteria.
As in the Funagata study,20 men and women did not differ in the ERM prevalence in our study. As in all studies, the ERM prevalence significantly increased with older age. Interestingly, the ERM prevalence slightly decreased beyond an age of 80 years in our study population (Table 1). Reasons may be that the statistical power of the relatively small group of individuals aged 80+ years was relatively small, that the quality of the fundus photographs in old individuals decreases, and potentially a healthy worker effect and healthy survivor factor.32 Because, however, the study population included the active workers of the Kailuan Company and its retirees, it may be unlikely that a healthy worker effect had a marked influence on the findings. In our study, a higher ERM prevalence was associated with a prevalence of smoking. It was in contrast to the Chinese Handan Eye Study in which the ERM prevalence was negatively associated with smoking.14 The authors of the Handan Eye Study discussed the finding could have been due to a survival factor with smokers having a shorter life expectancy and thus a lower chance to develop ERMs.14 The association between ERM prevalence and a higher serum glucose concentration has been reported in several previous studies.6,16,19
Interestingly, we found that the ERM prevalence was associated with a lower serum concentration of uric acid. Uric acid is the final product of the purine metabolism. Increasing experimental and clinical evidence have suggested that uric acid may have a role as an antioxidant.33 It has remained unclear whether an accumulated oxidative damage is associated with the development of ERMs. It was also interesting, that a higher ERM prevalence was associated with higher BMI, with the reasons for this association having remained elusive.
Limitations of our study should be stated. First, we took nonmydriasis fundus photographs, which might have affected the quality of fundus photographs. It might have led to an underestimation of the prevalence of ERMs, in particular in eyes with cataract. However, we used the OCT images in case of doubt to confirm the diagnosis of ERMs when the assessment of fundus photographs was inconclusive. Second, it was a community-based recruitment of the study participants. Although the study population included retired employees, the majority of the study participants were in-service employees who were younger and thus had a significantly lower presence of age-related disorders. In that context, also a “healthy worker effect” has to be considered in the sense that preferably healthy individuals get employment and are thus included in the study population. However, because employment in the Kailuan Study is usually a life-long relationship and because ERMs are usually not present at a young age when the first employment takes place, it may not be very likely, that a “healthy worker effect” might have markedly influenced the results and conclusions of the study. Third, we could not assess all potential ERMs risk factors, including eye conditions related to ERMs, such as a history of ocular traumata. These missing variables might have caused a bias on the estimates of the associated factors. Fourth, it was a cross-sectional analysis, which allowed statements on associated factors, but not conclusions on risk factors. The strengths of our study comprise the large sample size, the availability of OCT images, a detailed questionnaire survey, and comprehensive laboratory examinations.
In conclusion, in our cross-sectional community-based study, the prevalence of all ERMs was 7.6%. Among the group of participants with ERMs, secondary ERMs caused by intraocular reasons were detected in 46 (4.5%) individuals (69 [4.6%] eyes). A higher prevalence of any ERM and of primary ERMs was associated with older age, higher BMI, higher prevalence of smoking, a higher serum concentration of glucose, and a lower serum concentration of uric acid.
Acknowledgments
The authors thank the staff and participants in the Kailuan Eye Study for their help and support.
Disclosure: X.B. Zhu, None; M.C. Yang, None; Y.X. Wang, None; W. Qian, None; Y.N. Yan, None; J.Y. Yang, None; S.L. Wu, None; S.H. Chen, None; L. Dong, None; W.B. Wei, None; J.B. Jonas, None
References
- 1. Klein R, Klein BE, Wang Q, et al.. The epidemiology of epiretinal membranes. Trans Am Ophthalmol Soc. 1994; 92: 403–425. [PMC free article] [PubMed] [Google Scholar]
- 2. Snead DR, James S, Snead MP. Pathological changes in the vitreoretinal junction 1: epiretinal membrane formation. Eye. 2008; 22: 1310. [DOI] [PubMed] [Google Scholar]
- 3. Okamoto F, Okamoto Y, Hiraoka T, et al.. Effect of vitrectomy for epiretinal membrane on visual function and vision-related quality of life. Am J Ophthalmol. 2009; 147: 869–874. [DOI] [PubMed] [Google Scholar]
- 4. Ryan SJ. Epiretinal membrane. In: Retina. Vol. 3. 5th ed. Philadelphia, PA: Saunders (Imprint) Elsevier; 2013: 1955–1957. [Google Scholar]
- 5. Pournaras CJ, Donati G, Brazitikos PD, et al.. Macular epiretinal membranes. Semin Ophthalmol. 2000; 15: 100–107. [DOI] [PubMed] [Google Scholar]
- 6. Mitchell P, Smith W, Chey T, et al.. Prevalence and associations of epiretinal membranes. The Blue Mountains Eye Study, Australia. Ophthalmology. 1997; 104: 1033–1040. [DOI] [PubMed] [Google Scholar]
- 7. Kawasaki R, Wang JJ, Mitchell P, et al.. Racial difference in the prevalence of epiretinal membrane between Caucasians and Asians. Br J Ophthalmol. 2008; 92: 1320–1324. [DOI] [PubMed] [Google Scholar]
- 8. Fraserbell S, Guzowski M, Rochtchina E, et al.. Five-year incidence and progression of epiretinal membranes: the Blue Mountains Eye Study. Ophthalmology. 2003; 110: 34–40. [DOI] [PubMed] [Google Scholar]
- 9. Bouwens MD, de Jong F, Mulder P, van Meurs JC. Results of macular pucker surgery: 1- and 5-year follow-up. Graefes Arch Clin Exp Ophthalmol. 2008; 246: 1693–1697. [DOI] [PubMed] [Google Scholar]
- 10. Ye H, Zhang Q, Liu X, et al.. Prevalence and associations of epiretinal membrane in an elderly urban Chinese population in China: the Jiangning Eye Study. Br J Ophthalmol. 2015; 99: 1594–1597. [DOI] [PubMed] [Google Scholar]
- 11. Miyazaki M, Nakamura H, Kubo M, et al. Prevalence and risk factors for epiretinal membranes in a Japanese population: the Hisayama study. Graefes Arch Clin Exp Ophthalmol. 2003; 241: 642–646. [DOI] [PubMed] [Google Scholar]
- 12. Aung KZ, Makeyeva G, Adams MK, et al.. The prevalence and risk factors of epiretinal membranes: the Melbourne Collaborative Cohort Study. Retina. 2013; 33: 1026–1034. [DOI] [PubMed] [Google Scholar]
- 13. Fraser-Bell S, Ying-Lai M, Klein R, Varma R. Prevalence and associations of epiretinal membranes in Latinos: the Los Angeles Latino Eye Study. Invest Ophthalmol Vis Sci. 2004; 45: 1732–1736. [DOI] [PubMed] [Google Scholar]
- 14. Duan XR, Liang YB, Friedman DS, et al.. Prevalence and associations of epiretinal membranes in a rural Chinese adult population: the Handan Eye Study. Invest Ophthalmol Vis Sci. 2009; 50: 2018–2023. [DOI] [PubMed] [Google Scholar]
- 15. Johnson MW, Brucker AJ, Chang S, et al.. Vitreomacular disorders: pathogenesis and treatment. Retina. 2012; 32: S173. [DOI] [PubMed] [Google Scholar]
- 16. Ng CH, Cheung N, Wang JJ, et al.. Prevalence and risk factors for epiretinal membranes in a multi-ethnic United States population. Ophthalmology. 2011; 118: 694–699. [DOI] [PMC free article] [PubMed] [Google Scholar]
- 17. Koh V, Cheung CY, Wong WL, et al.. Prevalence and risk factors of epiretinal membrane in Asian Indians. Invest Ophthalmol Vis Sci. 2012; 53: 1018–1022. [DOI] [PubMed] [Google Scholar]
- 18. McCarty DJ, Mukesh BN, Chikani V, et al.. Prevalence and associations of epiretinal membranes in the visual impairment project. Am J Ophthalmol. 2005; 140: 288–294. [DOI] [PubMed] [Google Scholar]
- 19. Cheung N, Tan S, Lee SY, et al.. Prevalence and risk factors for epiretinal membrane: the Singapore Epidemiology of Eye Disease study. Br J Ophthalmol. 2016; 101: 371–376. [DOI] [PubMed] [Google Scholar]
- 20. Kawasaki R, Wang JJ, Sato H, et al.. Prevalence and associations of epiretinal membranes in an adult Japanese population: the Funagata study. Eye. 2009; 23: 1045–1051. [DOI] [PubMed] [Google Scholar]
- 21. Xiao-Feng Z, Jin-Juan P, Hai-Dong Z, et al.. Prevalence and risk factors of idiopathic epiretinal membranes in Beixinjing Blocks, Shanghai, China. PLoS ONE. 2012; 7: e51445. [DOI] [PMC free article] [PubMed] [Google Scholar]
- 22. You Q, Xu L, Jonas JB. Prevalence and associations of epiretinal membranes in adult Chinese: the Beijing Eye Study. Eye. 2008; 22: 874–879. [DOI] [PubMed] [Google Scholar]
- 23. Yan Y, Ni YY, Xing WY, et al.. Ten-year cumulative incidence of epiretinal membranes assessed on fundus photographs. The Beijing Eye Study 2001/2011. Plos One. 2018; 134: e0195768. [DOI] [PMC free article] [PubMed] [Google Scholar]
- 24. Bu SC, Kuijer R, Li XR, et al.. Idiopathic epiretinal membrane. Retina. 2014; 34: 2317–2335. [DOI] [PubMed] [Google Scholar]
- 25. Aso H, Iijima H, Imai M, Gotoh T. Temporal changes in retinal thickness after removal of the epiretinal membrane. Acta Ophthalmol. 2009; 87: 419–423. [DOI] [PubMed] [Google Scholar]
- 26. Treumer F, Wacker N, Junge O, et al.. Foveal structure and thickness of retinal layers long-term after surgical peeling of idiopathic epiretinal membrane. Invest Ophthalmol Vis Sci. 2011; 52: 744–750. [DOI] [PubMed] [Google Scholar]
- 27. Smiddy WE, Maguire AM, Green WR, et al.. Idiopathic epiretinal membranes. Ultrastructural characteristics and clinicopathologic correlation. Ophthalmology. 1989; 96: 811–820. [DOI] [PubMed] [Google Scholar]
- 28. Zhao F, Gandorfer A, Haritoglou C, et al.. Epiretinal cell proliferation in macular pucker and vitreomacular traction syndrome:analysis of flat-mounted internal limiting membrane specimens. Retina. 2013; 33: 77–88. [DOI] [PubMed] [Google Scholar]
- 29. Wu S, Huang Z, Yang X, et al.. Prevalence of ideal cardiovascular health and its relationship with the 4-year cardiovascular events in a northern Chinese industrial city. Circ Cardiovasc Qual Outcomes. 2012:5: 487–493. [DOI] [PubMed] [Google Scholar]
- 30. Zhang Q, Zhou Y, Gao X, et al.. Ideal cardiovascular health metrics and the risks of ischemic and intracerebral hemorrhagic stroke. Stroke. 2013; 44: 2451–2456. [DOI] [PubMed] [Google Scholar]
- 31. Yang JY, Yang X, Li Y, et al.. Carotid atherosclerosis, cerebrospinal fluid pressure, and retinal vessel diameters: the asymptomatic polyvascular abnormalities in community study. Plos One. 2016; 11: e0166993. [DOI] [PMC free article] [PubMed] [Google Scholar]
- 32. Arrighi HM, Hertz-Picciotto I. The evolving concept of the healthy worker survivor effect. Epidemiology. 1994; 5: 189–196. [DOI] [PubMed] [Google Scholar]
- 33. Glantzounis GK, Tsimoyiannis EC, Kappas AM, Galaris DA. Uric acid and oxidative stress. Curr Pharm Des. 2005; 11: 4145–4151. [DOI] [PubMed] [Google Scholar]