

Abstract
Dozens of proteins capture, polymerize, and reshape the clathrin lattice during clathrin-mediated endocytosis (CME). How or if this ensemble of proteins is organized in relation to the clathrin coat is unknown. Here, we map key molecules involved in CME at the nanoscale with correlative super-resolution light and transmission electron microscopy. We localize 19 different endocytic proteins (amphiphysin1, AP2, β2-arrestin, CALM, clathrin, DAB2, dynamin2, EPS15, epsin1, epsin2, FCHO2, HIP1R, intersectin, NECAP, SNX9, stonin2, syndapin2, transferrin receptor, VAMP2) on thousands of individual clathrin structures, generating a comprehensive molecular architecture of endocytosis with nano-precision. We discover that endocytic proteins distribute into distinct spatial zones in relation to the edge of the clathrin lattice. The presence or concentrations of proteins within these zones vary at distinct stages of organelle development. We propose that endocytosis is driven by the recruitment, reorganization, and loss of proteins within these partitioned nano-scale zones.
Clathrin mediated endocytosis (CME) is the eukaryotic cell’s primary internalization mechanism and is central for nutrient uptake, cellular signaling, and homeostasis. For an endocytic vesicle to develop, dozens of unique proteins work together to recruit cargo and stabilize clathrin as a nanoscale honeycomb lattice on the membrane. Factors that associate with the lattice then regulate the growth and curvature of the pit and finally cut the coated-vesicle free from the plasma membrane.1 Decades ago, the protein EPS15 was observed at the rim of the clathrin-coated pit2 suggesting that the edge might be a distinct structural region important for regulating the growing vesicle. Biochemistry and imaging experiments have further led to speculative spatially organized models to explain how CME is controlled1,3–6. Due to the technical difficulty of localizing proteins at the nanoscale across large areas of the cell, however, the spatial organization of the complex and dynamic endocytic machinery is unknown.
Here, in a large-scale correlative super-resolution light and transmission electron microscopy study, we map with nanometer-scale precision 19 key proteins involved in CME. Our data provide a comprehensive molecular architecture of endocytic structures across many cells. We discover a distinct spatial organization within clathrin coated structures; some factors localize only at the edge (EPS15, FCHO2, dynamin, amphiphysin, syndapin, SNX9), or center of the lattice (epsin, NECAP, CALM, HIP1R, receptor cargo), but several have discrete subpopulations in both zones (AP2, DAB2, stonin2, β2-arrestin, intersectin). Furthermore, the presence or concentration of many factors within these zones are different in morphologically distinct stages of organelle development. These data provide a structural framework for understanding the formation and regulation of clathrin-mediated endocytosis and a way forward to study the spatial organization of other nanoscale organelles within cells.
RESULTS
Correlative fluorescence localization and platinum replica electron microscopy
Platinum replica electron microscopy of unroofed cells provides a high-contrast nanoscale view of the clathrin lattice (Fig. 1a).7,8 This meshwork is visualized as flat patches, domes, and vesicles attached to the cytoplasmic side of the plasma membrane. We previously developed a correlative super-resolution localization microscopy and platinum replica electron microscopy method to pinpoint the location of specific endocytic proteins with respect to the clathrin lattice.9 We enabled and improved this technique here with the use of Alexa Fluor 647-conjugated GFP-nanotrap10, a small (2–3 nm) nanobody specific to GFP. This provided three advantages: 1) standardizing our imaging pipeline, 2) placing a bright organic fluorescence label within 5 nm of the target protein, and 3) overcoming the problem of finding 19 individual well-behaved, validated, protein-specific antibodies that work with imaging. To further enable a large-screen of proteins, in many conditions, and across many cells, we additionally implemented a two-dimensional imaging pipeline in Hela cells to increase the rate of data collection five-fold.
Figure 1. Super-resolution CLEM of core CME components and cargo on platinum replica clathrin lattices.

(a) Platinum replicas of clathrin in WT HeLa cells (scale bar, 100 nm). (b-c) Correlative images with GFP fusions to the core clathrin components, clathrin light chain and AP2 (beta subunit), shown in magenta and EM shown in grayscale. (d-e) Correlative images with GFP fusions to the CME cargo proteins, Transferrin Receptor and VAMP2, shown in magenta and EM shown in grayscale. For b-e, a zoomed-out view is shown on the left (scale bar, 500 nm) with two structures shown at larger magnification on the right (scale bar,100 nm). Larger source images can be found in Supp. Fig. 9. Number of cells, structures, membrane area imaged, related protein controls, and independent coverslips imaged are listed in Supplementary Table 1 and discussed in the Methods “Statistics and Reproducibility” section.
With our super-resolution EM correlative imaging method we visualized clathrin-associated proteins from five broad functional categories. The first two categories (Fig. 1b–e) are principal structural components of the vesicle (clathrin light chain and the major clathrin adaptor complex, AP211,12), and cargo proteins (transferrin receptor (TFR)13 and vesicle-associated membrane protein 2 (VAMP2)14). The third (Fig. 2) group includes proteins that, in addition to clathrin and AP25, have been proposed to be important for the initiation of clathrin structures (EPS1515–17, intersectin1s16,18, FCHO216,17, and NECAP3). The fourth category (Fig. 3) includes other clathrin adaptors that bind to the membrane, clathrin, and other components (CALM19, epsin1/220, DAB221, β2-arrestin22, stonin23, HIP1R24)1. The final category (Fig. 4) contains proteins implicated in scission of the vesicle from the plasma membrane (dynamin225, syndapin226,27, amphiphysin128, and SNX929).
Figure 2. Super-resolution CLEM of CME initiation proteins on platinum replica clathrin lattices.

(a-d) Correlative images with GFP fusions to the CME initiation proteins, EPS15, intersectin1s, FCHO2, and NECAP, shown in magenta and EM shown in grayscale. For each, a zoomed-out view is shown on the left (scale bar, 500 nm) with two structures shown at larger magnification on the right (scale bar,100 nm). Larger source images can be found in Supp. Fig. 9. Number of cells, structures, membrane area imaged, related protein controls, and independent coverslips imaged are listed in Supplementary Table 1 and discussed in the Methods “Statistics and Reproducibility” section.
Figure 3. Super-resolution CLEM of clathrin adaptors on platinum replica clathrin lattices.

(a-f) Correlative images with GFP fusions to the clathrin adaptors, CALM, epsin1, epsin2, HIP1R, DAB2, β2-arrestin, and stonin2, shown in magenta and EM shown in grayscale. For each, a zoomed-out view is shown on the left (scale bar, 500 nm) with two structures shown at larger magnification on the right (scale bar,100 nm). Larger source images can be found in Supp. Fig. 9. Number of cells, structures, membrane area imaged, related protein controls, and independent coverslips imaged are listed in Supplementary Table 1 and discussed in the Methods “Statistics and Reproducibility” section.
Figure 4. Super-resolution CLEM of CME scission-associated proteins on platinum replica clathrin lattices.

(a-f) Correlative images with GFP fusions to the scission-associated proteins, dynamin2, syndapin2, amphiphysin1, and SNX9, shown in magenta and EM shown in grayscale. For each, a zoomed-out view is shown on the left (scale bar, 500 nm) with two structures shown at larger magnification on the right (scale bar,100 nm). Larger source images can be found in Supp. Fig. 9. Number of cells, structures, membrane area imaged, related protein controls, and independent coverslips imaged are listed in Supplementary Table 1 and discussed in the Methods “Statistics and Reproducibility” section.
Proteins have distinct spatial localization with respect to the edge of the clathrin lattice
After imaging, the positions of proteins on clathrin-coated structures (CCSs) were computationally analyzed. To do this, we manually outlined clathrin patches in electron microscopy (EM) images of over 18,000 individual clathrin structures (Supp. Table 1). These patches were sub-categorized as flat (little to no visible curvature), domed (curved but clathrin edge is visible), or highly curved (curved beyond a hemisphere, nascent clathrin edge not visible) (Supp. Fig. 1a–d).
We plotted the average fluorescence pixel value as a function of distance from the EM-observed clathrin edge to obtain mean one-dimensional fluorescence intensity profiles (1DFLIPs) (see methods). We binned pixels in 12 nm increments, 10 bins (120 nm) outside the structure, and up to 7 (84 nm) bins toward the center (mean radius of a domed CCS in wild type (WT)) (Fig. 5a–d). The difference in curvature between a domed and flat structure causes the fluorescence from clathrin light chain to shift with respect to the edge of the lattice (Fig. 5e–g). While localization microscopy had a precision of 20 nm (Supp. Fig. 1e–i), slight correlation error and manual outlining broadened the 1DFLIPS (Supp. Fig. 1j–l) which consistently exhibit a slope of ~40 nm to half height. Amongst the 1DFLIPs for 18 different clathrin-associated proteins in flat and domed CCSs (Fig. 6, Supp. Fig. 2a–c), however, we see distinct structural trends. Thus, we classified each of these proteins into four unique categories with hierarchical clustering based on the correlation distance between their combined flat and domed 1DFLIPs (Supp. Fig. 2D). The four categories clearly separate proteins that colocalize with clathrin light chain throughout the lattice (blue), from those that are regularly on the edge (orange), scarce and mostly outside the structure (red), and those that have fluorescence that occupies both the “inside” and “edge” zones (green). Highly curved CCSs were not analyzed because their edges were not visible and they were prone to small movements between light and EM imaging modes causing registration errors. The structural categories generated from these imaging data are clearly different from our previous functional classifications.
Figure 5. CLEM image analysis.
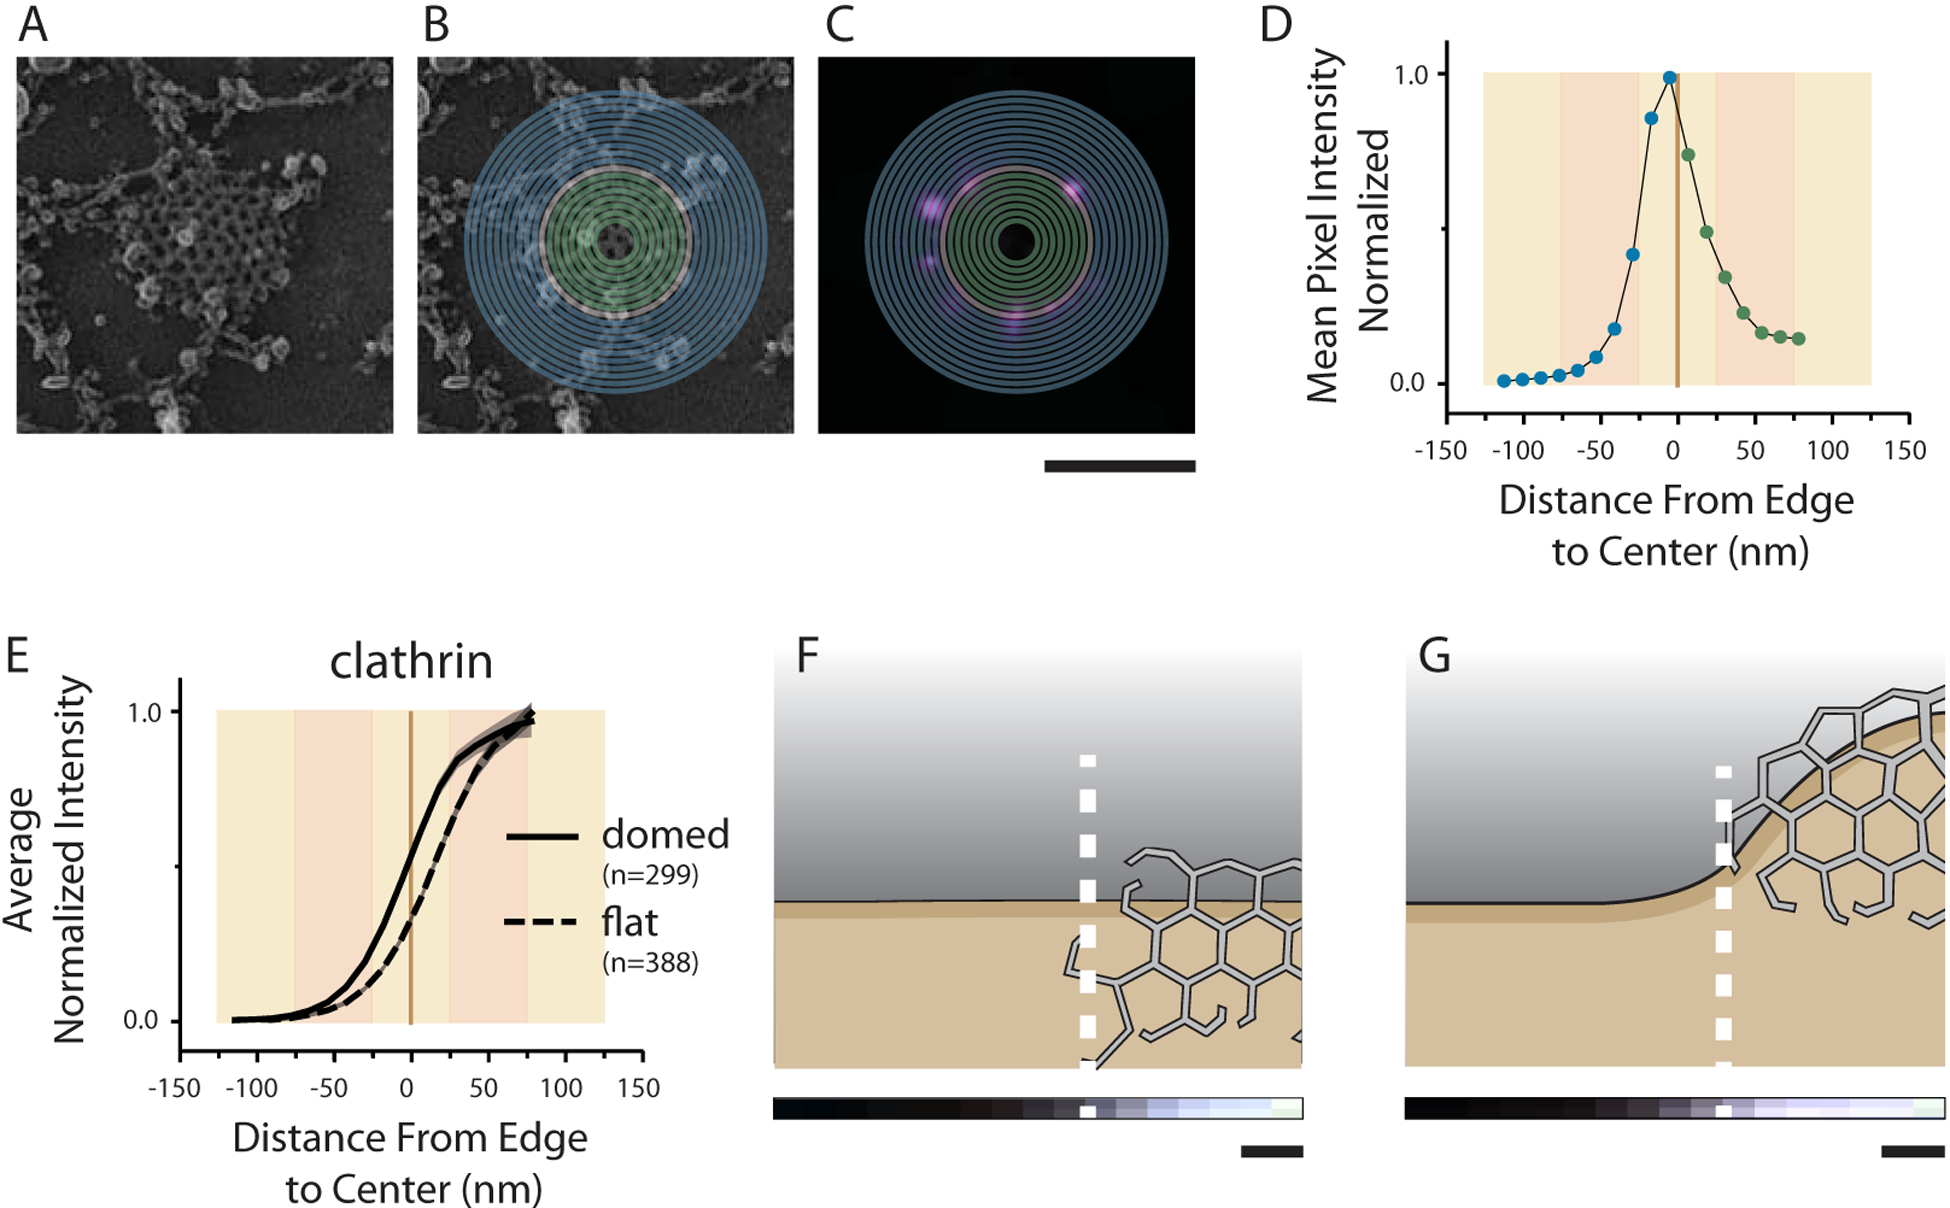
(a-d) Profiles were generated based on mean fluorescence pixel intensity binned by distance from the edge in 12 nm increments. Protein shown is GFPFCHO2. (a) EM image of single clathrin structure. (b) Example edge (tan) outline is shown and bins toward (green) or away (blue) from the center. (c) Binning is then applied to fluorescence data to create a 1DFLIP as in (d). (e) Single 1DFLIPs are normalized by cell intensity (see methods) and averaged to obtain profiles such as these for clathrin light chain fluorescence on domed and flat structures. The 1DFLIPs for clathrin fluorescence on (f) flat and (g) domed CCSs is shown again with the Y-axis being depicted with gray-scale pixel intensity and displayed scaled to a cartoon image of a CCS. The displayed N values are number of clathrin structures analyzed. Standard error is shown in e. Error is also shown as cell-to-cell standard deviation in Supp. Fig. 2. Scale=200 nm in a-c. Scale=24 nm in f-g.
Figure 6. One-dimensional Fluorescence Intensity Profiles (1DFLIPs) for GFP fusions.
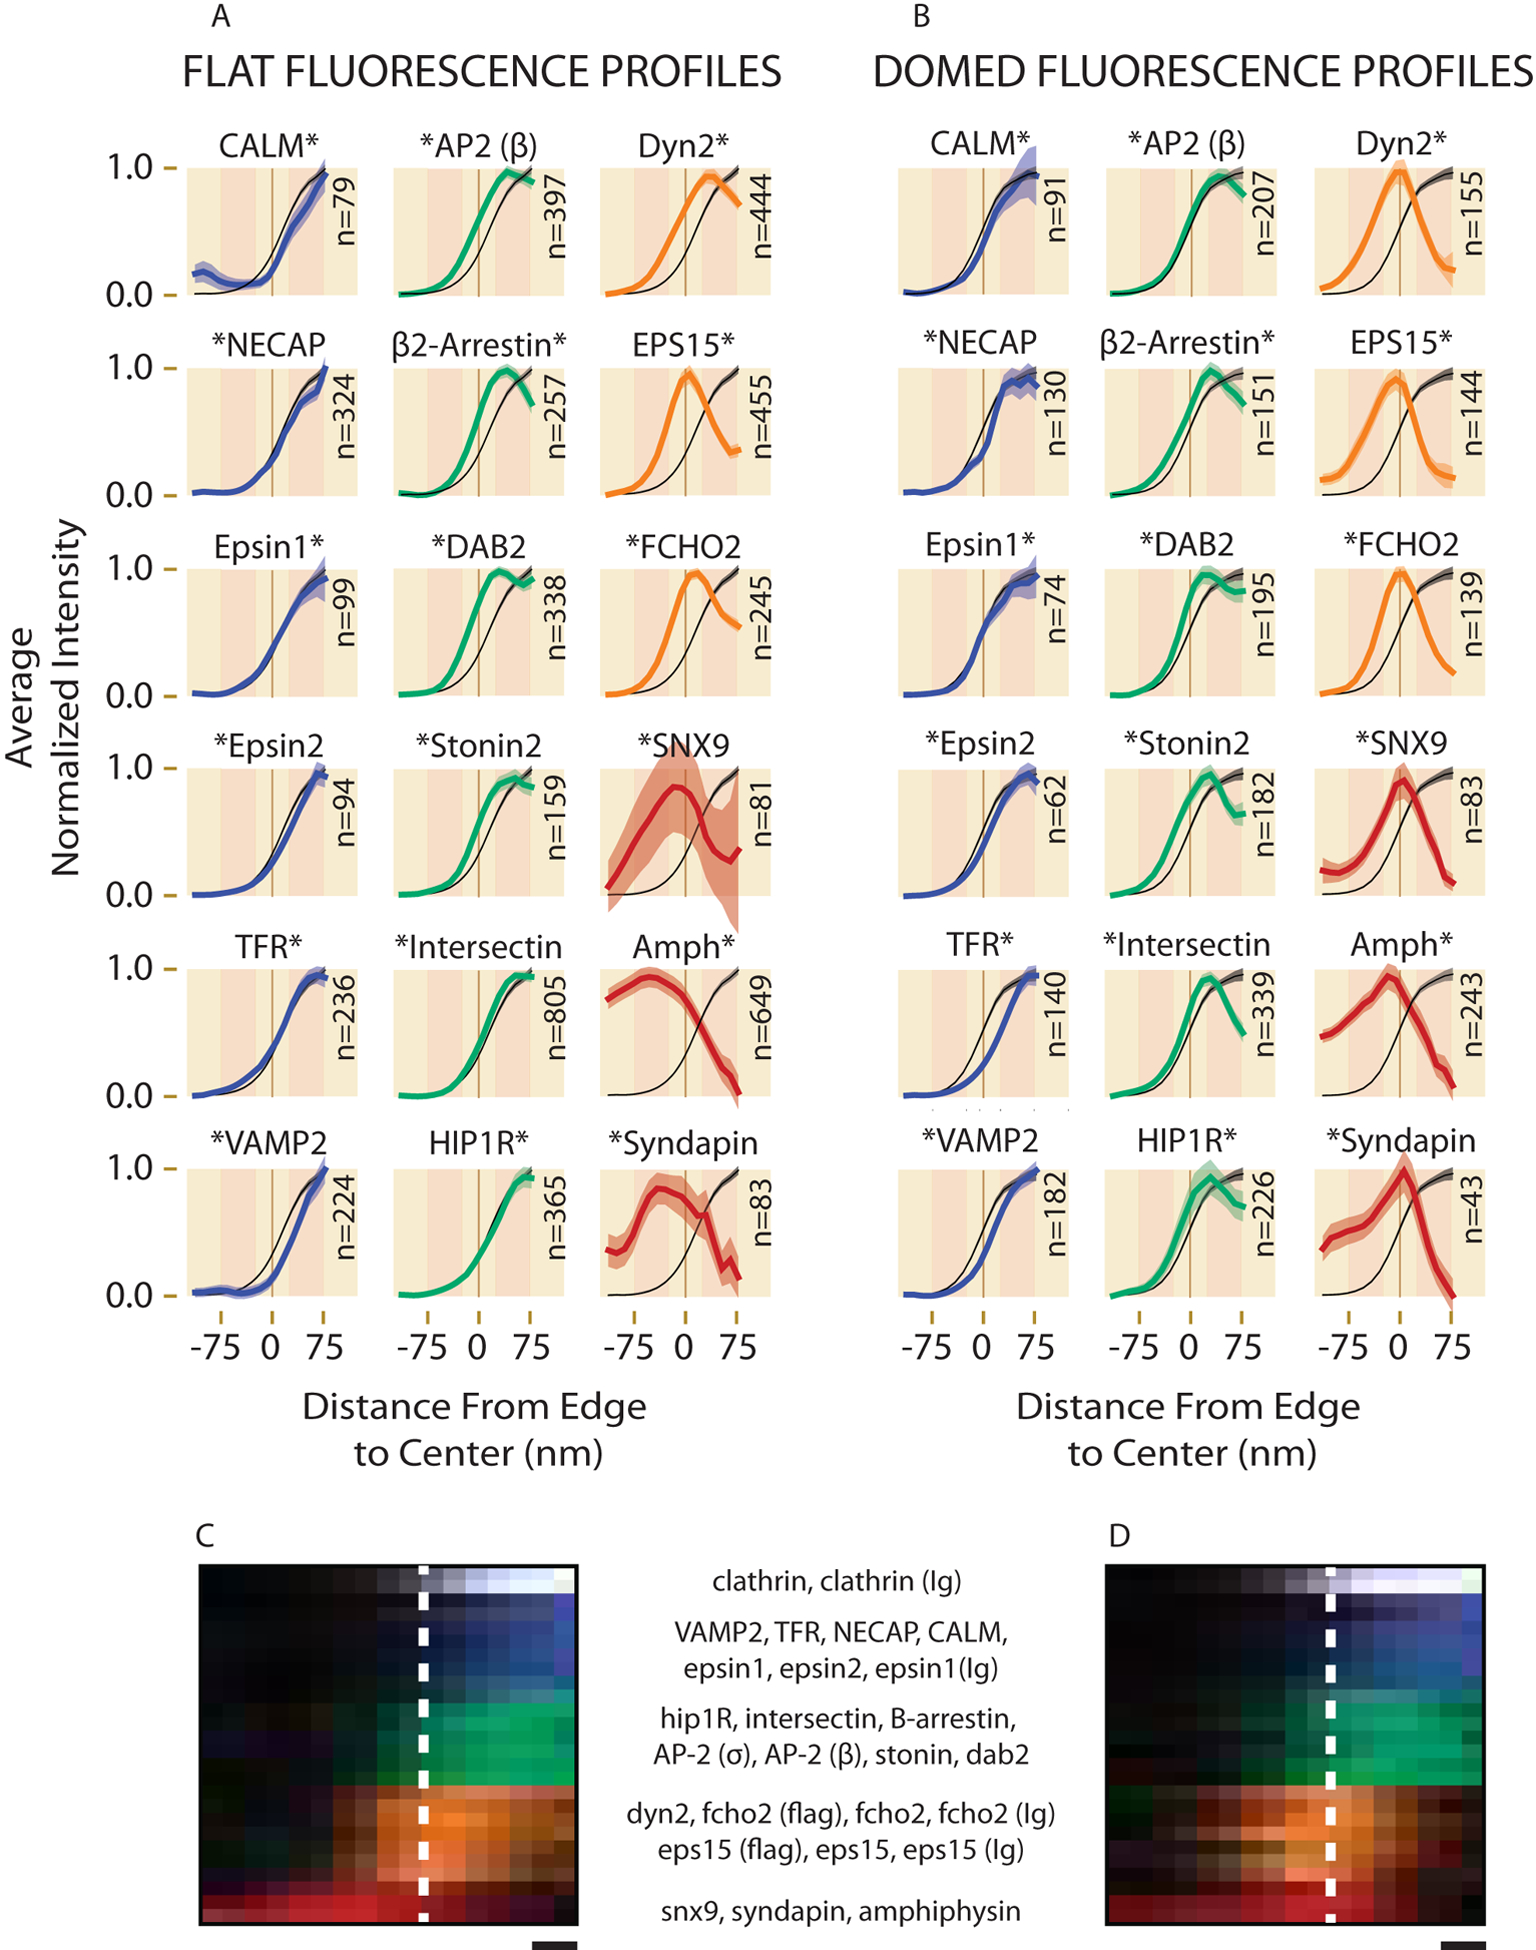
All 1DFLIPs are shown separately with clathrin light chain (black, from Fig. 5e) for (a) flat and (b) domed CCSs. Axes match the axes shown in Fig. 5e. Asterisks denote the side of the protein containing the GFP. Only structures that contained fluorescence were included in the 1DFLIPs and the number of structures included are listed as N. All the 1DFLIPs from a and b are combined with controls from Supp. Fig. 2e (antibody=Ig) and projected with their fluorescence axis depicted with pixel intensity for (c) flat and (d) domed CCSs as was done in Fig. 5f–g. The names of the proteins are given in order according to their colored groupings. Standard error is shown in a-b. Error is also shown as cell-to-cell standard deviation in Supp. Fig. 2. Scale=24 nm in c,d.
Several additional correlative controls were performed to assure that these observations were not artefacts specific to expressing GFP-fusions or cell-specific differences. These include: 1) HeLa expressing flag-tagged EPS15 and FCHO2 (Fig. 6f–g, Supp. Fig. 2e–i), 2) HeLa expressing σ-adaptin-GFP, a different component of the heterotetrameric AP2 complex (with β-adaptin) (Fig. 6f–g, Supp. Fig. 2e–i), 3) HeLa labeled with seven different protein-specific antibodies to mark endogenous proteins (Supp. Figs. 3–4), 4) SK-MEL-2 cells labeled with five protein-specific antibodies (Supp. Figs. 3–4), and 5) SK-MEL-2 with dynamin2-GFP expressed from the genomic location (Supp. Fig. 4)30. While quantity of localizations changed in some cases, we observed no obvious changes in the structural trends described above. Upon over-expression of a few proteins, however, measurable changes in clathrin structure, size, and density were observed, providing possible insights into their functional roles in endocytosis (Supp. Fig. 5). Further controls testing for artefacts due to fixation and unroofing were: 6) Intact HeLa cells labeled with five different protein-specific antibodies in two-color localization microscopy with respect to skylan31-clathrin (Supp. Fig. 6), 7) two-color TIRF-SIM (total internal reflection fluorescence-structured illumination microscopy)32 of GFP protein fusions and clathrin in live cells at 37 °C (Supp. Fig. 7). Both showed organization consistent with the categories discussed above, indicating that fixation, unroofing, labeling, or EM preparations did not substantially alter the structural zones presented above.
Protein position and quantity differs between different morphological stages of CME
Previous live cell imaging experiments have shown that these proteins are dynamically recruited or change concentrations during the development and scission of single clathrin-coated structures in living cells.33 Using our static nanoscale imaging method, we investigated if the average concentrations of these proteins on flat, domed, and highly curved CCSs could help give structural context to dynamic imaging data. To do this, but avoid cell-to-cell differences in expression and labeling, we measured the relative fluorescence density ratio of highly curved vs. domed (FDRcd), and flat vs. domed CCSs (FDRfd) (Fig. 7, S8a–c). In this plot, we expect that if the amount of protein scales proportionally to surface area, FDRcd≈2, FDRfd≈0.5 (based on sphere, hemisphere, and disc surface areas, Fig. 3, dotted lines). When FDRcd>2 (above horizontal dotted line), the protein is gaining concentration and when FDRcd<2 (below horizontal dotted line) the protein is losing concentration as a domed CCS gains curvature. Given that over-expression of certain proteins caused size changes in flat CCSs, and that edge proteins were found inside of large flat “plaques” at breaks in the clathrin lattice (Fig. 6, S8d), the FDRfd values were difficult to interpret beyond generalized groupings of the different structural classes. However, the FDRcds combined with our 1DFLIP data (Fig. 6) help contextualize previous live fluorescence imaging33 and allows us to propose a spatially defined dynamic model of CME (Fig. 8).34 This model of CME clearly separates the edge and inside of the clathrin lattice as distinct structural zones and speculates how proteins may reposition between these zones during pit maturation to drive endocytosis. The broad trends are discussed below.
Figure 7. Fluorescence Density Ratios.

FDRcd vs FDRfd are calculated as ratios of total intensity per area as described in the methods. Dashes at FDRcd=2, FDRfd=0.5 indicate the expected density ratios for proteins statistically distributed throughout the surface of a spherical, hemispherical, or planar object as discussed in the text. Standard Error is shown. These data include structures lacking fluorescence and the number of structures used (N) are shown in Supp. Table 1. Box plots of these data and cell-to-cell variance is shown in Supp. Fig. 8a–c. Total fluorescence ratios, which do not account for structure size, are shown in Supp. Fig. 8e.
Figure 8. Architectural Model of CME.

(a-f) Six key observed structural phenomena of clathrin-associated proteins are hypothesized to be occurring during different stages of pit development. See last paragraph of text for full description.
DISCUSSION
During early stages in CME, the edge is likely a critical zone through which all cargo must pass, curvature is highly dynamic, and growth must be carefully regulated. Thus, the biochemical components of the edge likely play a key role in regulating endocytosis. As previously suggested from immunogold electron microscopy images2,5,16, we find EPS15 and FCHO2 to be localized solely at the edge. Here, in contrast to previous reports35, we show that dynamin2 is co-localized along with these proteins at the “edge” zone of the clathrin lattice (Fig. 6). EPS15 and FCHO2 decrease in concentration as the pit gains curvature to become a vesicle and the edge circumference shrinks (Fig. 7, Supp. Fig. 8a–c,e). Dynamin2 is present at a higher concentration in highly curved CCSs consistent with its enrichment during scission to form a collar (Fig. 7, Supp. Fig. 8a–c,e). As discussed above, edge proteins are seen at the center of large flat CCSs at sites of broken lattice (Supp. Fig. 8d), suggesting that the “edge” zone is biochemically distinguished by the free unbound ends of clathrin triskelia.
The “inside” zone contains seven proteins that are distributed like clathrin light chain throughout the clathrin lattice; epsin (1/2), TFR, NECAP, HIP1R, CALM, and VAMP2. For most of these proteins, the changes in concentration during maturation match those of clathrin and scale with the expected surface area of the lattice (Fig. 7). Two other “inside” zone proteins, CALM and its cargo VAMP2, are more concentrated on highly curved than domed CCSs (Fig. 7) likely indicating a relationship of these factors with high membrane curvature.36 Of note, in the domed 1DFLIPs, our method resolves a 25 nm shift inwards for TFR due to its extracellular C-terminus label and a similar shift outward for HIP1R due to its radially extended C-terminus label (Fig. 3c, 6, Supp. Fig. 2b–c).37,38
Some proteins are found in both the “edge” and “inside” zone and may shift concentrations amongst these zones in domed vs. flat CCSs. The 1DFLIPs of AP2, β2-arrestin, DAB2, stonin2, and intersectin1 all unexpectedly had a distinct concentrated subpopulation located at the edge in domed or flat CCSs. In the FDR plot (Fig. 7, Supp. Fig. 8) these proteins cluster between the inside proteins and the edge proteins having a lower FDRcd than the inside proteins. This leads us to propose that the edge subpopulation decreases as a domed CCSs invaginate and the edge develops into a neck. Of these proteins, intersectin and AP2 stand out as moving in opposite directions (Fig. 6). Intersectin, which has 1DFLIPs like HIP1R but is likely not long enough to be radially extended far from the membrane, appears in our measurements to move toward the edge. In contrast, AP2 repositions toward the center as curvature increases. As an alternative, if intersectin assumes a long-extended conformation as expected for HIP1R, the 1DFLIPs could be explained by a centrifugal movement during the onset of curvature. The disappearing edge subpopulation of AP2 is consistent with live cell measurements6,39 where the average AP2 fluorescence signal moves upwards into the cell at a faster rate than the average clathrin fluorescence signal. Our data, however, suggests that this change is a loss in the edge subpopulation instead of adaptors relocating to the tip of the CCS prior to scission. The observation that intersectin moves toward the edge supports the hypothesis that intersectin separates from AP2 to carry out its role in scission18 and is consistent with the decreased presence of intersectin on purified vesicles16.
The final group of proteins in our model, SNX9, syndapin, and amphiphysin, are seldom on flat or domed CCSs but when they are, they are at the edge or displaced outside of the edge, usually associated with actin (Fig. 4,6). Their high FDRcds (Fig. 7) are consistent with late-stage recruitment during scission. These proteins all have a BAR domain that binds curved membranes and an SH3 domain that binds dynamin or actin regulators. Our data are consistent with previous models that these BAR/SH3 proteins are enriched during the final stages of pit maturation along with dynamin and might aid in actin recruitment involved in membrane scission, vesicle movement, and the transport of the vesicle into the cytoplasm4,29,33,40.
In conclusion, clathrin structures are organized into distinct structural zones set by the edge of the lattice. From our data, we propose a hypothetical dynamic model of endocytosis where endocytosis is driven by changing populations of proteins within these nano-scale zones. In this model, during early stages, the proteins EPS15, FCHO25, and dynamin are networked with the cargo-specific adaptors AP2, β2-arrestin41, stonin242, and DAB243 at the edge. As clathrin is added and cargo (like TFR) is recruited, adaptors are relocated inside the lattice but dynamin, EPS15, and FCHO2 are continuously displaced to the edge44 (Fig. 8a). Meanwhile, epsin, CALM, NECAP, and HIP1R are brought directly into the inside of the growing lattice which encourages increased curvature as the lattice grows3,24,36,45 (Fig. 8b). As curvature increases, AP2 is depleted from the edge and intersectin moves towards the edge to prepare for scission18 (Fig. 8c). With further increases in curvature, CALM is recruited to the “inside zone” bringing with it a burst in cargo including the essential SNARE protein VAMP246 (Fig. 8d). As the neck narrows, the circumference of the edge decreases, and EPS15, FCHO2, and intersectin16 exit but dynamin is concentrated (Fig. 8e). At scission, the dynamin collar at the edge polymerizes recruiting additional dynamin and the BAR/SH3 domain proteins to recruit actin which pushes the vesicle into the cytoplasm29,33,40,47 (Fig. 8f).
Here, we identify a general architecture of clathrin-mediated endocytosis at the nanoscale. However, different cell-types express key proteins in different amounts or in different forms. Thus, while the two cell-lines we tested did not exhibit different localizations and we expect this zoned organization to persist across eukaryotic cells, individual components could be locally repositioned or replaced to regulate CME according to distinct mechanical, energetic, developmental, or signaling needs. In the model presented here, live imaging and biochemical studies are placed into a nanometer-scale structural context to inform how the organization of protein is coordinated during clathrin-mediated endocytosis in living human cells.
Sochacki et al. Materials and Methods
Cell Culture
HeLa cells (ATCC CCL-2) were maintained in phenol free DMEM growth media containing DMEM (Life Technologies 31053–036), 10% Fetal Bovine Serum (Life Technologies 26140–079), 1% vol/vol Penicillin/Streptomycin (Invitrogen 15070–063), 1% vol/vol Glutamax (Life Technologies 35050–061), 1% vol/vol Sodium pyruvate (Sigma S8636–100ML). Cells were incubated at 37 °C, with 5% CO2. The cells were placed on gold nanorod embedded coverslips (hestzig.com, part #600–200AuF) that were previously boiled in an RCA etch solution (5:1:1 water, 30% ammonia, 30% hydrogen peroxide) for 10 minutes, stored in 100% ethanol, and coated in Poly-L-lysine (Sigma P4832) for 20 minutes prior to use. They were transfected with a plasmid to express the protein of interest 5–6 hours after being introduced to the coverslips. Transfection was performed overnight with 0.5 mL of optimem (Life Technologies 31985062), 3 μL lipofectamine 2000 (Life Technologies 11668027), and 1 μg of DNA with 2 mL of added growth medium. No cell lines used in this study were found in the database of commonly misidentified cell lines that is maintained by ICLAC and NCBI Biosample. The cell lines tested negative for mycoplasma contamination. The wild-type cell lines were obtained directly from ATCC (HeLa, 2012; SK-MEL-2, 2015) and used from low passage frozen stocks but were not further authenticated.
Nanobody Purification and Labeling
GFP-nanotrap was purified as previously described48. The purified GFP-nanotrap was labeled with Alexa Fluor 647 (AF647) NHS ester (ThermoFisher 37573) using 2–6 molar excess dye for one hour at room temperature and 3–5 hours at 4 °C. The labeled GFP-nanotrap was purified through a SuperDex 75 10/300 GL size exclusion column and concentrated into PBS to a concentration of 18–35 μM. In an SDS/PAGE gel, the labeled nanobody ran as 4–6 bands ranging from 14–17 kDa indicating different species with 1–4 dyes per nanobody. Concentrations were estimated using A280 extinction coefficient of 26930 M−1cm−1 for the GFP-nanotrap.
Fixing, Unroofing, and Labeling
After 18 hours of transfection, cells were rinsed in intracellular buffer (70 mM KCl, 30 mM HEPES brought to pH 7.4 with KOH, 5 mM MgCl2,3 mM EGTA) for 2 minutes. They were then placed in 0.5% paraformaldehyde (Electron Microscopy Sciences 15710) in intracellular buffer and sonicated Branson Sonifier 450 with a 1/8” tapered microtip (VWR International 33996–163). Sonication was performed at the lowest possible power for 400 ms, 4–5 mm above the coverslip. The coverslips were in fixative for less than 10 seconds prior to sonication. After sonication, the coverslips were moved to fresh 2% paraformaldehyde in intracellular buffer for 20 minutes. They were then rinsed 4x with PBS and blocked with blocking buffer (3% bovine serum albumin (BSA) in phosphate buffered saline (PBS)) for one hour at room temperature. The cells were then labeled with 17.5–35 nM AF647 nanotrap in 1 mL blocking buffer for 1 hour at room temperature. During the last 15 minutes of labeling, 16.5 pmoles of Alexa Fluor 488-Phalloidin (Life Technologies A12379) were added. The coverslips were then rinsed 4x with blocking buffer, 4x with PBS, and then post-fixed with 2% paraformaldehyde in PBS for 20 minutes and imaged immediately or refrigerated overnight. Wild type cells were not transfected. They were unroofed in 0.5% paraformaldehyde then transferred straight into 2% glutaraldehyde prior to EM preparation.
Other Antibodies
For Flag-tag labeling, we used Cell Signaling #3916-S, AF647 labeled rabbit anti-FLAG. This antibody was used at a final concentration of 2 μg/mL with the same antibody labeling procedure as above. We also used mouse anti-clathrin heavy chain (Pierce X-22) at 1:1000, rabbit anti-clathrin heavy chain (Abcam ab21679) at 1:50 for two-color localization clathrin control, rabbit anti-EPS15 (Cell Signaling D3K8R) at 1:200, goat anti-epsin1 (Santa Cruz sc-8673, R-20) at 1:50, rabbit anti-FCHO2 (Novus NBP2–32694) at 1:50, goat anti-dynamin2 (C-18; Santa Cruz sc-6400) at 1:50 for two-color localization and 1:100 for correlation, rabbit anti-DAB2 (Abcam ab33441) at 1:200, and mouse anti-AP2 (AP.6; Pierce MA1–064) at 1:100. After an hour of primary antibody labeling as discussed above, these were rinsed and labeled with the appropriate AF647 labeled secondary antibody at 2 μg/mL: goat anti-rabbit F(ab’)2 fragment (Life Technologies A-21246), goat anti-mouse F(ab’)2 fragment (Life Technologies A-21237), or donkey anti-goat full IgG (Life Technologies A21447).
Plasmids
An existing library of GFP and flag-tag fusion plasmids were sequence-confirmed and identified as in Supp. Table 2.
Localization Fluorescence Microscopy
Localization fluorescence microscopy was performed in blinking buffer (10% w/v glucose, 0.8 mg/mL Glucose oxidase, 0.04 mg/mL Catalase, 100mM 2-mercaptoethanol made fresh in PBS immediately before imaging) in a sealed chamber. Imaging was performed on a Nikon NSTORM system equipped with an Andor iXon Ultra 897 emccd. Prior to localization imaging, a 15×15 large image montage covering approximately 1 mm2 was acquired with 488 nm and with 647 nm epifluorescence excitation. This created a map of all cells in the region (488 nm) and which cells were expressing the target protein (647 nm). It also allowed visualization of the quality of unroofing. Localization microscopy was performed on 6–11 regions (256 × 256 pixels) with 10 kW/cm2, 647 nm laser in deep TIRF or highly inclined (HiLo) illumination, 10 ms frames, for 25000 to 45000 frames. After localization imaging and marking each region onto the large montage map, the bottom of coverslip was etched with a 4 mm diameter circle using a diamond objective marker (Leica 11505059). This etched circle is the region that is subsequently processed for electron microscopy. The oil was cleaned off the coverslip, rinsed with PBS and stored in 2% glutaraldehyde at 4 °C for a minimum of 1 hour and a maximum of 24 hours.
Two-Color Fluorescence Localization Microscopy
HeLa cells were transfected with skylan31-clathrin light chain the night prior to fixation and immunolabeling as described above for other transfections.
In HeLa cells, endogenous proteins of interest were labeled using protein-specific primary antibodies and Alexa Fluor 647 labeled secondary antibodies. Labeling was performed as above except cells remained intact. After growth on nanorod embedded coverslips as above, cells were rinsed twice with Imaging Buffer (10 mM HEPES, 130 mM NaCl, 2.8 mM KCl, 5 mM CaCl2, 1 mM MgCl2, 10 mM glucose, 5% FBS at pH 7.4) and then fixed in 2% paraformaldehyde in Imaging Buffer for 20 minutes. They were then rinsed with PBS 4x. Cells were permeabilized with 0.5% Triton-X, 3% BSA in PBS and blocked in Blocking Buffer (0.2% Triton-X, 3% BSA in PBS) for one hour at room temperature. Cells were then exposed to primary antibody at the concentration listed above in Blocking Buffer for one hour. They were rinsed 4x with Blocking Buffer and then exposed to secondary antibody at the concentration listed above for 30 minutes. Cells were rinsed 4x, fixed again with 2% paraformaldehyde in PBS, and stored in PBS for less than 24 hours before imaging.
Imaging of Alexa Fluor 647 was performed as described above except at 9 ms frames and in some cases as few as 10000 frames. Blinking buffer was made in a tris buffer (50 mM tris-HCl (pH 7.5), 10 mM NaCl) instead of PBS because Skylan is sensitive to pH. Skylan was imaged at ~1kW/cm2 with 20–40 ms exposure time for 5000 to 10000 frames. Imaging of Alexa Fluor 647 was performed first and skylan second. The images were then processed using Nikon Elements where minimum peak height=200, maximum height=65535, camera baseline=100, minimum width=200 nm, maximum width =400 nm, initial fit width= 300 nm, max axial ration =1.3, max displacement=1 pixel. All data was filtered with minimum photons=500 and rendered with 8 nm pixels. The resulting images were laterally shifted with respect to one another in MATLAB (the Mathworks) until finding the maximal image correlation value. Gold fiducial localizations, which were then in the same location by eye, were used to obtain exact centroid values of the fiducials in green and red. These values were then used to do a more exact affine transformation of the red onto the green image. Refined correlation was performed with other independent image features in the DAB2 data due to insufficient gold.
Super-Resolution Total-Internal Reflection Fluorescence Structured Illumination Microscopy (TIRF-SIM)
TIRF-SIM imaging32 was performed on a DeltaVision OMX SR (GE) microscope equipped with an Olympus 60× 1.42 NA PlanApo N objective. Imaging of live cells expressing clathrin-associated proteins of interest as GFP fusions and mCherry-clathrin light chain was done in Imaging Buffer (10 mM HEPES, 130 mM NaCl, 2.8 mM KCl, 5 mM CaCl2, 1 mM MgCl2, 10 mM glucose, 5% FBS at pH 7.4) at 37deg C. Raw images were reconstructed using softWoRx 6.5.2 (GE). For SIM data processing a Weiner constant of 0.001 was used and images zero-clipped to remove negative pixel values. Two-color Images were aligned with a field of 100 nm TetraSpeck beads (Thermo Fisher) acquired before and after each imaging session with custom alignment software written in MATLAB (Mathworks). Reconstructed pixels were 40 nm.
SK-MEL-2 correlative controls
SK-MEL-2 cells, and SK-MEL-2 hDNM2EN (which were a generous gift from D. Drubin, used without further authentication)30 were grown in cell culture as described above. However, coverslips were coated with fibronectin (0.1%, Sigma F0895) diluted 1:100 in PBS. Unroofing was performed the same but with 2% paraformaldehyde present during the unroofing sonication pulse. For dynamin controls, SK-MEL-2 cells were transfected for one day in a T-75 flask, sorted with fluorescence activated cell sorting (FACS) (Aria II; BD Biosciences) for GFP positive cells the following day and grown on coverslips for one more day before fixation and unroofing. No phalloidin was used on SK-MEL-2 cells. SK-MEL-2 WT cells were only used as a control for the dynamin2 data where indicated. All other correlative data was performed on SK-MEL-2 hDNM2EN.
Electron Microscopy
Coverslips were moved straight from glutaraldehyde into 0.1 % w/v tannic acid (freshly dissolved in water) for 20 minutes. They were then rinsed 4x with water and placed in 0.1% w/v uranyl acetate for 20 minutes. The coverslips were then dehydrated, critical point dried, and coated with platinum and carbon as previously described49. The region of interest on the coverslip was imaged with 10x phase contrast to obtain another map of the imaged region. The replicas were lifted as previously described9 and placed onto Formvar/carbon coated 75-mesh copper TEM grids (Ted Pella 01802-F) that were recently glow-discharged. Again, the grid was imaged with 10x phase contrast to find the same region that was originally imaged in Fluorescence. Each cell of interest was located on the grid prior to EM imaging. Some cells were lost behind grid bars. TEM imaging was performed as previously described9 at 15,000x magnification (1.2 nm per pix) using a JEOL 1400 and SerialEM freeware for montaging50.
Image Processing and Correlation
Localization data were processed using Nikon Elements 4.0. The identification parameters for all HeLa correlation data were: Min. Height = 100–200, Max. Height= 65535, CCD baseline=100, Min. Width=200 nm, Max. Width =400 nm, Initial Fit Width=300 nm, Max Axial Ratio= 1.3, Max Displacement= 1 pix. The data were filtered assuming 0.18 photons per count with 50–300 minimum photons. Drift correction by image cross-correlation was performed by Nikon Elements and isolated gold nanorods visible in the images appeared as single axially symmetric clusters of fluorescence localizations. Precision for Alexa Fluor 647 data was estimated at 20 nm based on the full-width at half max of isolated fluorescent peaks (Supp. Fig. 1e–i). The images were generated by Nikon Elements with Gaussian rendering at 5 nm pixel resolution with uncertainty depicted as previously described51. Two-color data, SK-MEL-2 data, and HeLa antibody data for AP2, DAB2, and dynamin2 were rendered with Nikon Elements version 4.1 at 8 nm pixel resolution.
Electron microscopy montages were processed using IMOD freeware52.
Fluorescence images were mapped onto electron microscopy montages using three isolated gold nanorods. The Gaussian centers from the gold nanoparticles in the fluorescence localization image were mapped to the centers of the particles visible in EM using an affine spatial transformation with nearest neighbor interpolation. After transformation, the other gold nanoparticles were visually checked for tight colocalization. In the case that the other nanoparticles were not colocalized, different nanoparticles were used for the spatial transformation.
Image Analysis
A single “cell” as designated in this manuscript refers to a single correlated image. These images can be assumed to be only a portion of a full cell membrane. We are limited to imaging only what is left behind after unroofing and we also limit our EM imaging to 475 μm2 so bowing of the EM grid membrane does not affect correlation error. There are three cases where two separate correlation images could have come from the same original cell (SNX9, β-arrestin, clathrin light chain).
Looking at only the EM images, each clathrin structure was outlined at the edge of the visible clathrin meshwork using ImageJ53. Flat CCSs were identified as honeycomb objects with no visible curvature. Flat CCSs touching one another were all considered one single structure. Domed CCSs were identified as honeycomb objects with visible curvature that we could still see where the clathrin mesh met the membrane. Highly curved CCSs were identified as honeycomb objects that were invaginated to the point that we could not see where the clathrin met the membrane from a cytoplasmic view. Domed and highly curved CCSs were generally outlined using an elliptical tool, while flat CCSs were generally outlined with a freestyle tool. Clathrin regions were not outlined or analyzed if they were within 500 nm of the membrane edge or a gold particle (Supp. Fig. 1a–d). This is because the edge often experiences curling during EM processing that introduces registration errors and the gold localizations interfere with AF647 localizations.
A binary mask of the domed, flat, and highly curved CCSs and area analyzed (excluding edges and gold) was created in imageJ (Supp. Fig 1a–d). This mask was used in conjunction with the spatially transformed localization image to analyze the fluorescence associated with the clathrin structures. These were imported into a custom MATLAB (The Mathworks) program for the remainder of the analysis.
Edge Fluorescence Profiles (1DFLIPs):
10 pixel (12 nm) bins outside and inside the edge of a structure were created by dilating or eroding the mask of each separate structure with a ten-pixel disk. Only structures with fluorescence inside or within 60 nm of the edge were included in the 1DFLIP analysis. Each structure was analyzed with 10 bins outside of the edge border and 7 bins inside of the edge border unless the structure was too small to allow for 7 bins. We chose 7 bins inside of the structure based on the average radius of a domed CCS in wild type cells. The average fluorescence in each bin (sum fluorescence signal divided by pixel number) created a profile for each structure. All the profiles from each cell and structure type were averaged together. The max intensity from the single cell average profile was used as a normalization factor for each separate profile when the profiles from different cells were combined as averages.
Relative Fluorescence Density Ratio (FDR) Measurements:
The density of fluorescence (FD) associated with each structure was found by taking the pixel average of all pixels in the spatially transformed fluorescence image within 60 nm of the object as it was circled in EM. For each cell, we found the average density associated with domed CCSs:
Then we found ratios of total fluorescence associated with highly curved to domed CCSs and flat to domed CCSs as shown in Figure 3.
A similar measurement is shown in Figure S50 where, instead of fluorescence density, we observed the total intensity (sum pixel values) associated with each structure (F) to obtain total fluorescence ratios (FR). These measurements are different because they do not account for the area of the structure. Instead, they are useful in understanding how the total amount of proteins on an object may be changing as a structure matures.
Above, ndomed, nflat, and ncurved refer to the number of domed, flat, and highly curved CCSs analyzed.
Statistics and Reproducibility:
The number of cells, number of independent coverslips imaged, number of structures outlined (used in FDRs in Fig. 7 and Supp. Fig. 8a–c,e), number of structures with fluorescence (used in Fig. 5e–g, Fig. 6, and Supp. Fig. 1j–k, Supp. Fig. 2, Supp. Fig. 4c–d), and area analyzed are listed in Supp. Table 1. 1DFLIPs in Fig. 5–6 are shown as averages of all structures analyzed with standard error. The same data are shown in Supp. Fig. 2a–c but averaging the data amongst separate cells and showing standard deviation. FDR data shown in Fig. 7 are shown as averages amongst all clathrin structures and standard error in shown. The same data are shown in Supp. Fig. 8a–c as box plots also displaying the average FDR values from each separate cell. Supp. Fig. 8e shows total fluorescence ratios with mean of CCSs and standard error which are the same data as in Fig. 7 but not accounting for CCS area (absolute fluorescence rather than fluorescence density). CCS area and density data in Supp. Fig. 5b–d show the cell-to-cell average of the median area from each separate cell with standard deviation. Average and standard deviation of density are also shown. The area of CCSs are shown in box plots in Supp. Fig. 5e–g also showing the median from each separate cell. The trends discussed in the text are observable independent of the mode of statistics used in either the main figures or supplemental figures.
Code Availability:
Matlab code used in this study is specific to personal lab file formatting and not created for general use. However, code is available upon request of the corresponding author.
Data Availability:
All data supporting this work are available upon reasonable request to the corresponding author.
Supplementary Material
Acknowledgements:
We thank the US National Heart Lung and Blood Institute (NHLBI) electron microscopy core, the NHLBI flow cytometry core, and the NHLBI light microscopy core for use of equipment; specifically, C. Bleck, E. Stempinski, and C. Keshavarz for help in the EM core, P. Dagur with help doing FACS, and X. Wu for help with TIRF-SIM; D. Drubin for the generous gift of the SK-MEL-2 hDNM2EN cell line; K. Neuman, J. Hinshaw, and K. Swartz for helpful reading of the manuscript; A. Trexler, A. Somasundaram, T. Davenport, and J. Ciemniecki for scientific discussion, Ho-Jung Yang for help in image processing, and E. Tyler of NIH Medical Arts for creating Figure 4. J.W.T. is supported by the Intramural Research Program of the National Heart Lung and Blood Institute, National Institutes of Health.
Footnotes
Competing Financial Interest:
The authors declare no competing financial interest.
References:
- 1.McMahon HT & Boucrot E Molecular mechanism and physiological functions of clathrin-mediated endocytosis. Nature reviews Molecular cell biology 12, 517–533 (2011). [DOI] [PubMed] [Google Scholar]
- 2.Tebar F, Sorkina T, Sorkin A, Ericsson M & Kirchhausen T Eps15 is a component of clathrin-coated pits and vesicles and is located at the rim of coated pits. Journal of Biological Chemistry 271, 28727–28730 (1996). [DOI] [PubMed] [Google Scholar]
- 3.Ritter B et al. NECAP 1 regulates AP-2 interactions to control vesicle size, number, and cargo during clathrin-mediated endocytosis. PLoS Biol 11, e1001670 (2013). [DOI] [PMC free article] [PubMed] [Google Scholar]
- 4.Daumke O, Roux A & Haucke V BAR domain scaffolds in dynamin-mediated membrane fission. Cell 156, 882–892 (2014). [DOI] [PubMed] [Google Scholar]
- 5.Ma L et al. Transient Fcho1/2· Eps15/R· AP-2 Nanoclusters Prime the AP-2 Clathrin Adaptor for Cargo Binding. Developmental cell 37, 428–443 (2016). [DOI] [PMC free article] [PubMed] [Google Scholar]
- 6.Saffarian S & Kirchhausen T Differential evanescence nanometry: live-cell fluorescence measurements with 10-nm axial resolution on the plasma membrane. Biophysical journal 94, 2333–2342 (2008). [DOI] [PMC free article] [PubMed] [Google Scholar]
- 7.Heuser J Quick-freeze, deep-etch preparation of samples for 3-D electron microscopy. Trends in Biochemical Sciences 6, 64–68 (1981). [Google Scholar]
- 8.Collins A, Warrington A, Taylor KA & Svitkina T Structural organization of the actin cytoskeleton at sites of clathrin-mediated endocytosis. Current Biology 21, 1167–1175 (2011). [DOI] [PMC free article] [PubMed] [Google Scholar]
- 9.Sochacki KA, Shtengel G, van Engelenburg SB, Hess HF & Taraska JW Correlative super-resolution fluorescence and metal-replica transmission electron microscopy. Nature methods 11, 305–308 (2014). [DOI] [PMC free article] [PubMed] [Google Scholar]
- 10.Rothbauer U et al. A versatile nanotrap for biochemical and functional studies with fluorescent fusion proteins. Molecular & Cellular Proteomics 7, 282–289 (2008). [DOI] [PubMed] [Google Scholar]
- 11.Collins BM, McCoy AJ, Kent HM, Evans PR & Owen DJ Molecular architecture and functional model of the endocytic AP2 complex. Cell 109, 523–535 (2002). [DOI] [PubMed] [Google Scholar]
- 12.Traub LM Sorting it out AP-2 and alternate clathrin adaptors in endocytic cargo selection. The Journal of cell biology 163, 203–208 (2003). [DOI] [PMC free article] [PubMed] [Google Scholar]
- 13.Miller K, Shipman M, Trowbridge I & Hopkins CR Transferrin receptors promote the formation of clathrin lattices. Cell 65, 621–632 (1991). [DOI] [PubMed] [Google Scholar]
- 14.Harel A, Wu F, Mattson MP, Morris CM & Yao PJ Evidence for CALM in directing VAMP2 trafficking. Traffic 9, 417–429 (2008). [DOI] [PubMed] [Google Scholar]
- 15.Benmerah A, Bayrou M, Cerf-Bensussan N & Dautry-Varsat A Inhibition of clathrin-coated pit assembly by an Eps15 mutant. Journal of Cell Science 112, 1303–1311 (1999). [DOI] [PubMed] [Google Scholar]
- 16.Henne WM et al. FCHo proteins are nucleators of clathrin-mediated endocytosis. Science 328, 1281–1284 (2010). [DOI] [PMC free article] [PubMed] [Google Scholar]
- 17.Umasankar P et al. Distinct and separable activities of the endocytic clathrin-coat components Fcho1/2 and AP-2 in developmental patterning. Nature cell biology 14, 488–501 (2012). [DOI] [PMC free article] [PubMed] [Google Scholar]
- 18.Pechstein A et al. Regulation of synaptic vesicle recycling by complex formation between intersectin 1 and the clathrin adaptor complex AP2. Proceedings of the National Academy of Sciences 107, 4206–4211 (2010). [DOI] [PMC free article] [PubMed] [Google Scholar]
- 19.Tebar F, Bohlander SK & Sorkin A Clathrin assembly lymphoid myeloid leukemia (CALM) protein: localization in endocytic-coated pits, interactions with clathrin, and the impact of overexpression on clathrin-mediated traffic. Molecular biology of the cell 10, 2687–2702 (1999). [DOI] [PMC free article] [PubMed] [Google Scholar]
- 20.Chen H et al. Epsin is an EH-domain-binding protein implicated in clathrin-mediated endocytosis. Nature 394, 793–797 (1998). [DOI] [PubMed] [Google Scholar]
- 21.Mishra SK et al. Disabled-2 exhibits the properties of a cargo selective endocytic clathrin adaptor. The EMBO journal 21, 4915–4926 (2002). [DOI] [PMC free article] [PubMed] [Google Scholar]
- 22.Goodman OB Jr, Krupnick JG, Santini F & Gurevich VV Beta-arrestin acts as a clathrin adaptor in endocytosis of the beta2-adrenergic receptor. nature 383, 447 (1996). [DOI] [PubMed] [Google Scholar]
- 23.Willox AK & Royle SJ Stonin 2 is a major adaptor protein for clathrin-mediated synaptic vesicle retrieval. Current Biology 22, 1435–1439 (2012). [DOI] [PMC free article] [PubMed] [Google Scholar]
- 24.Engqvist-Goldstein ÅE et al. The actin-binding protein Hip1R associates with clathrin during early stages of endocytosis and promotes clathrin assembly in vitro. The Journal of cell biology 154, 1209–1224 (2001). [DOI] [PMC free article] [PubMed] [Google Scholar]
- 25.Hinshaw J Dynamin and its role in membrane fission 1. Annual review of cell and developmental biology 16, 483–519 (2000). [DOI] [PMC free article] [PubMed] [Google Scholar]
- 26.da Costa SR et al. Impairing actin filament or syndapin functions promotes accumulation of clathrin-coated vesicles at the apical plasma membrane of acinar epithelial cells. Molecular biology of the cell 14, 4397–4413 (2003). [DOI] [PMC free article] [PubMed] [Google Scholar]
- 27.Kessels MM & Qualmann B Syndapins integrate N-WASP in receptor-mediated endocytosis. The EMBO journal 21, 6083–6094 (2002). [DOI] [PMC free article] [PubMed] [Google Scholar]
- 28.Takei K, Slepnev VI, Haucke V & De Camilli P Functional partnership between amphiphysin and dynamin in clathrin-mediated endocytosis. Nature cell biology 1, 33–39 (1999). [DOI] [PubMed] [Google Scholar]
- 29.Soulet F, Yarar D, Leonard M & Schmid SL SNX9 regulates dynamin assembly and is required for efficient clathrin-mediated endocytosis. Molecular biology of the cell 16, 2058–2067 (2005). [DOI] [PMC free article] [PubMed] [Google Scholar]
- 30.Doyon JB et al. Rapid and efficient clathrin-mediated endocytosis revealed in genome-edited mammalian cells. Nature Cell Biology 13, 331–337 (2011). [DOI] [PMC free article] [PubMed] [Google Scholar]
- 31.Zhang X et al. Development of a reversibly switchable fluorescent protein for super-resolution optical fluctuation imaging (SOFI). ACS nano 9, 2659–2667 (2015). [DOI] [PubMed] [Google Scholar]
- 32.Kner P, Chhun BB, Griffis ER, Winoto L & Gustafsson MG Super-resolution video microscopy of live cells by structured illumination. Nature methods 6, 339–342 (2009). [DOI] [PMC free article] [PubMed] [Google Scholar]
- 33.Taylor MJ, Perrais D & Merrifield CJ A high precision survey of the molecular dynamics of mammalian clathrin-mediated endocytosis. PLoS Biol 9, e1000604 (2011). [DOI] [PMC free article] [PubMed] [Google Scholar]
- 34.Kukulski W, Schorb M, Kaksonen M & Briggs JA Plasma membrane reshaping during endocytosis is revealed by time-resolved electron tomography. Cell 150, 508–520 (2012). [DOI] [PubMed] [Google Scholar]
- 35.Damke H, Baba T, Warnock DE & Schmid SL Induction of mutant dynamin specifically blocks endocytic coated vesicle formation. The Journal of cell biology 127, 915–934 (1994). [DOI] [PMC free article] [PubMed] [Google Scholar]
- 36.Miller SE et al. CALM regulates clathrin-coated vesicle size and maturation by directly sensing and driving membrane curvature. Developmental cell 33, 163–175 (2015). [DOI] [PMC free article] [PubMed] [Google Scholar]
- 37.Picco A, Mund M, Ries J, Nedelec F & Kaksonen M Visualizing the functional architecture of the endocytic machinery. Elife 4, e04535 (2015). [DOI] [PMC free article] [PubMed] [Google Scholar]
- 38.Clarke NI & Royle SJ FerriTag: A Genetically-Encoded Inducible Tag for Correlative Light-Electron Microscopy. bioRxiv, doi: 10.1101/095208 (2016). [DOI] [PMC free article] [PubMed] [Google Scholar]
- 39.Loerke D, Mettlen M, Schmid SL & Danuser G Measuring the Hierarchy of Molecular Events During Clathrin-Mediated Endocytosis. Traffic 12, 815–825 (2011). [DOI] [PMC free article] [PubMed] [Google Scholar]
- 40.Itoh T et al. Dynamin and the actin cytoskeleton cooperatively regulate plasma membrane invagination by BAR and F-BAR proteins. Developmental cell 9, 791–804 (2005). [DOI] [PubMed] [Google Scholar]
- 41.Ferguson SS, Downey III WE, Colapietro A-M & Barak LS Role of beta-arrestin in mediating agonist-promoted G protein-coupled receptor internalization. Science 271, 363 (1996). [DOI] [PubMed] [Google Scholar]
- 42.Diril MK, Wienisch M, Jung N, Klingauf J & Haucke V Stonin 2 is an AP-2-dependent endocytic sorting adaptor for synaptotagmin internalization and recycling. Developmental cell 10, 233–244 (2006). [DOI] [PubMed] [Google Scholar]
- 43.Maurer ME & Cooper JA The adaptor protein Dab2 sorts LDL receptors into coated pits independently of AP-2 and ARH. Journal of cell science 119, 4235–4246 (2006). [DOI] [PubMed] [Google Scholar]
- 44.Cupers P, Jadhav AP & Kirchhausen T Assembly of clathrin coats disrupts the association between Eps15 and AP-2 adaptors. Journal of Biological Chemistry 273, 1847–1850 (1998). [DOI] [PubMed] [Google Scholar]
- 45.Ford MG et al. Curvature of clathrin-coated pits driven by epsin. Nature 419, 361–366 (2002). [DOI] [PubMed] [Google Scholar]
- 46.Miller SE et al. The molecular basis for the endocytosis of small R-SNAREs by the clathrin adaptor CALM. Cell 147, 1118–1131 (2011). [DOI] [PMC free article] [PubMed] [Google Scholar]
- 47.Dawson JC, Legg JA & Machesky LM Bar domain proteins: a role in tubulation, scission and actin assembly in clathrin-mediated endocytosis. Trends in cell biology 16, 493–498 (2006). [DOI] [PubMed] [Google Scholar]
- 48.Bird JE et al. Chaperone-enhanced purification of unconventional myosin 15, a molecular motor specialized for stereocilia protein trafficking. Proceedings of the National Academy of Sciences 111, 12390–12395 (2014). [DOI] [PMC free article] [PubMed] [Google Scholar]
- 49.Sochacki KA et al. Imaging the post-fusion release and capture of a vesicle membrane protein. Nature communications 3, 1154 (2012). [DOI] [PMC free article] [PubMed] [Google Scholar]
- 50.Mastronarde DN Automated electron microscope tomography using robust prediction of specimen movements. Journal of structural biology 152, 36–51 (2005). [DOI] [PubMed] [Google Scholar]
- 51.Thompson RE, Larson DR & Webb WW Precise nanometer localization analysis for individual fluorescent probes. Biophysical journal 82, 2775–2783 (2002). [DOI] [PMC free article] [PubMed] [Google Scholar]
- 52.Kremer JR, Mastronarde DN & McIntosh JR Computer visualization of three-dimensional image data using IMOD. Journal of structural biology 116, 71–76 (1996). [DOI] [PubMed] [Google Scholar]
- 53.Schindelin J et al. Fiji: an open-source platform for biological-image analysis. Nature methods 9, 676–682 (2012). [DOI] [PMC free article] [PubMed] [Google Scholar]
Associated Data
This section collects any data citations, data availability statements, or supplementary materials included in this article.
Supplementary Materials
Data Availability Statement
All data supporting this work are available upon reasonable request to the corresponding author.