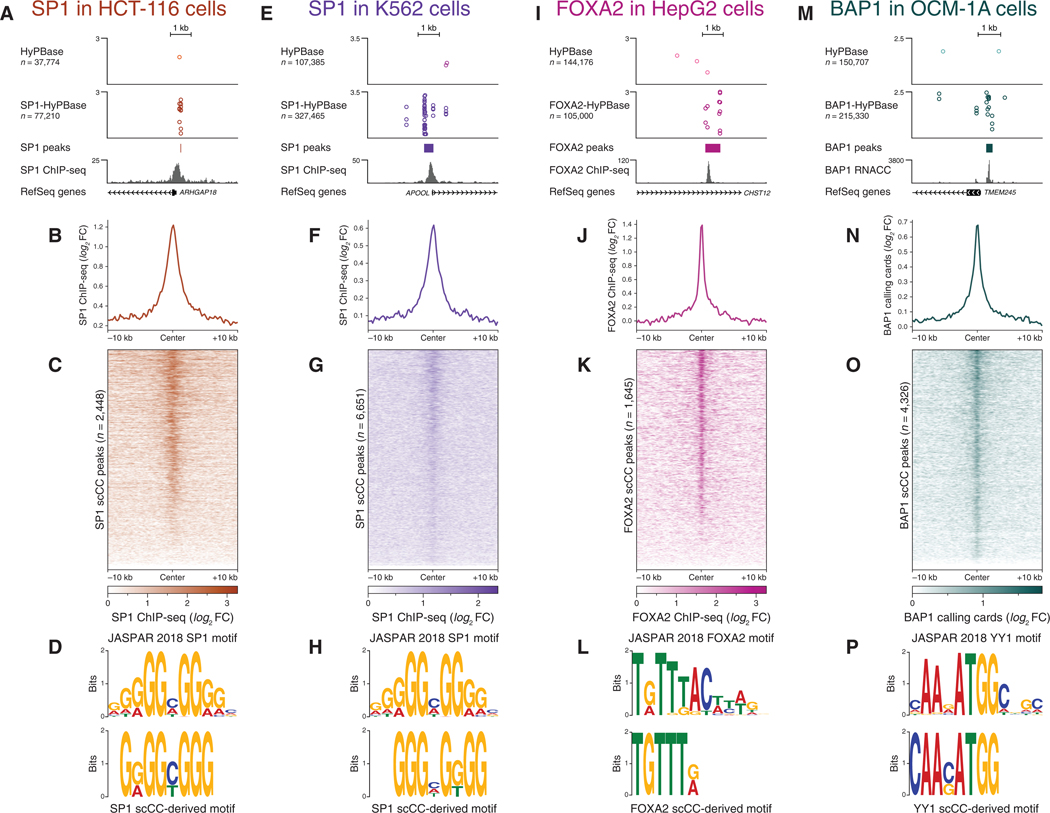
Figure 4. scCC Works with a Variety of Transcription Factors and Cell Lines.
(A-D) scCC with SP1-HyPBase in HCT-116cells reveal SP1 binding sites. (A) Browser view of a peak from SP1 scCC. (B) Mean SP1 ChlP-seq signal at scCC SP1 peaks. (C) Heatmap of SP1 ChlP-seq signal across all scCC SP1 peaks. (D) Core SP1 motif elicited from SP1 scCC peaks.
(E-H) Same as (A)-(D) but in K562 cells.
(I-L) scCC with FOXA2-HyPBase in HepG2 cells reveal FOXA2 binding sites. (I) Browser view of a peak from FOXA2 scCC. (J) Mean FOXA2 ChlP-seq signal at scCC FOXA2 peaks. (K) Heatmap of FOXA2 ChlP-seq signal across all scCC FOXA2 peaks. (L) Core FOXA2 motif elicited from FOXA2 scCC peaks.
(M-P) scCCwith BAP1-HyPB in OCM-1Acells reveal BAP1 binding sites. (M) Browser view of a peak from BAP1 scCC. (N) Mean bulk BAP1 calling cardssignal at scCC BAP1 peaks. (O) Heatmap of bulk BAP1 calling cards signal across all scCC BAP1 peaks. (P) YY1 motif elicited from BAP1 scCC peaks.
See also Figure S4. FC, fold change.

