

Abstract
Background:
Lead (Pb) is a highly toxic pollutant. Evidence suggests it is associated with cardiovascular disease (CVD)-related mortality.
Objectives:
We present a rigorous approach for identifying concentration–response functions that relate adult Pb exposures to CVD mortality to inform a health impact model (HIM). We then use the model in a proof-of-concept example.
Methods:
Building on previously conducted government literature reviews and a de novo supplemental literature review, we compiled and evaluated the available data on Pb and CVD mortality in humans. We applied a set of predefined selection criteria to identify studies that would be most useful in understanding the impact of Pb exposure on CVD mortality risk in adults. Once we identified the studies, we derived a HIM and used each study’s concentration–response function in a proof-of-concept example.
Results:
Our literature search identified 15 studies for full-text review. Of those 15 studies, 4 fit our criteria for use in the HIM. Using population and CVD mortality rates for 40- to 80-y-olds in 2014, we estimated that 34,000–99,000 deaths have been avoided due to the lowering of blood Pb levels from 1999 to 2014. Based on these values we estimated that approximately 16%–46% of the decreased CVD-related death rate from 1999 to 2014 may be attributable to decreased blood Pb levels.
Conclusion:
Our results demonstrate that decreases in Pb exposure can result in large benefits for the adult population. We have provided a HIM that can be used in a variety of applications from burden-of-disease estimates to regulatory impact assessments and have demonstrated its sensitivity to the choice of concentration–response function. https://doi.org/10.1289/EHP6552
Introduction
Lead (Pb) is a highly toxic pollutant that can damage neurological, cardiovascular, immunological, developmental, and other major organ systems (NTP 2012; U.S. EPA 2013). Recent evidence has suggested that exposure to Pb in adults can result in adverse cardiovascular impacts, including increases in hypertension (Muntner et al. 2005; Navas-Acien et al. 2008), coronary heart disease (Jain et al. 2007), cardiovascular disease (CVD) (Chowdhury et al. 2018; Guallar et al. 2006; Muntner et al. 2005; Navas-Acien et al. 2004), and CVD-related mortality (CVD mortality) (Aoki et al. 2016; Lanphear et al. 2005; Menke et al. 2006; Ruiz-Hernandez et al. 2017). Mechanisms by which Pb may increase risk of death due to cardiovascular disease have been studied in in vitro and in vivo studies. The potential mechanisms include increasing oxidative stress (Gonick et al. 1997; Vaziri 2008), altering the function of vascular cells (Chang et al. 2011; Vaziri 2008), inducing inflammatory reactions (Chang et al. 2011; Vaziri 2008), and disrupting calcium homeostasis (Vaziri 2008).
The impact of Pb exposure on increased risk of CVD mortality has been observed in several epidemiological studies (Aoki et al. 2016; Khalil et al. 2009; Lanphear et al. 2018; Menke et al. 2006; Ruiz-Hernandez et al. 2017; Schober et al. 2006; Weisskopf et al. 2015). In addition, the U.S. Burden of Disease Collaborators determined that Pb is a top 10 CVD risk factor in the United States (U.S. Burden of Disease Collaborators 2013). Further, both the U.S. Environmental Protection Agency (U.S. EPA 2013) and the National Toxicology Program (NTP 2012) have categorized the relationship between Pb exposure and CVD mortality in their top two tiers of causality after thorough weight-of-evidence assessments. These assessments evaluated the amount that chance, bias, and confounding could be ruled out as the explanation for the relationship between exposure to Pb and adverse health outcomes.
Recently, several studies have demonstrated that there is a significant benefit of reducing blood Pb levels over time. For example, Ruiz-Hernandez et al. (2017) investigated how the decreasing U.S. blood lead levels, as indicated by the differences in blood Pb observed in the 1988–1994 [i.e., National Health and Nutrition Examination Survey (NHANES III)] to 1999–2004 NHANES data sets, contributed to declining CVD mortality rates in the U.S. population. After adjusting for traditional CVD risk factors, the authors found that nearly 25% of avoided CVD-related deaths in the 1999–2004 data set were attributable to decreases in Pb exposure. In addition, Lanphear et al. (2018) estimated that increasing blood Pb levels in U.S. adults from to (the 90th percentile of blood Pb in the 1988–1994 NHANES data) would result in an additional 256,000 CVD-related deaths. These studies provide strong evidence that, even at low levels of Pb exposure, further decreasing exposure has the potential for great public health benefit.
The objective of this paper is to present a rigorous approach for identifying concentration–response functions and using them to inform a derived health impact model (HIM) that relates adult Pb exposures to CVD mortality. We define a HIM as a scalable, quantitative representation of the relationship between an exposure to a chemical and the human health response due to that exposure. Specifically, a HIM is able to relate a unit change in exposure to a unit change in the resulting outcome. HIMs are crucial tools for evaluating benefits for rulemakings, assessing the effectiveness of interventions, and developing burden-of-disease estimates.
The goal of our HIM is to provide a generalized function that stakeholders can apply to translate the findings of the epidemiological studies into a form that is useful for estimating the benefits of avoided CVD mortality from reductions in Pb exposure. Previously, environmental rulemakings focused mainly on quantifying the impact of Pb on child intelligence quotient; in contrast, the effects in adults were often discussed only qualitatively (Bierkens et al. 2012; U.S. EPA 2008). Therefore, the HIM presented in this paper will allow for a more complete and concrete understanding of the potential impact of Pb exposure on public health, as demonstrated with a proof-of-concept example.
Methods
The process of developing our HIM involved defining our goal, identifying and evaluating the literature, and deriving the HIM. We then used the derived HIM in a proof-of-concept example, evaluating the impact that the reduction in blood Pb from 1999 to 2014 had on CVD mortality and the sensitivity of our model to the selected concentration–response function.
Step 1: Define the Goal
The first step in this process was to define the goal of the research. Subsequently, we stated the goal to be to develop a HIM to quantify the effect of changes in adult Pb exposure on CVD mortality in the United States.
Step 2: Identify the Universe of Studies Applicable to the Stated Goal
A large body of literature exists on the adverse health effects of Pb exposure. To develop our HIM we built on two comprehensive evaluations of the literature, the EPA’s Integrated Science Assessment for Lead (U.S. EPA 2013) and the NTP Monograph on Health Effects of Low-Level Lead (NTP 2012), hereafter referred to as the U.S. EPA ISA and the NTP Monograph, respectively. These two publications presented thorough weight-of-evidence evaluations of the literature on the adverse health effects associated with Pb exposure, including the relationship between Pb exposure in adults and CVD. All studies on the association between Pb and CVD mortality in humans cited in the U.S. EPA ISA and NTP Monograph were identified and advanced to Step 3.
We also conducted a supplemental search for our primary literature search using PubMed to identify studies published after the U.S. EPA ISA’s last literature search date (September 2011) through 14 May 2018. We used the following search string:
((lead[MeSH Terms] OR pb OR “bone lead” OR “tibia lead” OR “patella lead” OR “blood lead”) AND ((Cardiovascular Diseases[MeSH Terms] AND mortality) OR (cardiovascular disease mortality) OR (CVD mortality) OR (cardiovascular mortality)) AND (“2011/09/01”[Date - Publication]: “3,000”[Date - Publication]))
We determined the applicability of studies identified in the supplemental literature search by conducting title and abstract reviews. A study advanced to abstract screening if its title indicated that the study was conducted in humans, included an evaluation of Pb exposure, and researched adverse cardiovascular outcomes. If it was unclear whether the study had these attributes, we moved the paper on to abstract review.
The abstract review consisted of evaluating whether the paper assessed the association between Pb exposure and CVD mortality in adults. Given that the majority of the evidence relating Pb exposure to CVD mortality is based on blood as the biomarker and that the well-accepted pharmacokinetic models (e.g., Leggett 1993; U.S. EPA 1996) have limited capability to predict and validate bone Pb levels, we decided to concentrate on studies using blood Pb as the biomarker of exposure. Therefore, only papers with abstracts that mentioned blood Pb and had the aforementioned attributes were included in our universe of studies for full-text review. We evaluated each study in this database based on the set of a priori criteria described in Step 3.
Step 3: Identify Studies Most Pertinent for Deriving a Health Impact Model
To determine which of the studies identified in Step 2 were most useful for HIM development, we used the following criteria:
The study sample was representative of the general adult population or a large sector of the general adult population. Studies of patients with a particular disease, for example, do not represent a major portion of the population and would not be very useful for estimating the primary HIM.
The study reported average blood Pb levels as . These levels are more representative of the current blood Pb levels in the United States. We recognize that certain populations may still experience high exposures to Pb. However, given that the incremental impact of Pb may be higher at lower levels of exposure (Lanphear et al. 2018), we took a health-protective approach by focusing on blood Pb levels of and developing a function more applicable to current blood Pb levels.
The study was published in a peer-reviewed journal and available in English.
Step 4: Identify Studies with Continuous Concentration–Response Functions
A HIM needs to describe how a unit change in exposure relates to a unit change in outcome. Therefore, we preferred studies that presented continuous functions or for which the study authors (through personal communications) were able to provide us continuous functions.
Accordingly, studies we identified in Step 3 were split into two tiers:
Tier 1: The study presented a concentration–response function where Pb was a continuous variable or presented a result (e.g., a relative risk associated with a given change in blood Pb levels) based on an underlying concentration–response function between blood Pb as a continuous variable and CVD mortality risk. This type of study was deemed the most useful.
Tier 2: The study presented a categorical analysis, where comparisons of risk of CVD mortality were evaluated for different categories of blood Pb levels.
For all Tier-1 studies, we extracted data on the mean blood Pb levels, the size and age of the study population from which the concentration–response function was derived, and the inclusion of potential confounders. We used the concentration–response functions from each Tier-1 study in our HIM.
Step 5: Derive the Health Impact Model
Methods for deriving a HIM depend on the mathematical models used to develop the concentration–response functions of interest. Three of the four studies we identified as able to inform a HIM used Cox proportional hazards models to estimate the effects of Pb on CVD mortality risk. The exception was the study by Ruiz-Hernandez et al. (2017), which used a Poisson model with a similar log-linear relationship. Although the functional form of this Poisson model is slightly different than the Cox proportional hazards model used in the other studies, the final HIMs based on each model are equivalent. Under these models, the functional relationship between the CVD mortality hazard and blood Pb, assuming no changes in other covariates examined in the studies, can be described as follows:
| (1) |
where instantaneous is death hazard at time , instantaneous is the baseline death hazard at time , is blood Pb level, is the base of the log, and is the vector of covariates. and are estimated by the Cox proportional hazards model.
Further, the proportional hazards assumption implies that the cumulative death hazard over a period from time to time (e.g., a year) is related to the baseline cumulative death hazard as follows:
| (2) |
Finally, the probability of death during a period from time to time relates to the cumulative death hazard as follows:
| (3) |
We relied on the relationships in Equations 1, 2, and 3 to derive the HIM using the following steps:
Step 5a: We computed the central, upper bound, and lower bound estimate for from the reported hazard ratio (HR).
| (4) |
where , upper bound, or lower bound estimate of parameter ; and , upper bound, or lower bound estimate of the HR per x-fold increase in blood Pb.
Step 5b: We used estimates of and Equation 2 to express the cumulative death hazard at other blood Pb levels.
| (5) |
where explored blood Pb level (in micrograms per deciliter); death hazard corresponding to the explored blood Pb level; , or the cumulative death hazard at the blood Pb level of .
Step 5c: We then used the relationships from Equations 3 and 5 to approximate the relative risk associated with a change from blood Pb level to blood Pb level :
| (6) |
where of death at time at the baseline blood Pb level; of death at time at the altered blood Pb level.
Because is not generally known but can be assumed to be small, we use the first term of Maclaurin series expansion to further approximate :
| (7) |
It is at this point in the derivation where, although the Ruiz-Hernandez et al. (2017) function was not estimated using a Cox proportional hazards model, the resulting HIM for the Poisson estimated function converges to be the equivalent to that of the Cox estimated functions. This is because for both models, the time-varying term in the Cox model and the corresponding time-constant baseline incidence term in the Poisson model drop out of Equation 6 resulting, in both instances, in the above derived Equation 7.
Step 5d: Next, we used the relationship from Equation 7 to estimate the change in annual CVD deaths due to the change in blood Pb levels from to :
| (8) |
where reduction in number of CVD death cases (if ; for ) or annual increase in CVD death cases (if ; for ); CVD mortality rate at baseline blood Pb (i.e., ; CVD mortality rate at altered blood Pb (i.e., ; estimate derived from each paper; blood Pb level (in micrograms per deciliter) or altered hematocrit-corrected blood Pb level; blood Pb level (in micrograms per deciliter) or baseline hematocrit-corrected blood Pb level; and annual number of individuals to whom the change in blood Pb pertains. The final equation, Equation 8, is the HIM that allows us to use the data from the literature to estimate the impact a change in blood Pb has on risk of CVD mortality.
Step 6: Implement a Proof-of-Concept Example
To demonstrate the feasibility of using this HIM to estimate the number of cases associated with Pb exposure in adults, we estimated how many CVD-related mortalities were avoided in 2014 due to the reduction in population blood Pb levels that occurred between 1999 and 2014. The effect estimate (i.e., ) derived from each paper and log transformations used by each author are presented in Table 1.
Table 1.
Inputs to the HIM for Menke et al. (2006), Aoki et al. (2016), Ruiz-Hernandez et al. (2017), and Lanphear et al. (2018).
| Variable | Menke et al. 2006 | Aoki et al. 2016 | Ruiz-Hernandez et al. 2017 | Lanphear et al. 2018 | |
|---|---|---|---|---|---|
| All participants | Blood | ||||
| Log transformation () | Natural log | ||||
| Central beta () estimate | 0.35 | 0.36 | 0.17 | 0.64 | 0.96 |
| Lower estimate (based on lower bound of 95% CI for HR) | 0.16 | 0.05 | 0.07 | 0.32 | 0.54 |
| Upper estimate (based on upper bound of 95% CI for HR) | 0.54 | 0.68 | 0.27 | 0.97 | 1.37 |
Note: CI, confidence interval; HIM, health impact model; HR, hazard ratio.
We used NHANES data from 2013–2014 (CDC 2015, 2016a, 2016b) to approximate current blood Pb levels in the United States (i.e., ). We used NHANES 1999–2000 (CDC 2002a, 2002b, 2002c) data to estimate blood Pb levels from 15 y ago (i.e., . With these data we estimated median blood Pb levels using appropriate survey weights in Stata software (release 14; StataCorp). In one study (Aoki et al. 2016), the exposure metric was hematocrit-corrected blood Pb levels. Therefore, we mimicked the approach presented by Aoki et al. (2016) and previously presented by deSilva (1984) to estimate the hematocrit-corrected blood Pb levels in 1999 and 2014. That is, we calculated hematocrit-corrected blood Pb levels for each individual in the NHANES data sets using the following equation:
| (9) |
where hematocrit-corrected blood Pb level (in micrograms per deciliter); whole blood Pb level (in micrograms per deciliter); hematocrit level for the population (in percentage); and (in percentage). The blood Pb and hematocrit-corrected blood Pb levels used in our example are presented in Table 2.
Table 2.
Geometric mean blood Pb and hematocrit-corrected blood Pb levels by age group and sex in the United States.
| Geometric mean blood Pb level () | Hematocrit-corrected geometric mean blood Pb level () | ||||
|---|---|---|---|---|---|
| Age group (y) | Sex | 1999–2000 (SE) | 2013–2014 (SE) | 1999–2000 (SE) | 2013–2014 (SE) |
| 40–49 | Male | 2.37 (0.11) | 1.11 (0.06) | 2.22 (0.09) | 1.04 (0.06) |
| Female | 1.38 (0.06) | 0.77 (0.03) | 1.48 (0.06) | 0.82 (0.03) | |
| 50–59 | Male | 2.55 (0.12) | 1.33 (0.08) | 2.41 (0.11) | 1.28 (0.08) |
| Female | 1.76 (0.05) | 1.04 (0.04) | 1.85 (0.06) | 1.08 (0.04) | |
| 60–69 | Male | 2.80 (0.08) | 1.40 (0.12) | 2.67 (0.07) | 1.34 (0.12) |
| Female | 1.92 (0.10) | 1.24 (0.06) | 2.01 (0.11) | 1.29 (0.06) | |
| 70–80 | Male | 2.83 (0.11) | 1.72 (0.15) | 2.77 (0.11) | 1.70 (0.14) |
| Female | 2.04 (0.08) | 1.32 (0.06) | 2.16 (0.09) | 1.38 (0.07) | |
An understanding of CVD mortality rates in the 1999–2000 and 2013–2014 cohorts by age and sex is also required (i.e., , ). We obtained age group- and sex-specific annual CVD mortality rates at baseline (assumed to be 2014) from the CDC’s Wide-ranging Online Data for Epidemiologic Research (WONDER) database (CDC 2014). This information is reported in Table 3. Further, the number of individuals for which the example will be applied is needed (i.e., P). For this example we used the estimated number of U.S. individuals, by age and sex, in 2014. These values are presented in Table 4.
Table 3.
Age group and sex-specific CVD mortality rates (number of CVD-related deaths per year per total population in age group) in the United States.
| Age group (y) | Sex | CVD mortality incidence rate 1999 | CVD mortality incidence rate 2014 |
|---|---|---|---|
| 40–49 | Male | ||
| Female | |||
| 50–59 | Male | ||
| Female | |||
| 60–69 | Male | ||
| Female | |||
| 70–80 | Male | ||
| Female |
Source: CDC 2014. Note: CVD, cardiovascular disease (International Classification of Diseases Codes: I00–I99); HIM, health impact model.
Table 4.
The U.S. population size by age group and sex in 2014.
| Age group (y) | Sex | Population size |
|---|---|---|
| 40–49 | Male | 20,566,856 |
| Female | 20,912,669 | |
| 50–59 | Male | 21,521,569 |
| Female | 22,560,689 | |
| 60–69 | Male | 16,127,000 |
| Female | 17,764,398 | |
| 70–80 | Male | 9,151,537 |
| Female | 11,107,883 | |
| Total (40–80 y) | Male | 67,366,962 |
| Female | 72,345,639 | |
| Both | 139,712,601 |
Source: CDC 2014.
Using the derived HIM, and the data in Tables 2–4, we then determined how many CVD mortality cases were avoided for individuals 40–80 years of age due to their decreased Pb exposure, as represented by NHANES blood Pb or hematocrit-corrected blood Pb levels in 2014 compared with 1999. We conducted the analysis using the central estimates along with the upper and lower bound estimates, derived from the 95% confidence interval (CI) for from each Tier-1 study.
Using this information, we evaluated the proportion of the decrease in CVD mortality observed in 2014, as compared with 1999, that may be attributed to decreased blood Pb levels. To do so, we implemented an approach similar to that presented by Ford et al. (2007). Specifically, we implemented the following steps:
Step 6a: For each age and sex category (e.g., males 40–50 years of age), we used mortality rates from 1999 (Table 3) and population counts from 2014 (Table 4). Using these data, we calculated the number of deaths that would be expected in 2014 if the 1999 death rate were still true.
Step 6b: Next, we subtracted the number of deaths that actually occurred in 2014 from the number of deaths that would be expected if 1999 death rate were still true.
Step 6c: We then divided the difference calculated in step 6b by our predicted age- and sex-specific deaths due to lower blood Pb levels in 2014 compared with 1999. This proportion represents the contribution the difference in blood Pb had to the decline in the CVD mortality rate from 1999 to 2014.
Results
Literature Review and Study Selection
We identified eight unique studies (Cocco et al. 2007; Khalil et al. 2009; Lin et al. 2011; Lustberg and Silbergeld 2002; Menke et al. 2006; Neuberger et al. 2009; Schober et al. 2006; Weisskopf et al. 2009) in the government documents relating Pb exposure to CVD mortality (NTP 2012; U.S. EPA 2013). The supplemental literature search generated 139 additional unique titles for evaluation. We excluded 131 articles during title screening and one additional article during abstract screening. Ultimately, we identified 7 additional studies on Pb exposure and CVD mortality in adults (Aoki et al. 2016; Bertke et al. 2016; Lanphear et al. 2018; McElvenny et al. 2015; Ruiz-Hernandez et al. 2017; Wang et al. 2011; Weisskopf et al. 2015) for full-text review. The process of winnowing down studies from the universe of studies we identified through the government document review and supplemental literature search is summarized in Figure 1. In total we reviewed the full text of 15 articles, 8 from government documents and 7 from our supplemental literature review.
Figure 1.
![Figure 1 is a flow chart, having three steps, namely, Identify Universe of Studies, Identify Studies Most Pertinent for Health Impact Model, and Identify Studies with Continuous Concentration–Response Function. Step 1: Identify Universe of Studies: Database Searched: PubMed on 14 May 2018 Search String: ((lead [Medical Subject Headings Terms] OR Lead OR “bone lead” OR “tibia lead” OR “patella lead” OR “blood lead”) AND ((Cardiovascular Diseases [Medical Subject Headings Terms] AND mortality) OR (cardiovascular disease mortality) OR (Cardiovascular Diseases mortality) OR (cardiovascular mortality)) AND (“1 September 2011”[Date - Publication]: “3000” [Date - Publication])) (lowercase italic n equals 139) which excludes 131 titles, including Not conducted in humans, No evaluation of lead exposure, and No evaluation of cardiovascular outcomes and leads to Supplemental Literature Search Abstract Review (lowercase italic n equals 8), with 1 abstract removed under No evaluation of lead and cardiovascular disease mortality in adults leads to Unique Studies in Environmental Protection Agency Integrated Science Assessments and or National Toxicology Program Monograph (lowercase italic n equals 8) and Unique Studies from Supplemental Literature Search (lowercase italic n equals 7) leads to 15 Studies on Lead Exposure or Cardiovascular Diseases Mortality Data Identified. Step 2: Identify Studies Most Pertinent for Health Impact Model: 15 Studies on Lead Exposure or Cardiovascular Diseases Mortality Data Identified excludes 10 studies, including B L L greater than 5 micrograms per deciliter and Not Representative of General United States population leads to 5 studies included, namely, Menke and others (2006), Schober and others (2006), and Aoki and others (2006), Lanphear and others (2018), and Ruiz-Hernandez and others (2017). Step 3: Identify Studies with Continuous Concentration–response Function: 5 studies included, namely, Menke and others (2006), Schober and others (2006), and Aoki and others (2006), Lanphear and others (2018), and Ruiz-Hernandez and others (2017) excludes 1 Tier 2 study, namely, Schober and others (2006), then leads to 4 Tier 1 Studies, namely, Menke and others (2006), Aoki and others (2016), Ruiz-Hernandez and others (2017), and Lanphear and others (2018).](https://cdn.ncbi.nlm.nih.gov/pmc/blobs/635a/7510336/3e03575f32dc/ehp6552_f1.jpg)
Overview of process to identify the most useful studies for developing a health impact model. Note: BLL, blood lead level; CVD, cardiovascular disease; EPA, Environmental Protection Agency; HIM, health impact model; ISA, Integrated Science Assessment; NTP, National Toxicology Program; Pb, lead.
Ten of the 15 papers were excluded after full-text review, because the mean blood Pb levels were greater than or the populations assessed were not representative of the general U.S. population. A description of how each study compares to the criteria put forward in Step 3 of the “Methods” section is presented in Table S1.
Ultimately, four papers met all of our criteria for HIM consideration (Aoki et al. 2016; Lanphear et al. 2005; Menke et al. 2006; Ruiz-Hernandez et al. 2017). Schober et al. (2006), which we deemed a Tier-2 study, was very similar to Menke et al. (2006) and Lanphear et al. (2018) in that it used the same NHANES III (1988–1994) data set. However, the study presented a categorical analysis where comparisons of risk of CVD mortality were evaluated for different categories of blood Pb levels. Although a figure for a spline model was presented in the paper, regression statistics for the continuous function were not available in the study by Schober et al. (2006), nor were they available through personal communication. Therefore, we excluded this paper from further consideration by categorizing it as Tier 2.
Table 5 presents a comparison of key attributes of each of the four remaining papers. All of these studies were large, population-based studies that analyzed NHANES data and used the National Death Index database to identify cases of CVD mortality. The NHANES is based on a nationally representative sample of individuals throughout the United States and uses a rigorous methodology that includes trained interviewers, standardized procedures, and quality control measures. Another advantage of the use of NHANES data is the availability of detailed information on potential confounders. However, the possibility of residual confounding remains, and each study examined a slightly different set of potential confounders. The National Death Index is a comprehensive source for death records in the United States. Given that all of the studies used this source, the potential for misclassification of CVD mortality cases is similar for each study.
Table 5.
Attributes of four studies evaluated for use with the HIM.
| Attribute of interest | Menke et al. 2006 | Aoki et al. 2016 | Ruiz-Hernandez et al. 2017 | Lanphear et al. 2018 |
|---|---|---|---|---|
| Data set | NHANES III | NHANES 1999–2010 | NHANES III and NHANES 1999–2004 | NHANES III |
| Year of blood Pb collection | 1988–1994 | 1999–2010 | 1988–1994 and 1999–2004 | 1988–1994 |
| Sample size and population | adults of age with blood | adults of age with no cutoff for blood Pb level | adults of age with no cutoff for blood Pb level | All participants: adults of age with no cutoff for blood Pb level Participants with blood only: adults of age |
| Number of CVD-related deaths | 766 | 985 | 890 | All participants: 1,801 Participants with blood only: not reported |
| Geometric mean Pb (SE) | 2.58 (SE not given) | 1.73 (0.02) | NHANES III: 3.2 (SE not given) NHANES 1999–2004: 1.9 (SE not given) |
All participants: 2.71 (0.131) Blood only: not reported |
| Participant age: arithmetic mean (SE) | 44.4 (0.5) | 57.5 (0.2) | Not given | All participants: 44.1 (not reported) Blood only: not reported |
| Pb biomarker | Whole blood Pb | Hematocrit-corrected blood Pb | Whole blood Pb | Whole blood Pb |
| Confounders considered in key analysis | Age, race/ethnicity, sex, smoking status, education, alcohol consumption, CRP, physical activity, low income, total cholesterol, urban residence, postmenopausal status, hypertension, level of kidney function, diabetes mellitus, body mass index | Race, Hispanic origin, sex, smoking status, education, alcohol intake, CRP, blood cadmium, serum iron, serum calcium | Age, sex, race, smoking status, physical inactivity, obesity, hypertension, diabetes, high total cholesterol, low HDL cholesterol, lipid-lowering medication and survey period, log-transformed cadmium | All models are adjusted for age, sex, household income, ethnic origin, body mass index, smoking status, hypertension, urinary cadmium, alcohol consumption, physical activity in previous month, healthy eating index, serum cholesterol, and glycated hemoglobin |
| ICD codes for CVD | ICD-9 codes: 390–434, 436-459; ICD-10 codes: I00–I99 | ICD-10 codes: I00–I99 | ICD-10 codes: I00–I78 | ICD-9 codes: 390–459; ICD-10 codes: I00–I99 |
| Limits of detection | NHANES III: NHANES 1999–2004: | |||
| Maximum length of follow-up | 13 y | 13 y | 8–9 y | 24 y |
| Dates of follow-up | Through 31 December 2000 | Through 31 December 2011 | NHANES III: through 31 December 1996 NHANES 1999–2004: through 31 December 2006 |
Through 31 December 2011 |
Source: Menke A, personal communication. Note: CRP, C-reactive protein; CVD, cardiovascular disease; HDL, high-density lipoprotein; HIM, health impact model; ICD, International Classification of Diseases; NHANES, National Health and Nutrition Examination Survey; Pb, lead; SE, standard error.
Menke et al. (2006) and Lanphear et al. (2018) both analyzed data from NHANES III. In this cycle of the NHANES, blood Pb was measured during the years 1988–1994. Thus, blood Pb levels of participants were higher than would be expected given current exposures to Pb. The current mean blood Pb level in U.S. adults is approximately , based on adults 40–80 years of age in NHANES 2013–2016. The mean blood Pb levels in the Menke et al. (2006) and Lanphear et al. (2018) studies were 2.58 and , respectively. The two remaining potential studies for selection, Aoki et al. (2016) and Ruiz-Hernandez et al. (2017), both included more recent NHANES data (1999–2010 and 1999–2004, respectively). Ruiz-Hernandez et al. (2017) analyzed participants from both NHANES III and NHANES 1999–2004, with mean blood Pb levels in each cohort of 3.2 and , respectively. Aoki et al. (2016) examined the lowest blood Pb levels, with a mean blood Pb level of .
In addition to using the same NHANES cohort, the Menke et al. (2006) and Lanphear et al. (2018) papers presented similar analyses. However, the Lanphear et al. (2018) study has several advantages over the study by Menke et al. (2006). First, because it is more recent, the study by Lanphear et al. (2018) had the benefit of an additional 11 y of follow-up of participants in the National Death Index and included a larger number of deaths in the analysis. In addition, the Lanphear et al. (2018) study had more extensive control for confounders. For example, Lanphear et al. (2018) controlled for co-exposures to cadmium, which has also been associated with increases in CVD mortality. Although the study by Lanphear et al. (2018) is stronger than the one by Menke et al. (2006) for the aforementioned reasons, we opted to include both studies for comparison purposes. In addition to their analysis of all participants, Lanphear et al. (2018) presented an HR based on participants with blood Pb levels only. Because these blood Pb levels are more in line with current levels of Pb exposures, we included an estimate in the HIM based on the parameters from this secondary analysis as well.
Aoki et al. (2016) included careful consideration of non-Pb biomarkers, as well as measurement error in blood Pb. The study by Aoki et al. (2016) was the only one to consider the effects of Pb on red blood cell concentration by correcting results for hematocrit levels. The majority of blood Pb is contained in the red blood cells, and there is evidence that Pb exposure may cause decreased red blood cell numbers (Ukaejiofo et al. 2009; Zentner et al. 2008). Therefore, if Pb in blood is decreasing the amount of red blood cells present in an individual, Aoki et al. (2016) argued that a correction should be used to standardize the volume of blood Pb per unit of hematocrit and thereby avoid bias due to exposure measurement errors. To do so, the authors divided whole blood Pb by the hematocrit concentration collected for each individual in NHANES. The corrected variable was multiplied by the weighted arithmetic mean of hematocrit in the analytic sample. Because the study by Aoki et al. (2016) presented numerous regression models, we had to select the most appropriate analyses from which to develop a concentration–response function. Based on an analysis of the most appropriate confounders to include in a final model, Aoki et al. (2016) concluded that their fully adjusted model, which included adjustment for various demographic indicators, cadmium, and serum iron, was the most reliable. Based on this assessment, we selected the fully adjusted model, which corrected for hematocrit levels, for use in our HIM.
The final study identified in our search was the one by Ruiz-Hernandez et al. (2017). This paper used a combination of older (NHANES III) and more recent (1999–2004) NHANES data. Although the overall blood Pb level in the study was not stated, the blood Pb levels in participants from the 1999–2004 cohort () were similar to current levels in U.S. adults. The study also had extensive control of confounders, including traditional risk factors for cardiovascular disease and co-exposures to cadmium. Although several analyses were presented in this study demonstrating the impact of blood Pb on CVD mortality, we focused on the Poisson model described in the supplemental material of the study by Ruiz-Hernandez et al. (2017), which related blood Pb concentration with cardiovascular disease mortality. This model is the most similar to the analysis presented in the other studies.
Given that the true functional model relating Pb exposure to CVD mortality remains unknown, we opted to use our derived HIM with the concentration–response functions from each of these papers instead of preferentially selecting one study. We considered conducting a meta-analysis but determined it was not feasible. This is because, as shown in Figure 2, the identified papers have overlapping data sets, and therefore the effect estimates are not completely independent of each other. Because the Ruiz-Hernandez et al. (2017) analysis sample partially overlaps with the analysis samples from each of the other three studies, it precludes the use of existing peer-reviewed meta-analysis methods for dependent effect measures because the data can only be clustered into one singular population cluster. Therefore, we used the concentration–response functions in our HIM for each of these four studies as opposed to conducting a meta-analysis with the effect measures.
Figure 2.
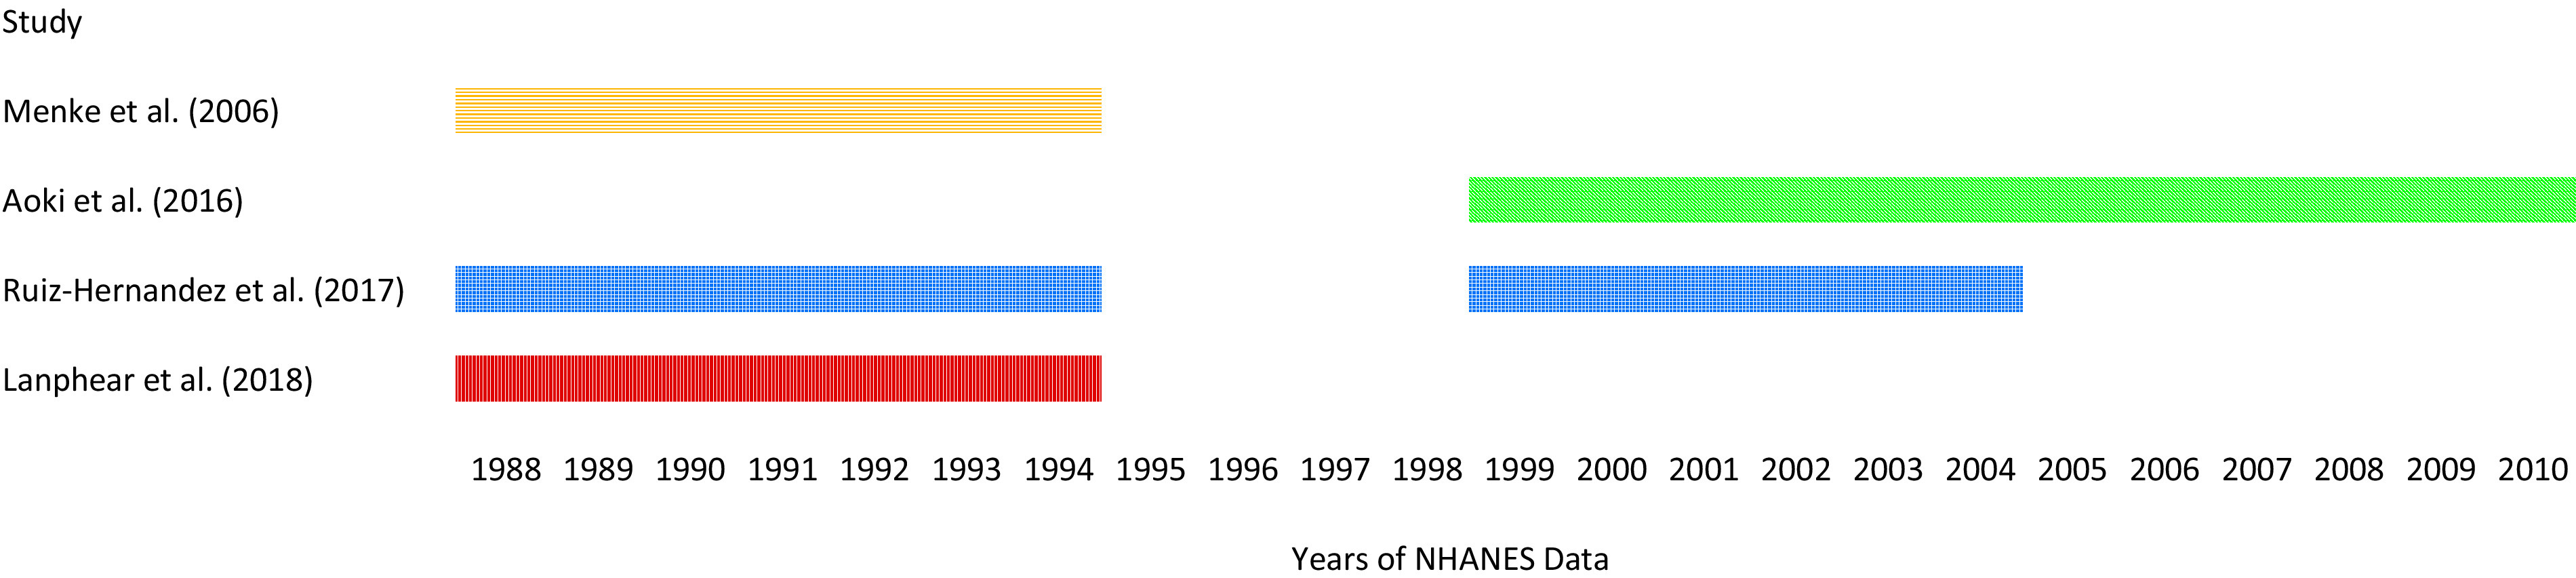
Years of NHANES data included in each study identified for use in the HIM. Note: NHANES, National Health and Nutrition Examination Survey.
Figure 3 displays the increased risk of CVD mortality per increase in blood Pb (or hematocrit-corrected blood Pb), as estimated from all four studies [and from both functions presented by Lanphear et al. (2018)]. Because each study used different log transformations in its analyses, we standardized the estimates to develop Figure 3 and thereby allow for direct comparison of the studies.
Figure 3.
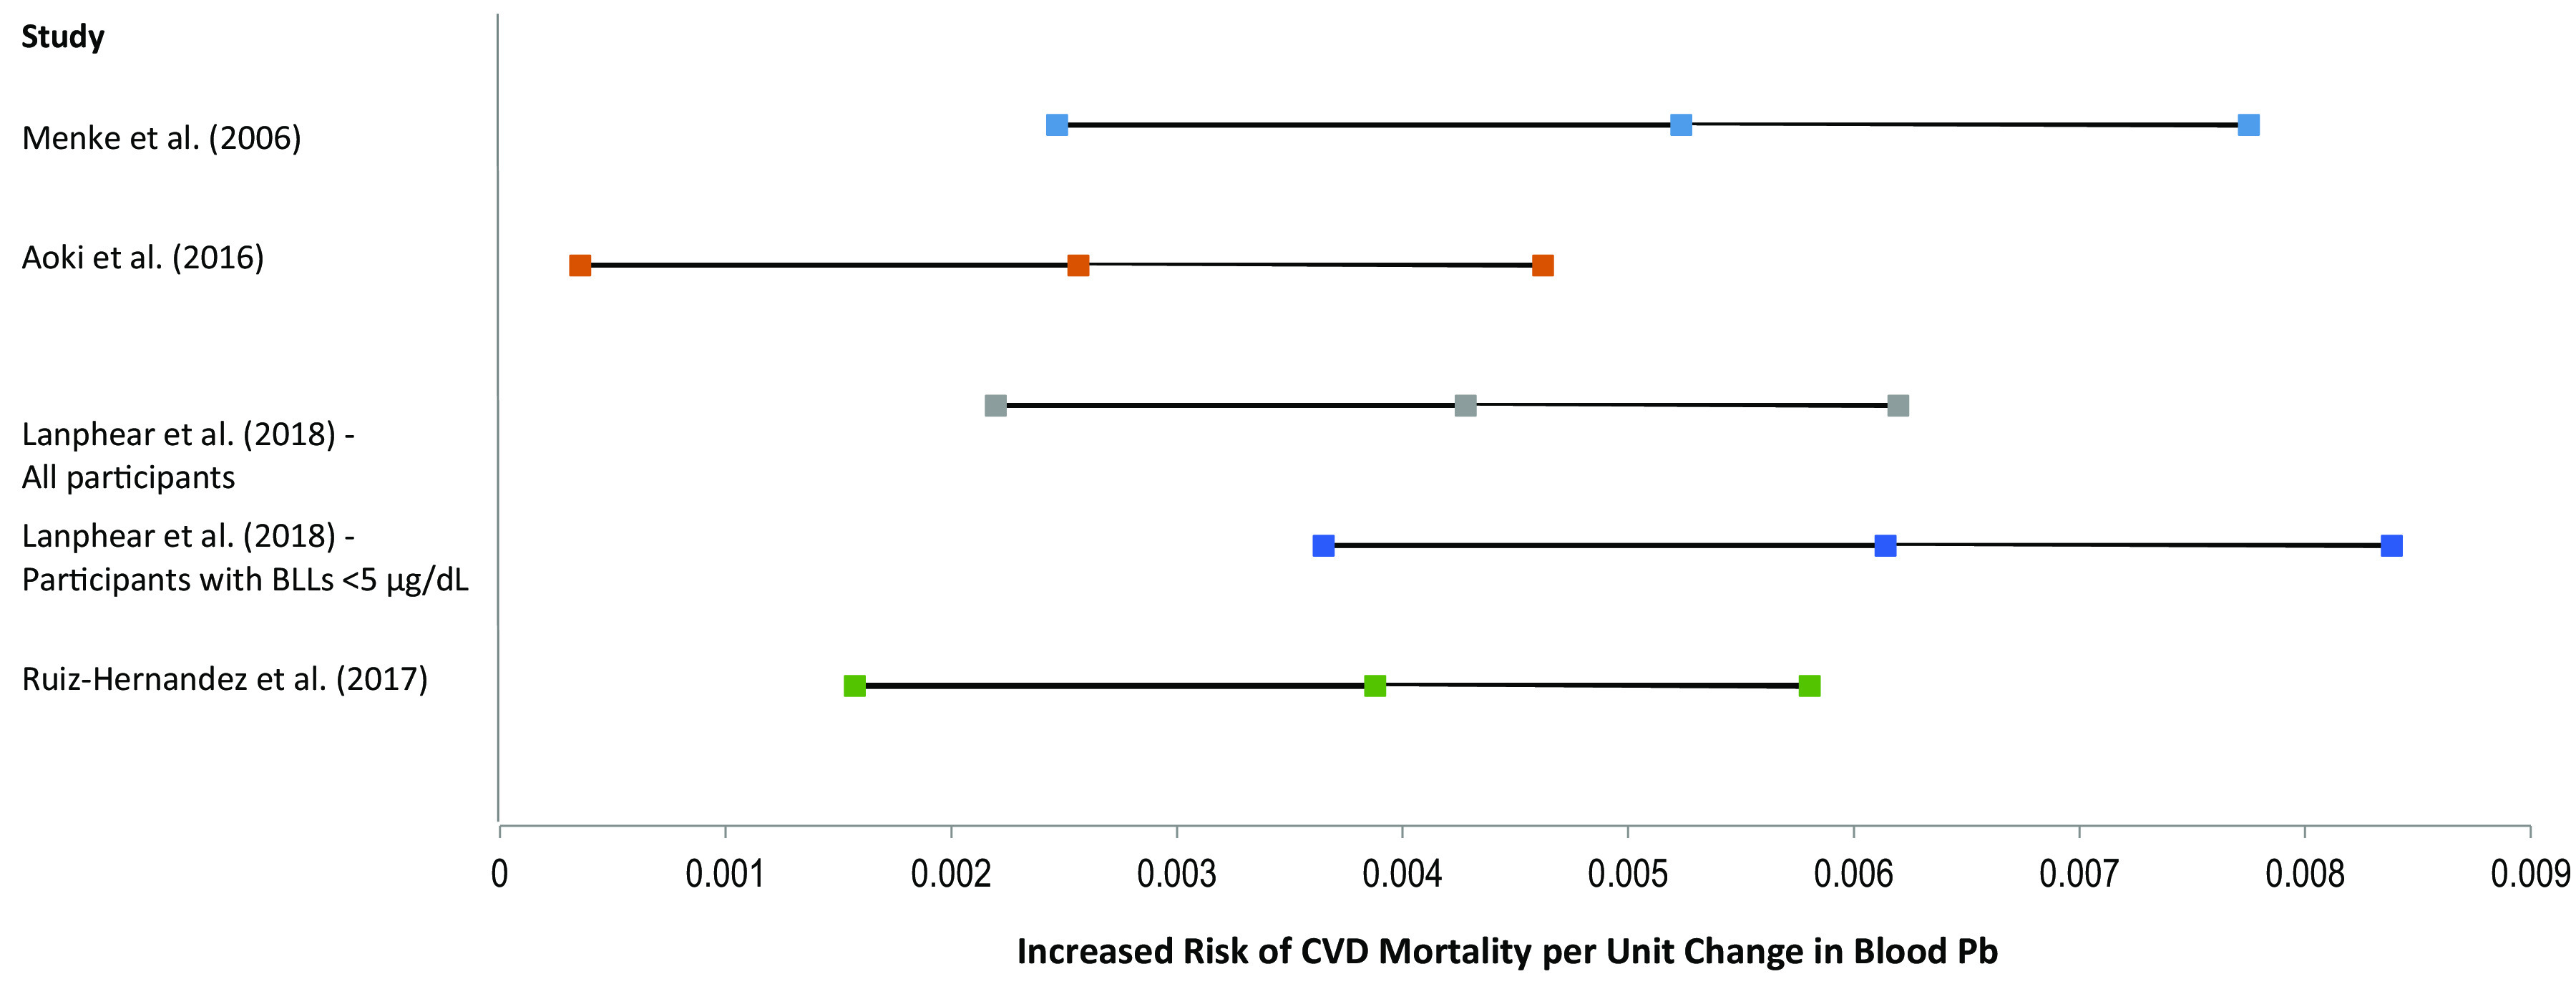
Increased risk of CVD mortality (central estimate and 95% CI) per unit change in blood Pb (Menke et al. 2006; Lanphear et al. 2018; Ruiz-Hernandez et al. 2017) or hematocrit-corrected blood Pb (Aoki et al. 2016). Note: CI, confidence interval; CVD, cardiovascular disease; Pb, lead.
Proof-of-Concept Examples
As described in Step 6 of the “Methods” section, we used Equation 8 to estimate the reduction in CVD mortality based on the change in population-level blood Pb levels from 1999 to 2014 using NHANES data. Tables 6–10 present the estimated number of CVD-related deaths per 10-y age group that were avoided in 2014 due to decreases in blood Pb levels from 1999 levels based on the concentration response function(s) from each study identified for use in the HIM.
Table 6.
Estimated CVD mortality cases avoided based on the change in blood Pb levels from 1999 to 2014 using Menke et al. (2006) inputs in the HIM.
| Age group | Sex | Avoided CVD deaths in 2014 | ||
|---|---|---|---|---|
| Lower estimatea | Central estimate | Higher estimatea | ||
| 40–49 | Male | 1,948 | 4,915 | 8,183 |
| Female | 721 | 1,787 | 2,921 | |
| 50–59 | Male | 4,825 | 12,037 | 19,815 |
| Female | 1,801 | 4,434 | 7,205 | |
| 60–69 | Male | 8,125 | 20,360 | 33,664 |
| Female | 2,662 | 6,494 | 10,459 | |
| 70–80 | Male | 7,666 | 18,821 | 30,498 |
| Female | 5,060 | 12,342 | 19,872 | |
| Total (40–80 y) | Male | 22,564 | 56,133 | 92,159 |
| Female | 10,244 | 25,056 | 40,456 | |
| Both | 32,808 | 81,189 | 132,616 | |
Note: CVD, cardiovascular disease; HIM, health impact model; Pb, lead.
Low and high estimates based on the lower and upper bound effect estimates from the Menke et al. (2006) 95% confidence interval.
Table 10.
Estimated CVD mortality cases avoided based on the change in blood Pb levels from 1999 to 2014 using Lanphear et al. (2018), blood Pb , inputs in the HIM.
| Age group | Sex | Avoided CVD deaths in 2014 | ||
|---|---|---|---|---|
| Lower estimatea | Central estimate | Higher estimatea | ||
| 40–49 | Male | 3,147 | 6,013 | 9,219 |
| Female | 1,156 | 2,172 | 3,273 | |
| 50–59 | Male | 7,759 | 14,667 | 22,251 |
| Female | 2,880 | 5,378 | 8,060 | |
| 60–69 | Male | 13,089 | 24,848 | 37,853 |
| Female | 4,241 | 7,853 | 11,669 | |
| 70–80 | Male | 12,245 | 22,808 | 34,088 |
| Female | 8,060 | 14,923 | 22,170 | |
| Total (40–80 y) | Male | 36,240 | 68,336 | 103,411 |
| Female | 16,337 | 30,327 | 45,172 | |
| Both | 52,577 | 98,663 | 148,583 | |
Note: CVD, cardiovascular disease; HIM, health impact model; Pb, lead.
Low and high estimates based on the lower and upper bound effect estimates from the Lanphear et al. (2018) 95% confidence interval.
Table 7.
Estimated CVD mortality cases avoided based on the change in blood Pb levels from 1999 to 2014 using Aoki et al. (2016) inputs in the HIM.
| Age group (y) | Sex | Avoided CVD deaths in 2014 | ||
|---|---|---|---|---|
| Lower estimatea | Central estimate | Higher estimatea | ||
| 40–49 | Male | 268 | 2,035 | 4,057 |
| Female | 102 | 763 | 1,502 | |
| 50–59 | Male | 651 | 4,892 | 9,666 |
| Female | 258 | 1,925 | 3,778 | |
| 60–69 | Male | 1,118 | 8,440 | 16,744 |
| Female | 380 | 2,820 | 5,496 | |
| 70–80 | Male | 1,054 | 7,841 | 15,331 |
| Female | 733 | 5,441 | 10,608 | |
| Total (40–80 y) | Male | 3,091 | 23,207 | 45,799 |
| Female | 1,473 | 10,949 | 21,385 | |
| Both | 4,564 | 34,156 | 67,184 | |
Note: CVD, cardiovascular disease (International Classification of Diseases codes: I00–I99); HIM, health impact model; Pb, lead.
Low and high estimates based on the lower and upper bound effect estimates from the Aoki et al. (2016) 95% confidence interval.
Table 8.
Estimated CVD mortality cases avoided based on the change in blood Pb levels from 1999 to 2014 using Ruiz-Hernandez et al. (2017) inputs in the HIM.
| Age group | Sex | Avoided CVD deaths in 2014 | ||
|---|---|---|---|---|
| Lower estimatea | Central estimate | Higher estimatea | ||
| 40–49 | Male | 1,287 | 3,305 | 5,556 |
| Female | 479 | 1,213 | 2,012 | |
| 50–59 | Male | 3,196 | 8,143 | 13,577 |
| Female | 1,197 | 3,020 | 4,988 | |
| 60–69 | Male | 5,377 | 13,741 | 22,985 |
| Female | 1,773 | 4,446 | 7,292 | |
| 70–80 | Male | 5,098 | 12,841 | 21,160 |
| Female | 3,370 | 8,449 | 13,857 | |
| Total (40–80 y) | Male | 14,958 | 38,030 | 63,278 |
| Female | 6,818 | 17,128 | 28,150 | |
| Both | 21,777 | 55,158 | 91,428 | |
Note: CVD, cardiovascular disease; HIM, health impact model; Pb, lead.
Low and high estimates based on the lower and upper bound effect estimates from the Ruiz-Hernandez et al. (2017) 95% confidence interval.
Table 9.
Estimated CVD mortality cases avoided based on the change in blood Pb levels from 1999 to 2014 using Lanphear et al. (2018), all blood Pb levels, inputs in the HIM.
| Age group | Sex | Avoided CVD deaths in 2014 | ||
|---|---|---|---|---|
| Lower estimatea | Central estimate | Higher estimatea | ||
| 40–49 | Male | 1,797 | 3,794 | 6,086 |
| Female | 666 | 1,388 | 2,197 | |
| 50–59 | Male | 4,454 | 9,330 | 14,842 |
| Female | 1,663 | 3,453 | 5,441 | |
| 60–69 | Male | 7,499 | 15,756 | 25,146 |
| Female | 2,460 | 5,075 | 7,943 | |
| 70–80 | Male | 7,083 | 14,674 | 23,072 |
| Female | 4,677 | 9,645 | 15,094 | |
| Total (40–80 y) | Male | 20,833 | 43,553 | 69,145 |
| Female | 9,467 | 19,562 | 30,674 | |
| Both | 30,300 | 63,115 | 99,820 | |
Note: CVD, cardiovascular disease; HIM, health impact model; Pb, lead.
Low and high estimates based on the lower and upper bound effect estimates from the Lanphear et al. (2018) 95% confidence interval.
Table 11 summarizes the total avoided deaths in 2014 according to the central effect estimates from each study. Based on these results, the number of CVD mortality cases estimated as being avoided due to decreased blood Pb levels ranged from approximately 34,000 to 99,000 deaths with the variation attributable to the concentration–response function used. Aoki et al. (2016) predicted the smallest number of avoided deaths, whereas Lanphear et al. (2018; blood Pb analysis) predicted the greatest. Males had the greatest number of estimated avoided deaths due to higher background CVD mortality rates in men.
Table 11.
Total avoided CVD-related deaths based on our HIM and concentration–response functions from each Tier-1 study, using central effect estimates.
| Population 40–80 years of age | Aoki et al. 2016 | Menke et al. 2006 | Ruiz-Hernandez et al. 2017 | Lanphear et al. 2018 (all blood Pb levels) | Lanphear et al. 2018 () |
|---|---|---|---|---|---|
| Male | 23,207 | 56,133 | 38,030 | 43,553 | 68,336 |
| Female | 10,949 | 25,056 | 17,128 | 19,562 | 30,327 |
| Total | 34,156 | 81,189 | 55,158 | 63,115 | 98,663 |
Note: CVD, cardiovascular disease; HIM, health impact model; Pb, lead.
Table 12 presents estimates of the proportion of decreased CVD mortality attributable to decreases in blood Pb levels from 1999 to 2014. Using the central effect estimates from each of the papers, we estimated that 16% (Aoki et al. 2016) to 46% (Lanphear et al. 2018) (blood Pb analysis) of the decreased CVD mortality rate could be attributed to decreased Pb exposure.
Table 12.
Proportion (%) of avoided CVD-related deaths in 2014 due to the change in blood Pb since 1999 based on our HIM and concentration–response functions from each Tier-1 study using central effect estimates.
| Population 40–80 years of age | Aoki et al. 2016 | Menke et al. 2006 | Ruiz-Hernandez et al. 2017 | Lanphear et al. 2018 (all blood Pb levels) | Lanphear et al. 2018 () |
|---|---|---|---|---|---|
| Male | 20 | 48 | 32 | 37 | 58 |
| Female | 11 | 25 | 17 | 20 | 31 |
| Total | 16 | 38 | 26 | 29 | 46 |
Note: CVD, cardiovascular disease; HIM, health impact model; Pb, lead.
Discussion
Taking a methodological approach to evaluating the literature, we derived a HIM and employed five concentration–response functions to estimate ranges of expected changes in CVD mortality. This HIM could be used to estimate a reduction in CVD mortality resulting from a regulation, evaluate the potential effectiveness of an intervention, or conduct a burden-of-disease estimate. In our CVD mortality analysis, we used the concentration–response data from Menke et al. (2006), Aoki et al. (2016), Ruiz-Hernandez et al. (2017), and Lanphear et al. (2018) in our HIM. Each of these studies evaluated the relationship between adult Pb exposure and CVD mortality in more than 10,000 individuals living in the United States.
Our results show clear variation in the estimated effect of blood Pb on CVD mortality derived from each study, which may be due to differences in the study designs. Table 5 shows that these differences include the confounders examined in each analysis, the composition of the population assessed, the International Classification of Diseases (ICD) codes used to indicate CVD-related mortality, and the length of follow-up. In addition, it is interesting to observe that the function for blood Pb levels from Lanphear et al. (2018) has the largest effect estimate of all the studies. This observation could be partially due to the inherently steeper slope of the modeled log-linear relationship between blood Pb and CVD mortality at baseline blood Pb levels closer to zero. As described by Lanphear et al. (2018), their results indicate that the risk of CVD mortality increases with higher amount of Pb in the blood, but at a diminished rate as blood Pb levels increase.
Analyses associated with the HIM should reflect the exposure window that is most relevant to the risk outcome. We hypothesize that four major conceptual models may explain the temporal relationship between blood Pb and CVD mortality:
However, when considering the relationship between adult Pb exposure and CVD mortality, it is uncertain which conceptual model is best. The majority of the studies we located through our work were based on a single biomarker (i.e., blood lead) measurement per study subject. Only Weisskopf et al. (2009, 2015) evaluated the relationship of both bone and blood Pb to CVD mortality. No studies used repeated measures of the biomarkers in evaluating the connection between blood Pb and CVD. This resulted in uncertainty because blood Pb is reflective of both recent exposures () from exogenous sources and past exposures (years to decades) that were stored in tissues (e.g., bone) and released endogenously (NTP 2012; U.S. EPA 2013). Therefore, uncertainties remain with respect to the timing, frequency, and magnitude of Pb exposure that best correlate with CVD mortality risk. Given that all of the concentration–response functions used in the HIM in this analysis are based on NHANES, it is clear that data from additional lines of evidence would contribute substantially to understanding the true impact of Pb on CVD mortality. It would be useful, for example, if an organization such as the National Heart, Lung, and Blood Institute created or released subclinical or clinical CVD data combined with blood Pb measurements to further inform the science on the relationship between Pb exposure and CVD mortality.
Regardless, given the consistent finding across the literature, it can be concluded that the one-time measurement from NHANES is a predictor of CVD mortality, either because Model 1 is true or because it is a proxy measure due to its correlation with average blood Pb models over time (e.g., Model 2). Currently, Model 1 is the only model for which requisite data are available given that there are no studies, or data sources such as NHANES, published to date evaluating multiple blood Pb measurements in the same individual in association with CVD mortality. We infer this because all the evaluated studies used only a one-time blood Pb measurement to model the impact of Pb on CVD mortality risk, within a specified follow-up time frame. Although there is a lag between the blood Pb sample and death due to CVD mortality, both the Cox proportional hazards model and the Poisson regression analysis assume that the HR will be the same regardless of the follow-up time frame. Therefore, the result is interpreted as CVD mortality risk being a function of the one-time blood Pb measurement.
The conceptual models described above do not explicitly consider whether a correction for blood Pb measurements is warranted. Aoki et al. (2016) used hematocrit-corrected blood Pb levels to describe the relationship between blood Pb and CVD mortality. Using a hematocrit correction (i.e., dividing blood Pb by hematocrit) in exploring the effect of blood Pb on CVD differs from much of the literature, which instead adjusts for hematocrit (i.e., includes hematocrit as a confounder in a regression analysis) (Hara et al. 2015; Hicken et al. 2012, 2013; Scinicariello et al. 2011). However, in considering the relationship between Pb exposure, blood Pb, hematocrit, and CVD mortality, Aoki et al. (2016) assumed that the biomarker of whole blood Pb is a proxy for Pb exposure at the heart or vasculature, which would be more directly involved in Pb’s effect on CVD morbidity/mortality. This is contrary to assuming that whole blood Pb is a key component in the causal pathway relating Pb exposure to CVD morbidity/mortality. By treating whole blood Pb as a proxy for Pb exposure, hematocrit is an intermediate variable in the pathway between Pb exposure and CVD morbidity/mortality given that hematocrit levels do not have an effect on Pb exposure itself. Thus, correcting for hematocrit may be a more appropriate approach than adjusting for hematocrit. Further debate and research on the role of hematocrit correction in understanding the health effects of Pb exposure is needed to determine the extent to which using whole blood as the proxy for Pb exposure may cause measurement error.
Additional conceptual models could be developed to relate alternate biomarkers, specifically bone Pb, to CVD mortality. Pb in bone has a longer half-life compared with Pb in blood (Hu et al. 2007) and therefore may be a better marker of exposure for diseases that are impacted by longer-term Pb exposure. However, there are few studies that use bone Pb data. Weisskopf et al. (2009, 2015) were the only identified studies that presented an evaluation between bone Pb and CVD mortality. In addition to the scarcity of studies relating bone Pb to CVD mortality, there are still uncertainties related to modeling bone Pb levels with available physiologically based pharmacokinetic models. Although predictive models have been developed using blood Pb and other demographic factors to estimate bone Pb levels (Park et al. 2009), these models require data including job type, smoking status, and cumulative cigarette data, which may not be available for all individuals for whom an analysis using our HIM is conducted. Therefore, a HIM based on bone Pb may have limited use at this time. For this reason, we have concentrated our efforts on the relationship between blood Pb and CVD mortality in this paper.
Pb levels have changed over time, so there is some uncertainty regarding whether the observed associations between Pb and CVD are applicable to current cohorts of individuals. Individuals examined in the evaluated studies may have had a higher exposure profile in childhood and early adulthood than those born in recent years. However, these higher exposures will likely be reflected in higher blood Pb levels in their NHANES blood Pb samples given that blood and bone Pb levels are correlated (Hu et al. 2007). We do not know what their blood Pb levels were many years ago, but we do know based on NHANES data that, on average, older adults have higher blood Pb levels than younger adults (Tsoi et al. 2016).
Moreover, when comparing the more recent NHANES data (Lanphear et al. 2018; Ruiz-Hernandez et al. 2017) to data on older cohorts, studies have found that associations between Pb and CVD mortality have either remained constant or increased in magnitude. For example, Ruiz-Hernandez et al. (2017) examined the associations between blood Pb and CVD mortality in two cohorts of NHANES: 1988–1994 and 1999–2004. The mean blood Pb levels in these cohorts were 3.2 and , respectively. The rate ratios for CVD mortality associated with a 2-fold increase in blood Pb were 1.17 (95% CI: 1.04, 1.31) in NHANES 1988–1994 and 1.26 (95% CI: 1.05, 1.50) in NHANES 1999–2004. When comparing results obtained for the two cohorts, the authors found no significant differences in the relationship between blood Pb and CVD mortality (). Lanphear et al. (2018) examined differences between the two phases of the NHANES III cohort. The authors found a steeper relationship (i.e., a greater increment of CVD mortality risk per increment of blood Pb) in participants who were studied during NHANES III phase 2 (1991–1994) than phase 1 (1988–1991). In addition, when Lanphear et al. (2018) investigated associations in all participants and in those with blood only, the observed HRs were higher in the subset of participants with the lowest blood Pb. Therefore, use of an observed concentration–response function based on older NHANES cohorts with higher blood Pb levels may underestimate the association between Pb and CVD mortality, if the steeper slope is reflective of the true risk in today’s population.
Despite the uncertainties, several lines of evidence suggest that it is appropriate to model the relationship between Pb and CVD mortality based on the available literature. Numerous studies examining different NHANES cohorts have found significant associations between blood Pb and CVD mortality (Aoki et al. 2016; Khalil et al. 2009; Lanphear et al. 2018; Menke et al. 2006; Ruiz-Hernandez et al. 2017; Schober et al. 2006; Weisskopf et al. 2015). The range of blood Pb levels in these studies overlap with current blood Pb levels. Therefore, the concentration–response functions from these studies can be used on populations with current blood Pb levels. Specifically, mean blood Pb levels in the studies available to inform the HIM ranged from 1.73 to . Although the blood Pb levels in these studies are higher than the average blood Pb level for adults 40–80 years of age in NHANES 2013–2016, which was approximately , they are within a reasonable range of today’s blood Pb levels. In addition, the studies included individuals with blood Pb levels that overlap with the 2013–2016 NHANES mean levels (Table 5).
To generate the proof-of-concept example, we used average values for most input parameters (e.g., background mortality rates, population estimates) of our HIM. These results are applicable to the U.S. population on average. Approaches such as a full Monte Carlo analysis could be taken to incorporate uncertainty or variability in many of the input parameters. These approaches may better reflect uncertainty surrounding our estimates and are potential next steps to fully understanding the relationship between Pb and CVD mortality. Selecting one concentration–response function, rather than the range of results presented, to describe the relationship between blood Pb and CVD mortality may allow for easier and more efficient implementation of the HIM or communication of the results. We did explore the feasibility of conducting a meta-analysis on the data from these studies. As discussed in the results, there was only one population cluster given the overlapping data sets used. Therefore, we determined that a meta-analysis was not appropriate for the current body of literature. The current analysis displays the sensitivity of the HIM to the selection of the concentration–response function.
Collectively, the literature supports the hypothesis that there is not an identifiable population threshold for Pb and the outcome of CVD mortality and that the association between blood Pb and CVD mortality is expected to hold in cohorts with declining blood Pb levels. Given the amount of available evidence, it is therefore now feasible to estimate both the health and monetary benefits of the reduced risk of CVD mortality due to lower blood Pb. Preventing additional exposure at all ages is essential for protecting public health because it will reduce not only current risk but also risk later in life. This is because reductions in young adulthood will reduce both current blood Pb levels and the amount of Pb stored in bone, which can be mobilized later in life and therefore present a future risk of CVD mortality in addition to the current risk.
Conclusion
The HIM we developed allows for a standardized methodology that is useful for estimating the avoided cases of CVD mortality when evaluating specified changes in Pb exposure as measured by blood Pb. Using this model, we demonstrated that decreases in Pb exposure can result in large benefits for the adult population. The HIM presented in this paper made evident that, regardless of concentration–response function selected, the impact of Pb on CVD mortality is substantial. We found that historical reductions in Pb during 1999–2000 and 2013–2014 could explain approximately 16%–46% of the decline in CVD mortality rates observed in this time period.
Given the absence of a well-established quantitative approach for evaluating the impact of Pb exposure in adults, the HIM presented in this paper, along with the selected concentration–response functions, can strengthen regulatory impact assessments and burden-of-disease estimates. This is because using this HIM will allow for a more complete characterization of the impacts of Pb exposure and the benefits of reductions in Pb. Quantifying CVD mortality in adults takes us a step closer to both understanding the full effects of Pb on the health of populations and expanding consideration of the benefits of reduced Pb exposures beyond young children.
Supplementary Material
Acknowledgments
Special thanks to H. Klemick, D. Axelrad, C. Dockins, and K. Sargent of the U.S. Environmental Protection Agency (EPA) for their continued input on this work. The authors would also like to thank D. Ferguson and L. Romano for their assistance in developing this manuscript. Although the research described in this paper has been funded wholly or in part by the U.S. EPA contracts EP-W-11-003 and EP-C-13-039 awarded to Abt Associates, it has not been subject to the agency’s review. Abt Associates also received funding from Resolve Inc. under a master contract agreement; however, Resolve did not review this manuscript. This article therefore does not necessarily reflect the views of the agency or Resolve, and no official endorsement should be inferred.
References
- Aoki Y, Brody DJ, Flegal KM, Fakhouri TH, Axelrad DA, Parker JD. 2016. Blood lead and other metal biomarkers as risk factors for cardiovascular disease mortality. Medicine (Baltimore) 95(1):e2223, PMID: 26735529, 10.1097/MD.0000000000002223. [DOI] [PMC free article] [PubMed] [Google Scholar]
- Bertke SJ, Lehman EJ, Wurzelbacher SJ, Hein MJ. 2016. Mortality of lead smelter workers: a follow‐up study with exposure assessment. Am J Ind Med 59(11):979–986, PMID: 27350012, 10.1002/ajim.22618. [DOI] [PMC free article] [PubMed] [Google Scholar]
- Bierkens J, Buekers J, Van Holderbeke M, Torfs R. 2012. Health impact assessment and monetary valuation of IQ loss in pre-school children due to lead exposure through locally produced food. Sci Total Environ 414:90–97, PMID: 22137649, 10.1016/j.scitotenv.2011.10.048. [DOI] [PubMed] [Google Scholar]
- CDC (Centers for Disease Control and Prevention). 2002a. 1999–2000 Data Documentation, Codebook, and Frequencies. Cadmium, Lead, Mercury, Cotinine & Nutritional Biochemistries (LAB06). Last revised September 2007. https://wwwn.cdc.gov/Nchs/Nhanes/1999-2000/LAB06.htm [accessed 5 September 2020].
- CDC. 2002b. 1999–2000 Data Documentation, Codebook, and Frequencies. Complete Blood Count with 5-part Differential—Whole Blood (LAB25). Last revised April 2006. https://wwwn.cdc.gov/Nchs/Nhanes/1999-2000/LAB25.htm [accessed 5 September 2020].
- CDC. 2002c. 1999–2000 Data Documentation, Codebook, and Frequencies. Demographic Variables & Sample Weights (DEMO). Last revised September 2009. https://wwwn.cdc.gov/Nchs/Nhanes/1999-2000/DEMO.htm [accessed 5 September 2020].
- CDC. 2014. Underlying Cause of Death 1999–2014 on CDC WONDER Online Database. Released 2015. https://wonder.cdc.gov/ucd-icd10.html [accessed 10 November 2016].
- CDC. 2015. 2013–2014 Data Documentation, Codebook, and Frequencies. Demographic Variables and Sample Weights (DEMO_H). https://wwwn.cdc.gov/Nchs/Nhanes/2013-2014/DEMO_H.htm [accessed 5 September 2020].
- CDC. 2016a. 2013–2014 Data Documentation, Codebook, and Frequencies. Complete Blood Count with 5-part Differential—Whole Blood (CBC_H). https://wwwn.cdc.gov/Nchs/Nhanes/2013-2014/CBC_H.htm [accessed 5 September 2020].
- CDC. 2016b. 2013–2014 Data Documentation, Codebook, and Frequencies. Lead, Cadmium, Total Mercury, Selenium, and Manganese—Blood (PBCD_H). https://wwwn.cdc.gov/Nchs/Nhanes/2013-2014/PBCD_H.htm [accessed 5 September 2020].
- Chang W-C, Chang C-C, Wang Y-S, Wang Y-S, Weng W-T, Yoshioka T, et al. . 2011. Involvement of the epidermal growth factor receptor in Pb2+-induced activation of cPLA2/COX-2 genes and PGE2 production in vascular smooth muscle cells. Toxicology 279(1–3):45–53, PMID: 20850495, 10.1016/j.tox.2010.09.004. [DOI] [PubMed] [Google Scholar]
- Chowdhury R, Ramond A, O’Keeffe LM, Shahzad S, Kunutsor SK, Muka T, et al. . 2018. Environmental toxic metal contaminants and risk of cardiovascular disease: systematic review and meta-analysis. BMJ 362:k3310, PMID: 30158148, 10.1136/bmj.k3310. [DOI] [PMC free article] [PubMed] [Google Scholar]
- Cocco P, Fadda D, Atzeri S, Avataneo G, Meloni M, Flore C. 2007. Causes of death among lead smelters in relation to the glucose-6-phosphate dehydrogenase polymorphism. Occup Environ Med 64(6):414–416, PMID: 17182638, 10.1136/oem.2006.028779. [DOI] [PMC free article] [PubMed] [Google Scholar]
- deSilva PE. 1984. Blood lead levels and the haematocrit correction. Ann Occup Hyg 28(4):417–428, PMID: 6529072, 10.1093/annhyg/28.4.417. [DOI] [PubMed] [Google Scholar]
- Ford ES, Ajani UA, Croft JB, Critchley JA, Labarthe DR, Kottke TE, et al. . 2007. Explaining the decrease in U.S. deaths from coronary disease, 1980–2000. N Engl J Med 356(23):2388–2398, PMID: 17554120, 10.1056/NEJMsa053935. [DOI] [PubMed] [Google Scholar]
- Gonick HC, Ding Y, Bondy SC, Ni Z, Vaziri ND. 1997. Lead-induced hypertension: interplay of nitric oxide and reactive oxygen species. Hypertension 30(6):1487–1492, PMID: 9403571, 10.1161/01.HYP.30.6.1487. [DOI] [PubMed] [Google Scholar]
- Guallar E, Silbergeld EK, Navas-Acien A, Malhotra S, Astor BC, Sharrett AR, et al. . 2006. Confounding of the relation between homocysteine and peripheral arterial disease by lead, cadmium, and renal function. Am J Epidemiol 163(8):700–708, PMID: 16484446, 10.1093/aje/kwj090. [DOI] [PubMed] [Google Scholar]
- Hara A, Thijs L, Asayama K, Gu Y-M, Jacobs L, Zhang Z-Y, et al. . 2015. Blood pressure in relation to environmental lead exposure in the National Health and Nutrition Examination Survey 2003 to 2010. Hypertension 65(1):62–69, PMID: 25287397, 10.1161/HYPERTENSIONAHA.114.04023. [DOI] [PubMed] [Google Scholar]
- Hicken MT, Gee GC, Connell C, Snow RC, Morenoff J, Hu H. 2013. Black–white blood pressure disparities: depressive symptoms and differential vulnerability to blood lead. Environ Health Perspect 121(2):205–209, PMID: 23127977, 10.1289/ehp.1104517. [DOI] [PMC free article] [PubMed] [Google Scholar]
- Hicken MT, Gee GC, Morenoff J, Connell CM, Snow RC, Hu H. 2012. A novel look at racial health disparities: the interaction between social disadvantage and environmental health. Am J Public Health 102(12):2344–2351, PMID: 23078461, 10.2105/AJPH.2012.300774. [DOI] [PMC free article] [PubMed] [Google Scholar]
- Hu H, Shih R, Rothenberg S, Schwartz BS. 2007. The epidemiology of lead toxicity in adults: measuring dose and consideration of other methodologic issues. Environ Health Perspect 115(3):455–462, PMID: 17431499, 10.1289/ehp.9783. [DOI] [PMC free article] [PubMed] [Google Scholar]
- Jain NB, Potula V, Schwartz J, Vokonas PS, Sparrow D, Wright RO, et al. . 2007. Lead levels and ischemic heart disease in a prospective study of middle-aged and elderly men: the VA Normative Aging Study. Environ Health Perspect 115(6):871–875, PMID: 17589593, 10.1289/ehp.9629. [DOI] [PMC free article] [PubMed] [Google Scholar]
- Khalil N, Wilson JW, Talbott EO, Morrow LA, Hochberg MC, Hillier TA, et al. . 2009. Association of blood lead concentrations with mortality in older women: a prospective cohort study. Environ Health 8(1):15, PMID: 19344498, 10.1186/1476-069X-8-15. [DOI] [PMC free article] [PubMed] [Google Scholar]
- Lanphear BP, Hornung R, Khoury J, Yolton K, Baghurst P, Bellinger DC, et al. . 2005. Low-level environmental lead exposure and children’s intellectual function: an international pooled analysis. Environ Health Perspect 113(7):894–899, PMID: 16002379, 10.1289/ehp.7688. [DOI] [PMC free article] [PubMed] [Google Scholar]
- Lanphear BP, Rauch S, Auinger P, Allen RW, Hornung RW. 2018. Low-level lead exposure and mortality in US adults: a population-based cohort study. Lancet Public Health 3(4):e177–e184, PMID: 29544878, 10.1016/S2468-2667(18)30025-2. [DOI] [PubMed] [Google Scholar]
- Leggett RW. 1993. An age-specific kinetic model of lead metabolism in humans. Environ Health Perspect 101(7):598–616, PMID: 8143593, 10.1289/ehp.93101598. [DOI] [PMC free article] [PubMed] [Google Scholar]
- Lin J-L, Lin-Tan D-T, Hsu C-W, Yen T-H, Chen K-H, Hsu H-H, et al. . 2011. Association of blood lead levels with mortality in patients on maintenance hemodialysis. Am J Med 124(4):350–358, PMID: 21435426, 10.1016/j.amjmed.2010.10.022. [DOI] [PubMed] [Google Scholar]
- Lustberg M, Silbergeld E. 2002. Blood lead levels and mortality. Arch Intern Med 162(21):2443–2449, PMID: 12437403, 10.1001/archinte.162.21.2443. [DOI] [PubMed] [Google Scholar]
- McElvenny DM, Miller BG, MacCalman LA, Sleeuwenhoek A, van Tongeren M, Shepherd K, et al. . 2015. Mortality of a cohort of workers in Great Britain with blood lead measurements. Occup Environ Med 72(9):625–632, PMID: 25872777, 10.1136/oemed-2014-102637. [DOI] [PubMed] [Google Scholar]
- Menke A, Muntner P, Batuman V, Silbergeld EK, Guallar E. 2006. Blood lead below 0.48 μmol/L (10 μg/dL) and mortality among US adults. Circulation 114(13):1388–1394, PMID: 16982939, 10.1161/CIRCULATIONAHA.106.628321. [DOI] [PubMed] [Google Scholar]
- Muntner P, Menke A, DeSalvo KB, Rabito FA, Batuman V. 2005. Continued decline in blood lead levels among adults in the United States: the National Health and Nutrition Examination Surveys. Arch Intern Med 165(18):2155–2161, PMID: 16217007, 10.1001/archinte.165.18.2155. [DOI] [PubMed] [Google Scholar]
- Navas-Acien A, Schwartz BS, Rothenberg SJ, Hu H, Silbergeld EK, Guallar E. 2008. Bone lead levels and blood pressure endpoints: a meta-analysis. Epidemiology 19(3):496–504, PMID: 18414090, 10.1097/EDE.0b013e31816a2400. [DOI] [PubMed] [Google Scholar]
- Navas-Acien A, Selvin E, Sharrett AR, Calderon-Aranda E, Silbergeld E, Guallar E. 2004. Lead, cadmium, smoking, and increased risk of peripheral arterial disease. Circulation 109(25):3196–3201, PMID: 15184277, 10.1161/01.CIR.0000130848.18636.B2. [DOI] [PubMed] [Google Scholar]
- Neuberger JS, Hu SC, Drake KD, Jim R. 2009. Potential health impacts of heavy-metal exposure at the Tar Creek Superfund site, Ottawa County, Oklahoma. Environ Geochem Health 31(1):47–59, PMID: 18306045, 10.1007/s10653-008-9154-0. [DOI] [PubMed] [Google Scholar]
- NTP (National Toxicology Program). 2012. NTP Monograph on Health Effects of Low-Level Lead. Research Triangle Park, NC: U.S. Department of Health and Human Services; https://ntp.niehs.nih.gov/ntp/ohat/lead/final/leadappendixd_final_508.pdf [accessed 5 September 2020]. [Google Scholar]
- Park SK, Mukherjee B, Xia X, Sparrow D, Weisskopf MG, Nie H, et al. . 2009. Bone lead level prediction models and their application to examine the relationship of lead exposure and hypertension in the Third National Health and Nutrition Examination Survey. J Occup Environ Med 51(12):1422–1436, PMID: 19952788, 10.1097/JOM.0b013e3181bf6c8d. [DOI] [PMC free article] [PubMed] [Google Scholar]
- Ruiz-Hernandez A, Navas-Acien A, Pastor-Barriuso R, Cranceanu CM, Redon J, Guallar E, et al. . 2017. Declining exposures to lead and cadmium contribute to explaining the reduction of cardiovascular mortality in the US population, 1988–2004. Int J Epidemiol 46(6):1903–1912, PMID: 29025072, 10.1093/ije/dyx176. [DOI] [PMC free article] [PubMed] [Google Scholar]
- Schober SE, Mirel LB, Graubard BI, Brody DJ, Flegal KM. 2006. Blood lead levels and death from all causes, cardiovascular disease, and cancer: results from the NHANES III mortality study. Environ Health Perspect 114(10):1538–1541, PMID: 17035139, 10.1289/ehp.9123. [DOI] [PMC free article] [PubMed] [Google Scholar]
- Scinicariello F, Abadin HG, Murray HE. 2011. Association of low-level blood lead and blood pressure in NHANES 1999–2006. Environ Res 111(8):1249–1257, PMID: 21907978, 10.1016/j.envres.2011.08.011. [DOI] [PubMed] [Google Scholar]
- Tsoi M-F, Cheung C-L, Cheung TT, Cheung BMY. 2016. Continual decrease in blood lead level in Americans: United States National Health Nutrition and Examination Survey 1999–2014. Am J Med 129(11):1213–1218, PMID: 27341956, 10.1016/j.amjmed.2016.05.042. [DOI] [PubMed] [Google Scholar]
- U.S. Burden of Disease Collaborators. 2013. The state of US health, 1990–2010: burden of diseases, injuries, and risk factors. JAMA 310(6):591–606, PMID: 23842577, 10.1001/jama.2013.13805. [DOI] [PMC free article] [PubMed] [Google Scholar]
- U.S. EPA (U.S. Environmental Protection Agency). 1996. Recommendations of the Technical Review Workgroup for Lead for an Approach to Assessing Risks Associated with Adult Exposures to Lead in Soil. EPA-540-R-03-001. Washington, DC: U.S. EPA; https://semspub.epa.gov/work/HQ/174559.pdf [accessed 5 September 2020]. [Google Scholar]
- U.S. EPA. 2008. Regulatory Impact Analysis of the Proposed Revisions to the National Ambient Air Quality Standards for Lead. Research Triangle Park, NC: U.S. EPA; https://www.epa.gov/sites/production/files/2016-03/documents/ria_oct2008.pdf [accessed 5 September 2020]. [Google Scholar]
- U.S. EPA. 2013. Integrated Science Assessment (ISA) for Lead (Final Report, July 2013). EPA/600/R-10/075F. Research Triangle Park, NC: U.S. EPA. [Google Scholar]
- Ukaejiofo EO, Thomas N, Ike SO. 2009. Haematological assessment of occupational exposure to lead handlers in Enugu urban, Enugu State, Nigeria. Niger J Clin Pract 12(1):58–64, PMID: 19562924. [PubMed] [Google Scholar]
- Vaziri ND. 2008. Mechanisms of lead-induced hypertension and cardiovascular disease. Am J Physiol Heart Circ Physiol 295(2):H454–H465, PMID: 18567711, 10.1152/ajpheart.00158.2008. [DOI] [PMC free article] [PubMed] [Google Scholar]
- Wang M, Xu Y, Pan S, Zhang J, Zhong A, Song H, et al. . 2011. Long-term heavy metal pollution and mortality in a Chinese population: an ecologic study. Biol Trace Elem Res 142(3):362–379, PMID: 20838927, 10.1007/s12011-010-8802-2. [DOI] [PubMed] [Google Scholar]
- Weisskopf MG, Jain N, Nie H, Sparrow D, Vokonas P, Schwartz J, et al. . 2009. A prospective study of bone lead concentration and death from all causes, cardiovascular diseases, and cancer in the Department of Veterans Affairs Normative Aging Study. Circulation 120(12):1056–1064, PMID: 19738141, 10.1161/CIRCULATIONAHA.108.827121. [DOI] [PMC free article] [PubMed] [Google Scholar]
- Weisskopf MG, Sparrow D, Hu H, Power MC. 2015. Biased exposure–health effect estimates from selection in cohort studies: are environmental studies at particular risk? Environ Health Perspect 123(11):1113–1122, PMID: 25956004, 10.1289/ehp.1408888. [DOI] [PMC free article] [PubMed] [Google Scholar]
- Zentner LEA, Rondó PH, Duran MC, Oliveira JM. 2008. Relationships of blood lead to calcium, iron, and vitamin C intakes in Brazilian pregnant women. Clin Nutr 27(1):100–104, PMID: 18036707, 10.1016/j.clnu.2007.10.005. [DOI] [PubMed] [Google Scholar]
Associated Data
This section collects any data citations, data availability statements, or supplementary materials included in this article.