Abstract
Nitrosamine metabolites resulting from cigarette smoking and E-cigarette (E-cig) vaping cause DNA damage that can lead to genotoxicity. While DNA adducts of metabolites of nitrosamines 4-(methylnitrosamino)-1-(3-pyridyl)-1-butanone (NNK) and N-nitrosonornicotine (NNN) are well-known tobacco-related cancer biomarkers, only a few studies implicate NNN and NNK in DNA oxidation in humans. NNK and NNN were found in the urine of E-cigarette users who never smoked cigarettes. This paper proposes the first chemical pathways of DNA oxidation driven by NNK and NNN metabolites in redox reactions with Cu2+ and NADPH leading to reactive oxygen species (ROS). A microfluidic array with thin films of DNA and metabolic enzymes that make metabolites of NNN and NNK in the presence of Cu2+ and NADPH was used to estimate relative rates of DNA oxidation. Detection by electrochemiluminescence (ECL) employed a new ECL dye [Os(tpy-benz-COOH)2]2+ that is selective for and sensitive to the primary DNA oxidation product 8-oxo-7,8-dihydro-2-deoxyguanosine (8-oxodG) in DNA. Enzyme–DNA films on magnetic beads were used to produce nitrosamine metabolites that enter ROS-forming redox cycles with Cu2+ and NADPH, and liquid chromatography–mass spectrometry (LC–MS) was used to quantify 8-oxodG and identify metabolites. ROS were detected by optical sensors. Metabolites of NNK and NNN + Cu2+ + NADPH generated relatively high rates of DNA oxidation. Lung is the exposure route in smoking and vaping, human lung tissue contains Cu2+ and NADPH, and lung microsomal enzymes gave the highest rates of DNA oxidation in this study. Also, E-cigarette vapor contains 6-fold more copper than that in cigarette smoke, which could exacerbate DNA oxidation.
Graphical Abstract

INTRODUCTION
DNA in living organisms can be damaged from exogenous sources such as ionizing radiation or redox-active metabolites of xenobiotic chemicals.1,2 Xenobiotic chemicals entering the human body can be converted to reactive intermediates by metabolic reactions mediated by cytochromes P450 (cyt P450s) and bioconjugation enzymes in a process called bioactivation,3 a major cause of genotoxicity, or gene damage.2,4–6 Reactive metabolites involved in redox cycling with NADPH and metal ions such as Cu2+ and Fe2+ can form reactive oxygen species (ROS) that oxidize DNA.7–9 Guanine has the lowest ionization potential of DNA bases, and the primary DNA oxidation product is 8-oxo-7,8-dihydro-2′-guanine (8-oxoG).10–14 Scheme 1 illustrates a redox cycling pathway for catechol moieties on polyaromatic o-quinones, which combine with NADPH and Cu2+ to form ROS that oxidize DNA but also form DNA adducts.15,16
Scheme 1.

Pathway for Oxidation of DNA Involving Polyaromatic o-Quinones in the Presence of Cu2+ and NADPHa
aAdapted with permission from ref 15, copyright American Chemical Soc., 2005.
Xenobiotics in tobacco and possibly E-cigarettes can initiate diseases including lung, liver, bladder, and other cancers.17,18 Tobacco-specific nitrosamines form during curing of tobacco and could be generated during metabolism or heat vaporization of nicotine.19–21 4-(Methylnitrosamino)-1-(3-pyridyl)-1-butanone (NNK) and N-nitrosonornicotine (NNN) are found in tobacco smoke,22–25 and they are group I carcinogens classed as carcinogenic in humans.26 NNN and NNK have also been found in E-cigarette vapor27 and in the urine of E-cigarette users who never smoked tobacco,28 but they were lower levels than those found in tobacco smokers. NNK and NNN are bioactivated by cyt P450-catalyzed α-hydroxylation on carbons adjacent to N-nitroso groups (Scheme 2) to make reactive metabolites that form DNA adducts.29–31
Scheme 2.

Metabolic Transformation of NNK and NNN via cyt P450-Mediated Bioactivation Involving Oxygena
aHydroxylation at the α-methylene carbon of 4-(methylnitrosamino)-1-(3-pyridyl)-1-butanone (NNK) results in an unstable α-hydroxynitrosamine (1) which is decomposed to 4-oxo-4-(3-pyridyl)butanal (OPB, 5) and the methyldiazonium ion (6). 6 reacts with DNA to form several methylated DNA bases. Hydroxylation at the α-methyl carbon gives an unstable α-hydroxynitrosamine (2) which in turn decomposes to 4-(3-pyridyl)-4-hydroxybutanediazohydroxide (8). This diazohydroxide can form pyridyloxybutyl–DNA (POB–DNA) adducts by reacting with DNA bases, adapted from information in ref 21. 2′-hydroxylation of N-nitrosonornicotine (NNN) also results in the POB–DNA adduct via the diazohydroxy intermediate (8), and 5′-hydroxylation of NNN forms 2-(2-(3-pyridyl)-N-pyrrolidinyl)–DNA (py-py–dDNA) adducts, adapted from information in ref 29.
Metabolic transformation of NNK forms unstable α-hydroxynitrosamines (1 and 2, Scheme 2) that spontaneously decompose to more stable metabolites. α-Hydroxynitrosamine from α-hydroxylation at the methylene carbon decomposes to 4-oxo-4-(3-pyridyl)butanal (OPB, 5) and the methyldiazonium ion (6). The methyldiazonium ion is a strong methylating agent, and deoxyguanosines (dG) and thymidines (dT) in DNA are readily methylated to result in 7-methylguanine (7-mG), O6-methylguanine(O6-mG), and O4-methylthymine. The unstable α-hydroxynitrosamine from the α-hydroxylation at the methyl carbon decomposes to formaldehyde (7) and 4-(3-pyridyl)-4-oxobutanediazohydroxide (8), and the latter reacts with DNA to form pyridyloxobutyl adducts (POB–DNA adducts) at 7- and O6-positions of dG and the O2-position of dT and dC (Scheme 2). Hydroxylation at the 2′-position of NNN initiates formation of the pyridyloxobutyl–DNA adduct (POB–DNA adduct), while 5′ hydroxylation gives rise to 2-(2-(3-pyridyl)-N-pyrrolidinyl)–DNA (py-py–dDNA) adducts (Scheme 2).
DNA adducts of NNK and NNN metabolites were identified by studies of metabolism and DNA adduction,32,33 but less attention has been paid to DNA oxidation. A few studies reported increased 8-oxodG levels in rodent and human lung tissue exposed to NNK34–36 and in smokers’ lungs,37 suggesting that NNK facilitates DNA oxidation. However, no evidence for DNA oxidation involving NNN was yet reported, nor have pathways for NNK- and NNN-mediated DNA oxidation been proposed.
We previously developed electrochemiluminescence (ECL) arrays and employed Os-complex ECL dyes to selectively measure 8-oxodG in unhydrolyzed DNA oxidized by a cocktail of metal ions, oxygen, NADPH, and reactive metabolites or organic test compounds.38,39 Array responses with Os-complex dyes are selective for 8-oxodG because of its low oxidation potential compared to that of dG and other possible coreactants. ECL intensity is directly related to the amount of 8-oxodG found by LC–MS in reactions performed under the same conditions.38,39 In the present paper, we use a new, sensitive, and selective Os ECL dye [Os(4′-(4-carboxyphenyl)-2,2′:6′,2″-terpyridine))2]2+ ([Os(tpy-benz-COOH)2]2+, Figure 1) in a microfluidic DNA oxidation array as well as LC–MS/MS to detect 8-oxodG and to demonstrate and investigate DNA oxidation mediated by NNK and NNN metabolites combined with Cu2+ and NADPH. Lung, liver, and intestinal microsomes as enzyme sources facilitated producing and identifying organ-specific suites of NNK and NNN metabolites in these reactions. We also identified the types of ROS involved. Results were used to elucidate pathways of DNA oxidation mediated by NNK and NNN metabolites with Cu2+ and NADPH for the first time.
Figure 1.

Structure of new ECL dye [Os(tpy-benz-COOH)2]2+
EXPERIMENTAL SECTION
Full details and array device diagrams are provided in the Supporting Information (SI) file.
Microfluidic Arrays.
Arrays were 3D printed from clear polyacrylate resin and used to detect DNA oxidation mediated by metabolites of NNK and NNN. Individual chambers hold the wash buffer and sample upstream of a detection channel featuring a pyrolytic graphite sheet (PGS) chip with eight printed 10 nm deep microwells sealed with adhesive to the open lower part of the detection channel (see SI). Each microwell holds a 1.0 ± 0.1 μL aqueous droplet, and the hydrophobic walls create barriers to prevent cross-contamination.40 Microwells in the array were filled with thin films grown by alternate charge layer-by-layer (LbL) assembly in the order (PDDA–DNA)3–cyt P450 source–PDDA–DNA (PDDA = (polydiallyldimethylammonium) bromide)41 (Scheme S1A). Enzyme sources were human organ microsomes and a cyt P450 2B6 supersome. To oxidize DNA, ROS were generated inside the microfluidic device by delivering 2 mM nitrosamine in a phosphate buffer with pH 7.4 including 5 mM Cu2+ or Fe2+ and an NADPH regenerating system to the detection chamber of the array to activate cyt P450s (see SI for full details). Channels were washed, then 2 mM [Os(tpy-benz-COOH)2]2+ was delivered, and 0.78 V vs Ag–AgCl (0.14 M KCl) was applied; ECL light was captured using a CCD camera in a dark box.
UPLC–MS.
Films of PDDA, DNA, and enzymes were grown on 1 μm carboxylate-functionalized magnetic beads and incubated with NNK and NNN (2 mM), an NADPH regeneration system and 5 mM CuCl2 at 37 °C and pH 7. DNA was hydrolyzed off the beads enzymatically, and products were analyzed by UPLC–MS/MS, as previously reported (see SI for full details).38,39 Selective optical sensors were also used on product solutions to detect specific ROS (Scheme 3).
Scheme 3.

Analyses and ROS Detection Using Magnetic Biocolloid Reactorsa
a(A) Layer-by-layer (LbL) films used in arrays microwells and on magnetic beads that form ROS upon the metabolism in the presence of Cu2+ and NADPH. (B) Oxidation product 8-oxodG and metabolites are measured by UHPLC–MS. (C) Identification of ROS using specific optical sensors and a plate reader.
Film Characterization.
Films were deposited on 9 MHz gold-coated resonators coated with 3-mercaptopropionic acid, and film mass was measured by the quartz crystal microbalance (QCM). The mass per unit area M/A (g/cm2) in each layer is given by M/A = −ΔF (Hz)/(1.83 × 108), and nominal thickness (d) is given by d (nm) = (−0.016 ± 0.002)ΔF (Hz) (Figure S3).41 Films were nominally 18–29 nm thick (Table S1).
RESULTS
Oxidative Damage of DNA.
We previously discovered that DNA oxidation can be detected by ECL arrays using an Os(poly(vinylpyridine)) coreactant,43 and we recently used [Os(bpy)2(phen-benz-COOH)]2+ to selectively detect 8-oxodG in arrays in the presence of Cu2+, NADPH, and metabolites of the test chemical, including arylamines.38,39 These studies also showed that the rate of the ECL increase on the arrays is proportional to the rate of DNA oxidation measured by LC–MS, and slopes of plots of ECL increase vs reaction time correlate well with results from the standard comet assays for DNA damage in cell cultures. The Os-complex ECL dyes have much lower oxidation potentials than those of guanine (G) and other nucleobases, and they selectively oxidize and produce ECL only from 8-oxodG in DNA, which has a much lower oxidation potential than that of G and is the ECL coreactant. Here, we employ a new, more sensitive and selective Os ECL dye for 8-oxodG, [Os(tpy-benz-COOH)2]2+ (Figure 1).
The microfluidic DNA oxidation arrays feature eight microwells filled with thin films of metabolic enzymes, DNA, and cationic polymer PDDA (Figure S2, SI file). Enzyme sources were human microsomes from lung (HLuM), liver (HLM), and intestine (HIM), and another enzyme source was supersome cyt P450 2B6, a key enzyme in metabolizing NNK and other nitrosamines.21,44 Figure 2 shows reconstructed, recolorized ECL array images and intensities using NNK or NNN, with Cu2+ and NADPH for DNA oxidation. As mentioned, increases in ECL intensity indicate increased DNA oxidation, with slopes of % ECL vs enzyme reaction time reflecting the relative DNA oxidation rates. HLuM induced a faster rate of DNA oxidation than HLM, HIM, or cyt P450 2B6 for NNK and NNN for similar amounts of enzyme. Control wells in the array exposed to PBS buffer, Cu2+ and NADPH, or without enzymes in the films exposed to NNK or NNN, gave a negligible ECL change with time. The effect of Fe2+ on DNA oxidation was also detected using microfluidic arrays and ECL, in the presence of HLuM and NADPH (Figure 3). Figure 4 shows the turnover rate (R) of NNK and NNN with different cyt P450 sources used in ECL arrays, where R is a normalized ECL-based turnover rate defined as (slope of % ECL increase) × (μg of protein−1 min−1 mM−1).39 NNK had a larger R-value than that of NNN when metabolized by HLuM, while NNN shows higher R-values than those of NNK for HLM, HIM, and cyt P450 2B6. TD50 is the median dose of a test chemical at which tumors occur in 50% of a test population, and it is a measure of carcinogenic potency that may correlate with DNA oxidation levels. Rodent liver45 values of 1/TD50 (used because the lower the TD50 is, the greater the liver genotoxicity is, Table S2) are similar for NNK and NNN, and our ECL R-values for all the microsomal enzymes are also similar. Moreover, Figure 5 illustrates the increase in ECL intensity with the increasing concentration of 8-oxodG standard solutions, proving the relationship between ECL intensity and the amount of 8-oxodG produced in microwell arrays.
Figure 2.

ECL array results for DNA oxidation mediated by NNK and NNN in the presence of 5 mM CuCl2 and the NADPH regenerating system. (A, C) Reconstructed, recolorized ECL images for NNK and NNN as labeled. (B, D) Increase of % ECL above that of the zero control vs incubation time for different cyt P450 enzyme sources.
Figure 3.
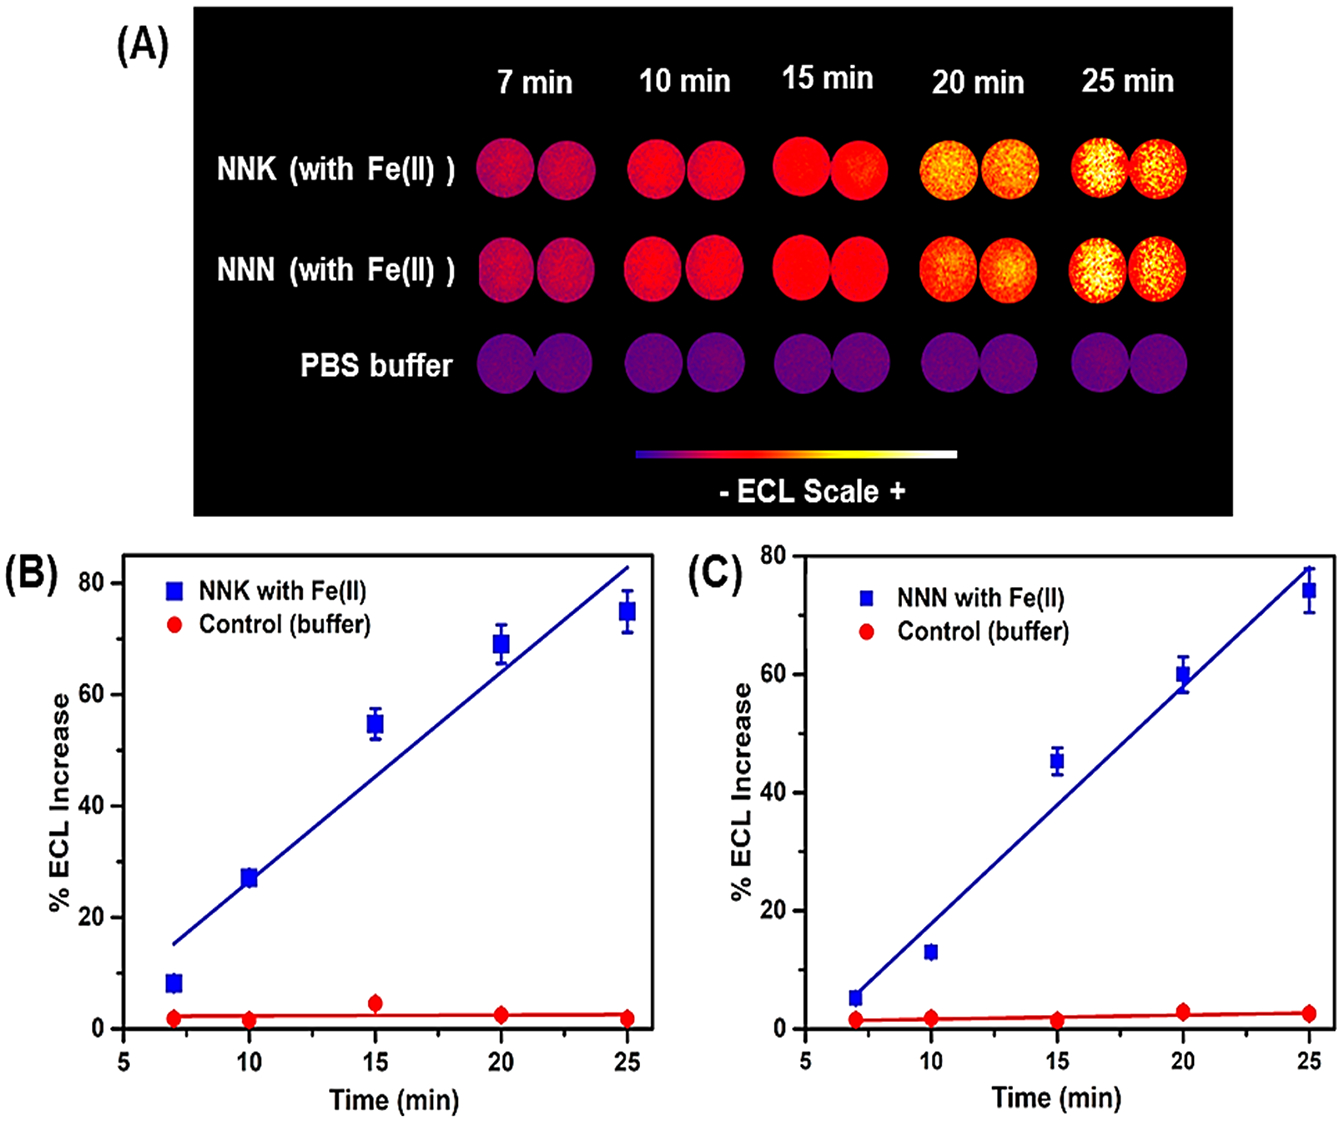
ECL array results for DNA oxidation mediated by NNK and NNN in the presence of 5 mM FeCl2 and the NADPH regenerating system. (A) Reconstructed, recolorized ECL image for NNK and NNN. (B, C) Increase in the % ECL vs incubation time for NNK and NNN, respectively, with HLuM as the cyt P450 enzyme source.
Figure 4.
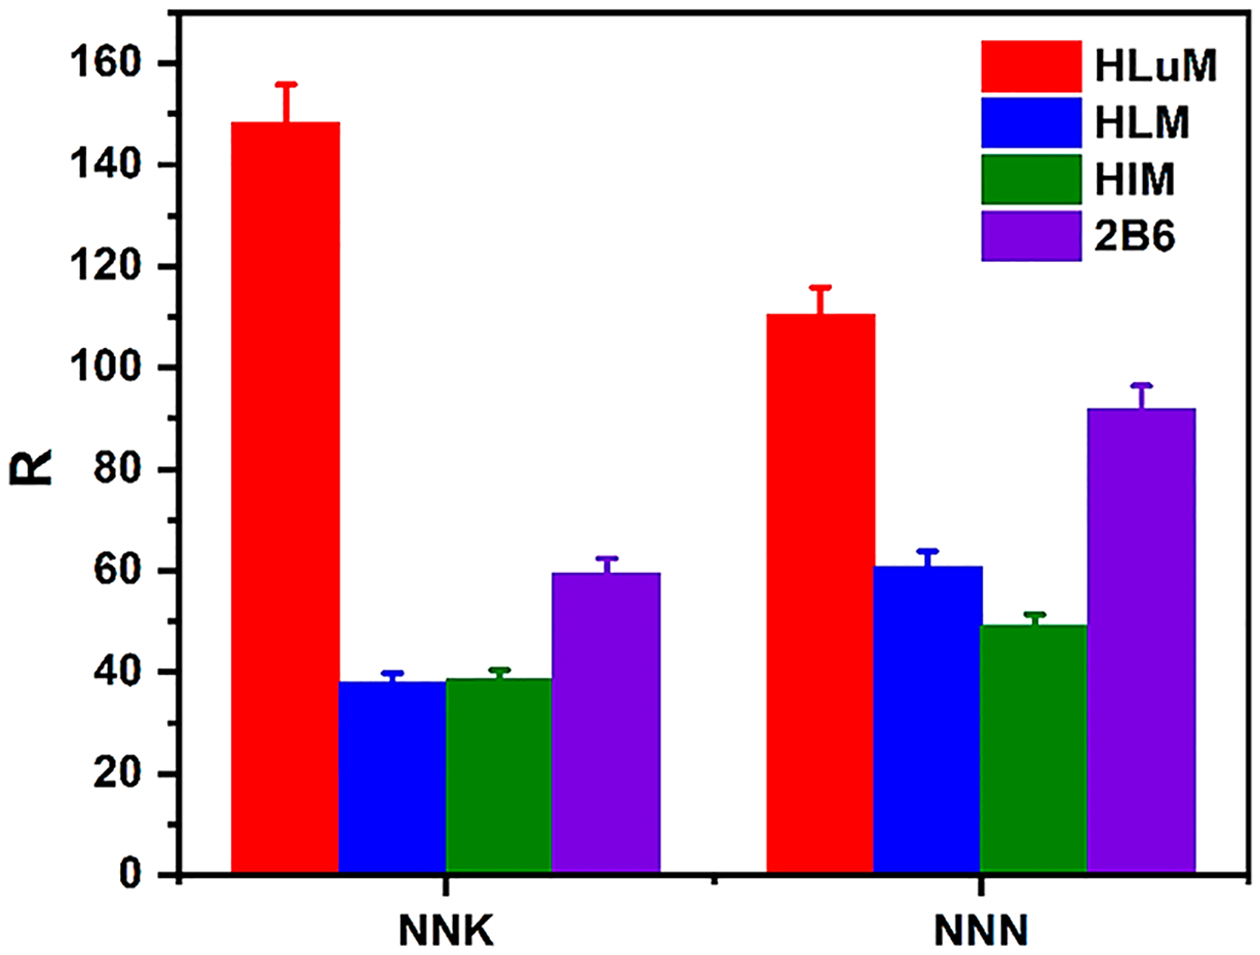
Bar graph showing normalized turnover rates for DNA oxidation, R (μg of protein−1 min−1 mM−1) from ECL array for NNK and NNN metabolized by different cyt P450 enzyme sources.
Figure 5.
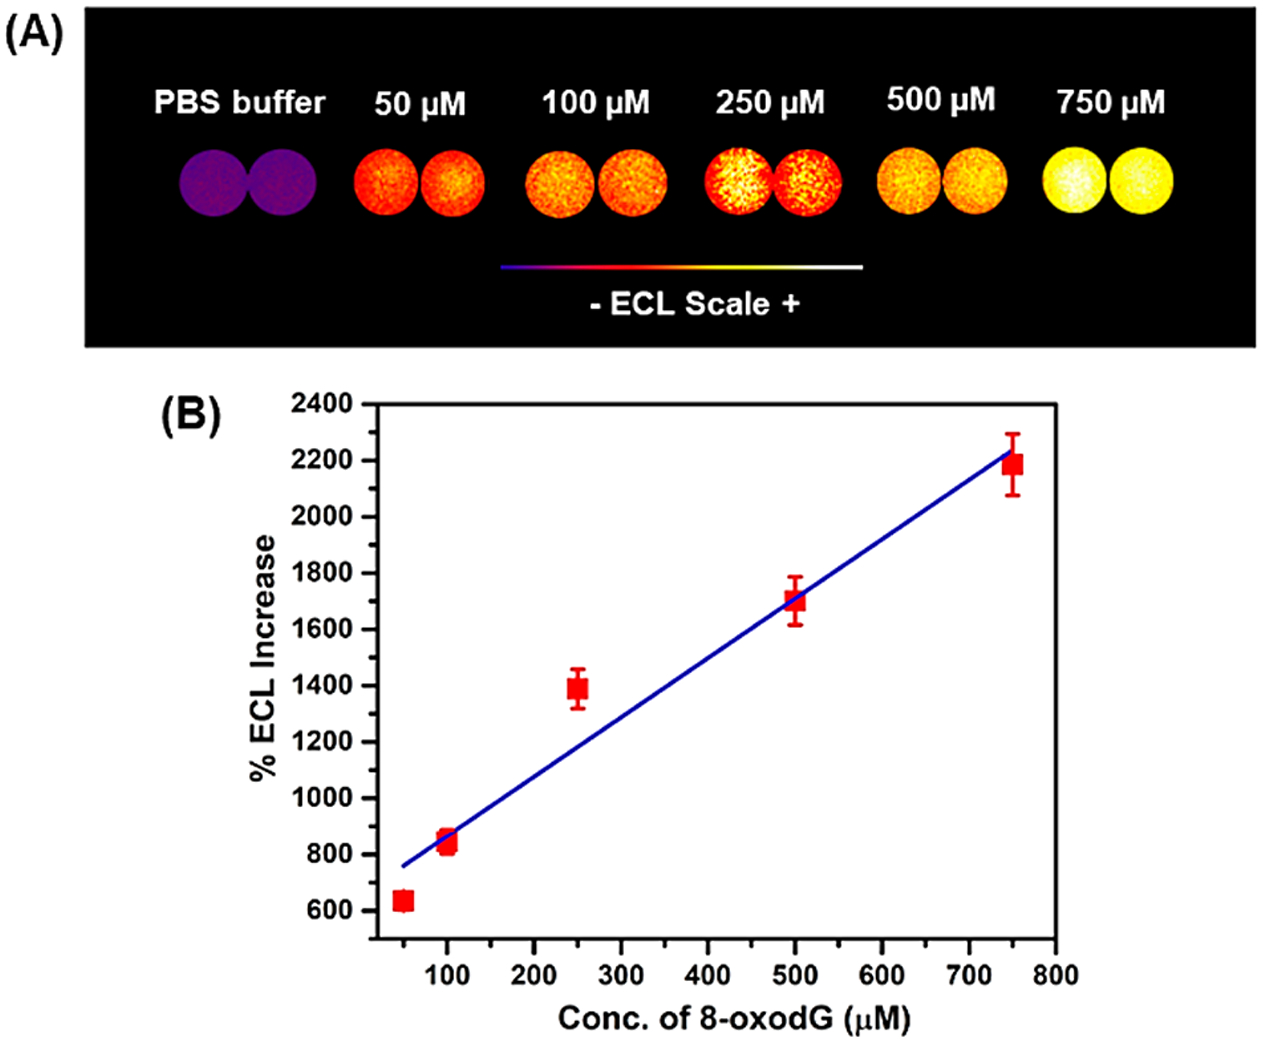
ECL array results for the relationship between ECL intensity and amount of 8-oxodG for microwell arrays. (A) Reconstructed, recolorized ECL image for different standard solutions of 8-oxodG. (B) Increase in % ECL vs concentration of 8-oxodG.
Elucidation of Metabolite Formation and DNA Oxidation by UPLC–MS/MS.
Because HLuM gave the highest rate of DNA damage in array studies (Figure 4), we used HLuM for all LC–MS studies. To react samples, 1 μm magnetic beads (MB bioreactors) coated with PDDA–cyt P450 enzyme HLuM–PDDA–DNA films were used to make metabolites of NNK and NNN in the presence and absence of Cu2+ and NADPH. Product 8-oxodG and the metabolites themselves were analyzed by LC–MS/MS. Standards for dG (MW = 267.24 g/mol) and 8-oxodG (MW = 283.24 g/mol) were run. 8-oxodG has a longer retention time (14.1 min) than that of dG (10.6 min) (Figure 6), and 8-oxodG was found after enzyme hydrolysis of DNA following reactions of NNK or NNN using MB bioreactors, Cu2+, and the NADPH regenerating system. Control experiments carried out without cyt P450s on MB bioreactors (Figure 6), as well as without NNK and NNN in the reaction mixture (Figure S7), did not give a peak for 8-oxodG. Relative amounts of 8-oxodG (number of 8-oxodGs per 106 nucleobases) in DNA formed due to oxidation in 25 min incubations were measured using UPLC–MS/MS. Relative amounts of 8-oxodG in DNA in these reactions using HLuM were 840 8-oxodGs per 106 nucleobases for NNK and 538 8-oxodGs per 106 nucleobases for NNN. These levels are comparable to ~1000 8-oxodGs per 106 nucleobases found for 4-aminobiphenyl metabolized by HLM in similar 25 min reactions.39
Figure 6.

UPLC–MS results for identification of 8-oxodG. Chromatogram with a peak at the retention time of 14.1 min represents the presence of 8-oxodG confirmed by a standard run of dG and 8-oxodG. DNA–HLuM-coated magnetic biocolloid reactors were incubated with 2 mM NNK or NNN + the NADPH regenerating system + 5 mM Cu2+ for 25 min followed by the enzymatic hydrolysis of DNA. Control experiments were 2 mM NNK or NNN, the NADPH regenerating system and Cu2+ without an enzyme source, and the DNA–enzyme source with NADPH and 5 mM Cu2+ with no NNK or NNN. Day-to-day RSD for determination of 8-oxodG was ±9.2%, and for dG it was ±7.6%.
Reactive metabolites generated during the metabolism of NNK and NNN were also measured by UPLC–MS/MS. Identification of possible metabolites of NNK that presumably involved ROS production was done by comparing products identified from their MS/MS fragmentation patterns to the pathways of NNK and NNN metabolism in Scheme 2. Extracted ion chromatograms for all NNK metabolites are shown in Figure 7A. The peak height or area in chromatograms gives an estimate of the abundance of metabolites produced. Using positive-ion electrospray MS, NNK showed the protonated molecule at m/z 207.23, while its metabolites α-hydroxynitrosamines ((M + H)+ = 224.20), α-oxonitrosamines ((M + H)+ = 222.24), 4-(3-pyridyl)-4-oxobutane-N-hydroxide ((M + H)+ = 181.19), 4-amino-1-(3-pyridyl)-1-butanone ((M + H)+ = 165.21), and 4-oxo-4-(3-pyridyl)butaldehyde ((M + H)+ = 164.19) were found after the incubation of NNK with HLuM, HLM, HIM, and 2B6 in the presence of NADPH and Cu2+ (Figure 7B–F).
Figure 7.

UPLC–MS/MS results for the identification of reactive metabolites of NNK. (A) The extracted ion chromatograms of metabolites of NNK. Tandem mass spectra of NNK metabolites (B) α-hydroxynitrosamines ((M + H)+ = 224.20), (C) α-oxonitrosamines ((M + H)+ = 222.24), (D) 4-(3-pyridyl)-4-oxobutane-N-hydroxide ((M + H)+ = 181.19), (E) 4-amino-1-(3-pyridyl)-1-butanone ((M + H)+ = 165.21), and (F) 4-oxo-4-(3-pyridyl)butaldehyde ((M + H)+ = 164.19) formed on incubation of NNK with HLuM, Cu2+, and the NADPH regenerating system.
Extracted ion chromatograms of metabolites of NNN are depicted in Figure 8A; positive-ion mass spectra of NNN and its metabolites are shown in Figure 8B–G. The protonated NNN molecule had m/z 177.09. Metabolites produced from NNN, 2′-hydroxy NNN and 5′-hydroxy NNN ((M + H)+ = 193.09), diazohydroxide ((M + H)+ = 194.19), 4-hydroxyl-1-(3-pyridyl)-1-butanone (HPB, (M + H)+ = 166.08)), 5-hydroxy-2-(3-pyridyl)tetrahydrofuran (lactol, (M + H)+ = 166.06)), 4-oxo-4-(3-pyridyl)-1-butanal (OPB, (M + H)+ = 163.06)), 5-oxo-2-(3-pyridyl)tetrahydrofuran (lactone, (M + H)+ = 163.06)), 4-hydroxy-4-(3-pyridyl)butanoic acid (HPBA, (M + H)+ = 182.08)), and 4-hydroxy-4-(3-pyridyl)butanal ((M + H)+ = 151.06) were identified after the incubation with HLuM, NADPH, and Cu2+. The fragmentation patterns of all the major metabolites of NNK and NNN involved in DNA oxidation, except that of the NNN metabolite 4-hydroxy-4-(3-pyridyl)-butanal ((M + H)+ = 151.06), were confirmed by using fragmentation predicting software ACD/Lab MS–Fragmenter (details in SI file). We expect that 4-hydroxy-4-(3-pyridyl)-butanal ((M + H)+ = 151.06) is only a minor contributor to the oxidations, as it is the final product of the predicted mechanistic pathway 2 (Scheme 9).
Figure 8.
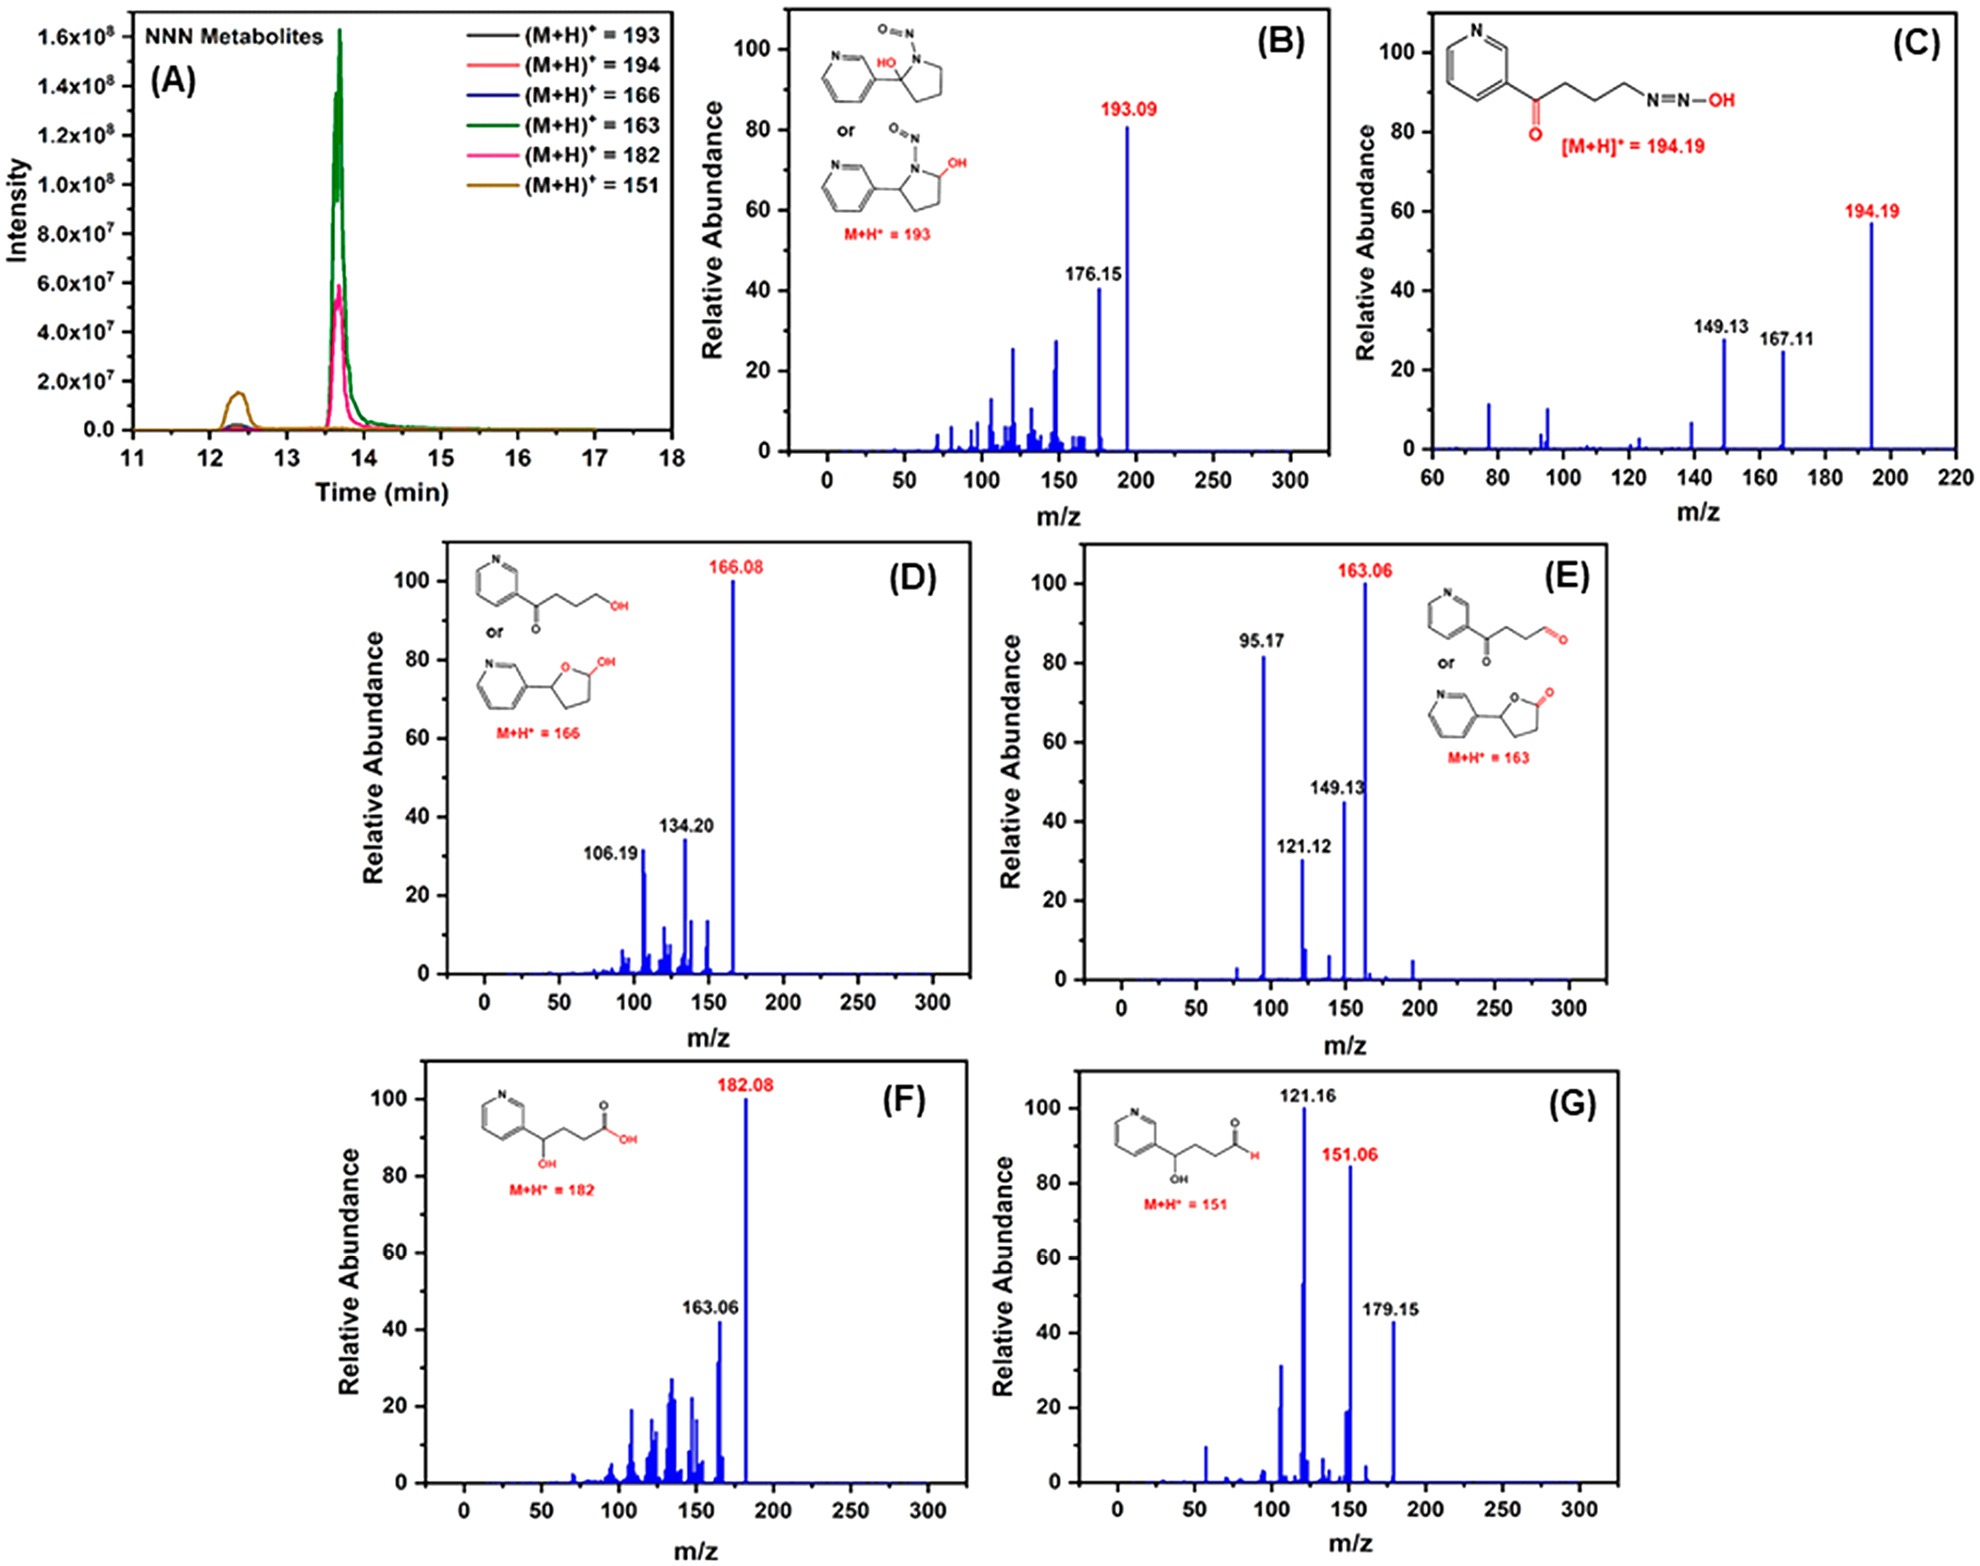
UPLC–MS/MS results for the identification of reactive metabolites of NNN. (A) The extracted ion chromatograms of metabolites of NNN. MS/MS spectra of metabolites produced from NNN (B) 2′-hydroxy NNN and 5′-hydroxy NNN ((M + H)+ = 193.09), (C) 4-(3-pyridyl)-4-hydroxybutanediazohydroxide ((M + H)+ = 194.19), (D) 4-hydroxyl-1-(3-pyridyl)-1-butanone (HPB, (M + H)+ = 166.08)) and 5-hydroxy-2-(3-pyridyl)tetrahydrofuran (lactol, (M + H)+ = 166.06)), (E) 4-oxo-4-(3-pyridyl)-1-butanal (OPB, (M + H)+ = 163.06)) and 5-oxo-2-(3-pyridyl)tetrahydrofuran (lactone, (M + H)+ = 163.06)), (F) 4-hydroxy-4-(3-pyridyl)butanoic acid (HPBA, (M + H)+ = 182.08)), and (G) 4-hydroxy-4-(3-pyridyl)butanal ((M + H)+ = 151.06) were obtained using HLuM, Cu2+, and the NADPH regenerating system.
Scheme 9.

Possible Mechanistic Pathway-2 for the Production of Reactive Metabolites of NNN and ROSa
aThe production of the reactive metabolites is performed via α-hydroxylation at the 5′-position of NNN, in the presence of O2, NADPH, and Cu2+. Reactive metabolites in the metabolic pathway are (5) 5′-hydroxy NNN, (6) diazohydroxide, (7) 5-hydroxy-2-(3-pyridyl)tetrahydrofuran (lactol), (8) 5-oxo-2-(3-pyridyl)tetrahydrofuran (lactone), (9) 4-hydroxy-4-(3-pyridyl)butanoic acid (HPBA), and (10) 4-hydroxy-4-(3-pyridyl)butanal.
ROS Detection.
Reactive oxygen species (ROS) hydroxyl radical (OH•), superoxide ion (O2•−), and singlet oxygen (1O2) are candidates for primary oxidizing agents. While OH• has often been implicated in DNA oxidation,46 there is a lack of careful identification of actual ROS species that oxidize DNA mediated by redox-active metabolites, Cu2+, and NADPH.9 We used fluorescence and absorbance ROS sensors to identify the ROS species47 formed during metabolic conversion of NNK and NNN by HLuM with Cu2+ and NADPH present.
Disodium terephthalate (DST) selectively reacts with OH• radicals to form 2-hydroxyl terephthalic acid with an excitation wavelength of 300 nm and emission at 428 nm (Scheme S14), but it does not react with other ROS.48 Superoxide ion (O2•−) does not react with DNA, but it does with radical intermediates, e.g., deprotonated guanine radical cation.49 O2•− was estimated using spectrophotometry quantifying reduction of nitroblue tetrazolium (NBT) into purple formazan derivatives with absorbance between 450 and 700 nm (Scheme S15). Singlet oxygen (1O2) was estimated using the singlet oxygen sensor green (SOSG) probe (Scheme S16).50 H2O2 was estimated using leuco crystal violet (LCV) absorbing at 596 nm in the presence of horseradish peroxidase (HRP) (Scheme S17).47 In all films without DNA, OH•, 1O2, and H2O2 were detected (Figure 9). They were not found with DNA in the film, presumably due to their reaction with DNA. No superoxide was found in any experiment.
Figure 9.
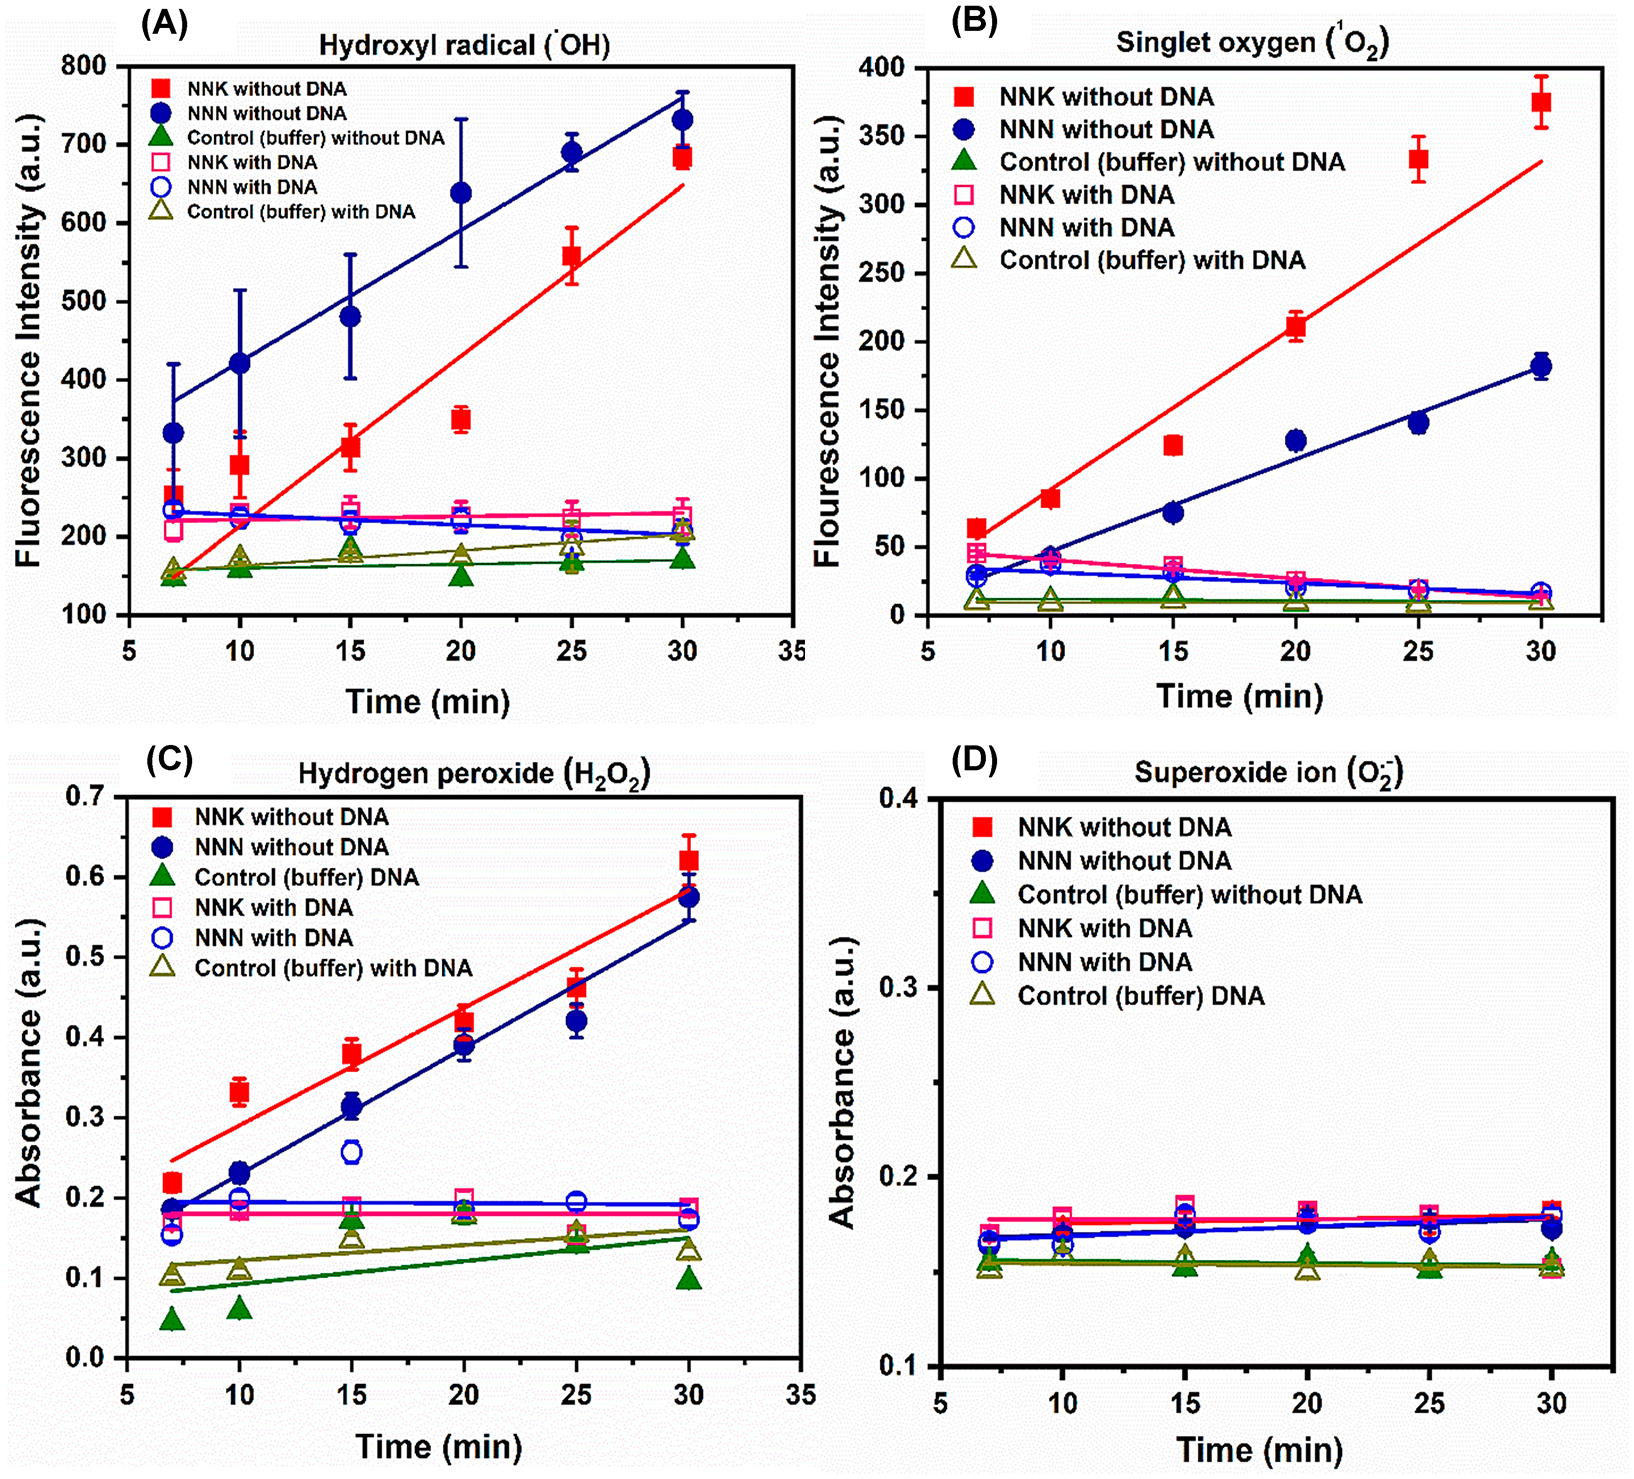
ROS detection using fluorescence and absorbance sensors. (A) Fluorescence intensity vs incubation time for DST assay for hydroxyl radical detection; (B) SOSG fluorescence assay for singlet oxygen detection. (C) LCV absorbance assay for H2O2 and (D) NBT assay for superoxide radical. DNA–HLuM films on magnetic bead reactors were incubated with 2 mM NNK or NNN + the NADPH regenerating system + 5 mM Cu2+ for different time intervals with reagents needed for respective detection assays. (A–C) Reactions with and without DNA in films on biocolloid reactors. The control for all assays was the absence of a cyt P450 enzyme source on magnetic beads in PBS buffer (pH 7.4).
DISCUSSION
The above results demonstrate the capability of NNK and NNN to facilitate high rates of DNA oxidation in the presence of Cu2+ and NADPH (Figures 2 and 4). The microfluidic ECL array provides a rapid (7 min) evaluation (Figure 2) of relative DNA oxidation rates using organ-specific microsomes, HLuM, HLM, and HIM, and here, HLuM gave the highest oxidation rate for both NNK and NNN (Figure 4). Our previous study of organ-specific DNA adduct formation from NNK metabolites also showed that lung microsomes also give the highest adduction rates.42
Relative DNA oxidation turnover rate R-values (slope of ECL vs t) (μg of protein−1 min−1 mM−1) were 148 for NNK and 110 for NNN using HLuM, reflecting much faster DNA oxidation than previously reported for aryl amine metabolites (highest R-value is 34).39 As mentioned earlier, NNK and NNN have low rodent liver TD50-values, indicating the greater liver genotoxicity (Table S2), and high ECL R-values for NNK and NNN; thus, these values correlate with the rodent carcinogenic potency index 1/TD50. The Fe2+ ion is also known in DNA oxidation by facilitating ROS production.38 ECL array results show somewhat higher ECL increases for NNK in the presence of Cu2+ and HLuM than those with the same concentration of Fe2+ and HLuM (cf. Figures 2 and 3).
Metabolic pathways of NNK and NNN in the presence of Cu2+ and NADPH leading to DNA oxidation were evaluated by considering the ROS moieties formed (Figure 9), UPLC–MS/MS metabolite identifications, and known metabolic pathways. Metabolites of NNK involved in ROS production were identified by comparing Scheme 2 with the fragmentation patterns shown in Scheme 4.
Scheme 4.

Fragmentation Patterns of NNK Metabolites Showing m/z Values of Protonated Metabolitesa
aThe protonated metabolites are (1, 4) α-hydroxynitrosamines ((M + H)+ = 224.20), (2, 5) α-oxonitrosamines ((M + H)+ = 222.24), (3) 4-oxo-4-(3-pyridyl)butaldehyde ((M + H)+ = 164.19), (6) 4-(3-pyridyl)-4-oxobutane-N-hydroxide ((M + H)+ = 181.19), and (7) 4-amino-1-(3-pyridyl)-1-butanone ((M + H)+ = 165.21), after incubation of 2 mM NNK with enzyme sources, NADPH, and Cu2+.
Two possible pathways for NNK via a cyclic redox metabolic pathway to produce ROS can be proposed (Schemes 5 and 6). Cyt P450s may catalyze the α-hydroxylation at the methyl carbon of NNK to produce α-hydroxynitrosamine (1) which undergoes a metal-mediated oxidation forming α-oxonitrosamine (2). The reduction of Cu2+ to Cu+ leads to the oxidation of O2 to produce the unstable superoxide ion radical (O2•−) which in turn produces H2O2 as the dismutation product (Scheme 6). Site-specific DNA damage was reported presum ably due to a similar pathway but without specific identification of the active ROS.51
Scheme 5.
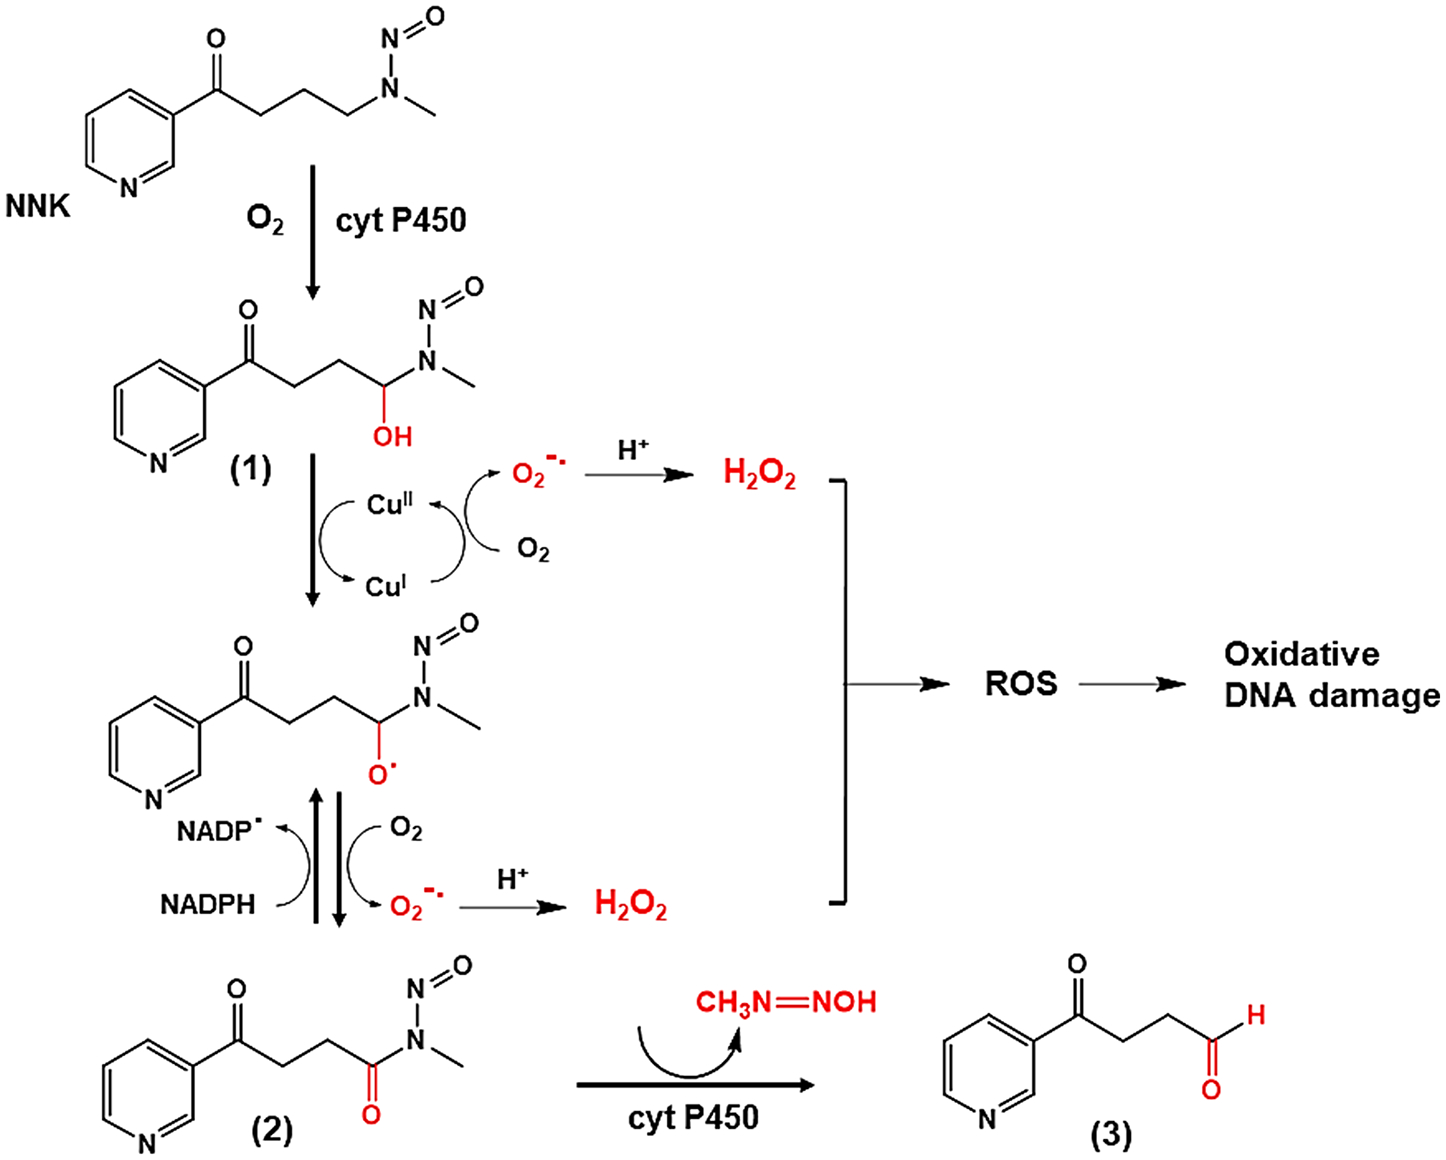
Possible Mechanistic Pathway-1 for the Production of Reactive Metabolites of NNK and ROSa
aThe production of the reactive metabolites is performed via α-hydroxylation at the methyl carbon of NNK, in the presence of O2, NADPH and Cu2+. Metabolites are (1) α-hydroxynitrosamine, (2) α-oxonitrosamine, and (3) 4-oxo-4-(3-pyridyl)butanal.
Scheme 6.

Possible Mechanistic Pathway-2 for the Production of Reactive Metabolites of NNK and ROSa
aThe production of the reactive metabolites is performed via α-hydroxylation at the methylene carbon of NNK, in the presence of O2, NADPH, and Cu2+. Produced metabolites are (4) α-hydroxynitrosamine, (5) α-oxonitrosamine, (6) 4-(3-pyridyl)-4-oxobutane-N-hydroxide, and (7) 4-amino-1-(3-pyridyl)-1-butanone.
NADPH forms a redox cycle in this metabolic pathway by reducing α-oxonitrosamine (2) to produce the radical intermediate which is in turn reoxidized to α-oxonitrosamine (2) in order to complete the redox cycle.39 This leads to enhanced production of ROS, by producing more H2O2 with the subsequent production of singlet oxygen (1O2), as found in reactions without DNA present (Figure 9B), to cause more oxidative DNA damage. The final product of the metabolic pathway, 4-oxo-4-(3-pyridyl)butanal (3), is produced by the elimination of the methyldiazonium ion.
α-Hydroxynitrosamine (4) from α-hydroxylation at the methylene carbon of NNK also results in α-oxonitrosamine (5) via metal-mediated oxidation (Scheme 6). α-Oxonitrosamine (2) (Scheme 5), α-oxonitrosamine (5), 4-(3-pyridyl)-4-oxobutane-N-hydroxide (6), and 4-amino-1-(3-pyridyl)-1-butanone (7) in pathway-2 (Scheme 6) have not been previously reported and were found only in the presence of Cu2+ and NADPH. Generation of radical intermediates and ROS is possible to cause DNA oxidation.
Fragmentation patterns found for NNN are shown in Scheme 7. Results suggest two metabolic pathways of NNN that produce ROS. In the first pathway (Scheme 8), hydroxylation of α to the nitroso group of NNN results in 2′-hydroxy NNN. Through a few successive steps catalyzed by cyt P450, Cu2+-mediated oxidation of O2 produces the superoxide ion radical (O2•−) that rapidly generates H2O2, which in the presence of Cu2+ can form OH•.52–54 A second pathway for NNN metabolism (Scheme 9) can be initiated by producing 5′-hydroxy NNN in the presence of O2 and cyt P450. ROS production originates from Cu2+-assisted metabolism of intermediate metabolite, 5-hydroxy-2-(3-pyridyl)tetrahydrofuran (lactol). NNN metabolism shown in Scheme 8 produces a new metabolite, 4-oxo-4-(3-pyridyl)-butanal (OPB, 4), in the presence of Cu2+ and NADPH, which was not found previously. Similarly, another newly discovered metabolite, 4-hydroxy-4-(3-pyridyl)butanal (10), was found in pathway-2 (Scheme 9), when Cu2+ and NADPH are present.
Scheme 7.
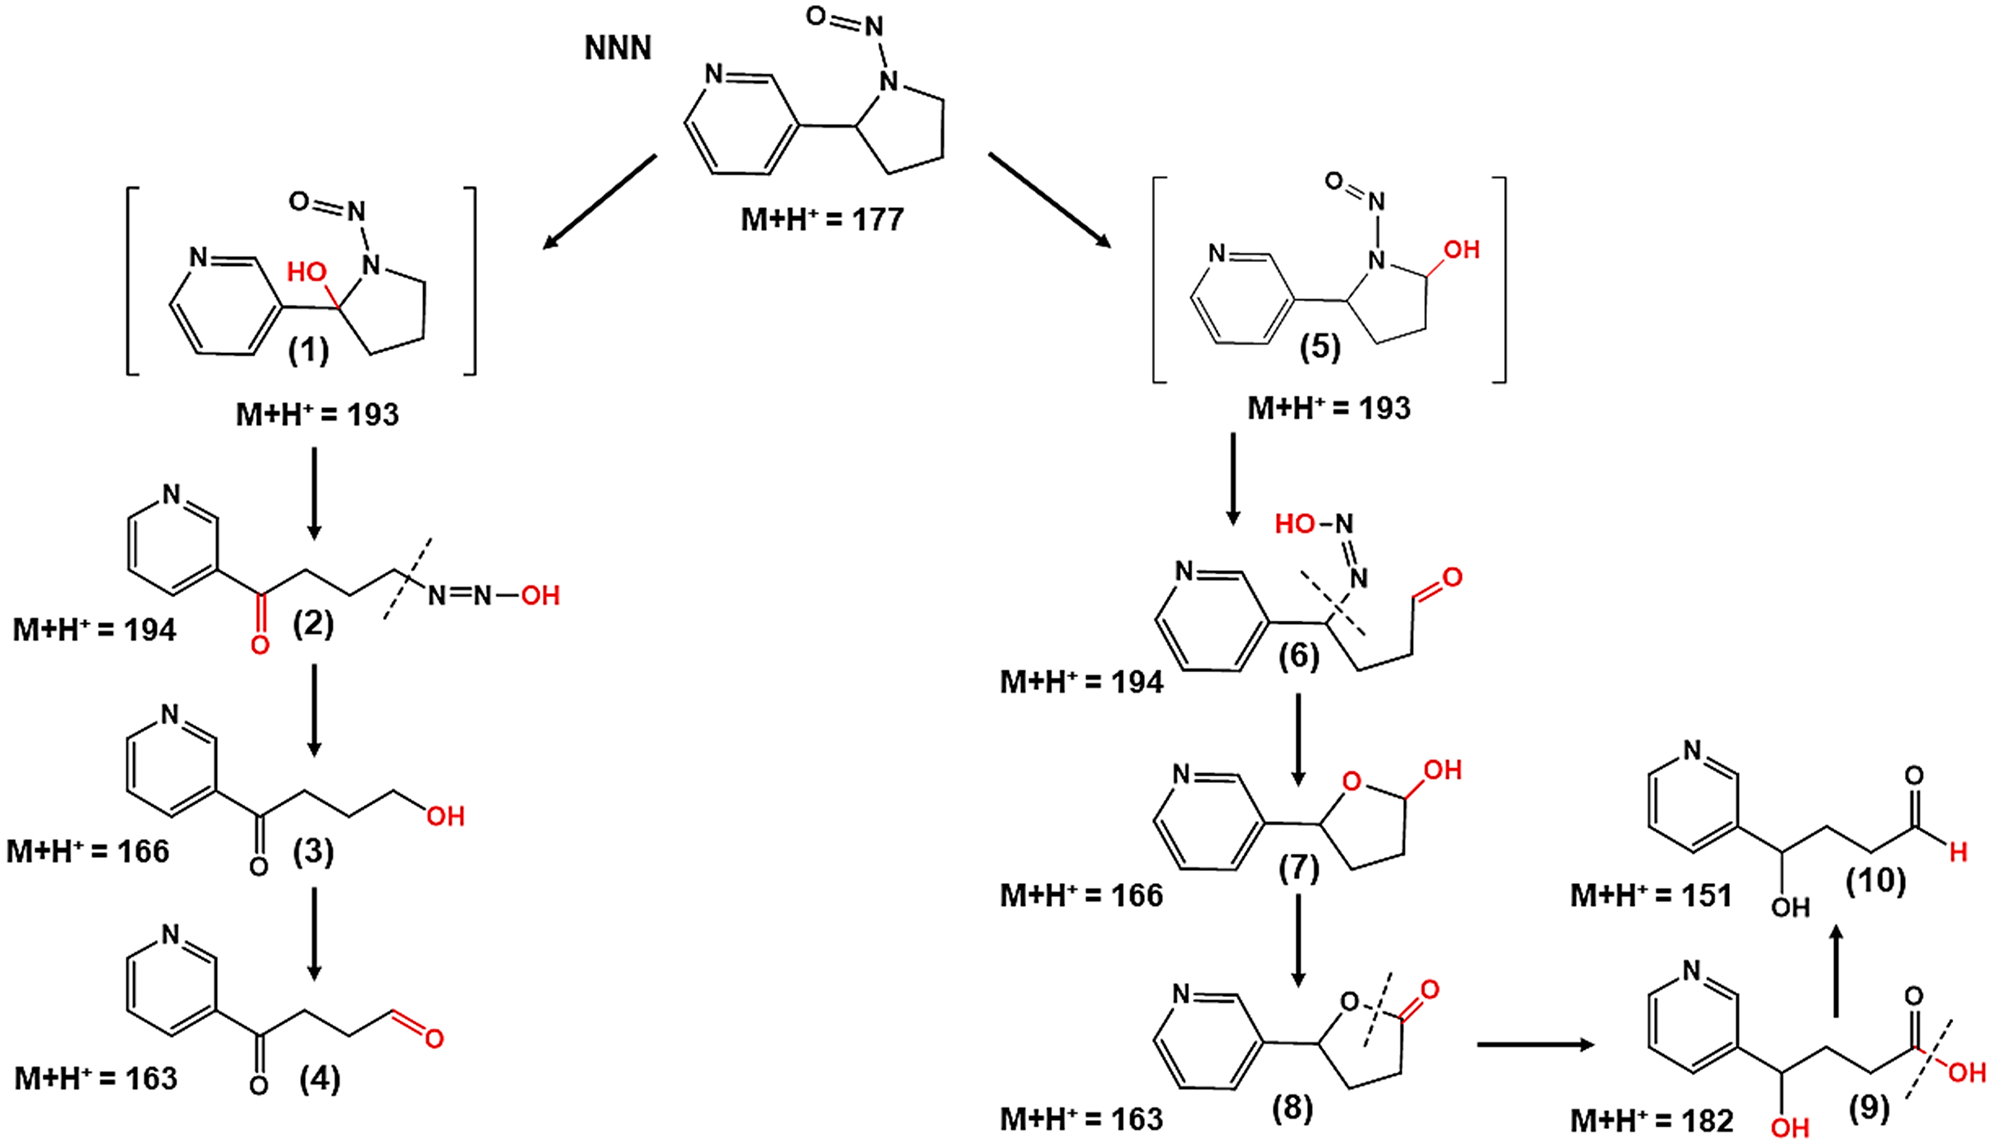
Fragmentation Patterns of NNN Metabolitesa
aThe protonated metabolites (and their m/z values) are (1, 5) 2′-hydroxy NNN and 5′-hydroxy NNN ((M + H)+ = 193.09), (2) diazohydroxide ((M + H)+ = 194.19), (3) 4-hydroxyl-1-(3-pyridyl)-1-butanone (HPB, (M + H)+ = 166.08)), (4) 4-oxo-4-(3-pyridyl)-1-butanal (OPB, (M + H)+ = 163.06)), (6) diazohydroxide, (7) 5-hydroxy-2-(3-pyridyl)tetrahydrofuran (lactol, (M + H)+ = 166.06)), (8) 5-oxo-2-(3-pyridyl)tetrahydrofuran (lactone, (M + H)+ = 163.06)), (9) 4-hydroxy-4-(3-pyridyl)butanoic acid (HPBA, (M + H)+ = 182.08)), and (10) 4-hydroxy-4-(3-pyridyl)butanal ((M + H)+ = 151.06), after incubation of 2 mM NNN with enzyme sources, the NADPH regenerating system, and 5 mM Cu2+.
Scheme 8.

Possible Mechanistic Pathway-1 for the Production of Reactive Metabolites of NNN and ROSa
aThe production of the reactive metabolites is performed via α-hydroxylation at the 2′-position of NNN, in the presence of O2, NADPH, and Cu2+. Reactive metabolites in the metabolic pathway are (1) 2′-hydroxy NNN, (2) pyridyloxobutyl diazohydroxide, (3) 4-hydroxyl-1-(3-pyridyl)-1-butanone (HPB), and (4) 4-oxo-4-(3-pyridyl)butanal (OPB).
Singlet oxygen (1O2), OH•, and H2O2 are all formed in our reactions and are used up when DNA is present (Figure 9); so that previously postulated Cu(I)OOH, as well as 1O2 and OH•, may be involved52,53 in DNA oxidation, as in Scheme 1. Based on specific reactivity of guanine, 1O2 and not OH• was proposed as the main DNA oxidant formed in Cu2+ + H2O2 solutions.54 Park at al. extended this idea to PAH o-quinone metabolites oxidized by Cu2+ + NADPH.15,16 They showed that the immediate oxidant of DNA was not OH• or Cu(I)OOH, but it was most likely 1O2. It should be noted that 1O2 forms from O2 during microsomal cyt P450 reactions,55 as we have used here. Alternatively, some studies suggested Cu2+ binding to DNA at guanine sites that act as the oxidants in Cu2+ + H2O2 solutions.51,56 Even Cu3+ could possibly be an oxidant when Cu2+ + H2O2 are present.57 Given the variety of possibilities, we detected both 1O2 and OH•, but multisource evidence suggests that OH• does not oxidize DNA in the presence of Cu2+ + H2O215,16,54 Thus, the likely oxidant in our reactions is 1O2, although we cannot rule out Cu species.
CONCLUSIONS
Nitrosamines and other carcinogenic chemicals in cigarette smoke and E-cigarette vapor may play a key role in related cancers which have become a major cause of death and disease. Results described above show that in the presence of Cu2+ and NADPH metabolites of nitrosamines NNK and NNN are capable of generating significant levels of DNA oxidation, at 4-fold higher rates in our assays than those of genotoxic 4-aminobiphenyl. Lung microsomal enzymes gave the highest rates of DNA oxidation here; lung is the main exposure route for smoking and vaping products, and lung tissue contains a significant amount of copper.58 Relevant to the current health crisis involving E-cigarette users, vapor from E-cigarettes contains 6-fold higher levels of Cu than those of cigarette smoke,59 which could enhance DNA damage rates. Both NNK and NNN metabolites facilitate production of 1O2, OH•, and H2O2 with Cu2+ and NADPH present, representing the first chemical evidence that ROS production and DNA oxidation can be facilitated by them. Possible metabolic pathways of NNK and NNN metabolites for production of ROS and DNA oxidation are suggested here for the first time.
Supplementary Material
ACKNOWLEDGMENTS
The authors thank the National Institute of Environmental Health Sciences (NIEHS), NIH, USA, Grant No. ES03154, for financial support. They also thank Prof. Emeritus John Schenkman for helpful discussions and suggestions during the inception of this project.
Footnotes
Complete contact information is available at: https://pubs.acs.org/10.1021/acs.chemrestox.0c00027
Supporting Information
The Supporting Information is available free of charge at https://pubs.acs.org/doi/10.1021/acs.chemrestox.0c00027.
Full details of chemicals and materials used and detailed experimental procedures of microfluidic device fabrication; film deposition and characterization; enzyme bioactivation and oxidation; UPLC–MS for 8-oxodG and metabolite identification and ROS detection; data that represent the correlation of ECL array results with rodent genotoxicity assays; and fragmentation patterns predicted for NNK and NNN metabolites (PDF)
The authors declare no competing financial interest.
Contributor Information
Rumasha N. T. Kankanamage, Department of Chemistry, University of Connecticut, Storrs, Connecticut 06269, United States.
Abhisek Brata Ghosh, Department of Chemistry, University of Connecticut, Storrs, Connecticut 06269, United States.
Di Jiang, Department of Chemistry, University of Connecticut, Storrs, Connecticut 06269, United States.
Karmel Gkika, School of Chemical Sciences, Dublin City University, Dublin D9, Ireland.
Tia Keyes, School of Chemical Sciences, Dublin City University, Dublin D9, Ireland;.
Laura A. Achola, Department of Chemistry, University of Connecticut, Storrs, Connecticut 06269, United States
Steven Suib, Department of Chemistry, University of Connecticut, Storrs, Connecticut 06269, United States; Institute of Material Science, Storrs, Connecticut 06269, United States;.
James F. Rusling, Department of Chemistry, University of Connecticut, Storrs, Connecticut 06269, United States; Institute of Material Science, Storrs, Connecticut 06269, United States; Department of Surgery and Neag Cancer Center, UConn Health, Farmington, Connecticut 06032, United States; School of Chemistry, National University of Ireland at Galway, Galway H91 TK33, Ireland;.
REFERENCES
- (1).Hakem R (2008) DNA-Damage Repair; the Good, the Bad, and the Ugly. EMBO J. 27 (4), 589–605. [DOI] [PMC free article] [PubMed] [Google Scholar]
- (2).Friedberg EC (2003) DNA Damage and Repair. Nature 421 (6921), 436–440. [DOI] [PubMed] [Google Scholar]
- (3).Dubois M, Grosse Y, Thome JP, Kremers P, and Pfohl-Leszkowicz A (1997) Metabolic Activation and DNA-Adducts Detection as Biomarkers of Chlorinated Pesticide Exposures. Biomarkers 2 (1), 17–24. [DOI] [PubMed] [Google Scholar]
- (4).Hvastkovs EG, Schenkman JB, and Rusling JF (2012) Metabolic Toxicity Screening Using Electrochemiluminescence Arrays Coupled with Enzyme-DNA Biocolloid Reactors and Liquid Chromatography–Mass Spectrometry. Annu. Rev. Anal. Chem 5 (1), 79. [DOI] [PMC free article] [PubMed] [Google Scholar]
- (5).Hvastkovs EG, and Rusling JF (2016) State-of-the-Art Metabolic Toxicity Screening and Pathway Evaluation. Anal. Chem 88, 4584–4599. [DOI] [PMC free article] [PubMed] [Google Scholar]
- (6).Guengerich FP (2006) Cytochrome P450s and Other Enzymes in Drug Metabolism and Toxicity. AAPS J. 8 (1), 12. [DOI] [PMC free article] [PubMed] [Google Scholar]
- (7).Oikawa S (2005) Sequence-Specific DNA Damage by Reactive Oxygen Species: Implications for Carcinogenesis and Aging. Environ. Health Prev. Med 10 (2), 65–71. [DOI] [PMC free article] [PubMed] [Google Scholar]
- (8).Spencer WA, Vadhanam MV, Jeyabalan J, and Gupta RC (2012) Oxidative DNA Damage Following Microsome/Cu(II)-Mediated Activation of the Estrogens, 17β-Estradiol, Equilenin, and Equilin: Role of Reactive Oxygen Species. Chem. Res. Toxicol 25 (2), 305–314. [DOI] [PubMed] [Google Scholar]
- (9).Jiang D, Malla S, Fu Y, Choudhary D, and Rusling JF (2017) Direct LC-MS/MS Detection of Guanine Oxidations in Exon 7 of the P53 Tumor Suppressor Gene. Anal. Chem 89 (23), 12872–12879. [DOI] [PMC free article] [PubMed] [Google Scholar]
- (10).David SS, O’Shea VL, and Kundu S (2007) Base-Excision Repair of Oxidative DNA Damage. Nature 447 (7147), 941–950. [DOI] [PMC free article] [PubMed] [Google Scholar]
- (11).Valavanidis A, Vlachogianni T, and Fiotakis C (2009) 8-Hydroxy-2′ -Deoxyguanosine (8-OHdG): A Critical Biomarker of Oxidative Stress and Carcinogenesis. J. Environ. Sci. Heal. Part C 27 (2), 120–139. [DOI] [PubMed] [Google Scholar]
- (12).Cadet J, Douki T, and Ravanat JL (2010) Oxidatively Generated Base Damage to Cellular DNA. Free Radical Biol. Med 49 (1), 9–21. [DOI] [PubMed] [Google Scholar]
- (13).Jiang D, and Rusling JF (2019) Oxidation Chemistry of DNA and P53 Tumor Suppressor Gene. ChemistryOpen 8, 252–265. [DOI] [PMC free article] [PubMed] [Google Scholar]
- (14).Hecht SS (1999) Tobacco Smoke Carcinogens and Lung Cancer. J. Natl. Cancer Inst 91 (14), 1194–1210. [DOI] [PubMed] [Google Scholar]
- (15).Park JH, Gopishetty S, Szewczuk LM, Troxel AB, Harvey RG, and Penning TM (2005) Formation of 8-Oxo-7,8-Dihydro-2′-Deoxyguanosine (8-Oxo-DGuo) by PAH o-Quinones: Involvement of Reactive Oxygen Species and Copper(II)/Copper(I) Redox Cycling. Chem. Res. Toxicol 18 (6), 1026–1037. [DOI] [PMC free article] [PubMed] [Google Scholar]
- (16).Park JH, Troxel AB, Harvey RG, and Penning TM (2006) Polycyclic Aromatic Hydrocarbon (PAH) o-Quinones Produced by the Aldo-Keto-Reductases (AKRs) Generate Abasic Sites, Oxidized Pyrimidines, and 8-Oxo-DGuo via Reactive Oxygen Species. Chem. Res. Toxicol 19 (5), 719–728. [DOI] [PMC free article] [PubMed] [Google Scholar]
- (17).US Department of Health and Human Services (2010) How Tobacco Smoke Causes Disease: The Biology and Behavioral Basis for Smoking-Attributable Disease, Atlanta, GA, https://www.ncbi.nlm.nih.gov/books/NBK53017/. [Google Scholar]
- (18).Hukkanen J, Jacob P, and Benowitz NL (2005) Metabolism and Disposition Kinetics of Nicotine. Pharmacol. Rev 57 (1), 79–115. [DOI] [PubMed] [Google Scholar]
- (19).Tutka P, Mosiewicz J, and Wielosz M (2005) Pharmacokinetics and Metabolism of Nicotine. Pharmacol. Rep 57 (2), 143–153. [PubMed] [Google Scholar]
- (20).Pérez-Ortuño R, Martínez-Sánchez JM, Fu M, Ballbè M, Quirós N, Fernández E, and Pascual JA (2016) Assessment of Tobacco Specific Nitrosamines (TSNAs) in Oral Fluid as Biomarkers of Cancer Risk: A Population-Based Study. Environ. Res 151, 635–641. [DOI] [PubMed] [Google Scholar]
- (21).Hecht SS, Hochalter JB, Villalta PW, and Murphy SE (2000) 2′-Hydroxylation of Nicotine by Cytochrome P450 2A6 and Human Liver Microsomes: Formation of a Lung Carcinogen Precursor. Proc. Natl. Acad. Sci. U. S. A 97 (23), 12493–12497. [DOI] [PMC free article] [PubMed] [Google Scholar]
- (22).Murphy SE (2017) Nicotine Metabolism and Smoking: Ethnic Differences in the Role of P450 2A6. Chem. Res. Toxicol 30 (1), 410–419. [DOI] [PMC free article] [PubMed] [Google Scholar]
- (23).Hecht SS (1998) Biochemistry, Biology, and Carcinogenicity of Tobacco-Specific N-Nitrosamines. Chem. Res. Toxicol 11 (6), 559–603. [DOI] [PubMed] [Google Scholar]
- (24).Jalas JR, Hecht SS, and Murphy SE (2005) Cytochrome P450 Enzymes as Catalysts of Metabolism of 4-(Methylnitrosamino)-1-(3-Pyridyl)-1-Butanone, a Tobacco Specific Carcinogen. Chem. Res. Toxicol 18 (2), 95–110. [DOI] [PubMed] [Google Scholar]
- (25).Hecht SS (2003) Tobacco Carcinogens, Their Biomarkers and Tobacco-Induced Cancer. Nat. Rev. Cancer 3 (10), 733–744. [DOI] [PubMed] [Google Scholar]
- (26).IARC (2019) IARC Monographs on the Evaluation of Carcinogenic Risks to Humans, IARC, July 7, https://monographs.iarc.fr/monographs-available/?search=july+7%2C+2019. [Google Scholar]
- (27).Farsalinos KE, Gillman G, Poulas K, and Voudris V (2015) Tobacco-Specific Nitrosamines in Electronic Cigarettes: Comparison between Liquid and Aerosol Levels. Int. J. Environ. Res. Public Health 12 (8), 9046–9053. [DOI] [PMC free article] [PubMed] [Google Scholar]
- (28).Kotandeniya D, Carmella SG, Pillsbury ME, and Hecht SS (2015) Combined Analysis of N′-Nitrosonornicotine and 4-(Methylnitrosamino)-1-(3-Pyridyl)-1-Butanol in the Urine of Cigarette Smokers and e-Cigarette Users. J. Chromatogr. B: Anal. Technol. Biomed. Life Sci 1007, 121–126. [DOI] [PMC free article] [PubMed] [Google Scholar]
- (29).McIntee EJ, and Hecht SS (2000) Metabolism of N′-Nitrosonornicotine Enantiomers by Cultured Rat Esophagus and in Vivo in Rats. Chem. Res. Toxicol 13 (3), 192–199. [DOI] [PubMed] [Google Scholar]
- (30).Hecht SS, Stepanov I, and Carmella SG (2016) Exposure and Metabolic Activation Biomarkers of Carcinogenic Tobacco-Specific Nitrosamines. Acc. Chem. Res 49 (1), 106–114. [DOI] [PMC free article] [PubMed] [Google Scholar]
- (31).Song B, Pan S, Tang C, Li D, and Rusling JF (2013) Voltammetric Microwell Array for Oxidized Guanosine in Intact Ds-DNA. Anal. Chem 85 (22), 11061–11067. [DOI] [PMC free article] [PubMed] [Google Scholar]
- (32).Hecht SS (1999) DNA Adduct Formation from Tobacco-Specific N-Nitrosamines. Mutat. Res., Fundam. Mol. Mech. Mutagen 424 (1–2), 127–142. [DOI] [PubMed] [Google Scholar]
- (33).Liu X, Zhang J, Wang L, Yang B, Zhang C, Liu W, and Zhou J (2016) In Vitro Metabolism of N′-Nitrosonornicotine Catalyzed by Cytochrome P450 2A13 and Its Inhibition by Nicotine, N′-Nitrosoanatabine and N′-Nitrosoanabasine. Chem.-Biol. Interact 260, 263–269. [DOI] [PubMed] [Google Scholar]
- (34).Chung FL, and Xu Y (1992) Increased 8-Oxodeoxyguanosine Levels in Lung DNA of A/J Mice and F344 Rats Treated with the Tobacco-Specific Nitrosamine 4-(Methyhiitrosamine)-l-(3-Pyridyl)-1-Butanone. Carcinogenesis 13 (7), 1269–1272. [DOI] [PubMed] [Google Scholar]
- (35).Yamaguchi R, Hirano T, Asami S, Kasai H, et al. (1996) Increase of a Type of Oxidative DNA Damage, 8-Hydroxyguanine, and Its Repair Activity in Human Leukocytes by Cigarette Smoking. Cancer Res. 56 (11), 2546–2549. [PubMed] [Google Scholar]
- (36).Sipowicz MA, Amin S, Desai D, Kasprzak KS, and Anderson LM (1997) Oxidative DNA Damage in Tissues of Pregnant Female Mice and Fetuses Caused by the Tobacco-Specific Nitrosamine, 4-(Methylnitrosamino)-1-(3-Pyridyl)-1-Butanone (NNK). Cancer Lett. 117 (1), 87–91. [DOI] [PubMed] [Google Scholar]
- (37).Asami S, Manabe H, Miyake J, Tsurudome Y, Hirano T, Yamaguchi R, Itoh H, and Kasai H (1997) Cigarette Smoking Induces an Increase in Oxidative DNA Damage, 8- Hydroxydeoxyguanosine, in a Central Site of the Human Lung. Carcinogenesis 18 (9), 1763–1766. [DOI] [PubMed] [Google Scholar]
- (38).Bist I, Song B, Mosa IM, Keyes TE, Martin A, Forster RJ, and Rusling JF (2016) Electrochemiluminescent Array to Detect Oxidative Damage in Ds-DNA Using [Os(Bpy)2(Phen-Benz-COOH)]2+/Nafion/Graphene Films. ACS Sensors 1 (3), 272–278. [DOI] [PMC free article] [PubMed] [Google Scholar]
- (39).Bist I, Bhakta S, Jiang D, Keyes TE, Martin A, Forster RJ, and Rusling JF (2017) Evaluating Metabolite-Related DNA Oxidation and Adduct Damage from Aryl Amines Using a Microfluidic ECL Array. Anal. Chem 89 (22), 12441–12449. [DOI] [PMC free article] [PubMed] [Google Scholar]
- (40).Kadimisetty K, Malla S, and Rusling JF (2017) Automated 3D Printed Arrays to Evaluate Genotoxic Chemistry: E-Cigarettes and Water Samples. ACS Sensors 2 (5), 670–678. [DOI] [PMC free article] [PubMed] [Google Scholar]
- (41).Lvov YM, Lu Z, Schenkman JB, Zu X, and Rusling JF (1998) Direct Electrochemistry of Myoglobin and Cytochrome P450cam in Alternate Layer-by-Layer Films with DNA and Other Polyions. J. Am. Chem. Soc 120, 4073–4080. [Google Scholar]
- (42).Wasalathanthri DP, Malla S, Bist I, Tang CK, Faria RC, and Rusling JF (2013) High-Throughput Metabolic Genotoxicity Screening with a Fluidic Microwell Chip and Electrochemiluminescence. Lab Chip 13 (23), 4554–4562. [DOI] [PMC free article] [PubMed] [Google Scholar]
- (43).Dennany L, Forster RJ, White B, Smyth M, and Rusling JF (2004) Direct Electrochemiluminescence Detection of Oxidized DNA in Ultrathin Films Containing [Os(Bpy)2(PVP)10]2+. J. Am. Chem. Soc 126 (28), 8835–8841. [DOI] [PubMed] [Google Scholar]
- (44).Ekins S, and Wrighton SA (1999) The Role of CYP2B6 in Human Xenobiotic Metabolism. Drug Metab. Rev 31 (3), 719–754. [DOI] [PubMed] [Google Scholar]
- (45).Carcinogenic Potency Database, https://www.nlm.nih.gov/databases/download/cpdb.html.
- (46).Cadet J, Delatour T, Douki T, Gasparutto D, Pouget JP, Ravanat JL, and Sauvaigo S (1999) Hydroxyl Radicals and DNA Base Damage. Mutat. Res., Fundam. Mol. Mech. Mutagen 424 (1–2), 9–21. [DOI] [PubMed] [Google Scholar]
- (47).Nosaka Y, and Nosaka AY (2017) Generation and Detection of Reactive Oxygen Species in Photocatalysis. Chem. Rev 117 (17), 11302–11336. [DOI] [PubMed] [Google Scholar]
- (48).Moussa H, Merlin C, Dezanet C, Balan L, Medjahdi G, Ben-Attia M, and Schneider R (2016) Trace Amounts of Cu2+ Ions Influence ROS Production and Cytotoxicity of ZnO Quantum Dots. J. Hazard. Mater 304, 532–542. [DOI] [PubMed] [Google Scholar]
- (49).Imlay JA, and Linn S (1988) DNA Damage and Oxygen Radical Toxicity. Science 240 (4857), 1302–1309. [DOI] [PubMed] [Google Scholar]
- (50).Flors C, Fryer MJ, Waring J, Reeder B, Bechtold U, Mullineaux PM, Nonell S, Wilson MT, and Baker NR (2006) Imaging the Production of Singlet Oxygen in Vivo Using a New Fluorescent Sensor, Singlet Oxygen Sensor Green(R). J. Exp. Bot 57 (8), 1725–1734. [DOI] [PubMed] [Google Scholar]
- (51).Oikawa S, and Kawanishi S (1996) Site-Specific DNA Damage Induced by NADH in the Presence of Copper(II): Role of Active Oxygen Species. Biochemistry 35 (14), 4584–4590. [DOI] [PubMed] [Google Scholar]
- (52).Schweigert N, Acero JL, von Gunten U, Canonica S, Zehnder AJB, and Eggen RIL (2000) DNA Degradation by the Mixture of Copper and Catechol Is Caused by DNA-Copper-Hydroperoxo Complexes, Probably DNA-Cu(I)OOH. Environ. Mol. Mutagen 36 (1), 5. [DOI] [PubMed] [Google Scholar]
- (53).Murata M, Tamura A, Tada M, and Kawanishi S (2001) Mechanism of Oxidative DNA Damage Induced by Carcinogenic 4-Aminobiphenyl. Free Radical Biol. Med 30 (7), 765–773. [DOI] [PubMed] [Google Scholar]
- (54).Frelon S, Douki T, Favier A, and Cadet J (2003) Hydroxyl Radical Is Not the Main Reactive Species Involved in the Degradation of DNA Bases by Copper in the Presence of Hydrogen Peroxide. Chem. Res. Toxicol 16, 191–197. [DOI] [PubMed] [Google Scholar]
- (55).Yasui H, Hayashi S, and Sakurai H (2005) Possible Involvement of Singlet Oxygen Species as Multiple Oxidants in P450 Catalytic Reactions. Drug Metab. Pharmacokinet 20 (1), 1–13. [DOI] [PubMed] [Google Scholar]
- (56).White B, Tarun MC, Gathergood N, Rusling JF, and Smyth MR (2005) Oxidised Guanidinohydantoin (Ghox) and Spiroiminodihydantoin (Sp) Are Major Products of Iron- and Copper-Mediated 8-Oxo-7,8-Dihydroguanine and 8-Oxo-7,8-Dihydro-2′-Deoxyguanosine Oxidation. Mol. BioSyst 1 (5–6), 373–381. [DOI] [PubMed] [Google Scholar]
- (57).Pham AN, Xing G, Miller CJ, and Waite TD (2013) Fenton-like Copper Redox Chemistry Revisited: Hydrogen Peroxide and Superoxide Mediation of Copper-Catalyzed Oxidant Production. J. Catal 301, 54–64. [Google Scholar]
- (58).Adachi S, Takemoto K, Ohshima S, Shimizu Y, and Takahama M (1991) Metal Concentrations in Lung Tissue of Subjects Suffering from Lung Cancer. Int. Arch. Occup. Environ. Health 63 (3), 193–197. [DOI] [PubMed] [Google Scholar]
- (59).Lerner CA, Sundar IK, Watson RM, Elder A, Jones R, Done D, Kurtzman R, Ossip DJ, Robinson R, McIntosh S, and Rahman I (2015) Environmental Health Hazards of E-Cigarettes and Their Components: Oxidants and Copper in e-Cigarette Aerosols. Environ. Pollut 198, 100–107. [DOI] [PMC free article] [PubMed] [Google Scholar]
Associated Data
This section collects any data citations, data availability statements, or supplementary materials included in this article.


