Abstract
The variations of mechanical properties in soft tissues are biomarkers used for clinical diagnosis and disease monitoring. Optical coherence elastography (OCE) has been extensively developed to investigate mechanical properties of various biological tissues. These methods are generally based on time-domain data and measure the time-of-flight of the localized shear wave propagations to estimate the group velocity. However, there is considerable information that can be obtained from examining the mechanical properties such as wave propagation velocities at different frequencies. Here we propose a method to evaluate phase velocity, wave velocity at various frequencies, in four-dimensional space (x, y, z, f), called 4D-OCE phase velocity. The method enables local estimates of the phase velocity of propagating mechanical waves in a medium. We acquired and analyzed data with this method from a homogeneous reference phantom, a heterogeneous phantom material with four different excitation cases, and ex vivo porcine kidney tissue. The 3D-OCE group velocity was also estimated to compare with 4D-OCE phase velocity. Moreover, we performed numerical simulation of wave propagations to illustrate the boundary behavior of the propagating waves. The proposed 4D-OCE phase velocity is capable of providing further information in OCE to better understand the spatial variation of mechanical properties of various biological tissues with respect to frequency.
1. Introduction
Tissue mechanics have been widely studied for the past two decades because mechanical properties are significantly associated with disease states. For example, prominent changes of mechanical properties in tissues occur in conditions related to fibrosis and cancer [1]. In these two diseases, three-dimensional extracellular matrix (ECM) fibers interact with fibroblast proliferation and differentiation to increase tissue stiffness [2]. In addition, cells themselves not only dominate the machinery responding to many types of mechanical forces such as stiffness from cytoskeleton but associate with their surrounding microenvironment, which alters mechanical properties of tissues. In the case of cancer, abnormal cell proliferation increases the solid stress caused by growing tumors in a constrained physical volume, which compresses surrounding healthy tissue and eventually increases the stiffness of malignant lesions [1]. Hence, mechanical properties of tissue are important features for tissue characterization in order to better understand various physiological conditions and disease states [3].
Wave propagation velocity has been extensively used in ultrasound shear wave elastography (SWE) [4–8] and magnetic resonance elastography (MRE) [9,10] to evaluate elastic and viscoelastic biomechanical properties of human soft tissues in clinical applications. Typically, the spatial scales of SWE and MRE images are in the ranges of millimeters so that its ability constrains in macroscopic levels with organ-size field-of-view (FOV) [3,11]. Optical coherence tomography (OCT) is a modality that can be used to image tissue displacements on a micron-scale with sub-millimeter-scale penetration depth [11]. The OCT elastography, named optical coherence elastography (OCE), was first proposed by J. Schmitt in 1998 to assess mechanical properties of biological tissue by deformation [12]. OCE has become a popular technology used to investigate mechanical properties of small tissues due to a number of advantages, such as noncontact, high spatial resolution and high sensitivity to the topology of a surface [3,13]. Numerous reports have shown the capability of OCE combined with shear wave propagation or surface wave propagation in two-dimensional (2D) space to characterize mechanical properties of skin [14], chicken breast [15], rat tumor tissue [16], prostate cancer [17], carotid artery [18] and cornea, retinal and lens in the eye especially [3,19–24].
Three-dimensional (3D) OCE, usually in x, y, t domain, is able to directly observe the changes of mechanical properties of heterogeneous materials or in vitro or in vivo biological tissues in both lateral and depth directions for physiological and pathological studies [25,26]. 3D-OCE data can be acquired by using multiple B-scans [26] or by using full-field OCT (FF-OCT) [27,28]. Although static 3D-OCE has been successfully coupled with FF-OCT to realize elasticity maps, the inaccessible local stress and a lack of quantitative information are drawbacks [27]. On the other hand, FF-OCT based on parallel detections uses laterally scattered light, which creates optical crosstalk and significantly impairs the interpretation in subcellular images [29]. Acoustic radiation force combined with traditional OCT [13,18,23,30–33] or FF-OCT [34] is a robust and reliable method for measuring the group velocity (Cg) of shear wave propagation and to quantify mechanical properties of biological tissues from transient elastography. The four-dimensional (4D) OCE, in x, y, z and t (i.e. three space dimensions plus time), with acoustic micro-tapping excitation has been applied to generate transient displacement of a mechanical wave propagation in order to quantify dynamic elastography in ex vivo porcine cornea [19].
Regardless of 3D or 4D-OCE, these methods are generally based on time-domain data and measure the time-of-flight of the localized shear wave propagations. Cross-correlation with various window sizes to evaluate shear wave motion affect the results of 2D shear wave velocity maps [35]. A frequency-domain approach that utilizes a 2D Fourier transform (2D-FT) has been used to evaluate shear phase velocity (Cp) dispersion and has the ability to observe various mechanical properties of tissues corresponded with viscoelasticity and geometry of diverse materials [5,36,37]. Here, we first report 4D-OCE phase velocity Cp,4D, x, y, z and f (i.e. three space dimensions plus frequency), in heterogeneous materials and a biological tissue, porcine kidney. The method can be beneficial to evaluate viscoelastic mechanical properties of various biological tissues.
Many articles report the group velocity found in the time domain. In these cases, the wave speed is assumed to be constant, and the medium is usually assumed to be a simple model such as elastic, homogeneous, isotropic and linear. However, in actual cases, biological tissues are a viscoelastic medium, so the wave velocity varies with frequency. Based on the relationship between wave velocities and frequencies (dispersion), the viscoelasticity (elasticity and viscosity) of a medium can be evaluated. In addition, various geometries of materials can also cause dispersion. This includes biological tissues with finite thickness such as arteries, myocardium, bladder wall, tendons, cornea, and lens in the eye [38]. Therefore, phase velocity measurement is important because it can be used to characterize biological materials that exhibit wave velocity dispersion due to viscoelasticity, geometry, or both. A customized 2D scan pattern was built to create 4D-OCT dynamic wave propagation maps (x, y, z, t). The proposed method was applied to a homogeneous reference phantom, a heterogeneous gelatin phantom with four different excitation cases and ex vivo kidney tissue. The 3D-OCE group velocity maps Cg,3D were estimated to make comparison with 4D-OCE phase velocity Cp,4D maps. Numerical simulation of wave propagations in the heterogeneous material was performed to compare with our experimental results.
2. Materials and methods
2.1. Fabrication of a homogeneous phantom
A reference phantom, 400 mM micellar fluid, was fabricated using surfactant, hexadecyltrimethyl ammonium bromide (CTAB, O3042, Thermo Fisher Scientific, Hanover Park, IL, USA) and sodium salicylate (NaSal, S2679, Sigma-Aldrich, St. Louis, MO, USA). The molar concentration ratio of CTAB to NaSal was 5:3 to maximize micelle length [39,40]. The molar mass of CTAB and NaSal are 364.45 g/mol and 160.11 g/mol, respectively. A total volume of 200 mL distilled water in each concentration was distributed in 80 mL for CTAB, 80 mL for NaSal, and 40 mL for scatterers in three individual beakers and heated to 70°C. The CTAB and NaSal were added to the separate beakers while stirring taking approximately 30 minutes to homogenize the solutions. Once the solutions in both beakers became homogeneous, scatterers were first added to the beakers with CTAB and then mixed with NaSal while stirring. The mixed solution was covered to avoid evaporation and stirred with the speed of 250 revolutions per minute (rpm) for 5 hours at 50°C. The micellar fluids were transferred to Petri dishes for cooling to room temperature and the thickness of micellar fluids was approximately 5 mm in the OCE experiment. The calculation of the molar concentrations in 400 mM can be reached in our previous article for more details [41].
2.2. Fabrication of a heterogeneous phantom
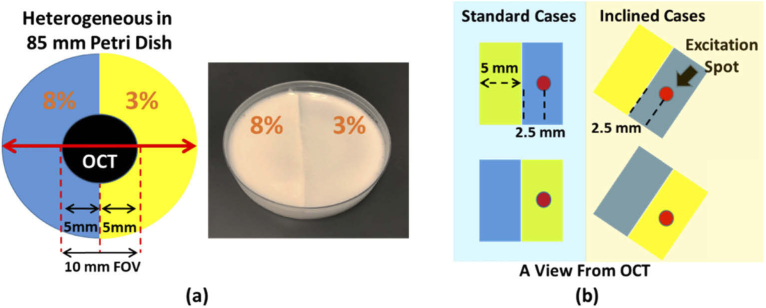
A heterogeneous phantom (3% v/v versus 8% v/v) was fabricated using gelatin powder (gel strength 300 type A, G2500-1KG, Sigma-Aldrich, St. Louis, MO, USA) mixed with 1 g titanium dioxide (TiO2) to provide optical scattering. A total volume of 100 mL tap water in beaker was heated to 70 °C and 8% v/v gelatin powder and 1 g TiO2 were added with stirring to the beaker for approximately 5 minutes to homogenize the solution. The mixed solution was placed in a de-gassing chamber to remove small bubbles in the fluid. After that, the mixed solution was poured into a custom Petri dish (85 mm × 10 mm) with Mylar film bottom and placed in a 4 °C refrigerator for fast congealing. The thickness of the Mylar film is only 100 µm and acoustically transparent; therefore, the acoustic radiation force (ARF) will be only weakly attenuated [42,43]. A small baffle was placed in the middle of the custom Petri dish to create a half circle shape of the phantom for one concentration, illustrated in Fig. 1(a). The small baffle was removed once the 8% gelatin was completely congealed. The 3% gelatin phantom was created using the above description and poured into the other side of the custom Petri dish. The thickness of the heterogeneous phantom was approximate 8 mm in the study. Based on this method, the boundary in the heterogeneous phantom was distinct. Four different excitation cases were used, i.e. excitation spot in 8% or 3% gelatin with a vertical boundary (standard cases) or inclined boundary (inclined cases) with respect to the OCT scan pattern, presented in Fig. 1(b). The distance between the excitation spot and the boundary is 2.5 mm.
Fig. 1.
(a) A 85 mm dimeter heterogeneous phantom was composed of 8% and 3% gelatin. (b) Two excitation cases were considered, standard cases (vertical boundary with respect to the OCT scan pattern) and inclined cases (inclined boundary with respect to the OCT scan pattern). The excitation on the 8% and 3% gelatin are called case A and case B, respectively.
2.3. Numerical simulation of wave propagations in heterogeneous phantoms
The numerical model was applied to simulate mechanical wave propagations in the heterogeneous phantom in the standard cases. To excite propagating waves, a temporally compact pressure load was applied to the medium in y direction (Fig. 2) with a super Gaussian profile in time [44]. The pressure load is given by
| (1) |
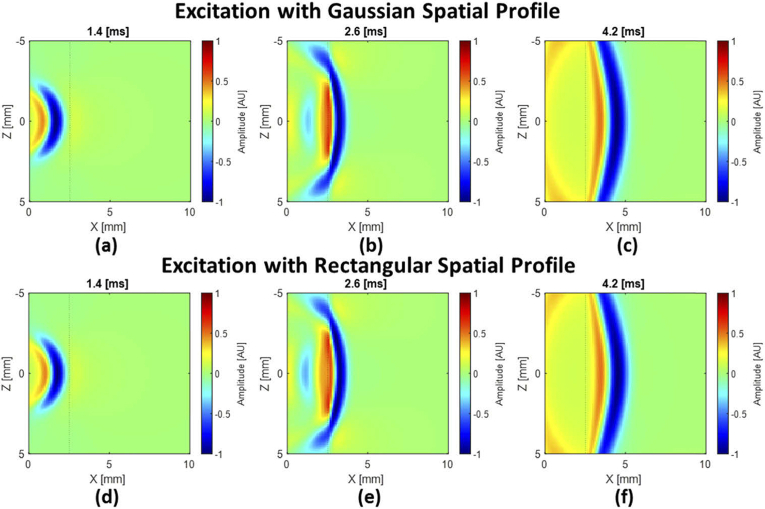
where the is the initial pressure load, T is the push duration, and is the time delay. The push duration is 200 µs and the time delay is zero in the numerical simulations. In previous studies a Gaussian spatial profile has been used [44]. However, in this study, we used a rectangular spatial profile with width 500 µm. Appendix 1 (Fig. 12) displays a comparison of the 2D particle velocity profiles at three different time frames using the Gaussian profile (upper row) and the rectangular profile (lower row) where the waves are almost the same. The values for the first Lame constant λ and Poisson’s ratio ν are approximately 2.25 GPa and 0.4999991 for both 3% and 8%, respectively. To observe wave behavior at the boundary of the heterogeneous phantoms, we used a two-dimensional finite difference (2D-FD) based approach. The material in the 2D-FD technique for the Kelvin-Voigt model for viscous loss is incorporated. For a viscoelastic, isotropic, homogeneous and nearly incompressible model for soft tissue, Navier’s equation becomes
| (2) |
where and are the first Lamé constant and shear modulus, respectively. The parameters and denote the bulk viscosity and shear viscosity, respectively. The parameter is the density, is the local particle displacement, is the induced body force and is the second derivative of the displacement with respect to time. A low viscosity of 0.1 Pas is added to the model to reduce numerical dispersion and material density is set as 1000 kg/m3. The domains were uniformly spatially sampled at 0.1 mm. The dimensions of the simulated domain in both x and y are 10 mm. For the simulation with the excitation on 8% gelatin, the and are 4 kPa and 0.49 kPa, respectively. For the simulation with the excitation on 3% v/v, the and are 0.49 kPa and 4 kPa, respectively. Superscripts I and II in the parameter represent various shear moduli assumed in the heterogeneous numerical models. The entire process was implemented in MATLAB R2019a software (Mathworks, Natick, MA, USA) using parallel computation technology.
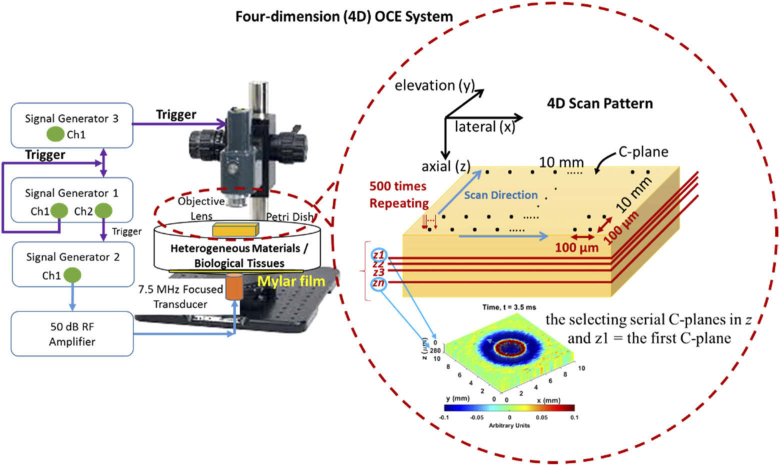
Fig. 2.
Illustration of the system structure of 4D-OCE phase velocity. The left side displays the SD-OCT scanner and ultrasound system to generate ARF. Three function generators were used to manage all signals for the whole system including ultrasound excitation signals (blue lines) and trigger signals for synchronizing all instruments (purple lines). The right side illustrates the customized 4D-OCE scan pattern.
2.4. System structure for 4D-OCE phase velocity
The 4D-OCE system consisted of an optical scanner and an acoustic radiation force (ARF) excitation to generate a transient wave, presented in Fig. 2. A spectral domain OCT (SD-OCT) system (TEL320C1, Thorlabs Inc., Newton, NJ, USA) is equipped with a 1300 nm source with low coherence broadband (236.8 nm of bandwidth) and LK3 lens kit (Thorlabs Inc., Newton, NJ, USA) to be able to produce 13 µm of lateral resolution, 3.5 µm of z-axis resolution and 3.6 mm of maximum imaging depth in air (provided by Thorlabs Inc.) within 10 mm × 10 mm FOV. The maximum imaging depth for the investigated phantoms and the kidney tissue are approximately 400-500 µm in this study. The Fast Fourier Transform (FFT) is utilized to form an A-scan from the receiver array in the SD-OCT system. The customized 2D scan pattern with 100 µm scanning step in both lateral and elevational direction was developed to collect data for 4D-OCT dynamic wave propagation maps (x, y, z, t). Each individual position was axially scanned 500 times at 10 kHz of scan rate (M-B scan) to facilitate high frame rates in order to track dynamic processes in the space-time domain [45]. Each M-B scan takes 5 seconds and the time for saving raw data in each M-B scan plus relocating the galvanometer to the next elevational position takes approximately 15 seconds (dominated by the time needed to save the data). In total, it takes approximately 2000 seconds or 33 minutes (20 seconds × 100 elevational scanning steps) for one 4D-OCE volume. The customized acquisition was developed by using SpectralRadar software development kit (SDK) 4.4 Version provided by Thorlabs Inc. in Microsoft Visual C++ 2019 development environment (Microsoft, Redmond, WA).
A 7.5 MHz highly focused single-element transducer (ISO703HR, Valpey-Fisher, Hopkinton, MA, USA) with 3,750 cycles of burst sinusoid (500 µs) was used to provide an ARF source for transient wave excitation. The focal distance was 11.84 mm measured by pulse-echo test and the f-number of 1.07 was obtained by the definition of the focal distance divided by the aperture size (11 mm). The transducer is placed under the sample and its focus is located on the sample-air interface. Three function generators were employed to manage the whole system, illustrated in Fig. 2. The burst sinusoid signal for the transducer was provided by function generator 2 (33250A, Agilent, Santa Clara, CA, USA) in the external mode and the burst signal was amplified 50 dB by a radiofrequency (RF) power amplifier (240L, Electronics and Innovation, LTD, Rochester, NY, USA) to drive the transducer. Function generator 3 (33500B, Keysight, Santa Rosa, CA, USA) was used to control the OCT scan rates and triggering. In our experiment, the OCT was axially scanned 500 times at each location with a 10 kHz scan rate; therefore, the necessary time to complete a whole scan at each location was 50 ms, which means 20 Hz measurement rate provided by channel 2 of function generator 1 (33250A, Agilent, Santa Clara, CA, USA) and channel 1 was used to be a master trigger to synchronize the timing for the entire system.
Each pixel includes a real value and an imaginary value (in-phase/quadrature complex data) from which magnitude and phase can be calculated. Each 4D acquisition is composed of a dataset with dimensions (z, x, y, t), where z is imaging depth, x is the number of the B-scan, y is the number in elevational position and t is the number in M-scan. Autocorrelation was used to estimate shear wave particle velocity inside the phantoms and tissue [46]. A spatial median filter with 3 × 3 window size was employed to remove noise from each 2D particle motion image (z, x). A 3D-OCT dynamic wave propagation on a C-plane (x, y, t) was built by choosing an image depth z and a 4D-OCT dynamic wave propagation map (x, y, z, t) was reconstructed by selecting serial C-planes in z. The top plane of the selecting serial C-planes in z is defined as the first C-plane in the study, and it is usually located in less than 1 mm below the surface of a material. The resolution of each voxel data is 100 µm × 100 µm × 3.5 µm corresponding to x, y and z spatial dimensions. All the voxel data were used to estimate 4D-OCE phase velocity.
2.5. 4D-OCE phase velocity estimation
To measure mechanical properties of tissues corresponded with various frequencies, a 4D-OCE phase velocity estimation is first proposed in the study. The algorithm for 4D-OCE phase velocity is based on the local phase velocity-based imaging (LPVI) method developed by our group [35,36,47]. The approach deals in a k-space (frequency-wavenumber) domain to reconstruct local shear wave phase velocity maps associated with a range of selected frequency band. Generally, the transformation of the spatio-temporal particle motion data, , to the k-space is fulfilled using a three-dimensional Fourier transform (3D-FT), . This process is performed for any C-plane, denoted as z, and can be expressed as follow
| (3) |
where is a 3D k-space representation in terms of the wavenumber vectors along the x and y directions. For a particular frequency , the 3D k-space can be expressed as . Here, a first-order Butterworth bandpass filter and a multi-angle directional filter in the wavenumber domain were applied to separate omnidirectional shear wave propagations in the investigated phantoms and tissues [48,49]. The angular increment was set as 20° in this study to balance the accuracy and computational time [35]. This process can be interpreted as the product between the particle motions in frequency-wavenumber domain and a filter function. Hence, Eq. (3) can be written as
| (4) |
where is the 2D filter in the frequency-wavenumber domain and is the filtered spectrum. An inverse two-dimensional Fourier transform (i2D-FT) was used to convert the filtered spectrum into frequency-space domain . The frequency can be or a range of frequencies. For the 4D-OCE phase velocity estimation, the frequency starts from 40 Hz to 500 Hz with 20 Hz as a frequency interval, which is an appropriate range wide enough to cover mechanical responses of soft materials [41].
Next, the spatial domain in both x and y at a particular frequency was multiplied by a two-dimensional cosine-tapered window to break down the wavefield into numbers of sub-images over the spatial dimensions. For our experimental results, a Tukey window was used with a taper factor of 0.25 and window size was set to 20 pixels × 20 pixels (2.0 × 2.0 mm) across the spatial domains to obtain satisfactory results [35]. A set of one-dimensional wavenumber spectra at in x and y direction can be calculated by using an one-dimensional Fourier transform (1D-FT) applied to each row and column of a sub-image, respectively. The zero padding length in time and spatial dimension was set as 1024. The 1D-FT for both x and y direction on any C-planes are given by
| (5) |
for x direction, and
| (6) |
for y direction, where N is the number of scanning lines in the x and y direction. The phase velocity of a wave motion at on any C-planes can be calculated by the following equation
| (7) |
where is a wavenumber magnitude and is expressed as
| (8) |
and the arguments of and are given by
| (9) |
for evaluating the 4D-OCE phase velocity. Readers can refer to our previous articles for more details about the LPVI algorithm [35,36,47] and the multi-angle directional filter [49]. This approach was applied to the reference phantom for validation, the heterogeneous gelatin phantom with four different excitation cases and ex vivo kidney tissue. The 3D-OCE group velocity maps were reconstructed by using well-established two-dimensional shear wave speed algorithm [50,51] to compare with the 4D-OCE phase velocity evaluation. The above procedure was programmed by using MATLAB R2019a software implemented in the desktop computer with Intel Core i5-8500 CPU at 3 GHz processor, 8 GB memory and 64 bit Windows 10 operating system.
3. Results
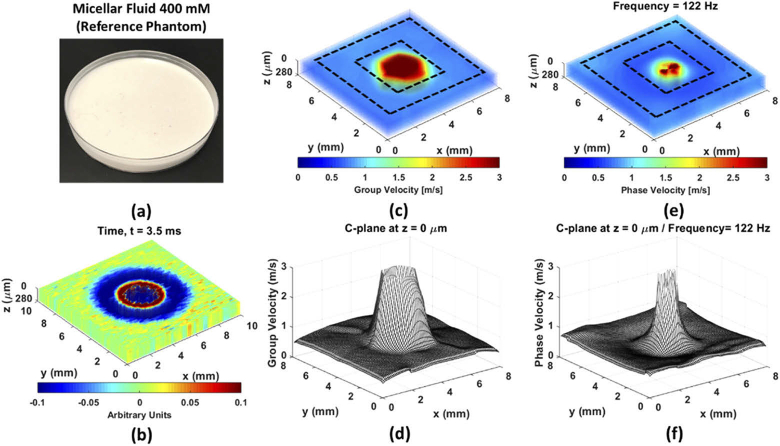
A homogeneous phantom consisted of 400 mM micellar fluid is considered as a validation phantom to test the accuracy of 4D-OCE phase velocity measurement because its mechanical properties have been thoroughly investigated [41]. The 4D-OCT dynamic wave propagation map (x, y, z, t) in 400 mM micellar fluid phantom is displayed in Fig. 3(a) and its dynamic wave propagation is shown in Visualization 1 (29.6MB, avi) . Five layers with 70 µm interval were selected to reconstruct the depth to be 280 µm. The 3D-OCE group velocity map (x, y, z) and 4D-OCE phase velocity map (x, y z, f) at = 122 Hz are illustrated in Fig. 3(b) and Fig. 3(d), respectively. The k-space can provide the range of the energy distribution to give an idea for selecting and the 122Hz is located in the energy distribution of the k-space in the 400 mM micellar fluid phantom [41]. The frequency chosen for displaying the phase velocity distribution was chosen by examining the k-space and choosing a frequency at or near the center of the energy distribution. This frequency was unique for different materials and phantom realizations. The 4D-OCE dispersive phase velocity over all frequencies is shown in Visualization 2 (2.1MB, avi) . The mesh figures, presented in Fig. 3(c) and Fig. 3(e), were utilized to show the group velocity and phase velocity on the first C-plane (i.e. at z = 0 µm) of Fig. 3(b) and Fig. 3(d) for the statistical analysis. Please note that the z = 0 µm specifies the first C-plane we selected in the reconstruction rather than top plane of OCT images. The average value with the standard deviation (SD) on the first C-plane was 0.75 ± 0.032 m/s for group velocity and 0.73 ± 0.052 m/s for phase velocity at 122 Hz, indicated by the ROI with the black dash lines in Fig. 3(b) and Fig. 3(d). The excitation area, red area in Fig. 3(b) and Fig. 3(d), was not considered for the calculation to avoid the artifact affection. These experimental results demonstrated that the 4D-OCE phase velocity represents high consistence with 3D-OCE group velocity in the test phantom at = 122 Hz. Our previous work reported the average wave velocity in the 400 mM micellar phantom was 0.748 ± 0.014 m/s [41], which also demonstrates the accuracy of the 4D-OCE phase velocity evaluation.
Fig. 3.
(a) A 400 mM micellar fluid homogeneous phantom was considered as a validation phantom to test the accuracy of 4D-OCE phase velocity. The ARF excitation is in the middle of the FOV. (b) 4D-OCT dynamic wave propagation. (c) The reconstruction of 3D-OCE group velocity. (d) The 3D-OCE group velocity on the first C-plane, indicated by the region-of-interest (ROI) with the black dash lines in (c). (e) The reconstruction of 4D-OCE phase velocity at = 122 Hz. (f) The 4D-OCE phase velocity on the first C-plane of at = 122 Hz, indicated by the ROI with the black dash lines in (e).
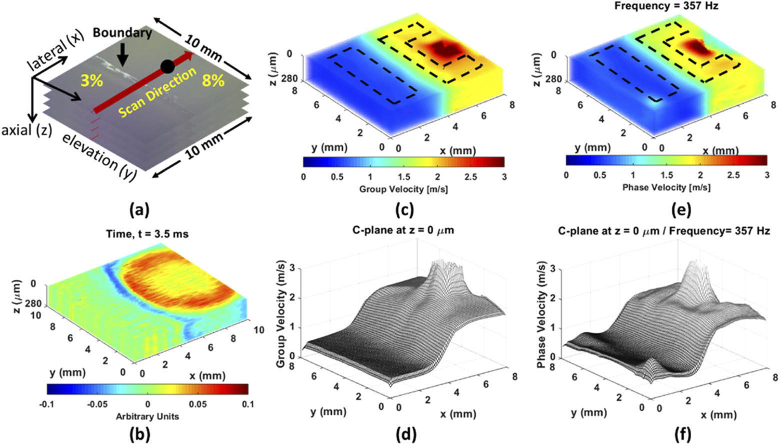
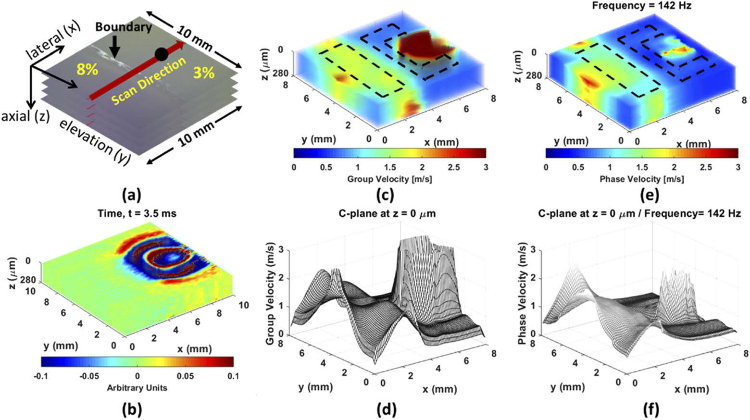
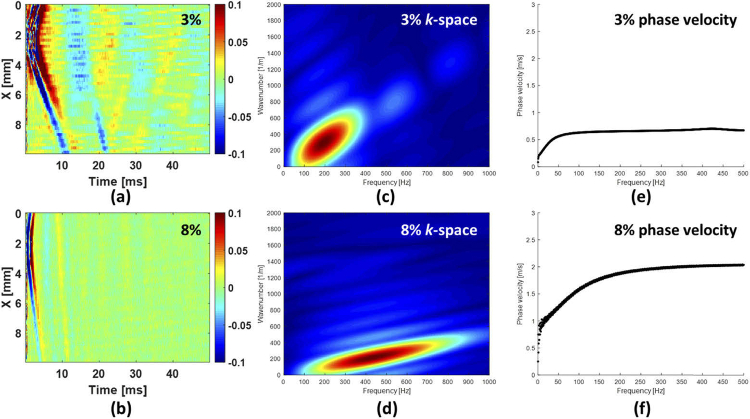
After the validation test, a heterogeneous gelatin phantom, 3% versus 8%, with a vertical boundary was used as the standard case. Based on the ratio, the wave velocity was 0.65-0.70 m/s for 3% and 1.75-1.80 m/s for 8% (Appendix 2, Fig. 13) to provide a sufficient elastic contrast. The ARF excitation was placed in the 8% gelatin (propagating from stiff to soft) as standard case A, presented in Fig. 4(a). For this case, the 4D-OCT dynamic wave propagation map depicts that the most of incident energy carried to the boundary can be transmitted through the boundary of the phantom and the wavelength immediately changed to a smaller wavelength, displayed in Fig. 4(b) and Visualization 3 (29.4MB, avi) . The 3D-OCE group velocity map and 4D-OCE phase velocity map at the particular frequency of 357 Hz are represented in Fig. 4(c) and Fig. 4(e), respectively. The average value with the SD of group velocity on the first C-plane (Fig. 4(d)) was 1.89 ± 0.09 m/s in 8% and 0.57 ± 0.01 m/s in 3%, indicated by the ROI in Fig. 4(c). The average value with SD of 4D-OCE phase velocity on the first C-plane (Fig. 4(f)) was 1.79 ± 0.10 m/s in 8% and 0.62 ± 0.06 m/s in 3%. The 4D-OCE dispersive phase velocity over all frequencies is shown as Visualization 4 (2.3MB, avi) in a video and Appendix 3 (Fig. 14) for the images. On the other hand, the ARF excitation was placed on the 3% gelatin (propagating from soft to stiff) as standard case B presented in Fig. 5. The 4D-OCT dynamic wave propagation map depicts the boundary behavior where most of incident energy is reflected and very little energy is transmitted past the boundary, displayed in Fig. 5(b) and Visualization 5 (30MB, avi) . The average value with the SD of group velocity on the first C-plane (Fig. 5(d)) was 1.66 ± 0.09 m/s in 8% and 0.69 ± 0.02 m/s in 3%, indicated by the ROI in Fig. 5(c). The average value with SD of 4D-OCE phase velocity on the first C-plane (Fig. 5(f)) at = 142 Hz was 1.61 ± 0.15 m/s in 8% and 0.65 ± 0.08 m/s in 3%, presented in Fig. 5(e) and Visualization 6 (2.4MB, avi) . According to the experimental results, our proposed method demonstrates the ability to accurately evaluate the 4D-OCE phase velocity in the heterogeneous phantom and represents significant consistency with 3D-OCE group velocity.
Fig. 4.
The heterogeneous phantom with the vertical boundary and excitation on stiff area (8%) as the standard case A. (a) The illustration of the heterogeneous phantom composed of 8% and 3% gelatin. The black solid dot is ARF excitation spot (on 8%). (b) 4D-OCT dynamic wave propagation. (c) The reconstruction of 3D-OCE group velocity. (d) The 3D-OCE group velocity on the first C-plane, indicated by the ROI with the black dash lines in (c). (e) The reconstruction of 4D-OCE phase velocity at = 357 Hz. (f) The 4D-OCE phase velocity on the first C-plane at = 357 Hz, indicated by the ROI with the black dash lines in (e).
Fig. 5.
The heterogeneous phantom with the vertical boundary and excitation on stiff area (8%) as the standard case B. (a) The illustration of the heterogeneous phantom composed of 8% and 3% gelatin. The black solid dot is ARF excitation spot (on 3%). (b) 4D-OCT dynamic wave propagations. (c) The reconstruction of 3D-OCE group velocity. (d) The 3D-OCE group velocity on the first C-plane, indicated by the ROI with the black dash lines in (c). (e) The reconstruction of 4D-OCE phase velocity at = 142 Hz. (f) The 4D-OCE phase velocity on the first C-plane at = 142 Hz, indicated by the ROI with the black dash lines in (e).
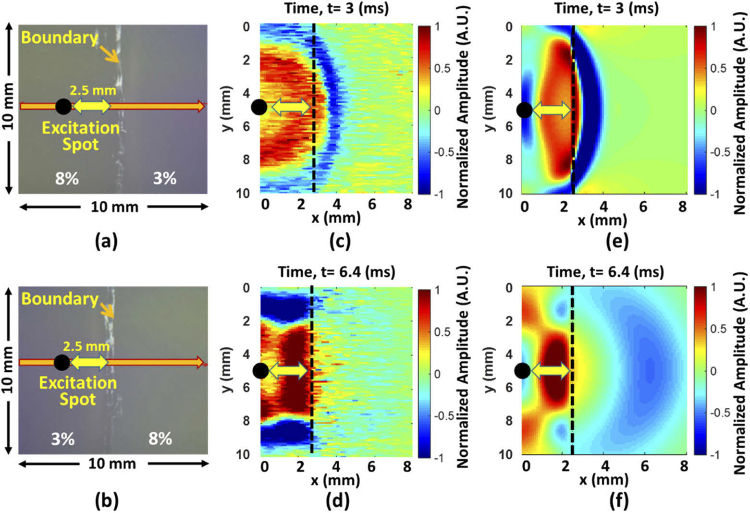
The numerical simulations of standard cases A and B are illustrated in Fig. 6(e) and Fig. 6(f), respectively. To consider the wave propagations from stiff to soft material (standard case A), the numerical simulation depicts the accurate boundary behavior that the most incident energy and momentum carried to the boundary can be transmitted at the boundary. For this case, the wavelength immediately changed to a smaller wavelength compared to the wavelength in the stiffer material. The transmitted waves are slower than incident waves, presented in Fig. 6(c) for the 2D-OCT experimental result and in Fig. 6(e) for the numerical analysis result. The videos of two results can be referred to as Visualization 7 (12.3MB, avi) and Visualization 8 (5.3MB, avi) , respectively. On the other hand, the numerical simulation demonstrates that the most incident energy is reflected at the boundary as wave propagates from soft to stiff material (standard case B). For this case, the transmitted waves immediately changed to a larger wavelength compared to the incident and reflected waves. The transmitted waves travel faster than incident waves, presented in Fig. 6(d) for the 3D-OCT experimental result (x, y, t) and in Fig. 6(f) for the numerical analysis result, where the videos are associated with Visualization 9 (8.3MB, avi) and Visualization 10 (5.6MB, avi) , accordingly.
Fig. 6.
The numerical simulation of the heterogeneous phantom with standard cases to demonstrate the boundary behavior. (a) and (b) are the illustration of the heterogeneous phantom with the ARF excitation on stiff material (8%) and soft material (3%), respectively. The distance between the excitation and boundary is approximately 2.5 mm. (c) and (d) represent the wave propagations in 3D-OCT (x, y, t) with the excitation on 8% and on 3%, respectively, and the depth of the 2D wave fields is approximately at 1 mm under the surface of the phantom. (e) The numerical simulation of the heterogeneous phantom with the excitation on 8% and (f) on 3% gelatin.
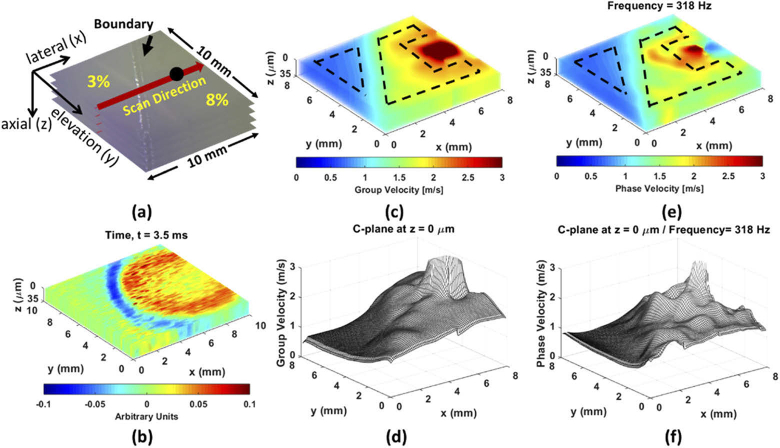
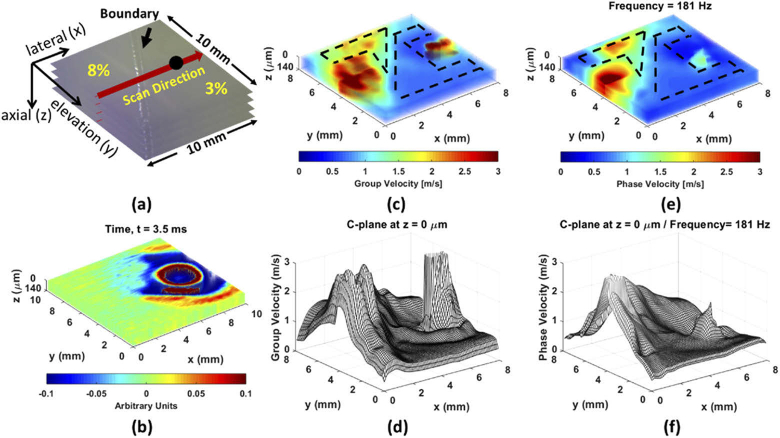
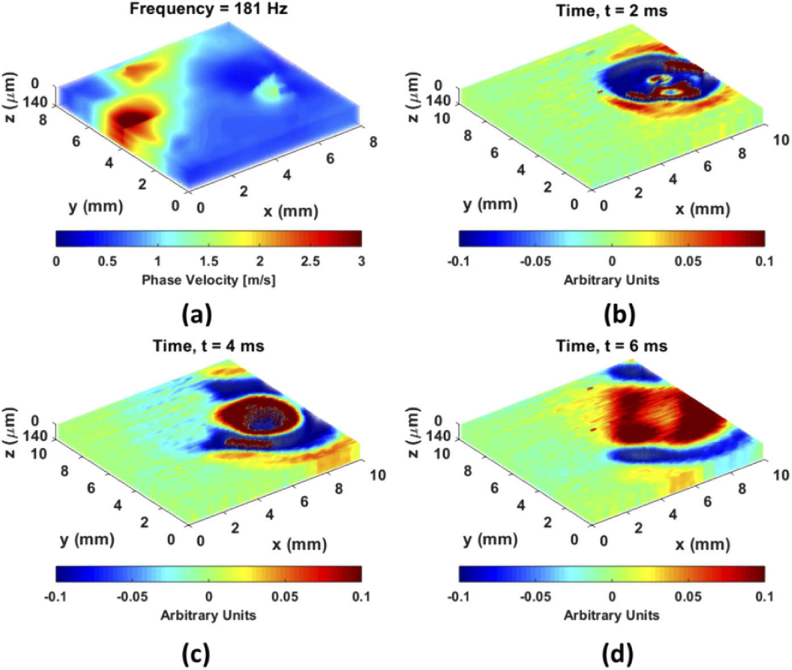
Figures 7 and 8 exhibit the heterogeneous gelatin phantom with an inclined boundary as the inclined cases. The ARF excitation was located in the 8% gelatin as the inclined case A presented in Fig. 7(a) and in the 3% gelatin as the inclined case B presented in Fig. 8(a). For inclined case A, the 4D-OCT dynamic wave propagation map also shows that a high amount of incident energy can be transmitted into the soft portion and transmitted wavelength becomes shorter than incident waves in Fig. 7(b) and Visualization 11 (29.8MB, avi) . The average value with the SD of group velocity on the first C-plane (Fig. 7(d)) was 1.83 ± 0.14 m/s in 8% and 0.73 ± 0.04 m/s in 3%, indicated by ROI in Fig. 7(c). The average value with SD of 4D-OCE phase velocity on the first C-plane (Fig. 7(f)) at = 318 Hz was 1.73 ± 0.11 m/s in 8% and 0.76 ± 0.05 m/s in 3%, presented in Fig. 7(e) and Visualization 12 (2.3MB, avi) . For inclined case B, the ARF excitation was placed on the 3% gelatin as presented in Fig. 8. The 4D-OCT dynamic wave propagation map displays that the most incident energy is reflected and very little energy is transmitted at the boundary, displayed in Fig. 8(b) and Visualization 13 (27.8MB, avi) . The average value with the SD of group velocity on the first C-plane (Fig. 8(d)) was 1.69 ± 0.15 m/s in 8% and 0.66 ± 0.03 m/s in 3%, indicated by ROI in Fig. 8(c). The average value with SD of 4D-OCE phase velocity on the first C-plane (Fig. 8(f)) at = 181 Hz was 1.71 ± 0.12 m/s in 8% and 0.63 ± 0.05 m/s in 3%, presented in Fig. 8(e) and Visualization 14 (2.3MB, avi) . Please note that the artifact in the 3% gelatin of 3D-OCE group velocity (Fig. 8(c)) and 4D-OCE phase velocity (Fig. 8(e)) derives from almost zero energy carried to that area, which leads to very small particle displacements. Figure 9 illustrated wave propagations at three different time points, 2 ms, 4 ms and 6 ms, in inclined case B. As time progresses to 6 ms, the weakly transmitted waves are traveling toward the second quadrant due to the inclined boundary (Fig. 9(d)). However, a promising result in inclined case B was still achieved by analyzing the specific region in 3% and revealed a high consistency with 3D-OCE group velocity. A summary of the 3D-OCE group velocity and 4D-OCE phase velocity at was represented in Table 1. The proposed 4D-OCE phase velocity shows the prominent performance in the two standard cases and inclined cases in the heterogeneous material.
Fig. 7.
The heterogeneous phantom with the inclined boundary and excitation on stiff area (8%) as the inclined case A. (a) The illustration of the heterogeneous phantom composed of 8% and 3% gelatin. The black solid dot is ARF excitation spot (on 8%). (b) 4D-OCT dynamic wave propagations. (c) The reconstruction of 3D-OCE group velocity. (d) The 3D-OCE group velocity on the first C-plane, indicated by the ROI with the black dash lines in (c). (e) The reconstruction of 4D-OCE phase velocity at = 318 Hz. (f) The 4D-OCE phase velocity on the first C-plane of at = 318 Hz, indicated by the ROI with the black dash lines in (e).
Fig. 8.
The heterogeneous phantom with the inclined boundary and excitation on soft area (3%) as the inclined case B. (a) The illustration of the heterogeneous phantom composed of 8% and 3% gelatin. The black solid dot is ARF excitation spot (on 3%). (b) 4D-OCT dynamic wave propagations. (c) The reconstruction of 3D-OCE group velocity. (d) The 3D-OCE group velocity on the first C-plane, indicated by the ROI with the black dash lines in (c). (e) The reconstruction of 4D-OCE phase velocity at = 181 Hz. (f) The 4D-OCE phase velocity on the first C-plane of at = 181 Hz, indicated by the ROI with the black dash lines in (e).
Fig. 9.
The wave propagation measured with 3D-OCT at three different time points demonstrate most of energy cannot be transmitted in the heterogeneous phantom with excitation in the 3% gelatin. (a) The reconstruction artifact in the 3% gelatin in the 4D-OCE phase velocity for = 181 Hz is due to almost zero energy carried to that area. (b), (c) and (d) show 4D-OCT wave propagations at time 2 ms, 4 ms and 6 ms and illustrate the energy are reflected.
Table 1. Comparison of group velocity and phase velocity at f0 in the first C-plane of the heterogeneous materials.
| Group Velocity (m/s) |
Phase Velocity (m/s) at f0 |
f0 | |||
|---|---|---|---|---|---|
| 8% | 3% | 8% | 3% | ||
| Standard Case A | 1.89 ± 0.09 | 0.57 ± 0.01 | 1.79 ± 0.10 | 0.62 ± 0.06 | 357 Hz |
| Standard Case B | 1.66 ± 0.09 | 0.69 ± 0.02 | 1.61 ± 0.15 | 0.65 ± 0.08 | 142 Hz |
| Inclined Case A | 1.83 ± 0.14 | 0.73 ± 0.04 | 1.73 ± 0.11 | 0.76 ± 0.05 | 318 Hz |
| Inclined Case B | 1.69 ± 0.15 | 0.66 ± 0.03 | 1.71 ± 0.12 | 0.63 ± 0.05 | 181 Hz |
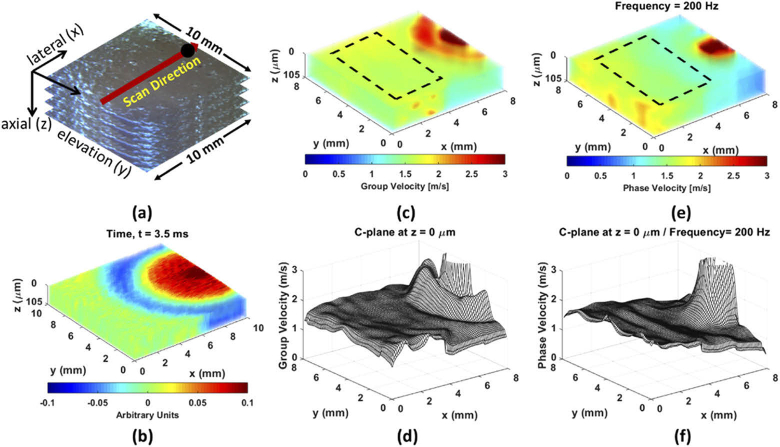
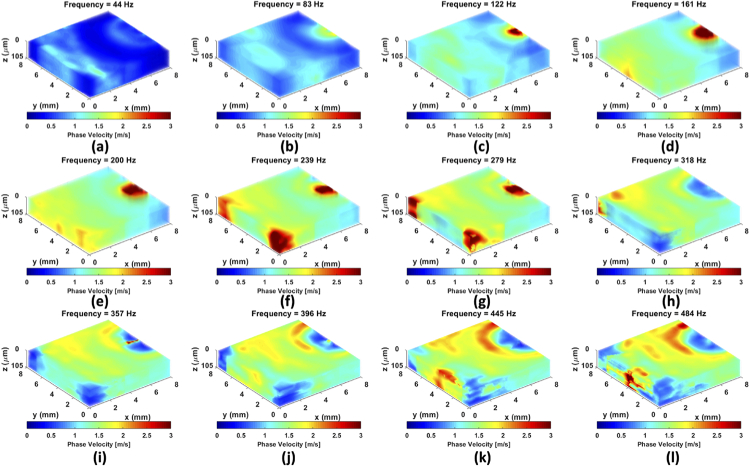
To investigate the mechanical property of biological samples, an ex vivo porcine kidney was evaluated by the proposed 4D-OCE phase velocity. Typically, the renal cortex is used to assess renal tubulointerstitial injury, which often leads to interstitial fibrosis and tubular atrophy [52,53]. The kidney was cut in half to expose the internal structure of the organ. The thickness in z direction of renal cortex is 5 mm. A total of seven layers with 17.5 µm interval were selected to reconstruct the depth as 105 µm. Figure 10(b) and Visualization 15 (30.5MB, avi) displayed the 4D-OCT dynamic wave propagation map in the heterogeneous and anisotropic material, renal cortex. The 3D-OCE group velocity map and 4D-OCE phase velocity map at = 200 Hz were illustrated in Fig. 10(c) and Fig. 10(e), respectively. The 4D-OCE dispersive phase velocity over all frequencies can be referred to Appendix 4 (Fig. 15) for images and Visualization 16 (2.2MB, avi) for the video. The reason for selecting 200 Hz as the example case is because it is close to the center of the energy distribution in k-space. The mesh figures, presenting in Fig. 10(d) and Fig. 10(f), were utilized to indicate the group velocity and phase velocity on the first C-plane (i.e. at z = 0 µm) of Fig. 10(c) and Fig. 10(e) for the statistical analysis. The average value with the standard deviation (SD) on the first C-plane was 1.63 ± 0.018 m/s for group velocity and 1.54 ± 0.101 m/s for phase velocity at = 200 Hz, indicated by ROI in Fig. 10(c) and Fig. 10(e).
Fig. 10.
(a) The camera image of the renal cortex with 5 mm thickness. The black solid dot is the ARF excitation spot. (b) 4D-OCT dynamic wave propagation. (c) The reconstruction of 3D-OCE group velocity. (d) The 3D-OCE group velocity on the first C-plane, indicated by the ROI with the black dash lines in (c). (e) The reconstruction of 4D-OCE phase velocity at = 200 Hz. (f) The 4D-OCE phase velocity on the first C-plane of at = 200 Hz, indicated by the ROI with the black dash lines in (e).
4. Discussion
We evaluated the feasibility of evaluating phase velocity with OCE techniques. This advance provides an opportunity to investigate viscoelasticity of biological tissues in a new way for the OCE field. Data from different phantoms were used to evaluate the use of the LPVI algorithm to reconstruct 3D volume information at various frequencies. We also compared two cases of experimental configurations where the ARF push was located in different media with simulations to further understand the wave propagation in these situations. For abnormal tissues (like carcinoma or diseased liver), the tissue viscoelasticity changes compared to surrounding normal tissues. Due to this change in the mechanical properties, the phase velocities will also change. For example, V. Kumar et al. utilized dispersion curve to differentiate between malignant and benign breast masses [54]. C. T. Barry et al. used shear wave dispersion to separate the fatty livers from the lean rat livers [55]. D. H. Lee et al. used shear wave dispersion slope to evaluate allograft damage after liver transplant [56]. Therefore, this study provides a promising method to observe more detailed changes with abnormal tissues with 4D information.
For the numerical simulation, it should be noted that there is a little disagreement between the simulation and experimental results presenting Fig. 6(d) and Fig. 6(f) after 2.5 mm because the energy dissipates quickly. In the experiments, the ARF cannot be too strong to avoid phase wrap for the autocorrelation processing especially when the excitation is placed in soft materials. Still, we can observe weak energy transmitted to the 8% gelatin in Fig. 6(d) and Visualization 5 (30MB, avi) . In addition, a small discrepancy between using an ideal point source in the simulation and the lateral focal size of the ultrasound transducer could generate a variation at the excitation spot. The size of the focus of the ideal point source in the simulations is 500 µm and 514.84 µm is the lateral focal size of the ultrasound transducer used in the experiments, which is calculated by the equation: [57]. Our numerical simulations distinctly elucidate the boundary behavior of wave propagations with two different excitation locations in the heterogeneous phantom.
Assuming the Poisson’s ratio is nearly 0.50 for biological tissues due to incompressibility, an approximate relation between the Young’s modulus E and shear wave velocity can be expressed by , where ρ is density and C is shear wave velocity [58]. The previous literatures report that the Young’s modulus of renal cortex is from 4.8 kPa to 6.9 kPa [37,59]. Based on the 4D-OCE phase velocity, the Young’s modulus E of renal cortex was approximately 7.1 ± 0.031 kPa assuming the density is 1000 kg/m3, which exhibits high consistency with our previous reports.
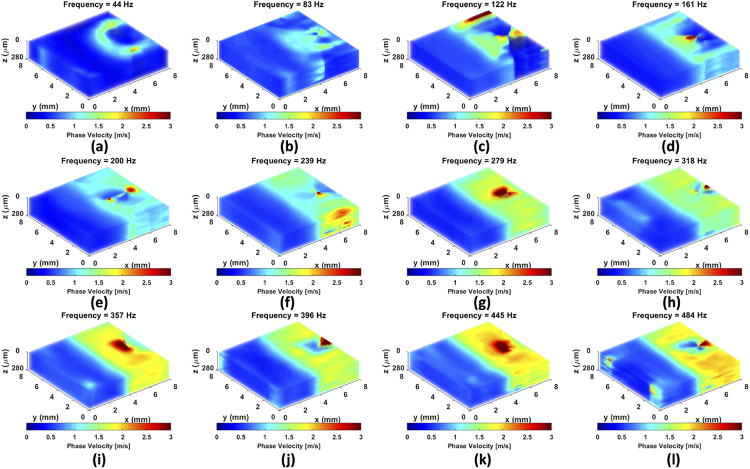
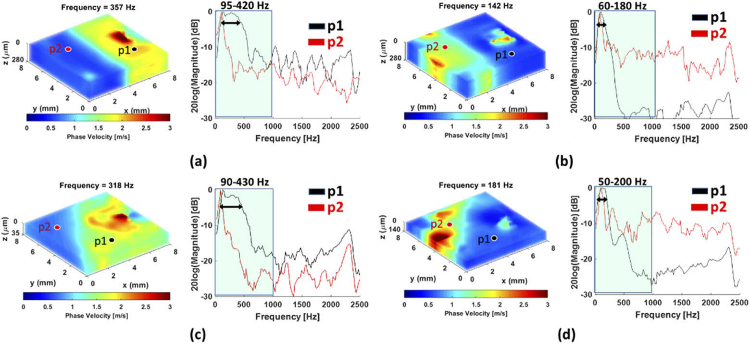
Some key parameters in the 4D-OCE phase velocity estimation should be noted and will produce trade-off situations. First of all, selecting an appropriate suitable or frequency range is important for evaluating 4D-OCE phase velocity due to its spatial heterogeneity. According to Eq. (7), the phase velocities are functions of frequency. Therefore, the can be any frequencies. In this study we evaluated as a frequency vector that starts from 44 Hz to 484 Hz with 40 Hz interval, presented in Appendix 3 and 4. All of these frequencies can be called and their corresponding phase velocities reflect frequency responses of the heterogeneous materials and the kidney tissue. Within the frequency range of , there will be a frequency where the phase velocity is close to the group velocity. This frequency value is the noted in Table 1. Using 1D-FT analysis of temporal recordings of wave motion can provide the energy distribution and where the main energy is located to choose this value of . Appendix 5 (Fig. 16) provides readers an idea how we were looking for the specific frequency from a frequency vector in which phase velocity is close to the group velocity. Based on our previous paper [43], the bandwidth in 2D k-space is determined by the region where the normalized magnitude is above a threshold of 0.3. We used the same method to define the bandwidth in 1D-FT profile in Appendix 5.
In Table 1, for the same 8% gelatin phantom, is slightly different for the standard case A ( = 357 Hz) and inclined case A ( = 318 Hz). One of the potential reasons could come from a near-field effect. In our previous report [38], we have observed that adjusting the distance range of the data, i.e., the distance from the source can cause changes to the dispersion. Wave interference leads to fluctuations in wave amplitude near the focused push beam and is known as the near-field. In Appendix 5, the p1 and p2 were not kept at the same locations. A variation of the small distance between the push source and selecting points could cause the peak frequency to shift. This behavior has been also observed in 2D-FT based methods for phase velocity dispersion curves computation [60]. Furthermore, waves reflecting from the boundaries (vertical boundary versus inclined boundary) in the heterogeneous materials could slightly change the frequency responses of the materials.
The reconstructions are currently computationally expensive, which is associated with the number of C-planes, moving window size and number of angles in the directional filter. In this study, it took approximately two hours to reconstruct the 4D-OCE phase velocity maps using the parameters of 20 pixels × 20 pixels window size, a range of frequencies from 20 Hz to 500 Hz with 20 Hz interval and 20° increments in the directional filter for 5 C-planes. A workstation with multiple core processor and parallel operation can dramatically reduce computational time. Increasing the angular separation in the directional filter and window length in LPVI will speed up the computation but decreases the resolution of the 4D-OCE phase velocity map.
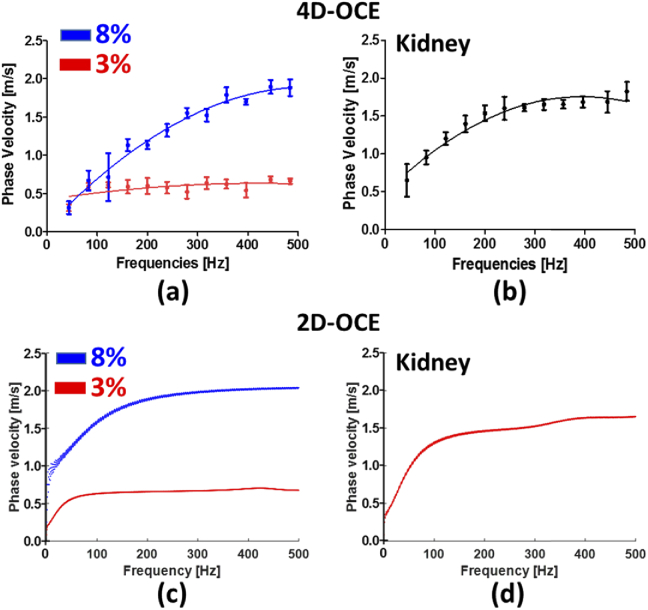
To evaluate the ability to measure phase velocity dispersion, a traditional 2D-OCE dispersion curve in the heterogeneous material with the standard case A and in the kidney tissue was calculated to compare with the 4D-OCE dispersion curves, presented in Fig. 11. The 4D-OCE kidney dataset at the position y = 5.0 mm was used to evaluate the 2D-OCE dispersion curve in the kidney tissue. The correlation coefficient between 4D-OCE and 2D-OCE is presented in Appendix 6 (Fig. 17). Pearson’s correlation coefficient r is 0.9408 for 8% (left), 0.8492 for 3% (middle) and 0.9668 for kidney (right). The 4D-OCE dispersion curves have good accordance with the 2D-OCE results in the heterogeneous material and the kidney tissue except the low frequency (under 200 Hz) in the 8% gelatin, which may be due to the limited travel distance of waves (2.5 mm between the excitation and boundary) in the phantom. Moving the excitation source out of the FOV or switching the OCT lens to one with a larger FOV would improve the ability to improving the measurements in the lower frequency range of 4D-OCE phase velocity in stiff materials.
Fig. 11.
(a) and (b) illustrate the 4D-OCE dispersion curves for the materials used to create the heterogeneous phantom in standard case A and in the kidney tissue, respectively. The error bars represent averaging over the ROIs depicted in Fig. 4(c) and Fig. 10(c) for the phantom and kidney, respectively. (c) The 2D-OCE dispersion curve in the materials for the heterogeneous phantoms for standard case A, and (d) the kidney tissue.
It is important but challenging to choose the placement of the ARF excitation to keep a balance between phase wrap in the autocorrelation processing and energy transmitted from soft to stiff materials. The artifact occupied a certain area in FOV is also a constraint to be removed difficultly due to ARF excitation. Due to different frequency responses in various materials, the systematic exploration of the performance of 4D-OCE phase velocity will need to be pursued for reconstruction in future studies. The various excitation techniques and managed incident energy will be discussed to reduce the artifact effect in future works. The proposed 4D-OCE phase velocity measurement method demonstrates robust performance to evaluate voxel changes of mechanical property of the heterogeneous materials and biological tissues, i.e. renal cortex, and provides information of how tissues respond at different frequencies in a 4D visualization.
5. Conclusion
In the study, we propose a new method to evaluate the 4D-OCE phase velocity including spatial domains x, y, z plus frequency domain f, and applied it to heterogeneous materials and renal tissue. Results from the heterogeneous phantoms and renal tissue show that 4D-OCE phase velocity is capable of accurately reconstructing 4D-OCT wave velocity maps and providing good contrast between two tissue mimicking gelatin regions made with different concentrations, 8% versus 3%. The boundary behavior with the excitation on the different concentrations of the heterogeneous phantom is examined by both numerical simulation and 4D-OCT dynamic wave propagations. The proposed 4D-OCE phase velocity method is capable of providing more information about mechanical properties of biological tissues at various frequencies and could be able to quantify the anisotropic behaviors in the biological materials in future studies.
Acknowledgements
This work was supported in part by the National Institutes of Health (R01 DK092255). The content is solely the responsibility of authors and does not necessarily represent the official views of the National Institute of Diabetes and Digestive and Kidney Diseases or the National Institutes of Health. The authors thank Jennifer L. Poston for administrative assistance.
Appendix 1
Fig. 12.
A comparison of the excitation source in numerical simulation. Fig. (a-c) is for Gaussian spatial profile and Fig. (d-f) is for rectangular spatial profile.
Appendix 2
Fig. 13.
A comparison of the two-dimensional (2D) Fourier transform dispersion analysis. Fig. (a) and (b) are the wave motion images in 3% and 8%, respectively. Fig. (c) and (d) display the k-space of 3% and 8% phantom, respectively. Fig. (e) and (f) show the dispersion curve in 3% and 8%, respectively.
Appendix 3
Fig. 14.
The reconstruction of 4D-OCE phase velocity at various values of ranging from 44 Hz to 484 Hz in standard case A.
Appendix 4
Fig. 15.
The reconstruction of 4D-OCE phase velocity at various values of ranging from 44 Hz to 484 Hz in the kidney tissue.
Appendix 5
Fig. 16.
The 1D-FT of temporal recordings of wave motion analysis show the energy distribution and where the main energy is located in order to make a choice of where the phase velocity is close to the group velocity.
Appendix 6
Fig. 17.
Pearson correlation results between 4D-OCE and 2D-OCE dispersion results for (a) 8% gelatin, (b) 3% gelatin, and (c) the kidney tissue. Pearson correlation coefficients, r, are shown for each case.
Funding
National Institutes of Health10.13039/100000002 (R01 DK092255).
Disclosures
The authors declare that there are no conflicts of interest related to this article.
References
- 1.Guimaraes C. F., Gasperini L., Marques A. P., Reis R. L., “The stiffness of living tissues and its implications for tissue engineering,” Nat. Rev. Mater. 5(5), 351–370 (2020). 10.1038/s41578-019-0169-1 [DOI] [Google Scholar]
- 2.Weaver V. M., “Cell and tissue mechanics: the new cell biology frontier,” Mol. Biol. Cell 28(14), 1815–1818 (2017). 10.1091/mbc.e17-05-0320 [DOI] [PMC free article] [PubMed] [Google Scholar]
- 3.Wang S., Larin K. V., “Optical coherence elastography for tissue characterization: a review,” J. Biophotonics 8, 279–302 (2015). 10.1002/jbio.201400108 [DOI] [PMC free article] [PubMed] [Google Scholar]
- 4.Palmeri M. L., Wang M. H., Dahl J. J., Frinkley K. D., Nightingale K. R., “Quantifying hepatic shear modulus in vivo using acoustic radiation force,” Ultrasound Med. Biol. 34(4), 546–558 (2008). 10.1016/j.ultrasmedbio.2007.10.009 [DOI] [PMC free article] [PubMed] [Google Scholar]
- 5.Chen S. G., Urban M. W., Pislaru C., Kinnick R., Zheng Y., Yao A. P., Greenleaf J. F., “Shearwave Dispersion Ultrasound Vibrometry (SDUV) for Measuring Tissue Elasticity and Viscosity,” IEEE Trans. Ultrason., Ferroelect., Freq. Contr. 56(1), 55–62 (2009). 10.1109/TUFFC.2009.1005 [DOI] [PMC free article] [PubMed] [Google Scholar]
- 6.Sarvazyan A. P., Rudenko O. V., Swanson S. D., Fowlkes J. B., Emelianov S. Y., “Shear wave elasticity imaging: a new ultrasonic technology of medical diagnostics,” Ultrasound Med. Biol. 24(9), 1419–1435 (1998). 10.1016/S0301-5629(98)00110-0 [DOI] [PubMed] [Google Scholar]
- 7.Bercoff J., Tanter M., Fink M., “Supersonic shear imaging: a new technique for soft tissue elasticity mapping,” IEEE Trans. Ultrason., Ferroelect., Freq. Contr. 51(4), 396–409 (2004). 10.1109/TUFFC.2004.1295425 [DOI] [PubMed] [Google Scholar]
- 8.Sarvazyan A., Hall T. J., Urban M. W., Fatemi M., Aglyamov S. R., Garra B. S., “An Overview of Elastography - an Emerging Branch of Medical Imaging,” Curr. Med. Imaging Rev. 7(4), 255–282 (2011). 10.2174/157340511798038684 [DOI] [PMC free article] [PubMed] [Google Scholar]
- 9.Muthupillai R., Lomas D. J., Rossman P. J., Greenleaf J. F., Manduca A., Ehman R. L., “Magnetic resonance elastography by direct visualization of propagating acoustic strain waves,” Science 269(5232), 1854–1857 (1995). 10.1126/science.7569924 [DOI] [PubMed] [Google Scholar]
- 10.Muthupillai R., Ehman R. L., “Magnetic resonance elastography,” Nat. Med. 2(5), 601–603 (1996). 10.1038/nm0596-601 [DOI] [PubMed] [Google Scholar]
- 11.Larin K. V., Sampson D. D., “Optical coherence elastography - OCT at work in tissue biomechanics [Invited],” Biomed. Opt. Express 8(2), 1172–1202 (2017). 10.1364/BOE.8.001172 [DOI] [PMC free article] [PubMed] [Google Scholar]
- 12.Schmitt J., “OCT elastography: imaging microscopic deformation and strain of tissue,” Opt. Express 3(6), 199–211 (1998). 10.1364/OE.3.000199 [DOI] [PubMed] [Google Scholar]
- 13.Razani M., Mariampillai A., Sun C. R., Luk T. W. H., Yang V. X. D., Kolios M. C., “Feasibility of optical coherence elastography measurements of shear wave propagation in homogeneous tissue equivalent phantoms,” Biomed. Opt. Express 3(5), 972–980 (2012). 10.1364/BOE.3.000972 [DOI] [PMC free article] [PubMed] [Google Scholar]
- 14.Li C. H., Guan G. Y., Reif R., Huang Z. H., Wang R. K. K., “Determining elastic properties of skin by measuring surface waves from an impulse mechanical stimulus using phase-sensitive optical coherence tomography,” J. R. Soc. Interface 9(70), 831–841 (2012). 10.1098/rsif.2011.0583 [DOI] [PMC free article] [PubMed] [Google Scholar]
- 15.Li C. H., Guan G. Y., Li S. A., Huang Z. H., Wang R. K., “Evaluating elastic properties of heterogeneous soft tissue by surface acoustic waves detected by phase-sensitive optical coherence tomography,” J. Biomed. Opt. 17(5), 057002 (2012). 10.1117/1.JBO.17.5.057002 [DOI] [PubMed] [Google Scholar]
- 16.Liang X., Adie S. G., John R., Boppart S. A., “Dynamic spectral-domain optical coherence elastography for tissue characterization,” Opt. Express 18(13), 14183–14190 (2010). 10.1364/OE.18.014183 [DOI] [PMC free article] [PubMed] [Google Scholar]
- 17.Li C. H., Guan G. Y., Ling Y. T., Hsu Y. T., Song S. Z., Huang J. T. J., Lang S., Wang R. K. K., Huang Z. H., Nabi G., “Detection and characterisation of biopsy tissue using quantitative optical coherence elastography (OCE) in men with suspected prostate cancer,” Cancer Lett. 357(1), 121–128 (2015). 10.1016/j.canlet.2014.11.021 [DOI] [PubMed] [Google Scholar]
- 18.Razani M., Luk T. W., Mariampillai A., Siegler P., Kiehl T. R., Kolios M. C., Yang V. X., “Optical coherence tomography detection of shear wave propagation in inhomogeneous tissue equivalent phantoms and ex-vivo carotid artery samples,” Biomed. Opt. Express 5(3), 895–906 (2014). 10.1364/BOE.5.000895 [DOI] [PMC free article] [PubMed] [Google Scholar]
- 19.Ambrozinski L., Song S. Z., Yoon S. J., Pelivanov I., Li D., Gao L., Shen T. T., Wang R. K. K., O’Donnell M., “Acoustic micro-tapping for non-contact 4D imaging of tissue elasticity,” Sci. Rep. 6(1), 38967 (2016). 10.1038/srep38967 [DOI] [PMC free article] [PubMed] [Google Scholar]
- 20.Manapuram R. K., Baranov S. A., Manne V. G. R., Sudheendran N., Mashiatulla M., Aglyamov S., Emelianov S., Larin K. V., “Assessment of wave propagation on surfaces of crystalline lens with phase sensitive optical coherence tomography,” Laser Phys. Lett. 8(2), 164–168 (2011). 10.1002/lapl.201010102 [DOI] [Google Scholar]
- 21.Han Z. L., Aglyamov S. R., Li J. S., Singh M., Wang S., Vantipalli S., Wu C., Liu C. H., Twa M. D., Larin K. V., “Quantitative assessment of corneal viscoelasticity using optical coherence elastography and a modified Rayleigh-Lamb equation,” J. Biomed. Opt. 20(2), 020501 (2015). 10.1117/1.JBO.20.2.020501 [DOI] [PMC free article] [PubMed] [Google Scholar]
- 22.Han Z. L., Li J. S., Singh M., Wu C., Liu C. H., Raghunathan R., Aglyamov S. R., Vantipalli S., Twa M. D., Larin K. V., “Optical coherence elastography assessment of corneal viscoelasticity with a modified Rayleigh-Lamb wave model,” J. Mech. Behav. Biomed. 66, 87–94 (2017). 10.1016/j.jmbbm.2016.11.004 [DOI] [PMC free article] [PubMed] [Google Scholar]
- 23.Wang S., Larin K. V., “Shear wave imaging optical coherence tomography (SWI-OCT) for ocular tissue biomechanics,” Opt. Lett. 39(1), 41–44 (2014). 10.1364/OL.39.000041 [DOI] [PMC free article] [PubMed] [Google Scholar]
- 24.Song S., Le N. M., Huang Z., Shen T., Wang R. K., “Quantitative shear-wave optical coherence elastography with a programmable phased array ultrasound as the wave source,” Opt. Lett. 40(21), 5007–5010 (2015). 10.1364/OL.40.005007 [DOI] [PubMed] [Google Scholar]
- 25.Zvietcovich F., Pongchalee P., Meemon P., Rolland J. P., Parker K. J., “Reverberant 3D optical coherence elastography maps the elasticity of individual corneal layers,” Nat. Commun. 10(1), 4895 (2019). 10.1038/s41467-019-12803-4 [DOI] [PMC free article] [PubMed] [Google Scholar]
- 26.Kennedy B. F., Liang X., Adie S. G., Gerstmann D. K., Quirk B. C., Boppart S. A., Sampson D. D., “In vivo three-dimensional optical coherence elastography,” Opt. Express 19(7), 6623–6634 (2011). 10.1364/OE.19.006623 [DOI] [PMC free article] [PubMed] [Google Scholar]
- 27.Nahas A., Bauer M., Roux S., Boccara A. C., “3D static elastography at the micrometer scale using Full Field OCT,” Biomed. Opt. Express 4(10), 2138–2149 (2013). 10.1364/BOE.4.002138 [DOI] [PMC free article] [PubMed] [Google Scholar]
- 28.Scholler J., Mazlin V., Thouvenin O., Groux K., Xiao P., Sahel J. A., Fink M., Boccara C., Grieve K., “Probing dynamic processes in the eye at multiple spatial and temporal scales with multimodal full field OCT,” Biomed. Opt. Express 10(2), 731–746 (2019). 10.1364/BOE.10.000731 [DOI] [PMC free article] [PubMed] [Google Scholar]
- 29.Stremplewski P., Auksorius E., Wnuk P., Kozon L., Garstecki P., Wojtkowski M., “In vivo volumetric imaging by crosstalk-free full-field OCT,” Optica 6(5), 608–617 (2019). 10.1364/OPTICA.6.000608 [DOI] [Google Scholar]
- 30.Karpiouk A. B., VanderLaan D. J., Larin K. V., Emelianov S. Y., “Integrated optical coherence tomography and multielement ultrasound transducer probe for shear wave elasticity imaging of moving tissues,” J. Biomed. Opt. 23(10), 1–7 (2018). 10.1117/1.JBO.23.10.105006 [DOI] [PMC free article] [PubMed] [Google Scholar]
- 31.Nguyen T. M., Arnal B., Song S., Huang Z., Wang R. K., O’Donnell M., “Shear wave elastography using amplitude-modulated acoustic radiation force and phase-sensitive optical coherence tomography,” J. Biomed. Opt. 20(1), 016001 (2015). 10.1117/1.JBO.20.1.016001 [DOI] [PMC free article] [PubMed] [Google Scholar]
- 32.Nguyen T. M., Song S., Arnal B., Wong E. Y., Huang Z., Wang R. K., O’Donnell M., “Shear wave pulse compression for dynamic elastography using phase-sensitive optical coherence tomography,” J. Biomed. Opt. 19(1), 016013 (2014). 10.1117/1.JBO.19.1.016013 [DOI] [PMC free article] [PubMed] [Google Scholar]
- 33.Nguyen T. M., Song S., Arnal B., Huang Z., O’Donnell M., Wang R. K., “Visualizing ultrasonically induced shear wave propagation using phase-sensitive optical coherence tomography for dynamic elastography,” Opt. Lett. 39(4), 838–841 (2014). 10.1364/OL.39.000838 [DOI] [PMC free article] [PubMed] [Google Scholar]
- 34.Nahas A., Tanter M., Nguyen T. M., Chassot J. M., Fink M., Claude Boccara A., “From supersonic shear wave imaging to full-field optical coherence shear wave elastography,” J. Biomed. Opt. 18(12), 121514 (2013). 10.1117/1.JBO.18.12.121514 [DOI] [PubMed] [Google Scholar]
- 35.Kijanka P., Urban M. W., “Local Phase Velocity Based Imaging: A New Technique Used for Ultrasound Shear Wave Elastography,” IEEE Trans. Med. Imaging 38(4), 894–908 (2019). 10.1109/TMI.2018.2874545 [DOI] [PMC free article] [PubMed] [Google Scholar]
- 36.Kijanka P., Urban M. W., “Fast Local Phase Velocity-Based Imaging: Shear Wave Particle Velocity and Displacement Motion Study,” IEEE Trans. Ultrason., Ferroelect., Freq. Contr. 67(3), 526–537 (2020). 10.1109/TUFFC.2019.2948512 [DOI] [PMC free article] [PubMed] [Google Scholar]
- 37.Amador C., Urban M. W., Chen S. G., Greenleaf J. F., “Shearwave Dispersion Ultrasound Vibrometry (SDUV) on Swine Kidney,” IEEE Trans. Ultrason., Ferroelect., Freq. Contr. 58(12), 2608–2619 (2011). 10.1109/TUFFC.2011.2124 [DOI] [PMC free article] [PubMed] [Google Scholar]
- 38.Kijanka P., Qiang B., Song P., Amador Carrascal C., Chen S., Urban M. W., “Robust Phase Velocity Dispersion Estimation of Viscoelastic Materials Used for Medical Applications Based on the Multiple Signal Classification Method,” IEEE Trans. Ultrason., Ferroelect., Freq. Contr. 65(3), 423–439 (2018). 10.1109/TUFFC.2018.2792324 [DOI] [PMC free article] [PubMed] [Google Scholar]
- 39.Gladden J. R., Gamble A. M., Skelton C. E., Mobley J., “Shear waves in viscoelastic wormlike micellar fluids over a broad concentration range,” J. Acoust. Soc. Am. 131(3), 2063–2067 (2012). 10.1121/1.3683538 [DOI] [PubMed] [Google Scholar]
- 40.Shikata T., Hirata H., Kotaka T., “Micelle Formation of Detergent Molecules in Aqueous-Media .2. Role of Free Salicylate Ions on Viscoelastic Properties of Aqueous Cetyltrimethylammonium Bromide Sodium-Salicylate Solutions,” Langmuir 4(2), 354–359 (1988). 10.1021/la00080a019 [DOI] [Google Scholar]
- 41.Liu H. C., Kijanka P., Urban M. W., “Acoustic radiation force optical coherence elastography for evaluating mechanical properties of soft condensed matters and its biological applications,” J. Biophotonics 13, e201960134 (2020). 10.1002/jbio.201960134 [DOI] [PMC free article] [PubMed] [Google Scholar]
- 42.Lee J., Teh S. Y., Lee A., Kim H. H., Lee C., Shung K. K., “Transverse Acoustic Trapping Using a Gaussian Focused Ultrasound,” Ultrasound Med. Biol. 36(2), 350–355 (2010). 10.1016/j.ultrasmedbio.2009.10.005 [DOI] [PMC free article] [PubMed] [Google Scholar]
- 43.Liu H.-C., Kijanka P., Urban M. W., “Optical coherence tomography for evaluating capillary waves in blood and plasma,” Biomed. Opt. Express 11(2), 1092–1106 (2020). 10.1364/BOE.382819 [DOI] [PMC free article] [PubMed] [Google Scholar]
- 44.Pelivanov I., Gao L., Pitre J., Kirby M. A., Song S. Z., Li D., Shen T. T., Wang R. K., O’Donnell M., “Does group velocity always reflect elastic modulus in shear wave elastography?” J. Biomed. Opt. 24(7), 1–11 (2019). 10.1117/1.JBO.24.7.076003 [DOI] [PMC free article] [PubMed] [Google Scholar]
- 45.Kirby M. A., Pelivanov I., Song S., Ambrozinski L., Yoon S. J., Gao L., Li D., Shen T. T., Wang R. K., O’Donnell M., “Optical coherence elastography in ophthalmology,” J. Biomed. Opt. 22(12), 1–28 (2017). 10.1117/1.JBO.22.12.121720 [DOI] [PMC free article] [PubMed] [Google Scholar]
- 46.Kasai C., “Real-Time Two-Dimensional Blood-Flow Imaging Using an Autocorrelation Technique,” IEEE Trans. Son. Ultrason. 32(3), 458–464 (1985). 10.1109/T-SU.1985.31615 [DOI] [Google Scholar]
- 47.Kijanka P., Urban M. W., “Local Phase Velocity Based Imaging (LPVI) of Viscoelastic Phantoms and Tissues,” IEEE Trans Ultrason Ferroelectr Freq Control (2020). [DOI] [PMC free article] [PubMed]
- 48.Manduca A., Lake D. S., Kruse S. A., Ehman R. L., “Spatio-temporal directional filtering for improved inversion of MR elastography images,” Med. Image Anal. 7(4), 465–473 (2003). 10.1016/S1361-8415(03)00038-0 [DOI] [PubMed] [Google Scholar]
- 49.Song P. F., Manduca A., Zhao H., Urban M. W., Greenleaf J. F., Chen S. G., “Fast Shear Compounding Using Robust 2-D Shear Wave Speed Calculation and Multi-Directional Filtering,” Ultrasound Med. Biol. 40(6), 1343–1355 (2014). 10.1016/j.ultrasmedbio.2013.12.026 [DOI] [PMC free article] [PubMed] [Google Scholar]
- 50.Song P. F., Urban M. W., Manduca A., Zhao H., Greenleaf J. F., Chen S. G., “Comb-Push Ultrasound Shear Elastography (CUSE) With Various Ultrasound Push Beams,” IEEE Trans. Med. Imaging 32(8), 1435–1447 (2013). 10.1109/TMI.2013.2257831 [DOI] [PMC free article] [PubMed] [Google Scholar]
- 51.Song P. F., Zhao H., Manduca A., Urban M. W., Greenleaf J. F., Chen S. G., “Comb-Push Ultrasound Shear Elastography (CUSE): A Novel Method for Two-Dimensional Shear Elasticity Imaging of Soft Tissues,” IEEE Trans. Med. Imaging 31(9), 1821–1832 (2012). 10.1109/TMI.2012.2205586 [DOI] [PMC free article] [PubMed] [Google Scholar]
- 52.Hodgkins K. S., Schnaper H. W., “Tubulointerstitial injury and the progression of chronic kidney disease,” Pediatr. Nephrol. 27(6), 901–909 (2012). 10.1007/s00467-011-1992-9 [DOI] [PMC free article] [PubMed] [Google Scholar]
- 53.Farris A. B., Ellis C. L., Rogers T. E., Lawson D., Cohen C., Rosen S., “Renal Medullary and Cortical Correlates in Fibrosis, Epithelial Mass, Microvascularity, and Microanatomy Using Whole Slide Image Analysis Morphometry,” PLoS One 11(8), e0161019 (2016). 10.1371/journal.pone.0161019 [DOI] [PMC free article] [PubMed] [Google Scholar]
- 54.Kumar V., Denis M., Gregory A., Bayat M., Mehrmohammadi M., Fazzio R., Fatemi M., Alizad A., “Viscoelastic parameters as discriminators of breast masses: Initial human study results,” PLoS One 13(10), e0205717 (2018). 10.1371/journal.pone.0205717 [DOI] [PMC free article] [PubMed] [Google Scholar]
- 55.Barry C. T., Hazard C., Hah Z., Cheng G., Partin A., Mooney R. A., Chuang K. H., Cao W., Rubens D. J., Parker K. J., “Shear wave dispersion in lean versus steatotic rat livers,” J. Ultrasound Med. 34(6), 1123–1129 (2015). 10.7863/ultra.34.6.1123 [DOI] [PubMed] [Google Scholar]
- 56.Lee D. H., Lee J. Y., Bae J. S., Yi N. J., Lee K. W., Suh K. S., Kim H., Lee K. B., Han J. K., “Shear-Wave Dispersion Slope from US Shear-Wave Elastography: Detection of Allograft Damage after Liver Transplantation,” Radiology 293(2), 327–333 (2019). 10.1148/radiol.2019190064 [DOI] [PubMed] [Google Scholar]
- 57.Shung K. K., Diagnostic Ultrasound : Imaging and Blood Flow Measurements (Springer, 2015). [Google Scholar]
- 58.Zhu J., He X., Chen Z., “Acoustic radiation force optical coherence elastography for elasticity assessment of soft tissues,” Appl. Spectrosc. Rev. 54(6), 457–481 (2019). 10.1080/05704928.2018.1467436 [DOI] [PMC free article] [PubMed] [Google Scholar]
- 59.Urban M. W., Chen S., Fatemi M., “A Review of Shearwave Dispersion Ultrasound Vibrometry (SDUV) and its Applications,” Curr. Med. Imaging Rev. 8(1), 27–36 (2012). 10.2174/157340512799220625 [DOI] [PMC free article] [PubMed] [Google Scholar]
- 60.Rouze N. C., Deng Y., Palmeri M. L., Nightingale K. R., “Accounting for the Spatial Observation Window in the 2-D Fourier Transform Analysis of Shear Wave Attenuation,” Ultrasound Med. Biol. 43(10), 2500–2506 (2017). 10.1016/j.ultrasmedbio.2017.06.006 [DOI] [PMC free article] [PubMed] [Google Scholar]


